Optimization Approach for Improving Energy Efficiency and Evaluation of Greenhouse Gas Emission of Wheat Crop using Data Envelopment Analysis

 ,
,
Abstract
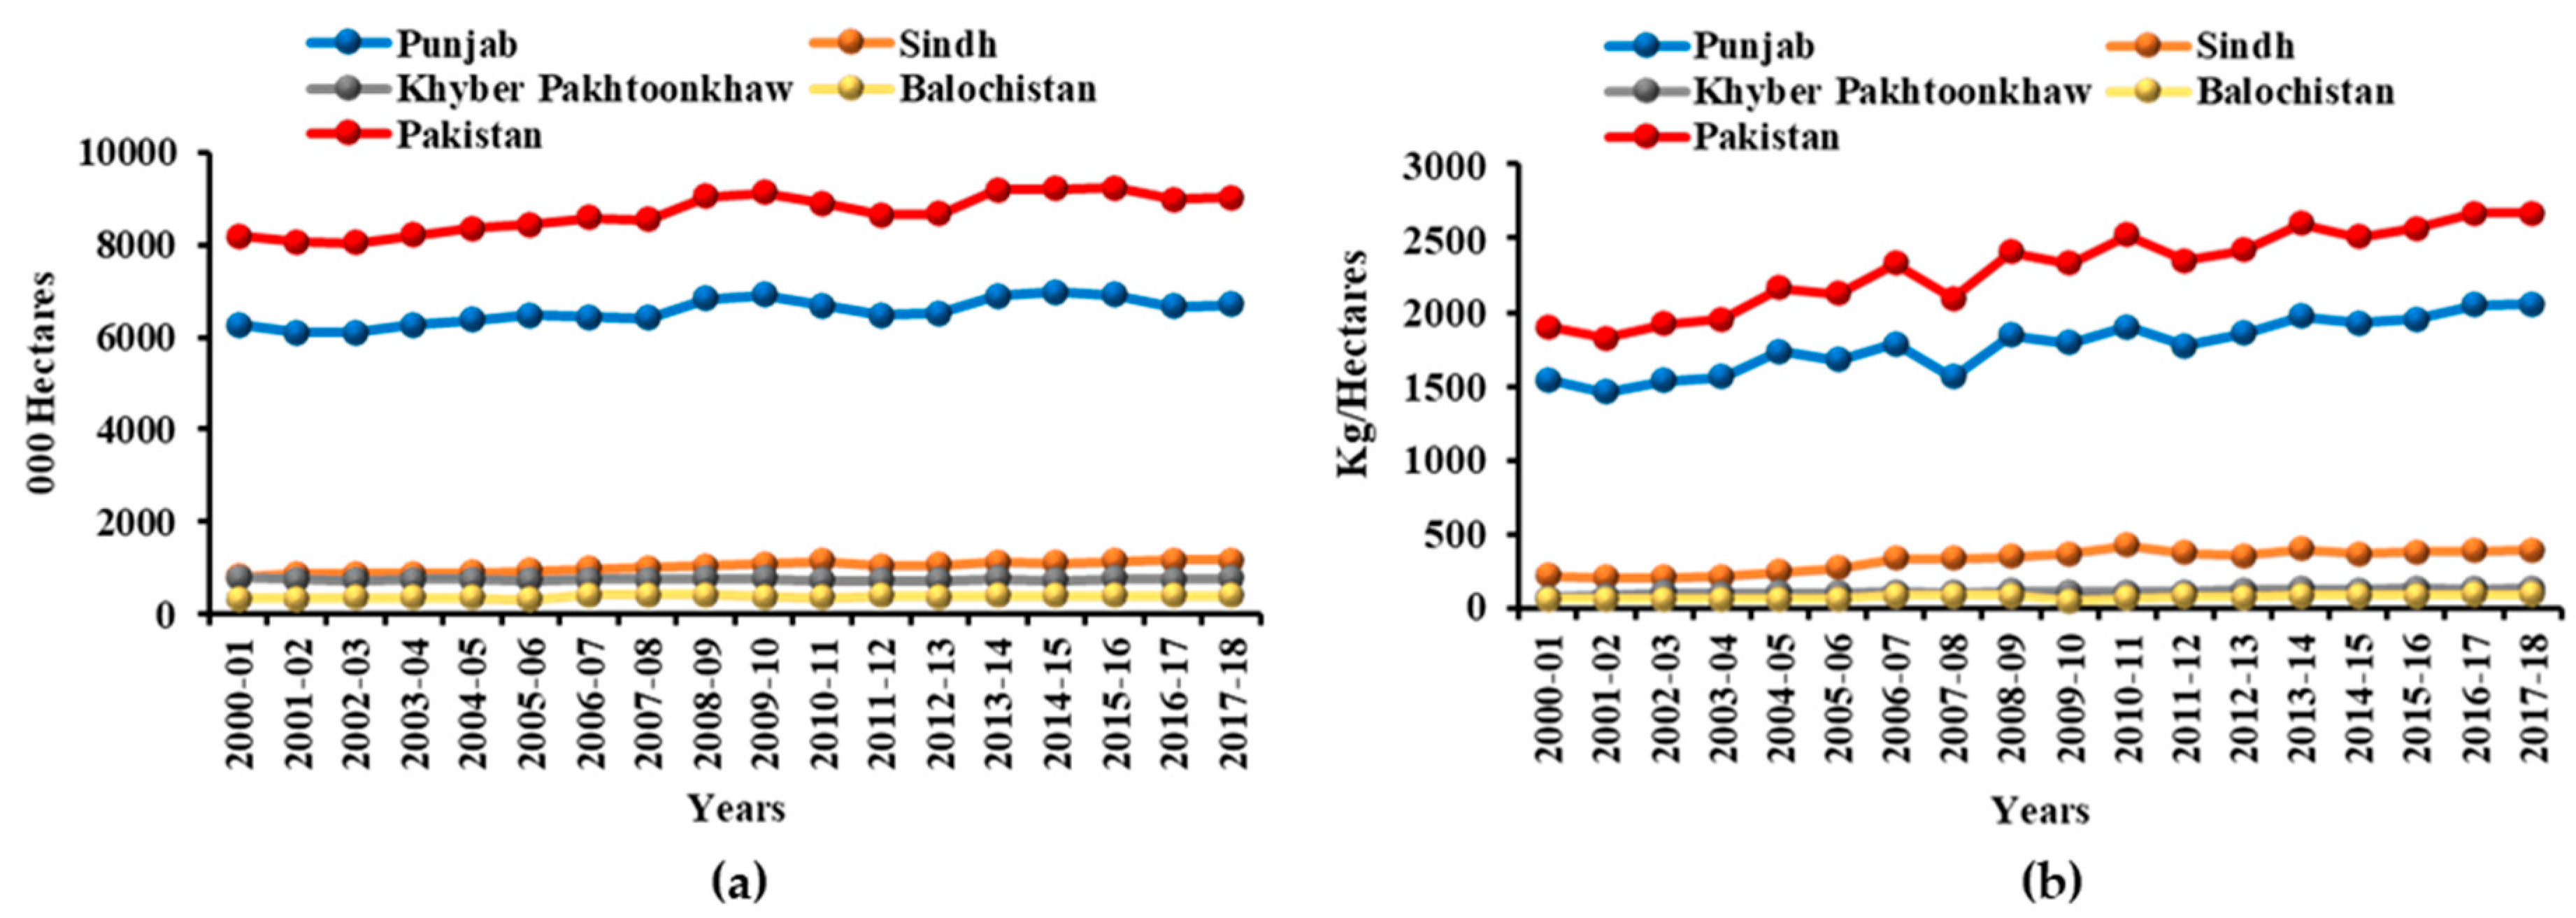
:1. Introduction
2. Materials and Methods
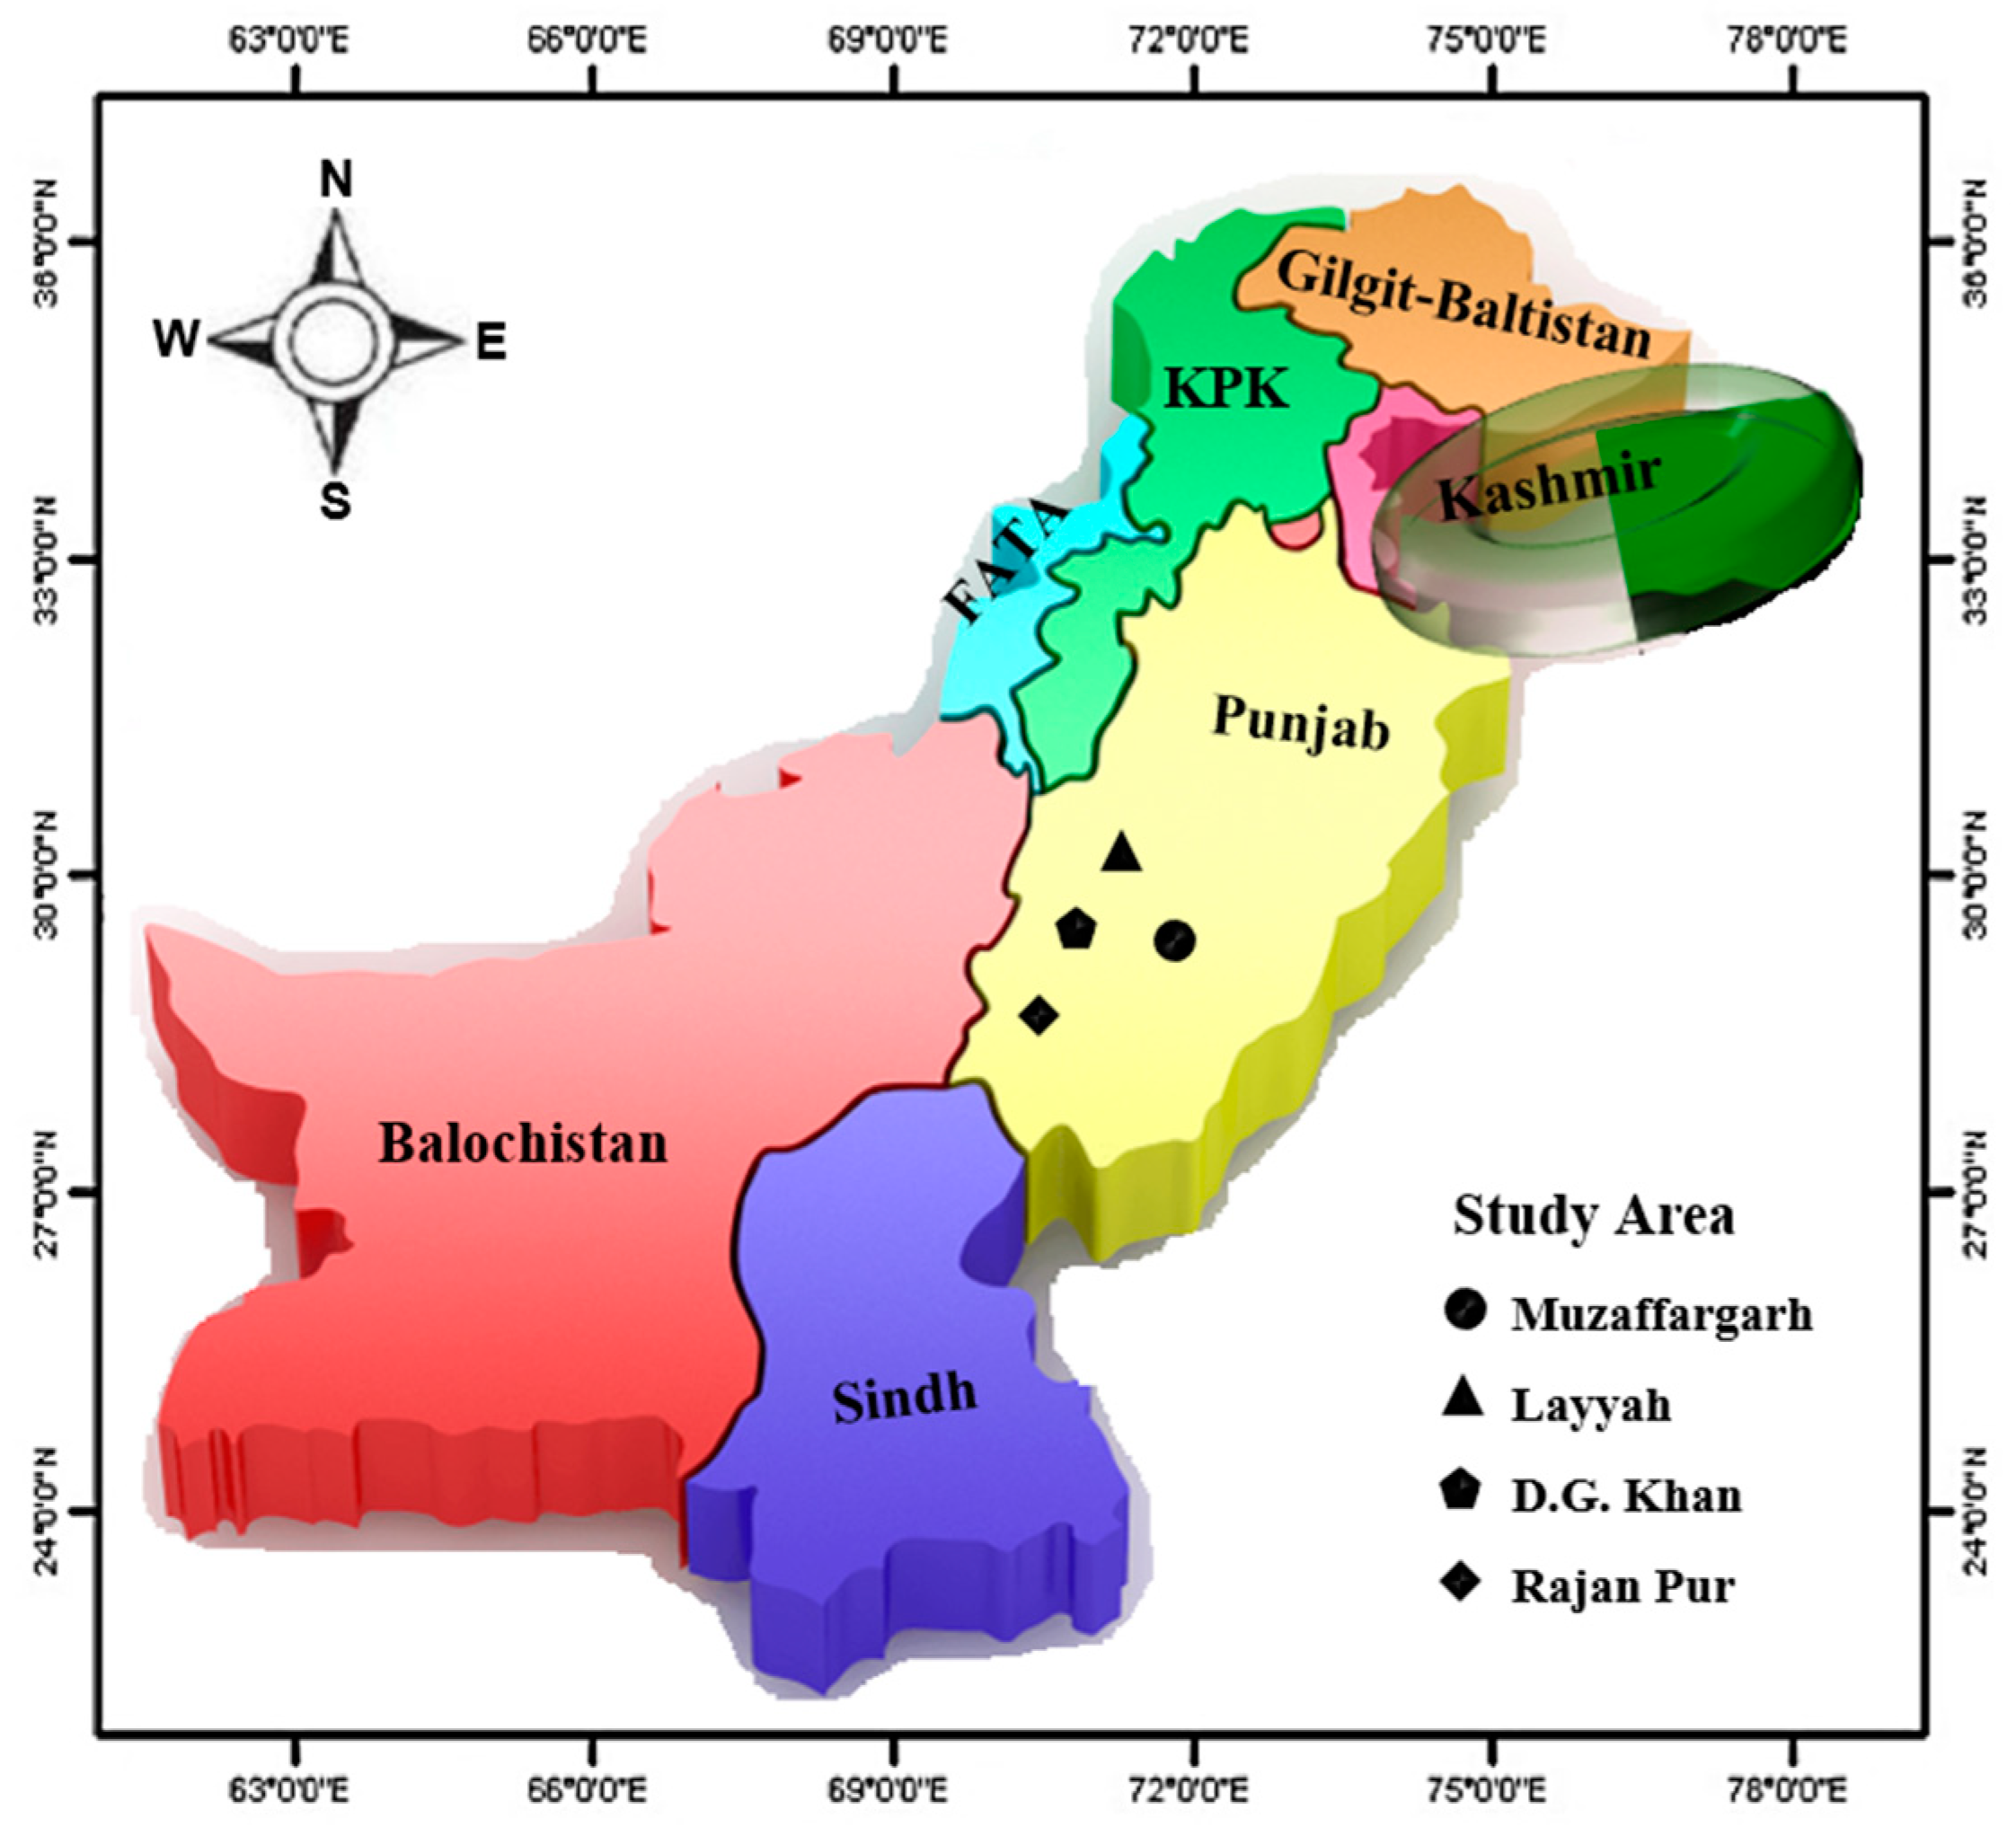
2.1. Sample and Data Acquisition
- n = Number of samples
- N = Cumulative number of Decision Making Units (DMUs) of the specific area
- e = Error margin, represented in terms of ± 10% (0.10)
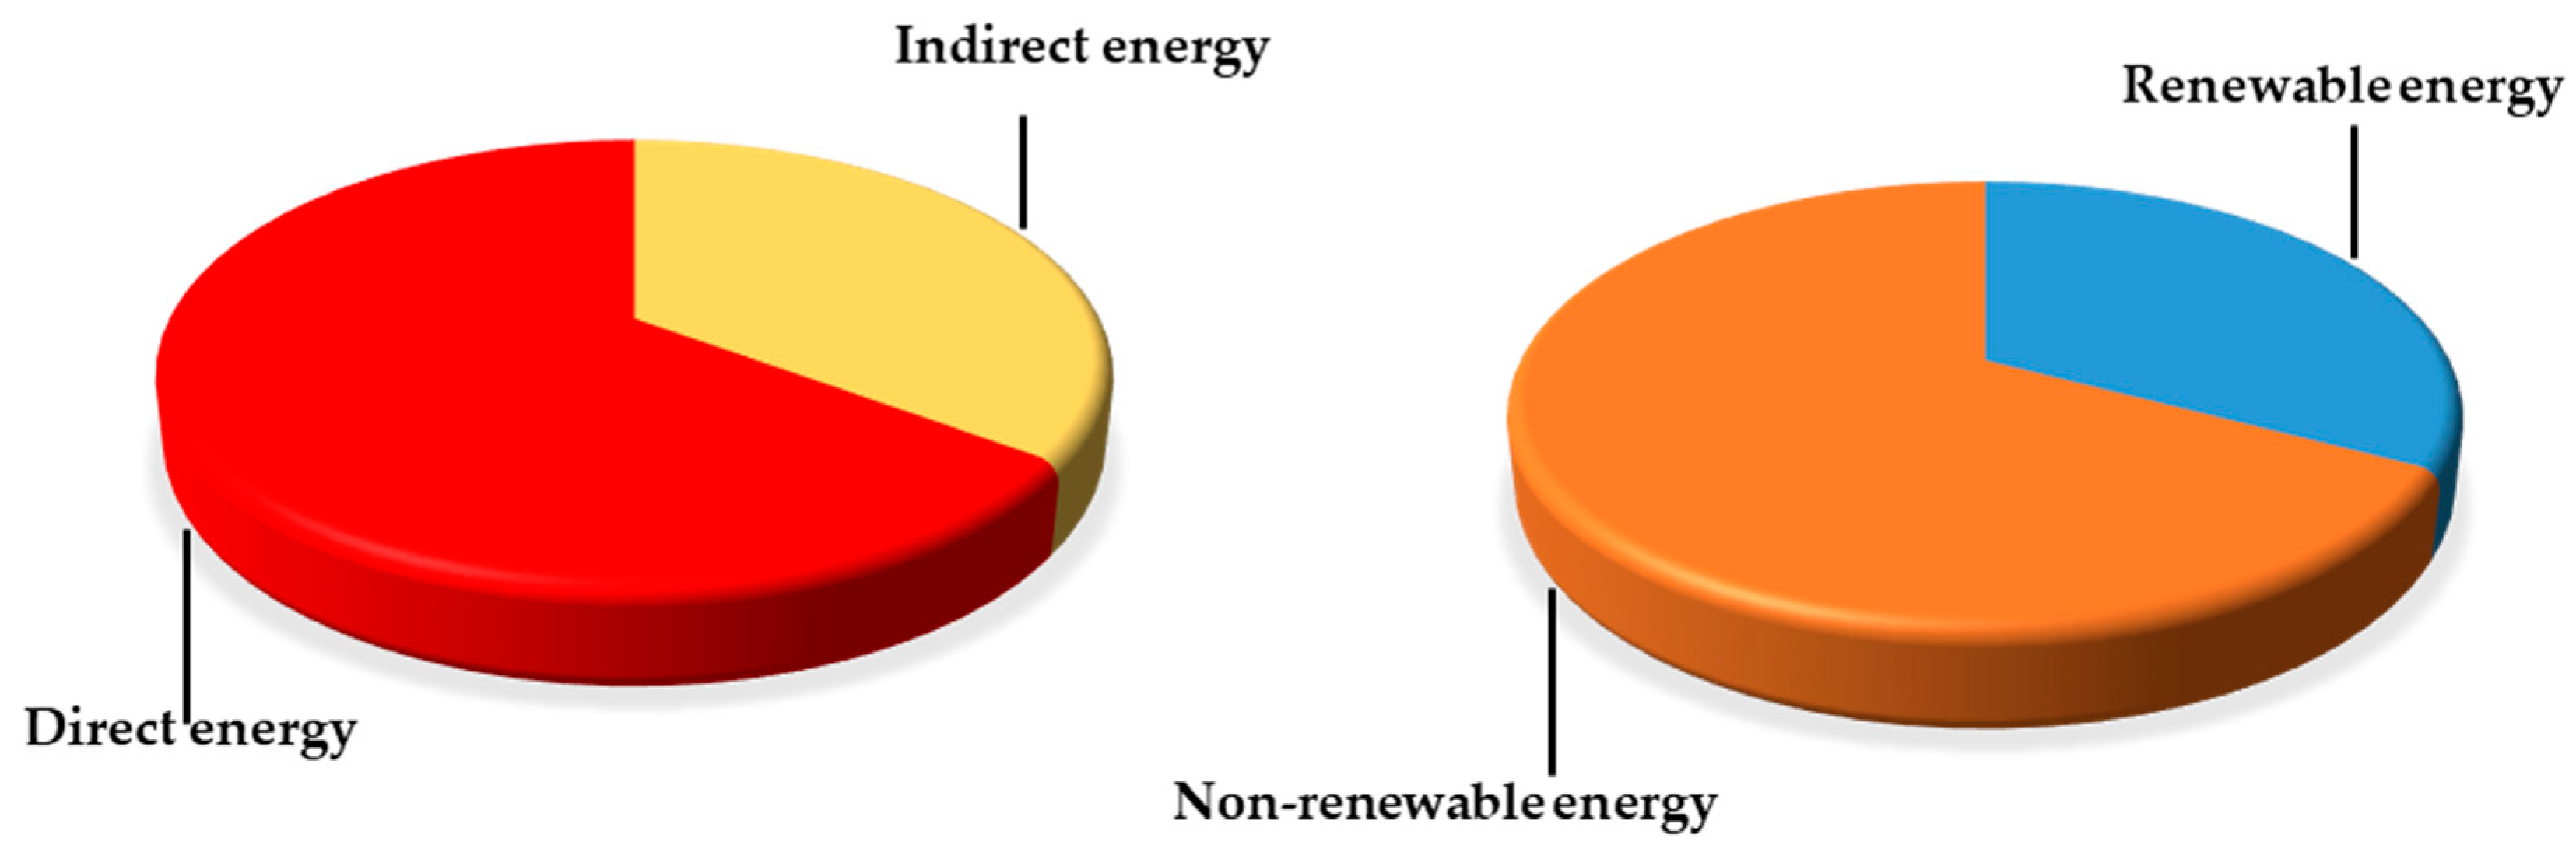
2.2. Energy Analysis

| Input-Output (Unit) | Energy Equivalent (MJ Per Unit) | References | |
|---|---|---|---|
| 1. Inputs | |||
| 1. Labor (h) | |||
| Male | 1.96 | [43] | |
| 2. Seed (kg) | 13 | [43] | |
| 3. Fertilizer (kg) | |||
| Nitrogen (N) | 78.1 | [44] | |
| Phosphate (P2O5) | 17.4 | [44] | |
| 4. Chemical | |||
| Weedicide (kg) | 238 | [44] | |
| 5. Machinery (kg) | |||
| Tractor | 138 | [44] | |
| Plow | 180 | [44] | |
| Rotary | 148 | [44] | |
| Thrashing (h) | 62.7 | [44] | |
| 6. Water (m3 ha−1) | 1.02 | [43] | |
| 7. Diesel (L) | 47.8 | [44] | |
| 8. Electricity (kWh) | 11.93 | [44] | |
| 2. Outputs (kg) | |||
| Wheat yield | 13 | [43] | |
2.3. Data Envelopment Analysis
2.4. Estimation of GHG Emission
3. Results and Discussion
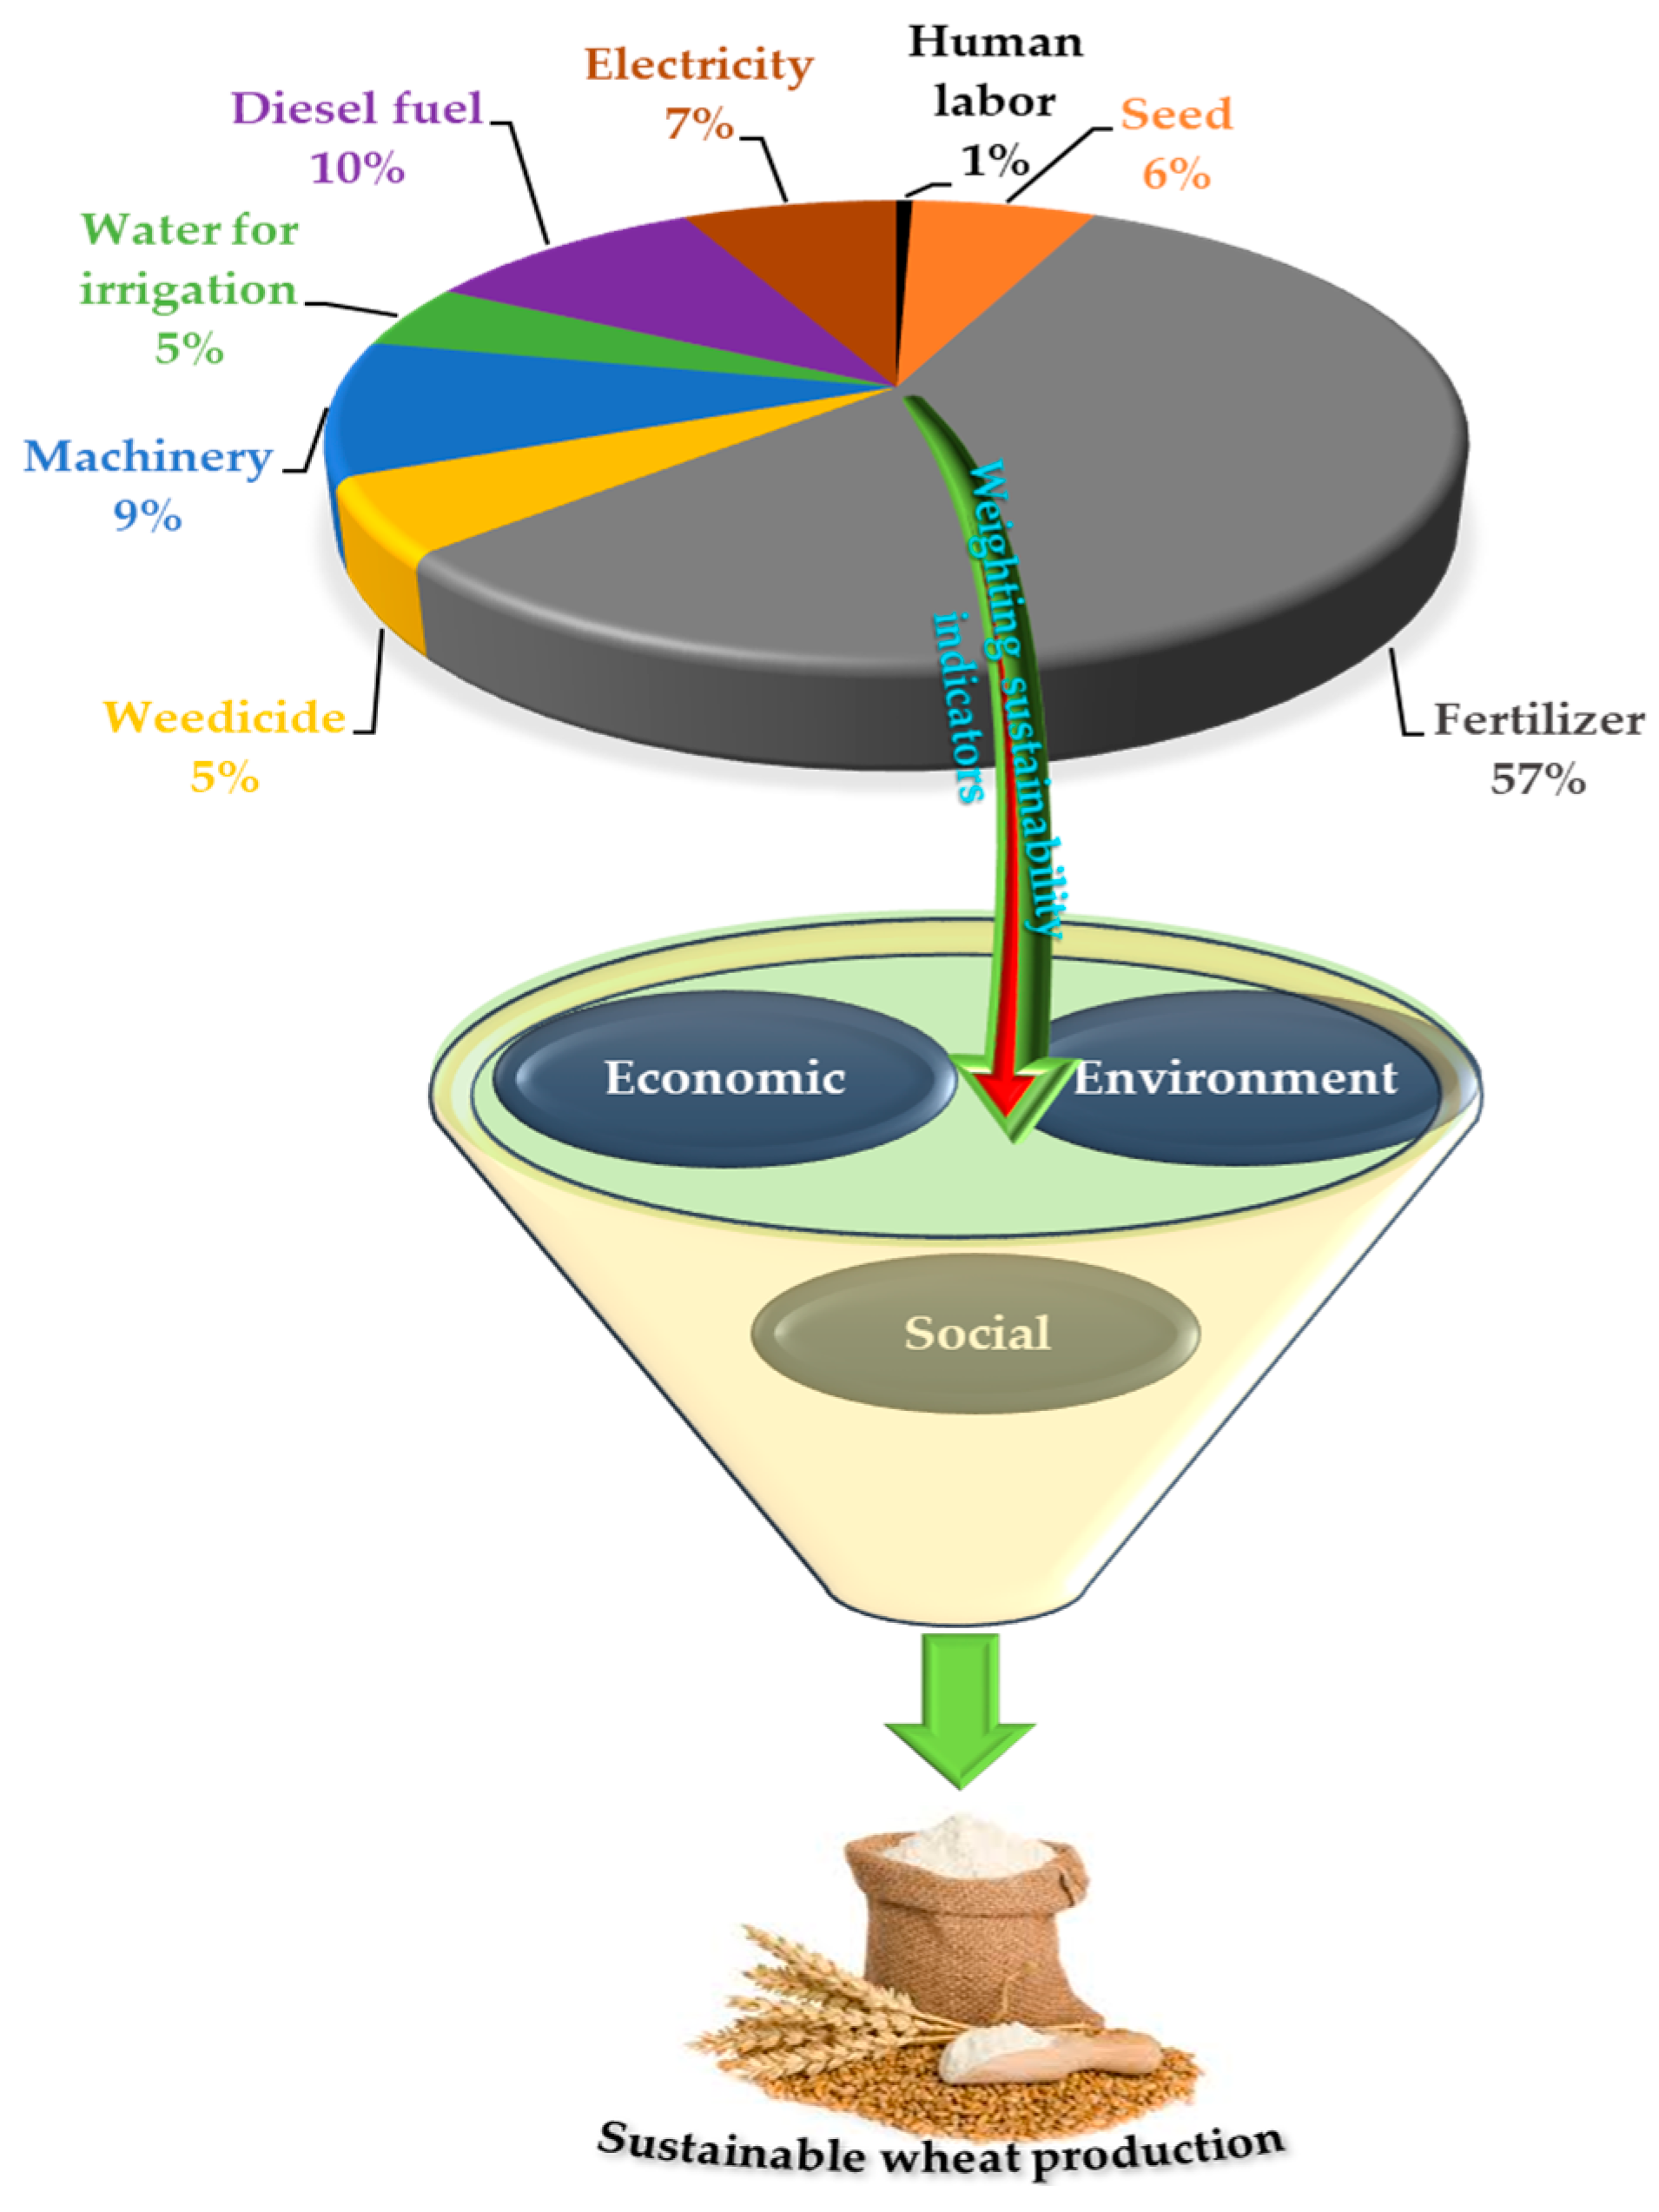
3.1. Input-Output Analysis of Energy Uses in Wheat Production
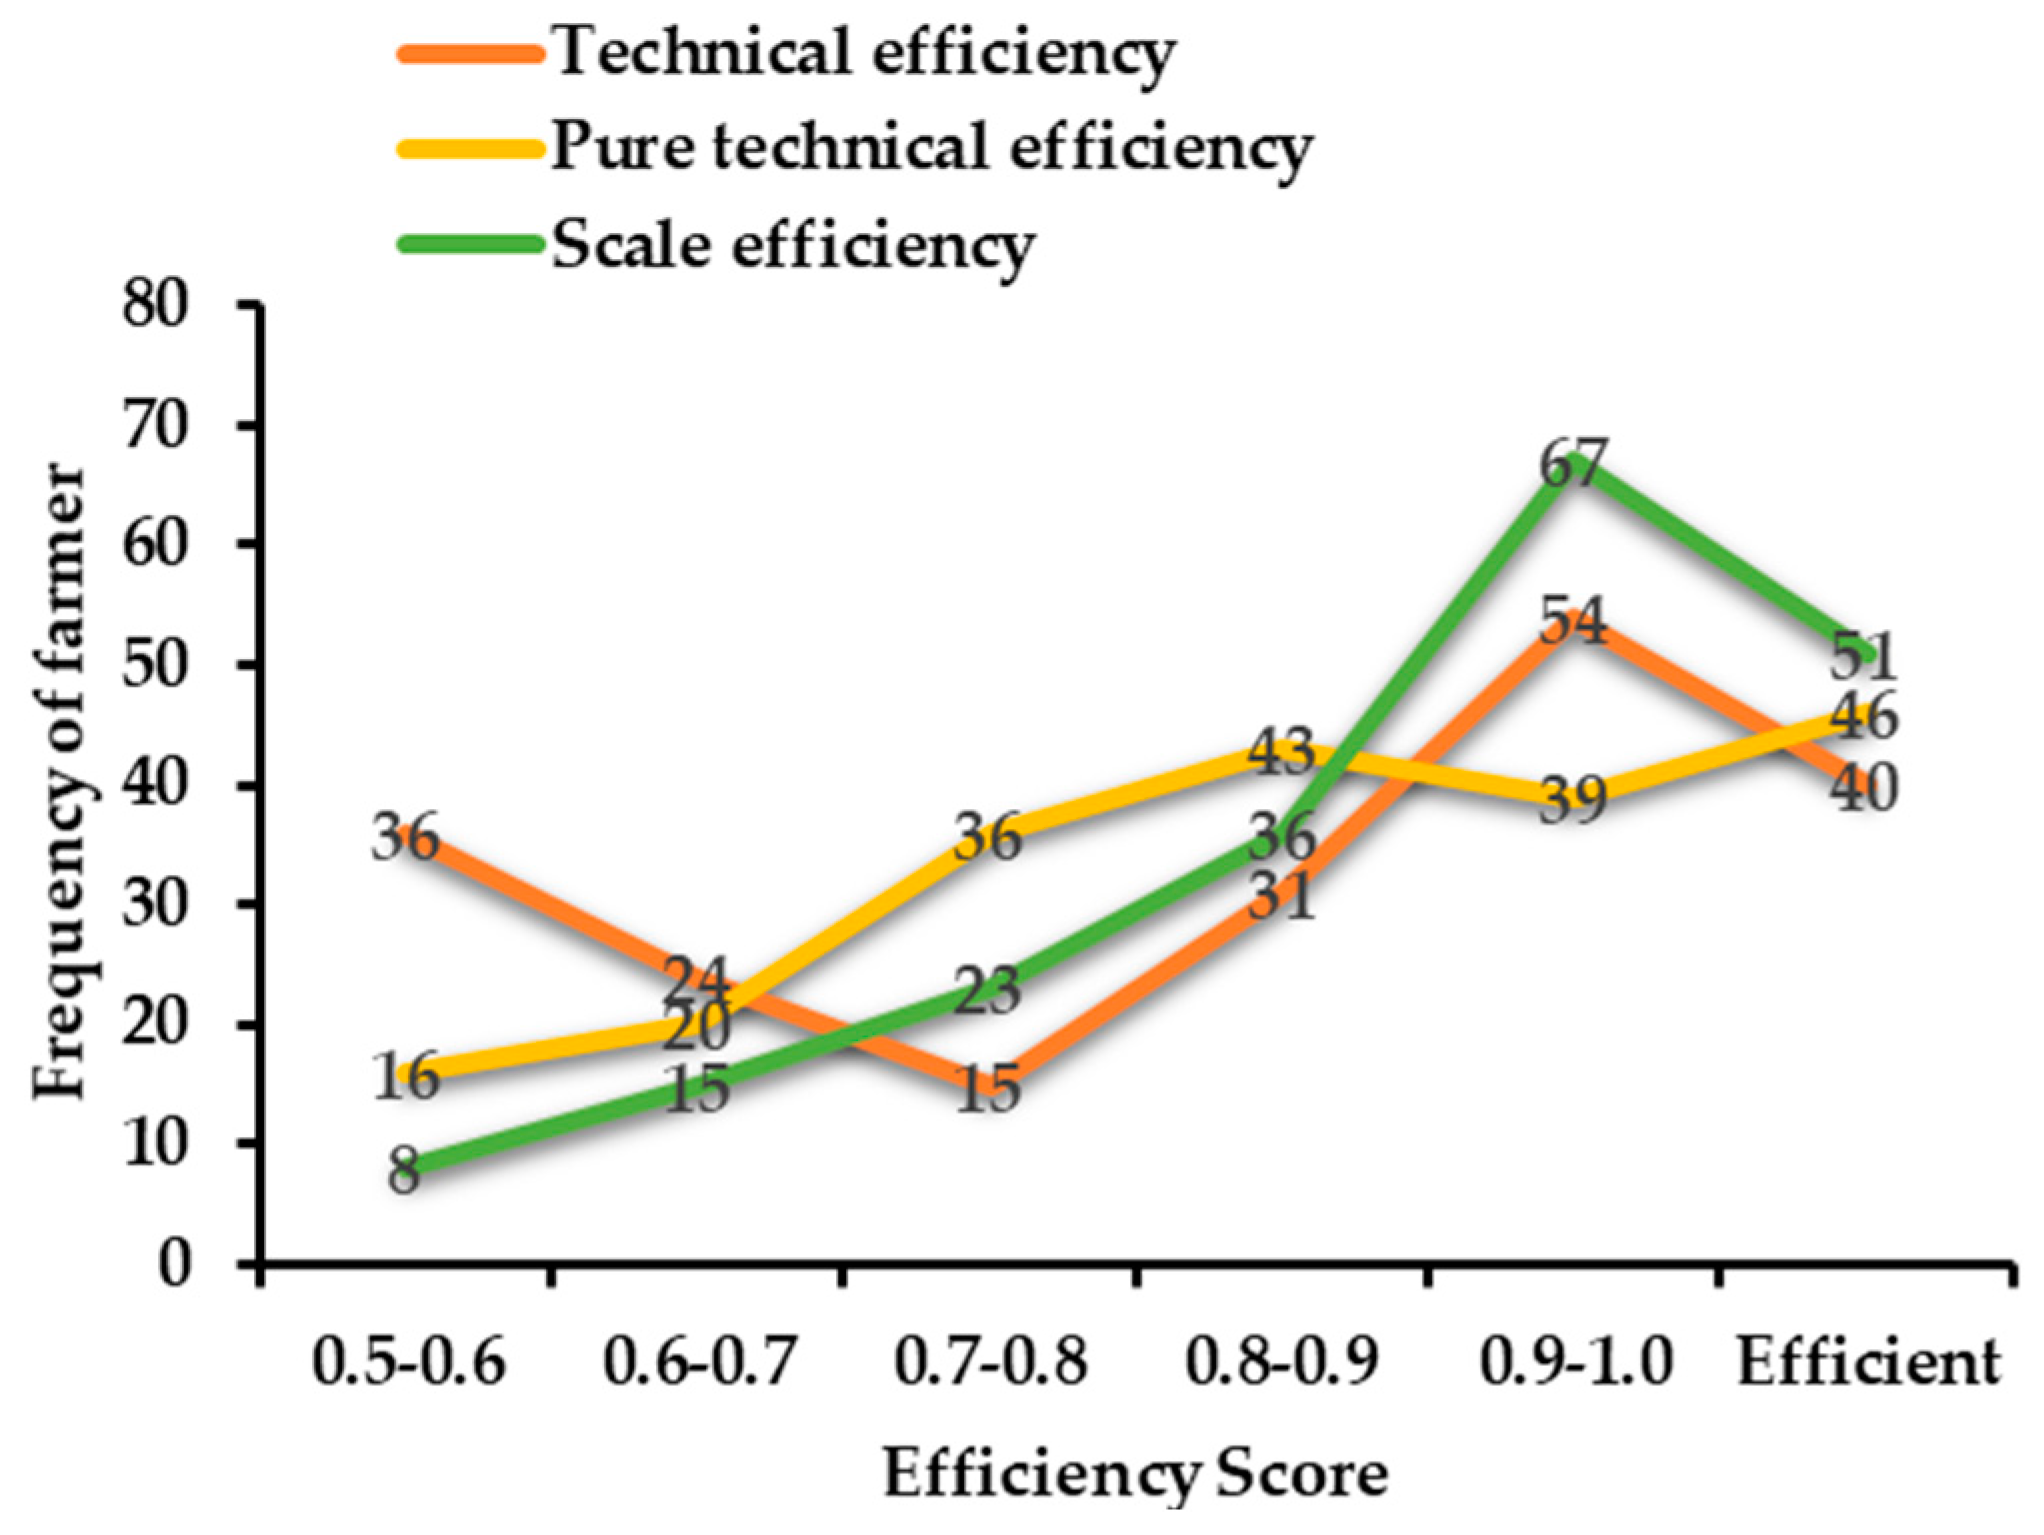
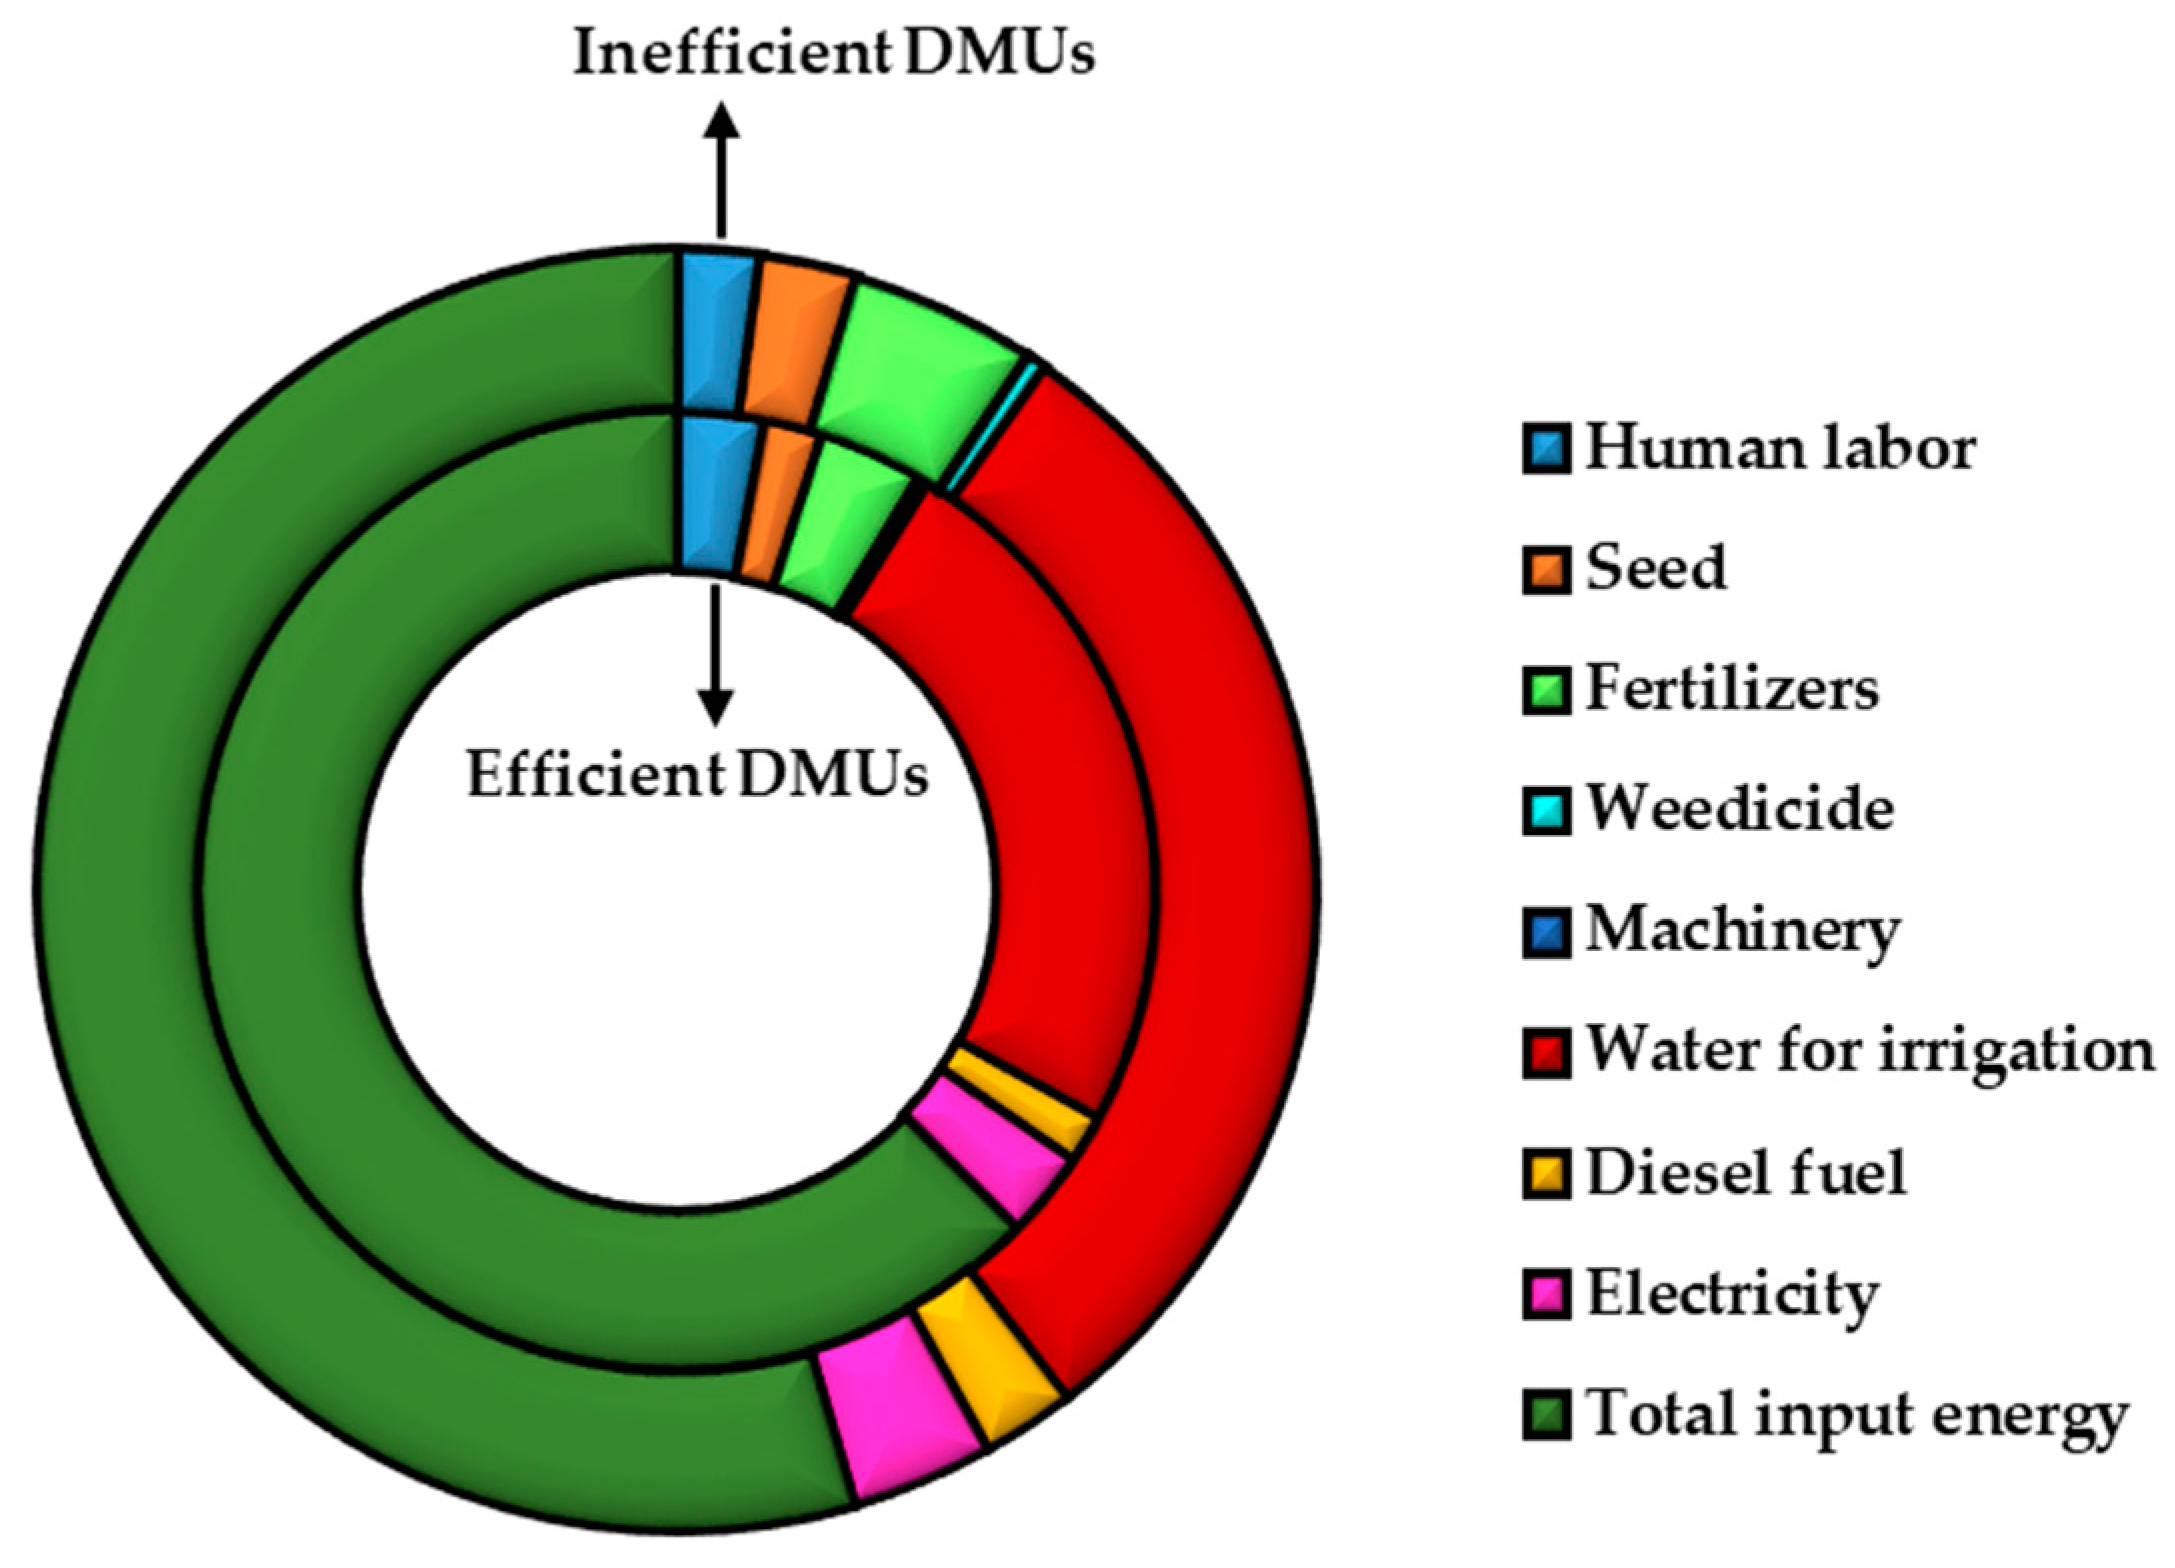
3.2. Data Envelopment Analysis (DEA) Results
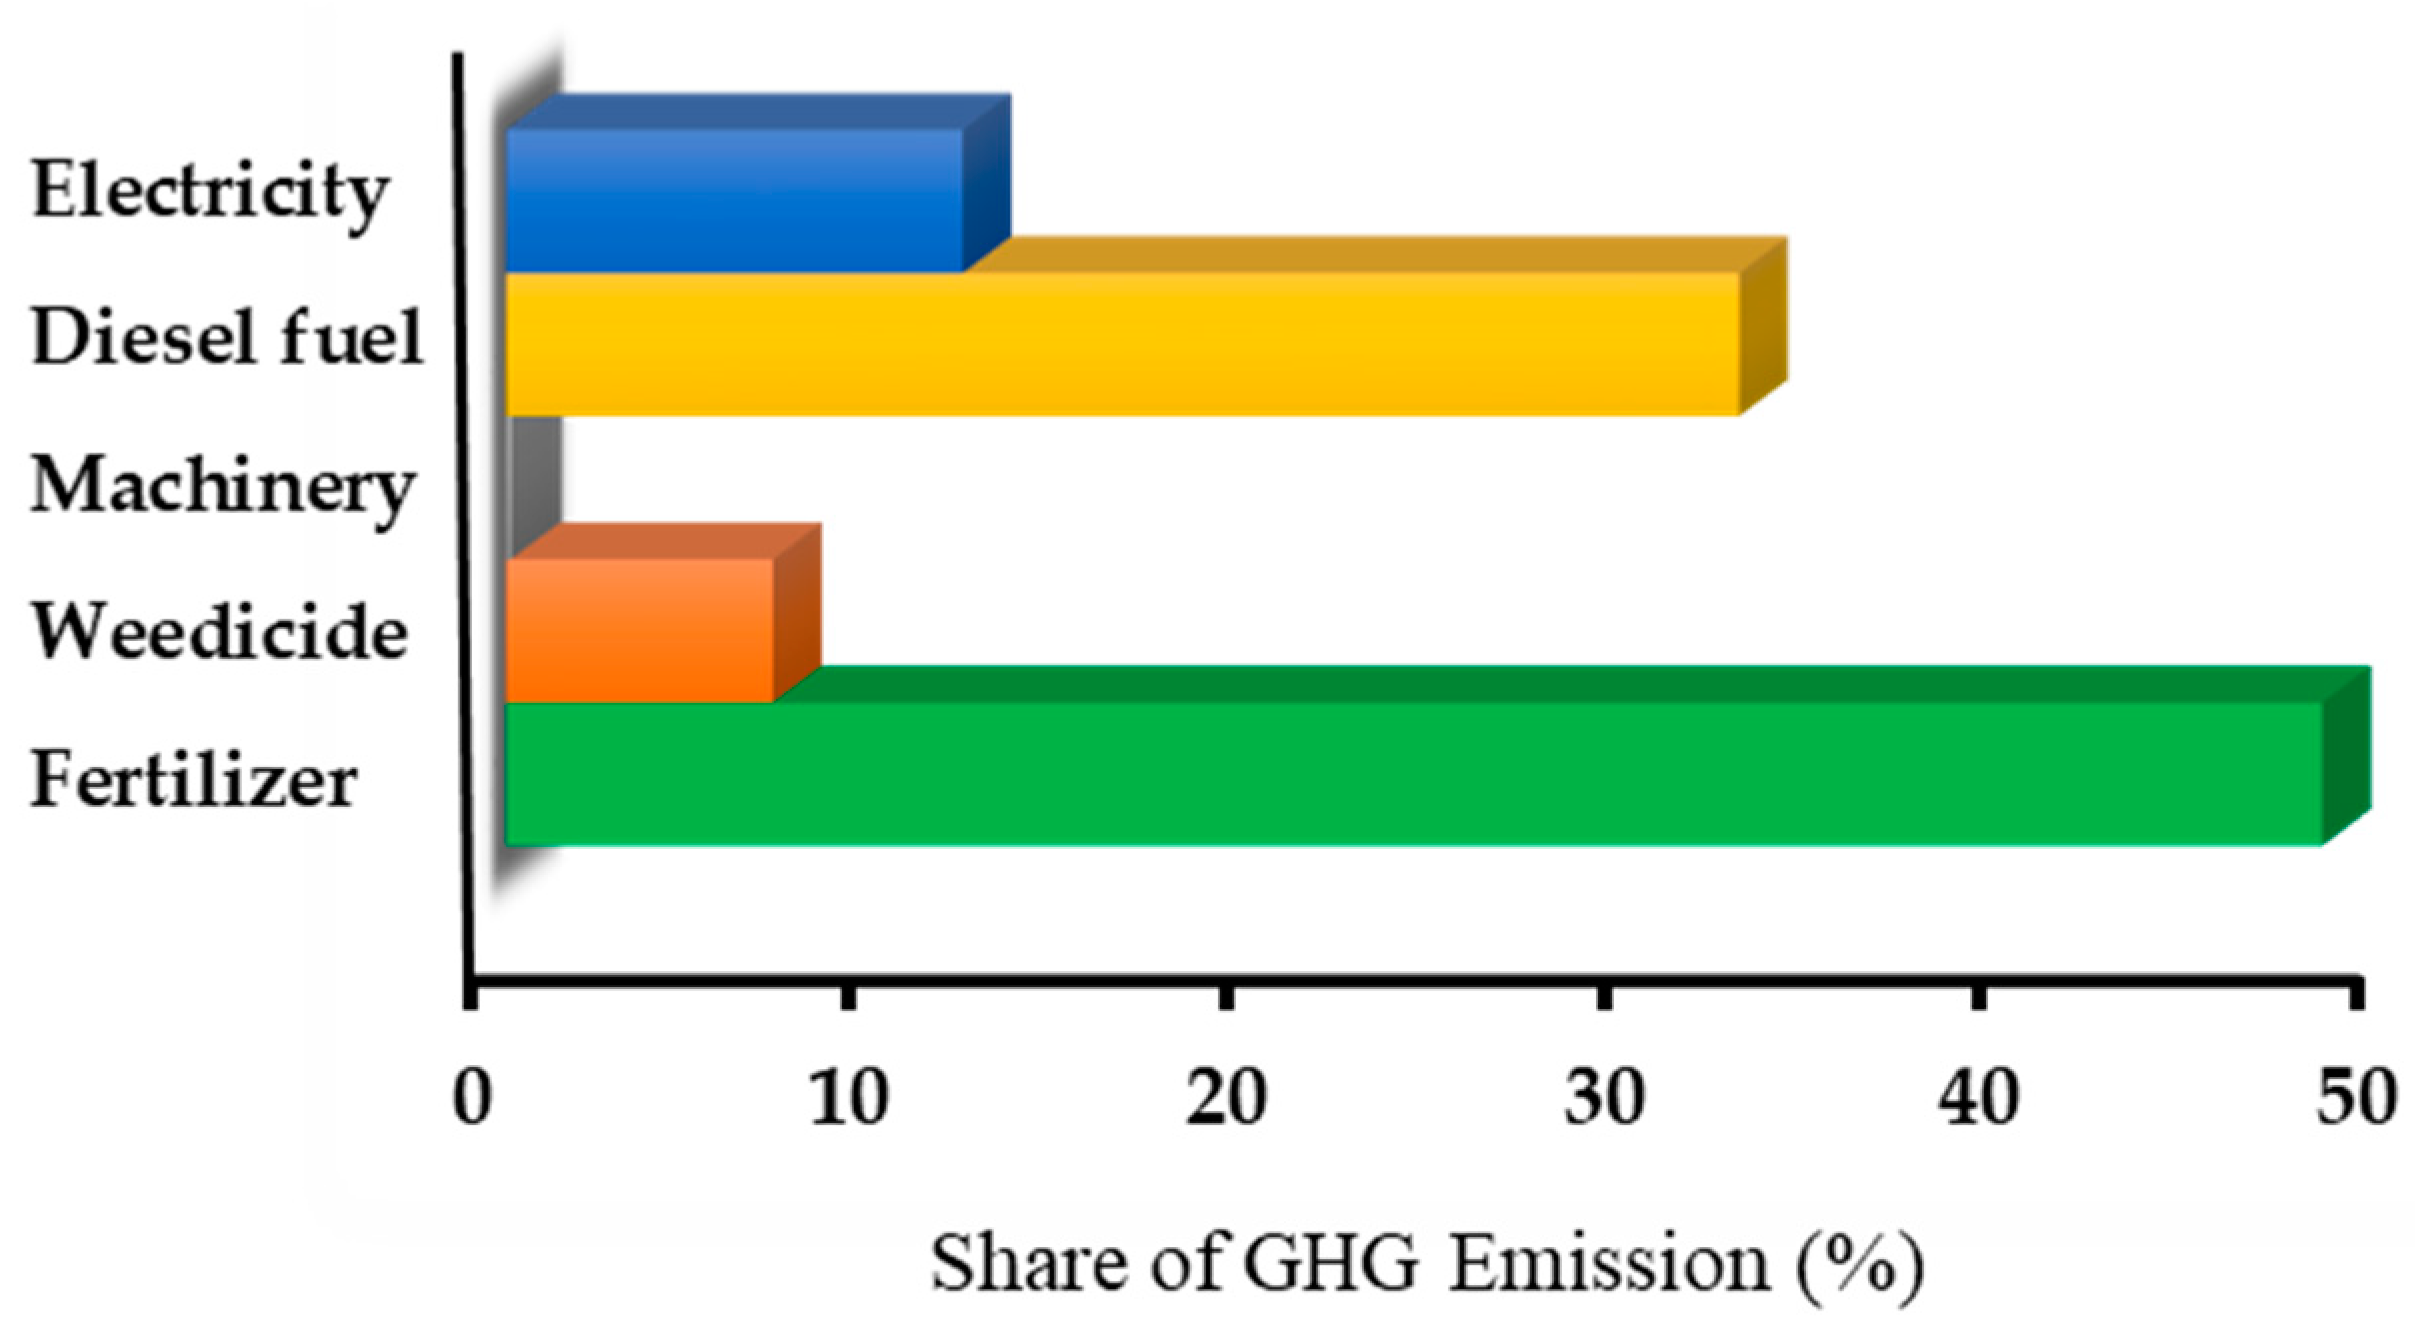
3.3. Greenhouse Gas Emissions
4. Conclusions
Author Contributions
Funding
Acknowledgments
Conflicts of Interest
References
- Mohammadi, A.; Omid, M. Economical analysis and relation between energy inputs and yield of greenhouse cucumber production in Iran. Appl. Energy 2010, 87, 191–196. [Google Scholar] [CrossRef]
- Maraseni, T.; Chen, G.; Banhazi, T.; Bundschuh, J.; Yusaf, T. An Assessment of Direct on-Farm Energy Use for High Value Grain Crops Grown under Different Farming Practices in Australia. Energies 2015, 8, 13033–13046. [Google Scholar] [CrossRef] [Green Version]
- Bergtold, J.S.; Shanoyan, A.; Fewell, J.E.; Williams, J.R. Annual bioenergy crops for biofuels production: DMUs’ contractual preferences for producing sweet sorghum. Energy 2017, 119, 724–731. [Google Scholar] [CrossRef]
- Wiser, R.; Millstein, D.; Mai, T.; Macknick, J.; Carpenter, A.; Cohen, S.; Cole, W.; Frew, B.; Heath, G. The environmental and public health benefits of achieving high penetrations of solar energy in the United States. Energy 2016, 113, 472–486. [Google Scholar] [CrossRef] [Green Version]
- De Jonge, A.M. Eco-efficiency improvement of a crop protection product: The perspective of the crop protection industry. Crop Prot. 2004, 23, 1177–1186. [Google Scholar] [CrossRef]
- Ghorbani, R.; Mondani, F.; Amirmoradi, S.; Feizi, H.; Khorramdel, S.; Teimouri, M.; Sanjani, S.; Anvarkhah, S.; Aghel, H. A case study of energy use and economical analysis of irrigated and dryland wheat production systems. Appl. Energy 2011, 88, 283–288. [Google Scholar] [CrossRef]
- Yuan, S.; Peng, S. Trends in the economic return on energy use and energy use efficiency in China’s crop production. Renew. Sustain. Energy Rev. 2017, 70, 836–844. [Google Scholar] [CrossRef]
- Pimentel, D.; Hepperly, P.; Hanson, J.; Douds, D.; Seidel, R. Environmental, Energetic, and Economic Comparisons of Organic and Conventional Farming Systems. BioScience 2005, 55, 573–582. [Google Scholar] [CrossRef]
- Beddington, J.R.; Asaduzzaman, M.; Clark, M.E.; Bremauntz, A.F.; Guillou, M.D.; Howlett, D.J.B.; Jahn, M.M.; Lin, E.; Mamo, T.; Negra, C.; et al. What Next for Agriculture After Durban? Science 2012, 335, 289–290. [Google Scholar] [CrossRef]
- Kastner, T.; Rivas, M.J.I.; Koch, W.; Nonhebel, S. Global changes in diets and the consequences for land requirements for food. Proc. Natl. Acad. Sci. USA 2012, 109, 6868–6872. [Google Scholar] [CrossRef] [Green Version]
- Lal, R. Carbon emission from farm operations. Environ. Int. 2004, 30, 981–990. [Google Scholar] [CrossRef] [PubMed]
- Kizilaslan, H. Input–output energy analysis of cherries production in Tokat Province of Turkey. Appl. Energy 2009, 86, 1354–1358. [Google Scholar] [CrossRef]
- Schneider, U.A.; Smith, P. Energy intensities and greenhouse gas emission mitigation in global agriculture. Energy Effic. 2009, 2, 195–206. [Google Scholar] [CrossRef]
- Unakitan, G.; Hurma, H.; Yilmaz, F. An analysis of energy use efficiency of canola production in Turkey. Energy 2010, 35, 3623–3627. [Google Scholar] [CrossRef]
- Kitani, O.; Jungbluth, T.; Peath, R.; Ramdani, A. CIGR Handbook of Agricultural Engineering, Volume V: Energy and Biomass Engineering; ASAE Publication: St. Joseph, MI, USA, 1999. [Google Scholar]
- Sartori, L.; Basso, B.; Bertocco, M.; Oliviéro, G. Energy Use and Economic Evaluation of a Three Year Crop Rotation for Conservation and Organic Farming in NE Italy. Biosyst. Eng. 2005, 91, 245–256. [Google Scholar] [CrossRef]
- Erdal, G.; Esengün, K.; Erdal, H.; Gündüz, O. Energy use and economical analysis of sugar beet production in Tokat province of Turkey. Energy 2007, 32, 35–41. [Google Scholar] [CrossRef]
- Yilmaz, I.; Akcaoz, H.; Ozkan, B.; Yılmaz, I. An analysis of energy use and input costs for cotton production in Turkey. Renew. Energy 2005, 30, 145–155. [Google Scholar] [CrossRef]
- Esengun, K.; Gündüz, O.; Erdal, G. Input–output energy analysis in dry apricot production of Turkey. Energy Convers. Manag. 2007, 48, 592–598. [Google Scholar] [CrossRef]
- Quilty, J.R.; McKinley, J.; Pede, V.O.; Buresh, R.J.; Correa, T.Q., Jr.; Sandro, J.M. Energy efficiency of rice production in DMUs’ fields and intensively cropped research fields in the Philippines. Field Crop. Res. 2014, 168, 8–18. [Google Scholar] [CrossRef]
- Lu, H.; Bai, Y.; Ren, H.; Campbell, D.E. Integrated emergy, energy and economic evaluation of rice and vegetable production systems in alluvial paddy fields: Implications for agricultural policy in China. J. Environ. Manag. 2010, 91, 2727–2735. [Google Scholar] [CrossRef]
- Yousefi, M.; Khoramivafa, M.; Mondani, F. Integrated evaluation of energy use, greenhouse gas emissions and global warming potential for sugar beet (Beta vulgaris) agroecosystems in Iran. Atmos. Environ. 2014, 92, 501–505. [Google Scholar] [CrossRef]
- Khoshnevisan, B.; Rafiee, S.; Omid, M.; Yousefi, M.; Movahedi, M. Modeling of energy consumption and GHG (greenhouse gas) emissions in wheat production in Esfahan province of Iran using artificial neural networks. Energy 2013, 52, 333–338. [Google Scholar] [CrossRef]
- Mondal, S.; Singh, R.; Mason, E.; Huerta-Espino, J.; Autrique, E.; Joshi, A. Grain yield, adaptation and progress in breeding for early-maturing and heat-tolerant wheat lines in South Asia. Field Crop. Res. 2016, 192, 78–85. [Google Scholar] [CrossRef] [Green Version]
- FAOSTAT. 2017. Available online: http://www. fao.org/faostat/en/#data (accessed on 1 January 2018).
- Pakistan Economic Survey 2018–2019; Ministry of Finance, Government of Pakistan: Islamabad, Pakistan, 2019.
- Rajaram, S.; Hobbs, P.; Heisey, P. Review of Pakistan’s Wheat and Maize Research Systems; Centro Internacional de Mejoramiento de Maiz y Trigo (CIMMYT): Mexico City, Mexico, 1998. [Google Scholar]
- Houshyar, E.; Grundmann, P. Environmental impacts of energy use in wheat tillage systems: A comparative life cycle assessment (LCA) study in Iran. Energy 2017, 122, 11–24. [Google Scholar] [CrossRef]
- Mondani, F.; Aleagha, S.; Khoramivafa, M.; Ghobadi, R. Evaluation of greenhouse gases emission based on energy consumption in wheat Agroecosystems. Energy Rep. 2017, 3, 37–45. [Google Scholar] [CrossRef]
- Sahabi, H.; Feizi, H.; Karbasi, A. Is saffron more energy and economic efficient than wheat in crop rotation systems in northeast Iran? Sustain. Prod. Consum. 2016, 5, 29–35. [Google Scholar] [CrossRef]
- Taghavifar, H.; Mardani, A. Energy consumption analysis of wheat production in West Azarbayjan utilizing life cycle assessment (LCA). Renew. Energy 2015, 74, 208–213. [Google Scholar] [CrossRef]
- Rahman, S.; Hasan, M.K. Energy productivity and efficiency of wheat farming in Bangladesh. Energy 2014, 66, 107–114. [Google Scholar] [CrossRef] [Green Version]
- Ali, S.A.; Tedone, L.; De Mastro, G. A comparison of the energy consumption of rainfed durum wheat under different management scenarios in southern Italy. Energy 2013, 61, 308–318. [Google Scholar]
- Mousavi-Avval, S.H.; Rafiee, S.; Mohammadi, A. Optimization of energy consumption and input costs for apple production in Iran using data envelopment analysis. Energy 2011, 36, 909–916. [Google Scholar] [CrossRef]
- Nassiri, S.M.; Singh, S. Study on energy use efficiency for paddy crop using data envelopment analysis (DEA) technique. Appl. Energy 2009, 86, 1320–1325. [Google Scholar] [CrossRef]
- Mousavi-Avval, S.H.; Rafiee, S.; Jafari, A.; Mohammadi, A. Optimization of energy consumption for soybean production using Data Envelopment Analysis (DEA) approach. Appl. Energy 2011, 88, 3765–3772. [Google Scholar] [CrossRef]
- Mousavi-Avval, S.H.; Rafiee, S.; Jafari, A.; Mohammadi, A. Improving energy use efficiency of canola production using data envelopment analysis (DEA) approach. Energy 2011, 36, 2765–2772. [Google Scholar] [CrossRef]
- Akhtar, S.; Gu-Cheng, L.; Ullah, R.; Nazir, A.; Iqbal, M.A.; Raza, H.; Iqbal, N.; Faisal, M. Factors influencing hybrid maize DMUs’ risk attitudes and their perceptions in Punjab Province, Pakistan. J. Integr. Agric. 2018, 17, 1454–1462. [Google Scholar] [CrossRef]
- Yamane, T. Problems to Accompany Statistics: An Introduction Analysis; Harper and Row: New York, NY, USA, 1967. [Google Scholar]
- Beheshti Tabar, I.; Keyhani, A.; Rafiee, S. Energy balance in Iran’s agronomy (1990–2006). Renew. Sustain. Energy Rev. 2010, 14, 849–855. [Google Scholar] [CrossRef]
- Zhang, X.; Pan, H.; Cao, J.; Li, J. Energy consumption of China’s crop production system and the related emissions. Renew. Sustain. Energy Rev. 2015, 43, 111–125. [Google Scholar] [CrossRef]
- Kazemi, H.; Kamkar, B.; Lakzaei, S.; Badsar, M.; Shahbyki, M. Energy flow analysis for rice production in different geographical regions of Iran. Energy 2015, 84, 390–396. [Google Scholar] [CrossRef]
- Nabavi-Pelesaraei, A.; Hosseinzadeh-Bandbafha, H.; Qasemi-Kordkheili, P.; Kouchaki-Penchah, H.; Riahi-Dorcheh, F. Applying optimization techniques to improve of energy efficiency and GHG (greenhouse gas) emissions of wheat production. Energy 2016, 103, 672–678. [Google Scholar] [CrossRef]
- Elhami, B.; Akram, A.; Khanali, M.; Khoshnevisan, B. Optimization of energy consumption and environmental impacts of chickpea production using data envelopment analysis (DEA) and multi objective genetic algorithm (MOGA) approaches. Inf. Process. Agric. 2016, 3, 190–205. [Google Scholar] [CrossRef] [Green Version]
- Charnes, A.; Cooper, W.; Rhodes, E. Measuring the efficiency of decision making units. Eur. J. Oper. Res. 1978, 2, 429–444. [Google Scholar] [CrossRef]
- Banker, R.D.; Charnes, A.; Cooper, W.W. Some models for estimating technical and scale inefficiencies in data envelopment analysis. Manag. Sci. 1984, 30, 1078–1092. [Google Scholar] [CrossRef]
- Farrell, M.J.; Fieldhouse, M. Estimating Efficient Production Functions under Increasing Returns to Scale. J. R. Stat. Soc. Ser. A (Gen.) 1962, 125, 252–267. [Google Scholar] [CrossRef]
- Cooper, W.W.; Seiford, L.M.; Tone, K. Introduction to Data Envelopment Analysis and Its Uses: With DEA-Solver Software and References; Springer Science and Business Media: New York, NY, USA, 2006. [Google Scholar]
- Khoshnevisan, B.; Rafiee, S.; Omid, M.; Mousazadeh, H. Applying data envelopment analysis approach to improve energy efficiency and reduce GHG (greenhouse gas) emission of wheat production. Energy 2013, 58, 588–593. [Google Scholar] [CrossRef]
- Khalili-Damghani, K.; Tavana, M.; Santos-Arteaga, F.J.; Mohtasham, S. A dynamic multi-stage data envelopment analysis model with application to energy consumption in the cotton industry. Energy Econ. 2015, 51, 320–328. [Google Scholar] [CrossRef]
- Hu, J.-L.; Kao, C.-H. Efficient energy-saving targets for APEC economies. Energy Policy 2007, 35, 373–382. [Google Scholar] [CrossRef]
- Jones, C.D.; Fraisse, C.W.; Ozores-Hampton, M. Quantification of greenhouse gas emissions from open field-grown Florida tomato production. Agric. Syst. 2012, 113, 64–72. [Google Scholar] [CrossRef]
- Pishgar-Komleh, S.H.; Omid, M.; Heidari, M.D. On the study of energy use and GHG (greenhouse gas) emissions in greenhouse cucumber production in Yazd province. Energy 2013, 59, 63–71. [Google Scholar] [CrossRef]
- Houshyar, E.; Sheikh Davoodi, M.; Nassiri, S. Energy efficiency for wheat production using data envelopment analysis (DEA) technique. J. Agric. Technol. 2010, 6, 663–672. [Google Scholar]
- Tipi, T.; Çetin, B.; Vardar, A. An analysis of energy use and input costs for wheat production in Turkey. J. Food Agric. Environ. 2009, 7, 352–356. [Google Scholar]
- Memon, M.I.N.; Noonari, S.; Laghari, M.A.; Pathan, M.; Pathan, A.; Sial, S.A. Energy Consumption Pattern in Wheat Production in Sindh Pakistan. J. Energy Technol. Policy 2015, 5, 63–77. [Google Scholar]
- Padilla-Fernandez, M.D.; Nuthall, P.L. Technical efficiency in the production of sugar cane in central Negros area, Philippines: An application of data envelopment analysis. J. ISSAAS 2009, 15, 77–90. [Google Scholar]
- Azarpour, E. Determination of energy balance and energy indices in wheat production under watered farming in North of Iran. J. Agric. Biol. Sci. 2012, 7, 250–255. [Google Scholar]
- Canakci, M.; Topakci, M.; Akinci, I.; Özmerzi, A. Energy use pattern of some field crops and vegetable production: Case study for Antalya Region, Turkey. Energy Convers. Manag. 2005, 46, 655–666. [Google Scholar] [CrossRef]
- Mohammadi, A.; Tabatabaeefar, A.; Shahin, S.; Rafiee, S.; Keyhani, A. Energy use and economical analysis of potato production in Iran a case study: Ardabil province. Energy Convers. Manag. 2008, 49, 3566–3570. [Google Scholar] [CrossRef]
- Mohammadi, A.; Rafiee, S.; Mohtasebi, S.S.; Avval, S.H.M.; Rafiee, H. Energy efficiency improvement and input cost saving in kiwifruit production using Data Envelopment Analysis approach. Renew. Energy 2011, 36, 2573–2579. [Google Scholar] [CrossRef]
- Banaeian, N.; Zangeneh, M. Study on energy efficiency in corn production of Iran. Energy 2011, 36, 5394–5402. [Google Scholar] [CrossRef]
- Chauhan, N.S.; Mohapatra, P.K.; Pandey, K.P. Improving energy productivity in paddy production through benchmarking—An application of data envelopment analysis. Energy Convers. Manag. 2006, 47, 1063–1085. [Google Scholar] [CrossRef]
- Dyer, J.A.; Desjardins, R.L. The Impact of Farm Machinery Management on the Greenhouse Gas Emissions from Canadian Agriculture. J. Sustain. Agric. 2003, 22, 59–74. [Google Scholar] [CrossRef]
- Mohammadi, A.; Rafiee, S.; Jafari, A.; Keyhani, A.; Mousavi-Avval, S.H.; Nonhebel, S. Energy use efficiency and greenhouse gas emissions of farming systems in north Iran. Renew. Sustain. Energy Rev. 2014, 30, 724–733. [Google Scholar] [CrossRef]
- Pathak, H.; Wassmann, R. Introducing greenhouse gas mitigation as a development objective in rice-based agriculture: I. Generation of technical coefficients. Agric. Syst. 2007, 94, 807–825. [Google Scholar] [CrossRef]
- Khakbazan, M.; Mohr, R.; Derksen, D.; Monreal, M.; Grant, C.; Zentner, R.; Moulin, A.; McLaren, D.; Irvine, R.; Nagy, C. Effects of alternative management practices on the economics, energy and GHG emissions of a wheat–pea cropping system in the Canadian prairies. Soil Tillage Res. 2009, 104, 30–38. [Google Scholar] [CrossRef]
- Pishgar-Komleh, S.; Ghahderijani, M.; Sefeedpari, P. Energy consumption and CO2 emissions analysis of potato production based on different farm size levels in Iran. J. Clean. Prod. 2012, 33, 183–191. [Google Scholar] [CrossRef]
- Soni, P.; Taewichit, C.; Salokhe, V.M. Energy consumption and CO2 emissions in rainfed agricultural production systems of Northeast Thailand. Agric. Syst. 2013, 116, 25–36. [Google Scholar] [CrossRef]
- Sefeedpari, P.; Ghahderijani, M.; Pishgar-Komleh, S.H. Assessment the effect of wheat farm sizes on energy consumption and CO2 emission. J. Renew. Sustain. Energy 2013, 5, 23131. [Google Scholar] [CrossRef]


| Inputs | Unit | GHG Coefficient | Reference |
|---|---|---|---|
| 1. Fertilizer | kg | ||
| Nitrogen (N) | kg | 1.3 | [11] |
| Phosphate (P2O5) | kg | 0.2 | [11] |
| 2. Weedicide | kg | 6.3 | [11] |
| 3. Machinery | MJ | 0.071 | [53] |
| 4. Diesel fuel | L | 2.76 | [49] |
| 5. Electricity | Kwh | 0.78 | [53] |
| 1. Inputs | Unit | Quantity per Hectare (Means) | Total Energy (MJ/ha) |
|---|---|---|---|
| Human labor | h | 132.5 | 259.7 |
| Seed | kg | 151 | 1963 |
| Fertilizer | kg | 288.45 | 15,690.09 |
| Nitrogen (N) | kg | 175.8 | 13,729.98 |
| Phosphate (P2O5) | kg | 112.65 | 1960.11 |
| Weedicide | kg | 5.3 | 1261.4 |
| Tractor | kg | 10.42 | 1437.96 |
| Plow | 4.01 | 721.8 | |
| Rotary | 5.87 | 868.76 | |
| Thrashing | h | 6.13 | 384.351 |
| Water for irrigation | m3 | 2115.32 | 2157.626 |
| Diesel fuel | L | 145.68 | 6963.504 |
| Electricity | Kwh | 228.23 | 2722.784 |
| Total Input Energy | 34,430.98 | ||
| 2. Outputs (Kg) | |||
| Wheat yield | 3712.85 | 48,267.05 |
| Item | Unit | Actual Quantity | Optimum Quantity | Difference (%) |
|---|---|---|---|---|
| Energy use efficiency | - | 1.40184963 | 1.48 | 22.12 |
| Energy productivity | kg MJ−1 | 0.107834587 | 0.12 | 29.04 |
| Specific energy | MJ kg−1 | 9.273462515 | 8.52 | −20.6 |
| Net energy gain | MJ ha−1 | 13,836.0747 | 10,021.35 | 18.89 |
| Sampling Zones | |||||
|---|---|---|---|---|---|
| Distribution | Layyah | D.G. Khan | Rajan Pur | Muzaffargarh | |
| Efficient | 1 | 4 | 6 | 16 | 5 |
| >0.9 | 5 | 8 | 7 | 7 | |
| 0.8–0.9 | 8 | 5 | 5 | 3 | |
| 0.7–0.8 | 6 | 9 | 8 | 5 | |
| Inefficient | 0.6–0.7 | 13 | 12 | 14 | 11 |
| 0.5–0.6 | 14 | 10 | 0 | 19 | |
| Average | 0.684a | 0.736b | 0.828c | 0.642a | |
| Sampling Zones | |||||
|---|---|---|---|---|---|
| Return to Scale | Layyah | D.G. Khan | Rajan Pur | Muzaffargarh | Total |
| Increase | 0 | 4 | 11 | 0 | 15 |
| Constant | 7 | 10 | 15 | 5 | 37 |
| Decrease | 43 | 36 | 24 | 46 | 149 |
| Total number of farmer | 50 | 50 | 50 | 50 | 200 |
| Inputs | Optimum Energy Requirements (MJ/ha) | Energy Saving Target | ESTR (%) |
|---|---|---|---|
| Human labor | 232.56 | 27.14 | 10.45051983 |
| Seed | 1651 | 312 | 15.89403974 |
| Nitrogen (N) | 11,254.23 | 2475.75 | 18.03170871 |
| Phosphate (P2O5) | 1636.76 | 323.35 | 16.49652315 |
| Weedicide | 998.3 | 263.1 | 20.85777707 |
| Tractor | 1195.35 | 242.61 | 16.87181841 |
| Plow | 589.02 | 132.78 | 18.39567747 |
| Rotary | 705.28 | 163.48 | 18.81762512 |
| Thrashing | 353.52 | 30.831 | 8.02157403 |
| Water for irrigation | 1935.34 | 222.2864 | 10.30235818 |
| Diesel fuel | 6478.25 | 485.254 | 6.968531934 |
| Electricity | 2358.91 | 363.8739 | 13.36403892 |
| Total | 29,388.52 | 5042.4553 | 14.64511318 |
© 2019 by the authors. Licensee MDPI, Basel, Switzerland. This article is an open access article distributed under the terms and conditions of the Creative Commons Attribution (CC BY) license (http://creativecommons.org/licenses/by/4.0/).
Share and Cite
Ilahi, S.; Wu, Y.; Raza, M.A.A.; Wei, W.; Imran, M.; Bayasgalankhuu, L. Optimization Approach for Improving Energy Efficiency and Evaluation of Greenhouse Gas Emission of Wheat Crop using Data Envelopment Analysis. Sustainability 2019, 11, 3409. https://0-doi-org.brum.beds.ac.uk/10.3390/su11123409
Ilahi S, Wu Y, Raza MAA, Wei W, Imran M, Bayasgalankhuu L. Optimization Approach for Improving Energy Efficiency and Evaluation of Greenhouse Gas Emission of Wheat Crop using Data Envelopment Analysis. Sustainability. 2019; 11(12):3409. https://0-doi-org.brum.beds.ac.uk/10.3390/su11123409
Chicago/Turabian StyleIlahi, Sara, Yongchang Wu, Muhammad Ahsan Ali Raza, Wenshan Wei, Muhammad Imran, and Lyankhua Bayasgalankhuu. 2019. "Optimization Approach for Improving Energy Efficiency and Evaluation of Greenhouse Gas Emission of Wheat Crop using Data Envelopment Analysis" Sustainability 11, no. 12: 3409. https://0-doi-org.brum.beds.ac.uk/10.3390/su11123409