State-of-Charge Effects on Standalone Solar-Storage Systems in Hot Climates: A Case Study in Saudi Arabia


King Abdullah Petroleum Studies and Research Center (KAPSARC), Riyadh 11672, Saudi Arabia
*
Author to whom correspondence should be addressed.
Sustainability 2019, 11(12), 3471; https://0-doi-org.brum.beds.ac.uk/10.3390/su11123471
Submission received: 12 May 2019
/
Revised: 15 June 2019
/
Accepted: 17 June 2019
/
Published: 24 June 2019
(This article belongs to the Section Sustainable Urban and Rural Development)
Abstract
:In this paper, we quantify the economic and environmental implications of operating a standalone photovoltaic-battery system (PVB) while varying the battery’s minimum allowable state of charge (MSOC), the load profile, and simultaneously incorporating ambient temperature effects in hot climates. To that end, Saudi Arabia has been chosen for this case study. Over a project lifetime of 25 years, we find that, contrary to the widely accepted norm of 50% being a reasonable MSOC, a lower MSOC can bestow economic benefits. For example, a MSOC of 20% results in a lower number of batteries required throughout the lifetime of the project—while still meeting demand. For a village of 1000 homes, this translates to a saving of $47 million in net present value. Further, incorporating temperature effects results in deducing more realistic costs that are 125% higher than the ideal scenario (i.e., when temperature is not modeled). This difference stems from underestimating the actual number of batteries needed throughout the project lifetime. Compared to a diesel-powered microgrid, and for a village of 1000 homes, a PVB would, on an annual basis, avoid emitting 5000 tons of carbon and avoid burning 2 million liters of diesel.
1. Introduction
Within Saudi Arabia, virtually all the population has access to electricity. However, given the large area of Saudi Arabia (2.15 million m2), a considerable number of communities, villages, and rural areas are powered by diesel generators through an isolated grid given that connecting these remote locations to the main grid with transmission lines is prohibitively costly [1,2]. According to 2016 data, over 50 remote locations kingdom-wide were diesel-powered. In addition, nearly 19,000 homes were relying on on-site diesel generation for their energy needs as per the 2017 Saudi household energy survey. Some of these homes would obtain their diesel from gas stations, which means that they use (subsidized) diesel that is allocated for the transportation sector. Renewable technologies hold potential in providing energy for these remote locations cost effectively, and this includes solar photovoltaics (PV).
The rate at which global solar photovoltaic (PV) systems were deployed, in particular, has proven to be remarkable. In 2016, a record 75 GW of PV were installed worldwide, and another record installation of around 100 GW followed in the subsequent year. By the end of 2017, the total cumulative installed PV capacity worldwide reached approximately 400 GW [3], representing a little less than a fifth of total global renewable installations (including hydro). In addition to low operational and maintenance costs required to run a solar system, the major drop in module prices (which are now as low as 0.30 $/W), and hence capital cost, has been a major contributor to global solar PV deployment.
The battery storage market is also witnessing similar record-setting growth. According to Bloomberg New Energy Finance, total global battery storage capacity was less than 5 GW by the end of 2017 [4]. There is some discrepancy between reports as to how much battery storage capacity actually exists, and this uncertainty stems from the lack of a standard methodology that links battery capacity in energy terms (watt × hours) to battery capacity in power terms (watts). Notwithstanding this challenge, the International Renewable Energy Agency (IRENA) estimates the current global battery capacity in power terms to be 11 GWh worldwide [5]. Costs of battery storage have also declined: from about 1000 $/kW h in 2010 to roughly 200–300 $/kW h [6,7] recently. Battery prices vary within a relatively wide range and reflect different applications including electric vehicles, residential systems, and utility. Despite the falling costs of batteries, they cannot be considered cost-effective across all applications and countries as of yet.
The World Bank estimates that well over 1 billion people have no grid electricity access [8]. When possible, diesel generators are the de facto source of energy for such areas lacking a grid [1]. As the costs of solar PV and storage systems come down, a fully renewable and reliable off-grid system can be attained. The latter option is an attractive solution as it avoids building transmission lines, reduces carbon emissions, suppresses noise, and eliminates vulnerability to the fluctuation of diesel prices. Researchers have assessed the economic viability of off-grid systems many years ago [9,10].
With respect to solar panels, it is well-known that their power output depends mainly on their efficiency, angle of installation, and temperature. Incorporating the annual degradation rate of solar panels gives even a more accurate estimate of their output. However, the above-mentioned factors have little effect on the lifetime of solar panels [11,12]. The lifetime of the panels is not immediately dependent on how much power was generated, and it is customary to get 25-year warranties from solar manufacturers.
Conversely, when speaking about battery lifetimes, the situation is starkly different. The temperature in which the battery operates and the discharging patterns are factors that affect the battery lifetime significantly, i.e., they can bring down the lifetime by more than half.
One of the most important factors that affect the lifetime of battery is the State-of-Charge. If a battery, after it is fully charged, delivers 80 percent of the energy available, then only 20 percent of energy capacity is left. In other words, it is said that the battery has reached a 20 percent state-of-charge, or SOC. Equivalently, the battery is said to have reached an 80 percent depth-of-discharge (DOD). Manufacturers generally recommend that the SOC of batteries does not fall below 50 percent to prolong the battery lifetime.
Disallowing the battery to drain below a 50 percent SOC, for example, requires a relatively large battery bank. On the other hand, if the battery is discharged deeper, i.e., lower values of SOC, the battery terminals wear faster—and this shortens the battery’s life. The shortened battery life has financial implications as it requires more frequent battery replacements. As can be seen, there is an economic trade-off between the minimum allowed SOC (MSOC) and the size of the battery bank. Most manufacturers do not recommend reaching very low levels of SOC (i.e., lower than 10 percent) as this can cause permanent damage to the battery terminals and/or negatively impact the state-of-health of the battery more rapidly. The state-of-health refers to the ability of the battery to store and deliver energy compared with a new battery [13]. In other words, we note the compromise that must be exercised between the battery bank size (and hence cost), and ensuring the state-of-health of the batteries continues to be high for a longer period of time. A MSOC of 50 percent is the most commonly recommended value to use [14,15]. Several battery manufacturers have introduced deep-cycle batteries, sold at a premium, which allow for low MSOC levels to be reached without permanently damaging the battery terminals.
Many researchers have carried out techno-economic studies on solar photovoltaic-battery systems (PVB). However, the effect of different MSOC levels on the economics of the battery system was not quantified. Studies have traditionally performed the analysis while keeping the MSOC fixed at 50 or 40 percent [16]. Depending on the load profile and the size of the PV modules, such a MSOC may result in an unjustified oversizing of the battery bank.
The temperature at which the batteries function in is also a factor that significantly affects the performance of batteries and hence the economics of any PVB. At high temperatures (around 40 degrees centigrade), battery capacity can increase by a factor of 20 percent. Along with this capacity increase, a degradation to the maximum capacity occurs with each cycle [17,18]. Moreover, higher temperatures shorten the lifetime of the battery. Clearly, incorporating temperature effects can result in better design of PVB. The added value of incorporating temperature effects comes at the cost of more sophisticated modeling and, as will be shown in the next section, most authors ignore the temperature-related phenomena in their calculations.
As mentioned earlier, over 50 remote locations in Saudi Arabia were diesel-powered according to 2016 data. Given the logistical difficulty and significant costs associated with maintaining a stable supply of diesel for these locations, in addition to environmental impacts associated with burning diesel, several researchers have considered the feasibility of powering these communities with renewables [1,2,19,20,21,22]. While these studies may have incorporated the effects of temperature on the output of the PV panels, the temperature effects on the battery were not included. Further, a single MSOC was used in the analyses (50 percent mostly).
In this paper, and for the first time, we quantify the financial implications of sizing PVB at various SOC levels below the typical 50 percent level, while simultaneously incorporating temperature effects on the energy content of the battery and on its calendar life. Further, the effects of different load profiles have been quantified and integrated into the analysis. To the best of our knowledge, no previous study has performed this analysis while taking into account all these factors collectively. Another important factor that distinguishes this study is the granularity level reached: we use hourly load profiles and hourly temperature profiles as these factors have a considerable impact on the economics. We find that it is more cost-effective (from a net present value perspective) to allow the battery to discharge to lower-than-typical MSOC values and replace a lower number of batteries more often, compared to a case where we discharge the battery to higher MSOC values and replace a larger number of batteries less often. Explicitly, using a high MSOC can increase the net present cost by up to 68 percent. Further, while the study was calibrated to Saudi weather, the results and insights extracted are also applicable to other countries with similar weather conditions.
2. Review and Motivation
In an ideal setting, sizing of storage systems is a direct calculation. Assuming a daily load of 10 kW h for example, then a 10 kW h battery is required. If three days of autonomy are desired, then the number of batteries required becomes three. Further, if the minimum acceptable SOC were to be chosen as 50 percent, then the total number of batteries in the battery bank would be six. When solar generation, loads, temperature effects, and inverter-sizing factors are included into the analysis, the above back-of-the-envelope calculation becomes insufficient in capturing the details of operation [23], let alone perform an optimization for the system.
The literature has covered various aspects of incorporating storage into a power system including policy [24], reliability [25], economics [26], and life cycle cost–benefit analyses [27]. Furthermore, the studies tackled standalone [16] and on-grid systems [28]. Most of the studies, as expected, were focused on residential applications given the challenges associated with utility-scale storage. Nonetheless, utility-scale storage has also been considered in some studies [29,30]. We also note that microgrids can include diesel generation [31,32]. However, given the negative environmental consequences that diesel causes, there is growing interest in displacing diesel with renewable technologies [33,34].
With the exception of batteries, the capacity of all generation technologies is defined in watts (W) and the costs are defined in dollar-per-watt ($/W). In other words, when deciding on the capacity to be installed, the capacity is given in power terms. Battery capacity, on the other hand, is defined in energy terms, i.e., watt × hours (Wh) or in ampere × hours (Ah). As a result, battery costs are defined in $/Wh terms. As such, defining the cost of a hybrid system containing a battery component is not an area of consensus. The U.S. based National Renewable Energy Laboratory (NREL) in collaboration with Rocky Mountain Institute (RMI) resorted actually to comparing systems based on the total required cost only given the difficulty in arriving at a reliable metric [35].
For a single technology, calculating an average cost of generation for the entire system, commonly referred to as the levelized cost of energy (LCOE), is relatively straightforward. However, when dealing with a mix of technologies, arriving at the LCOE becomes more difficult especially if a renewable source is part of the mix. The ‘value’ of a kW h generated from PV during off-peak hours is not to be equated to that being generated during peak hours; associating an appropriate monetary value to such a role for PV is not immediately apparent. Similarly, storage systems add an additional dimension of complexity when integrated into a power system as they are dispatchable, contribute to system reliability, but require to be charged. Certainly, the literature does not agree on how the overall generation cost of a system possessing storage should be calculated. Many papers have tackled this topic and presented relatively complex methodologies to derive a generation cost for a PVB [36,37].
The battery lifetime and performance are heavily dependent on a number of factors including for example temperature and how deep the batteries are discharged (MSOC, as mentioned in the previous section). Although chemical studies have been performed to assess the effect of corrosion on battery performance [38], such studies are not typically included when analyzing PVB for simplification purposes. Thus, in this paper, we will perform a techno-economic analysis for a standalone PVB while taking into account temperature and SOC effects on battery lifetime. Note that the temperature effects that would be considered are twofold: the effects of temperature on the watt-hour battery capacity, and the effects of the temperature on the lifetime through the degradation that occurs with cyclical charging and discharging.
In Table 1, we provide a review of papers that have performed sizing and optimization analyses for a PVB. Based on this review, we see that no reference has taken into account the temperature effects and a varying MSOC level in their design while simultaneously considering different load profiles. This finding served as the main motivation for this work.
Higher temperatures cause a reduction in the power output of PV modules, which should be considered when sizing the PV array and the battery bank as well. PV modules also suffer from a small, but nontrivial, degradation to their output with age. Given these numerous parameters and interlinks, this paper will attempt to provide a detailed assessment of PVB considering simultaneously the temperature and aging effects that PV modules and storage systems suffer from.
3. Methodology
3.1. Financial Assumptions
As mentioned earlier, quantifying the value of the energy provided from an intermittent source is not straightforward. When batteries enter the generation mix, the problem becomes even more difficult. From a homeowner’s perspective, we note that the value of a PVB in an off-grid application is different from an on-grid application. Many authors have researched this problem. However, the topic is currently far from consensus given the numerous parameters that need to be considered and assumptions that have to be made.
For example, Pawel [37] derived an LCOE for a storage system, but his analysis required that an assumption on the value of the stored energy be made, which is debatable. In fact, Pawel suggested to resort to the net present value method to gain better insight on the business case. Another paper by Jülch summarized the levelized cost of storage (LCOS) for a number of storage technologies after deriving an expression for the LCOS [46]. This latter reference, however, did not consider what the overall LCOE of a system that includes storage would be. Other authors have introduced an additional metric, i.e., the levelized cost of delivery (LCOD), and recommend using it alongside the LCOE metric to assist policymakers in understanding cost implications of introducing storage into a power system [36]. Other methodologies also exist [47,48]. A recent study introduced some novel metrics in the hope that they will be used in the near future to estimate generation costs of systems with storage [49].
For the purposes of this paper, and keeping in mind the deviation in current LCOE assessments of systems with storage, we will resort to the net present cost (NPC) when comparing the different scenarios. Explicitly, we follow the same route that has been pursued by NREL [35]. We will not associate any cost with the actual energy generation from the solar PV panels or from the battery, and we do not associate a value to the capacity of the storage available. In other words, we will assume that the marginal cost of generating electricity from both sources is equal to zero exactly; this also includes the energy that is charging the batteries from PV. Under these assumptions, the only costs that will be considered are the capital costs (PV and battery), the cost of operation and maintenance, and the cost of battery replacements. With that, the optimum size of the system becomes the one that yields the minimum NPC. The financial and technical analysis will be carried out through HOMER, which is a commercially available software specialized in hybrid microgrid analysis.
3.2. Load, Irradiation, and Temperature Profiles
Most battery manufacturers recommend that batteries should not be drained to low SOC levels—this is to prolong the lifetime of the battery. Clearly, if the load to be satisfied is mainly diurnal, then the PV panels would be meeting the load and the batteries would not need to discharge much of its stored energy. However, if the load being satisfied is mainly occurring during the night, then the batteries would be satisfying the load and thus discharging deeper than the above-mentioned case. Applying different load profiles will directly impact the way in which the energy in the batteries is being depleted, and will also impact the number of required replacements throughout the project lifetime.
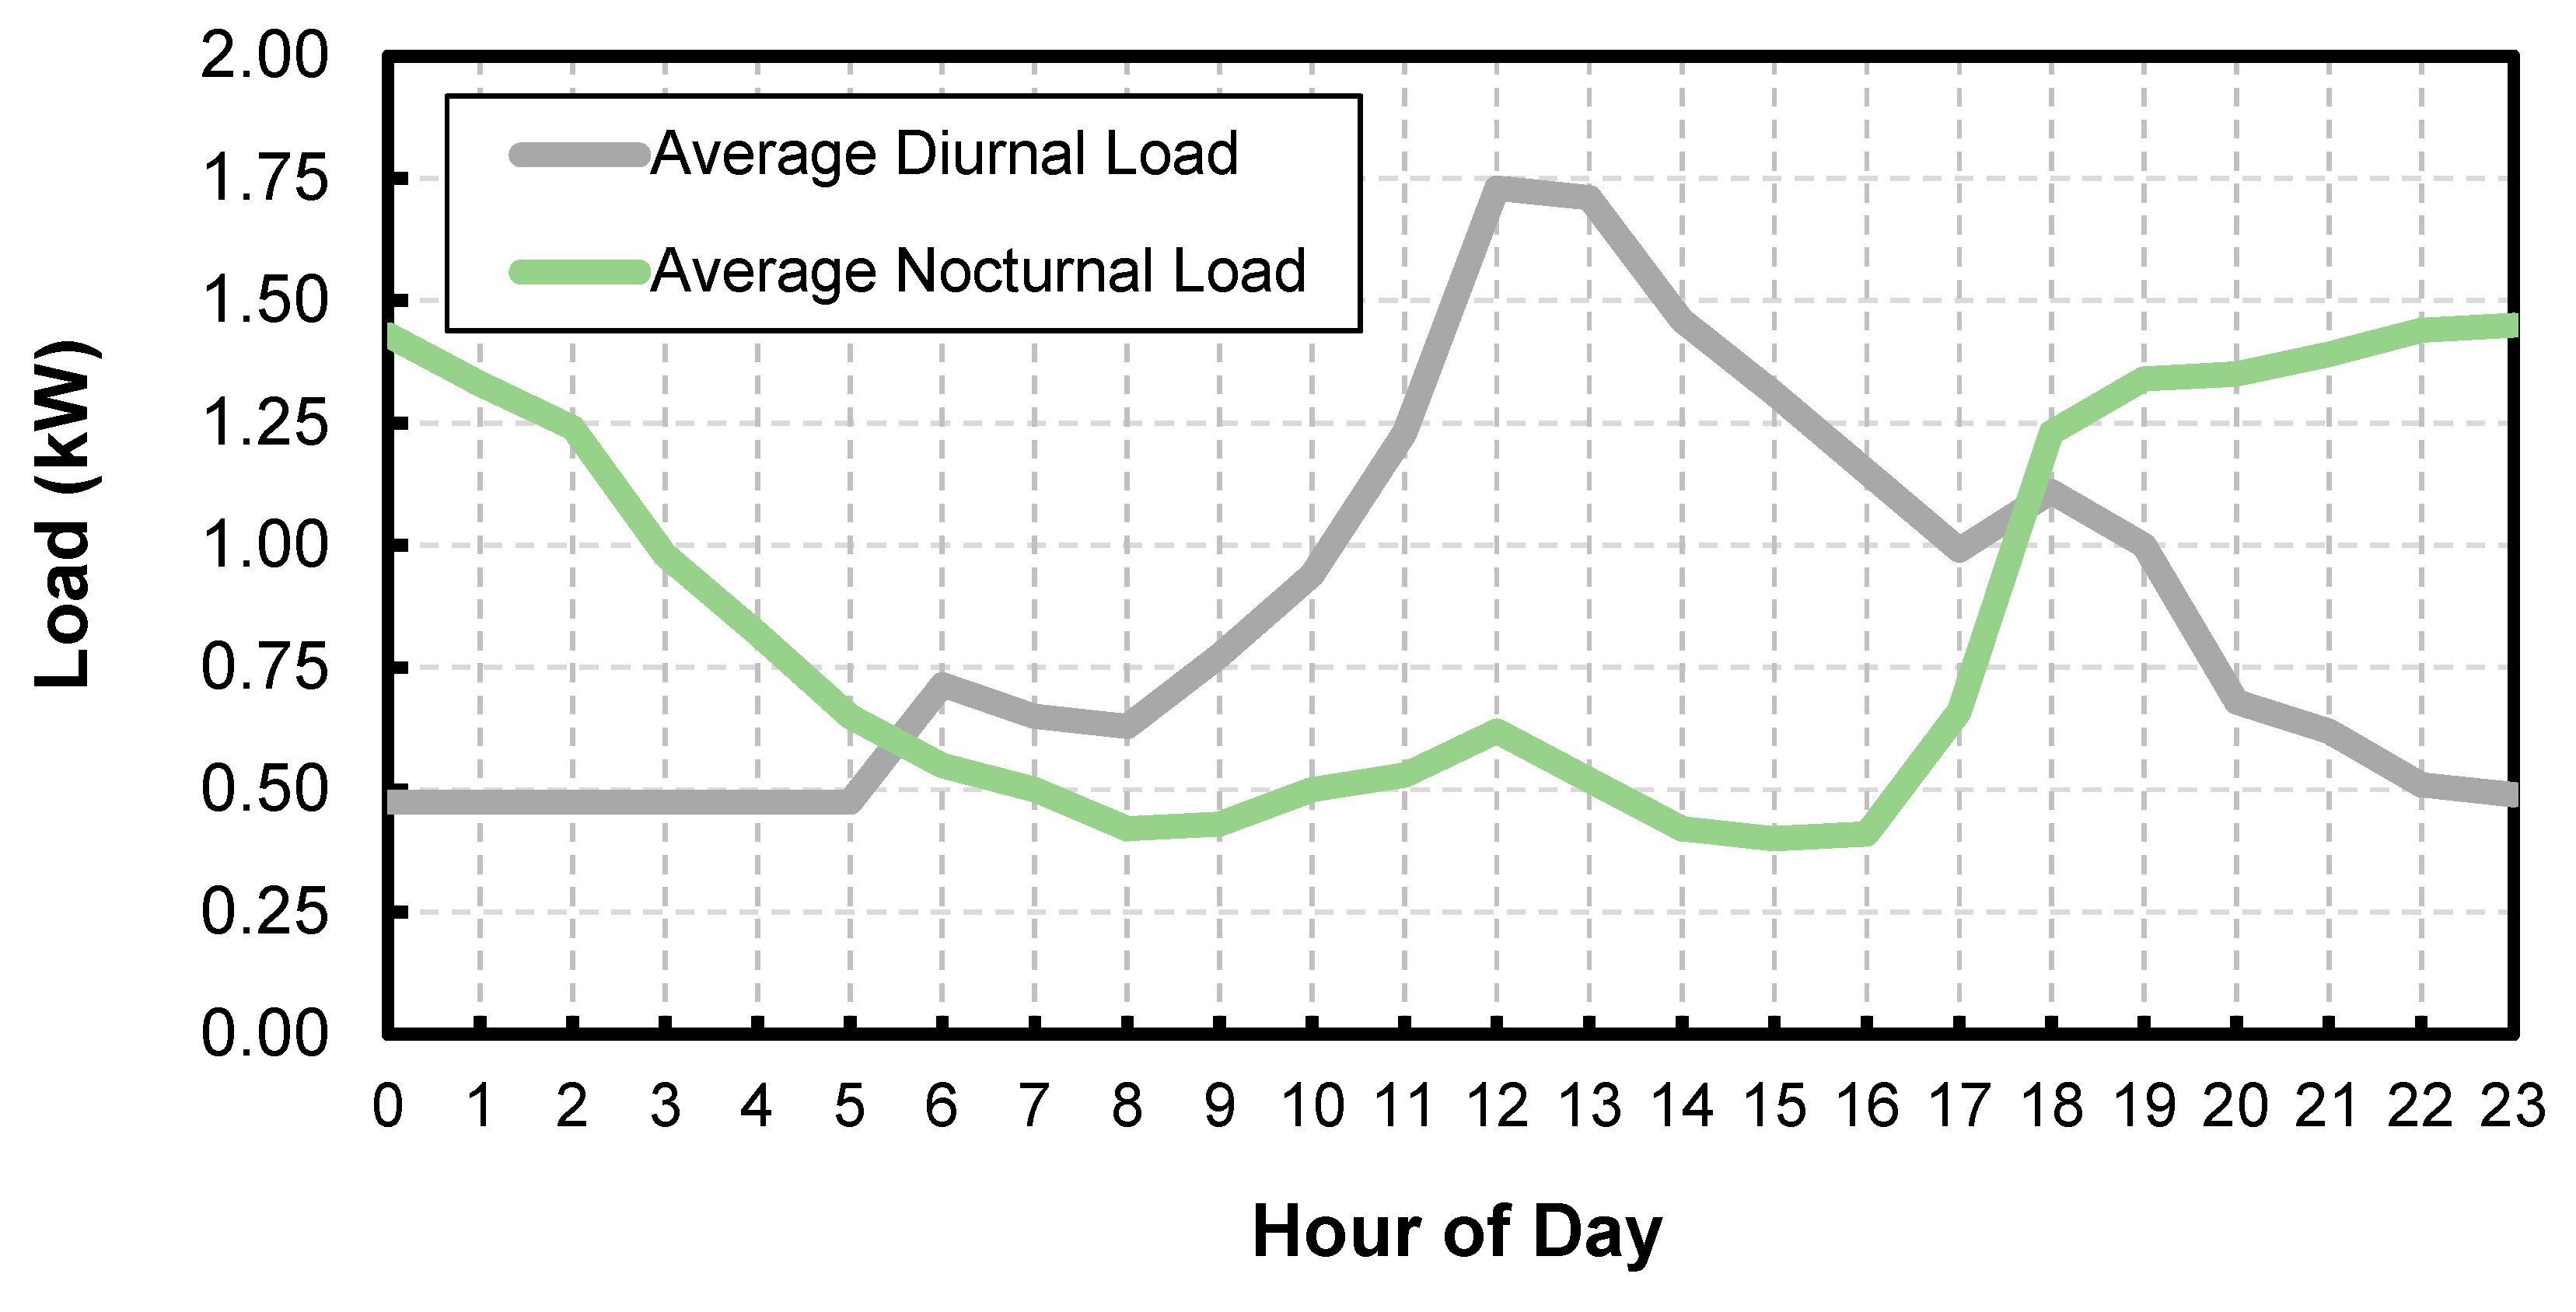
Assessing the impact of different load profiles on battery performance has been considered previously [40,45], but the financial implications were not highlighted with respect to a varying SOC value. For the purposes of the study in this paper, and in interest of keeping the optimization tractable, we restrict the load scenarios to two: a mostly diurnal load and a mostly nocturnal load. For both load profiles, an average daily load of about 20 kW h was studied, which was based on a consumption of a small dwelling in a rural area. For the details, please refer to Table A1 in Appendix A. The load was also modeled throughout the year with an hourly resolution, i.e., 8760 h were considered. Although the profile stays the same, the consumption level does vary between months. Figure 1 shows the average load profiles for the diurnal and nocturnal loads used in this study.
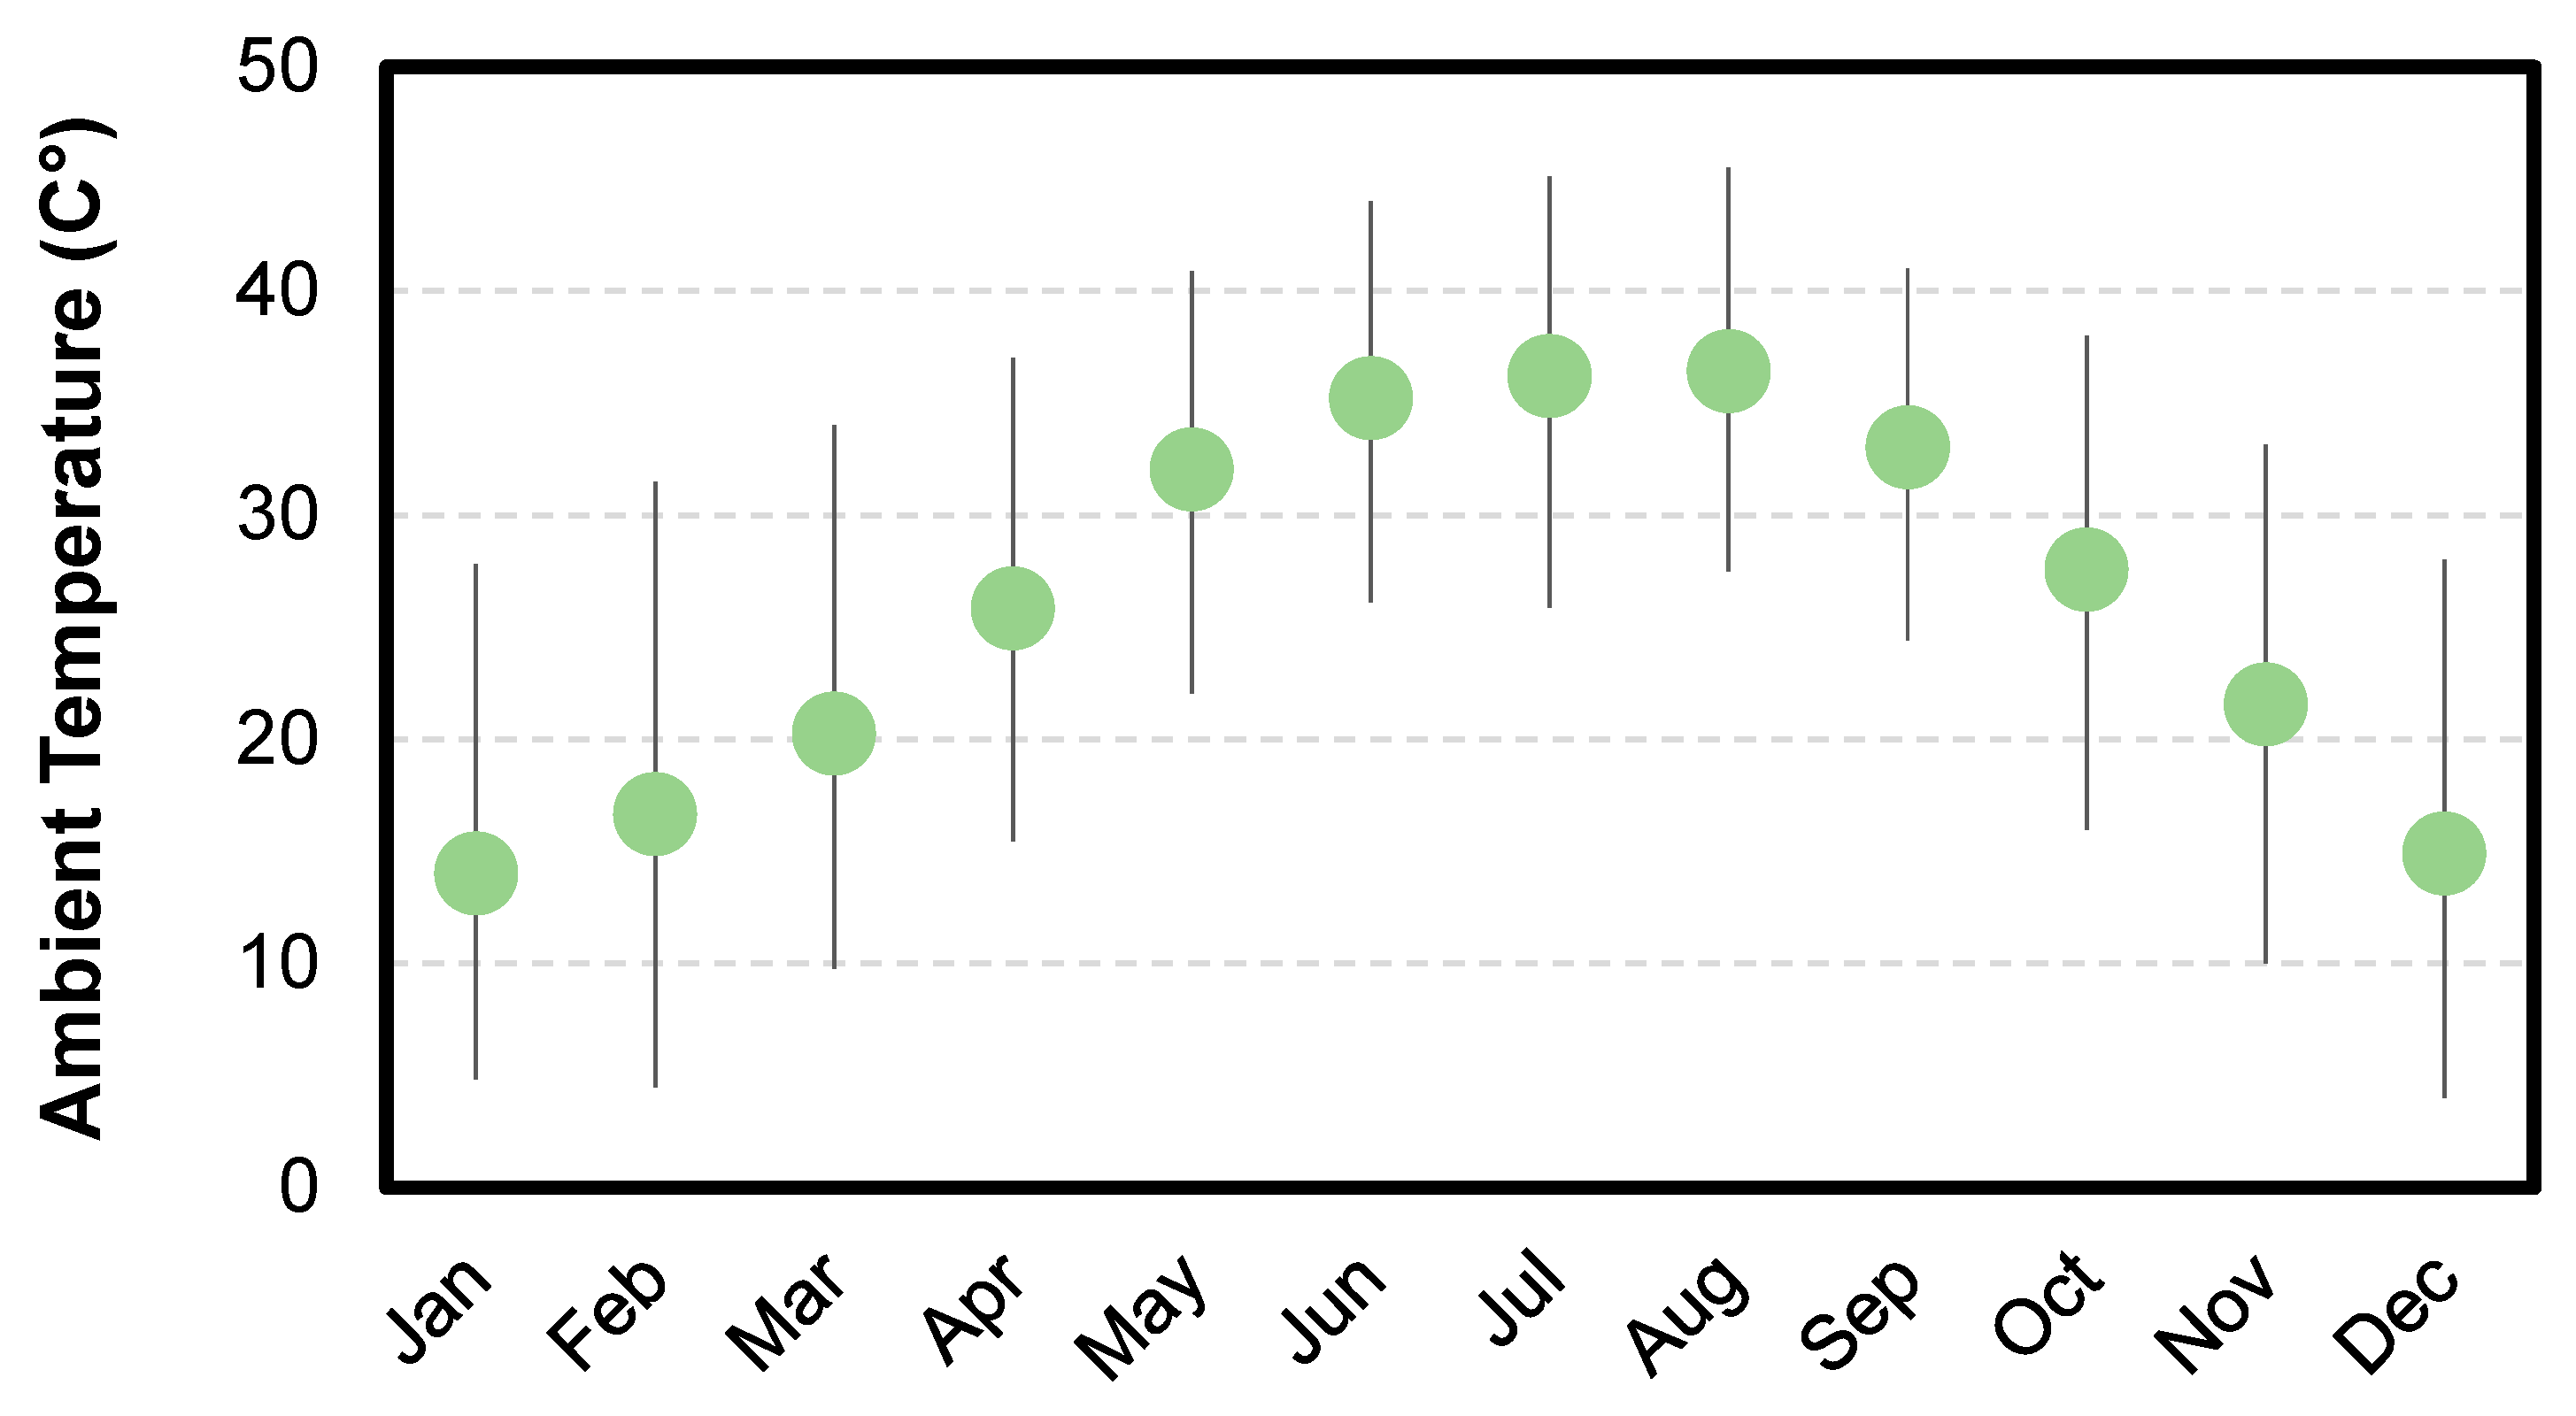
The effects of temperature are of paramount importance in this paper. The standalone system considered in this study is assumed to be in Riyadh, Saudi Arabia, which is a city that witnesses hot and arid summers. We use 8760 h of temperature data to represent the year (temperature data was collected from Energy Plus Weather Data: https://energyplus.net/weather). In interest of brevity, only the average temperatures per month are summarized in Figure 2. As for the solar profile, once again, 8760 data points of solar irradiation per year were used.
3.3. Technical Assumptions
3.3.1. Overall System Assumptions
For the overall system, and as shown in Table 2, the analysis time period was assumed to be 25 years, with a 5 percent discount rate and a 2 percent inflation rate. Further, we assume that the load is to be met at all times. The latter assumption is directly tied to the days of autonomy, or, in other words, to the number of days that the battery can provide energy for without PV aid. For this study, the days of autonomy are assumed to be two. As the number of assumptions is large, it is important to state them explicitly for both sub-systems (i.e., PV and storage).
3.3.2. PV Assumptions
The capital expenditure chosen was 2 $/W, which is within the range of global averages for residential systems. The rest of the assumptions are summarized in Table 3. It is worth noting that the derating factor, which is the parameter that describes the overall losses of the PV system, is 85 percent, and this factor does include the losses of the inverter (a derating factor of 85 percent means that the PV system is 85 percent efficient, i.e., the system losses are 15 percent). Note that the derating factor strictly models the losses that occur in the PV system. The losses occurring in the storage sub-system will be modelled separately.
3.3.3. Battery Assumptions
In Table 4, the assumptions for the battery sub-system are presented. The technical parameters come from the specification sheet of the battery chosen. The battery witnesses losses when charged and when discharged. For example, assume that a battery has a 95 percent charge efficiency and a 90 percent discharge efficiency. The latter means that if the battery is charged with 100 kW h, it would only receive 95 kW h. Similarly, when it discharges these 95 kW h that were received, it can only deliver 85.5 kW h. The roundtrip efficiency for this case would be 85.5 percent (i.e., the product of both efficiency values).
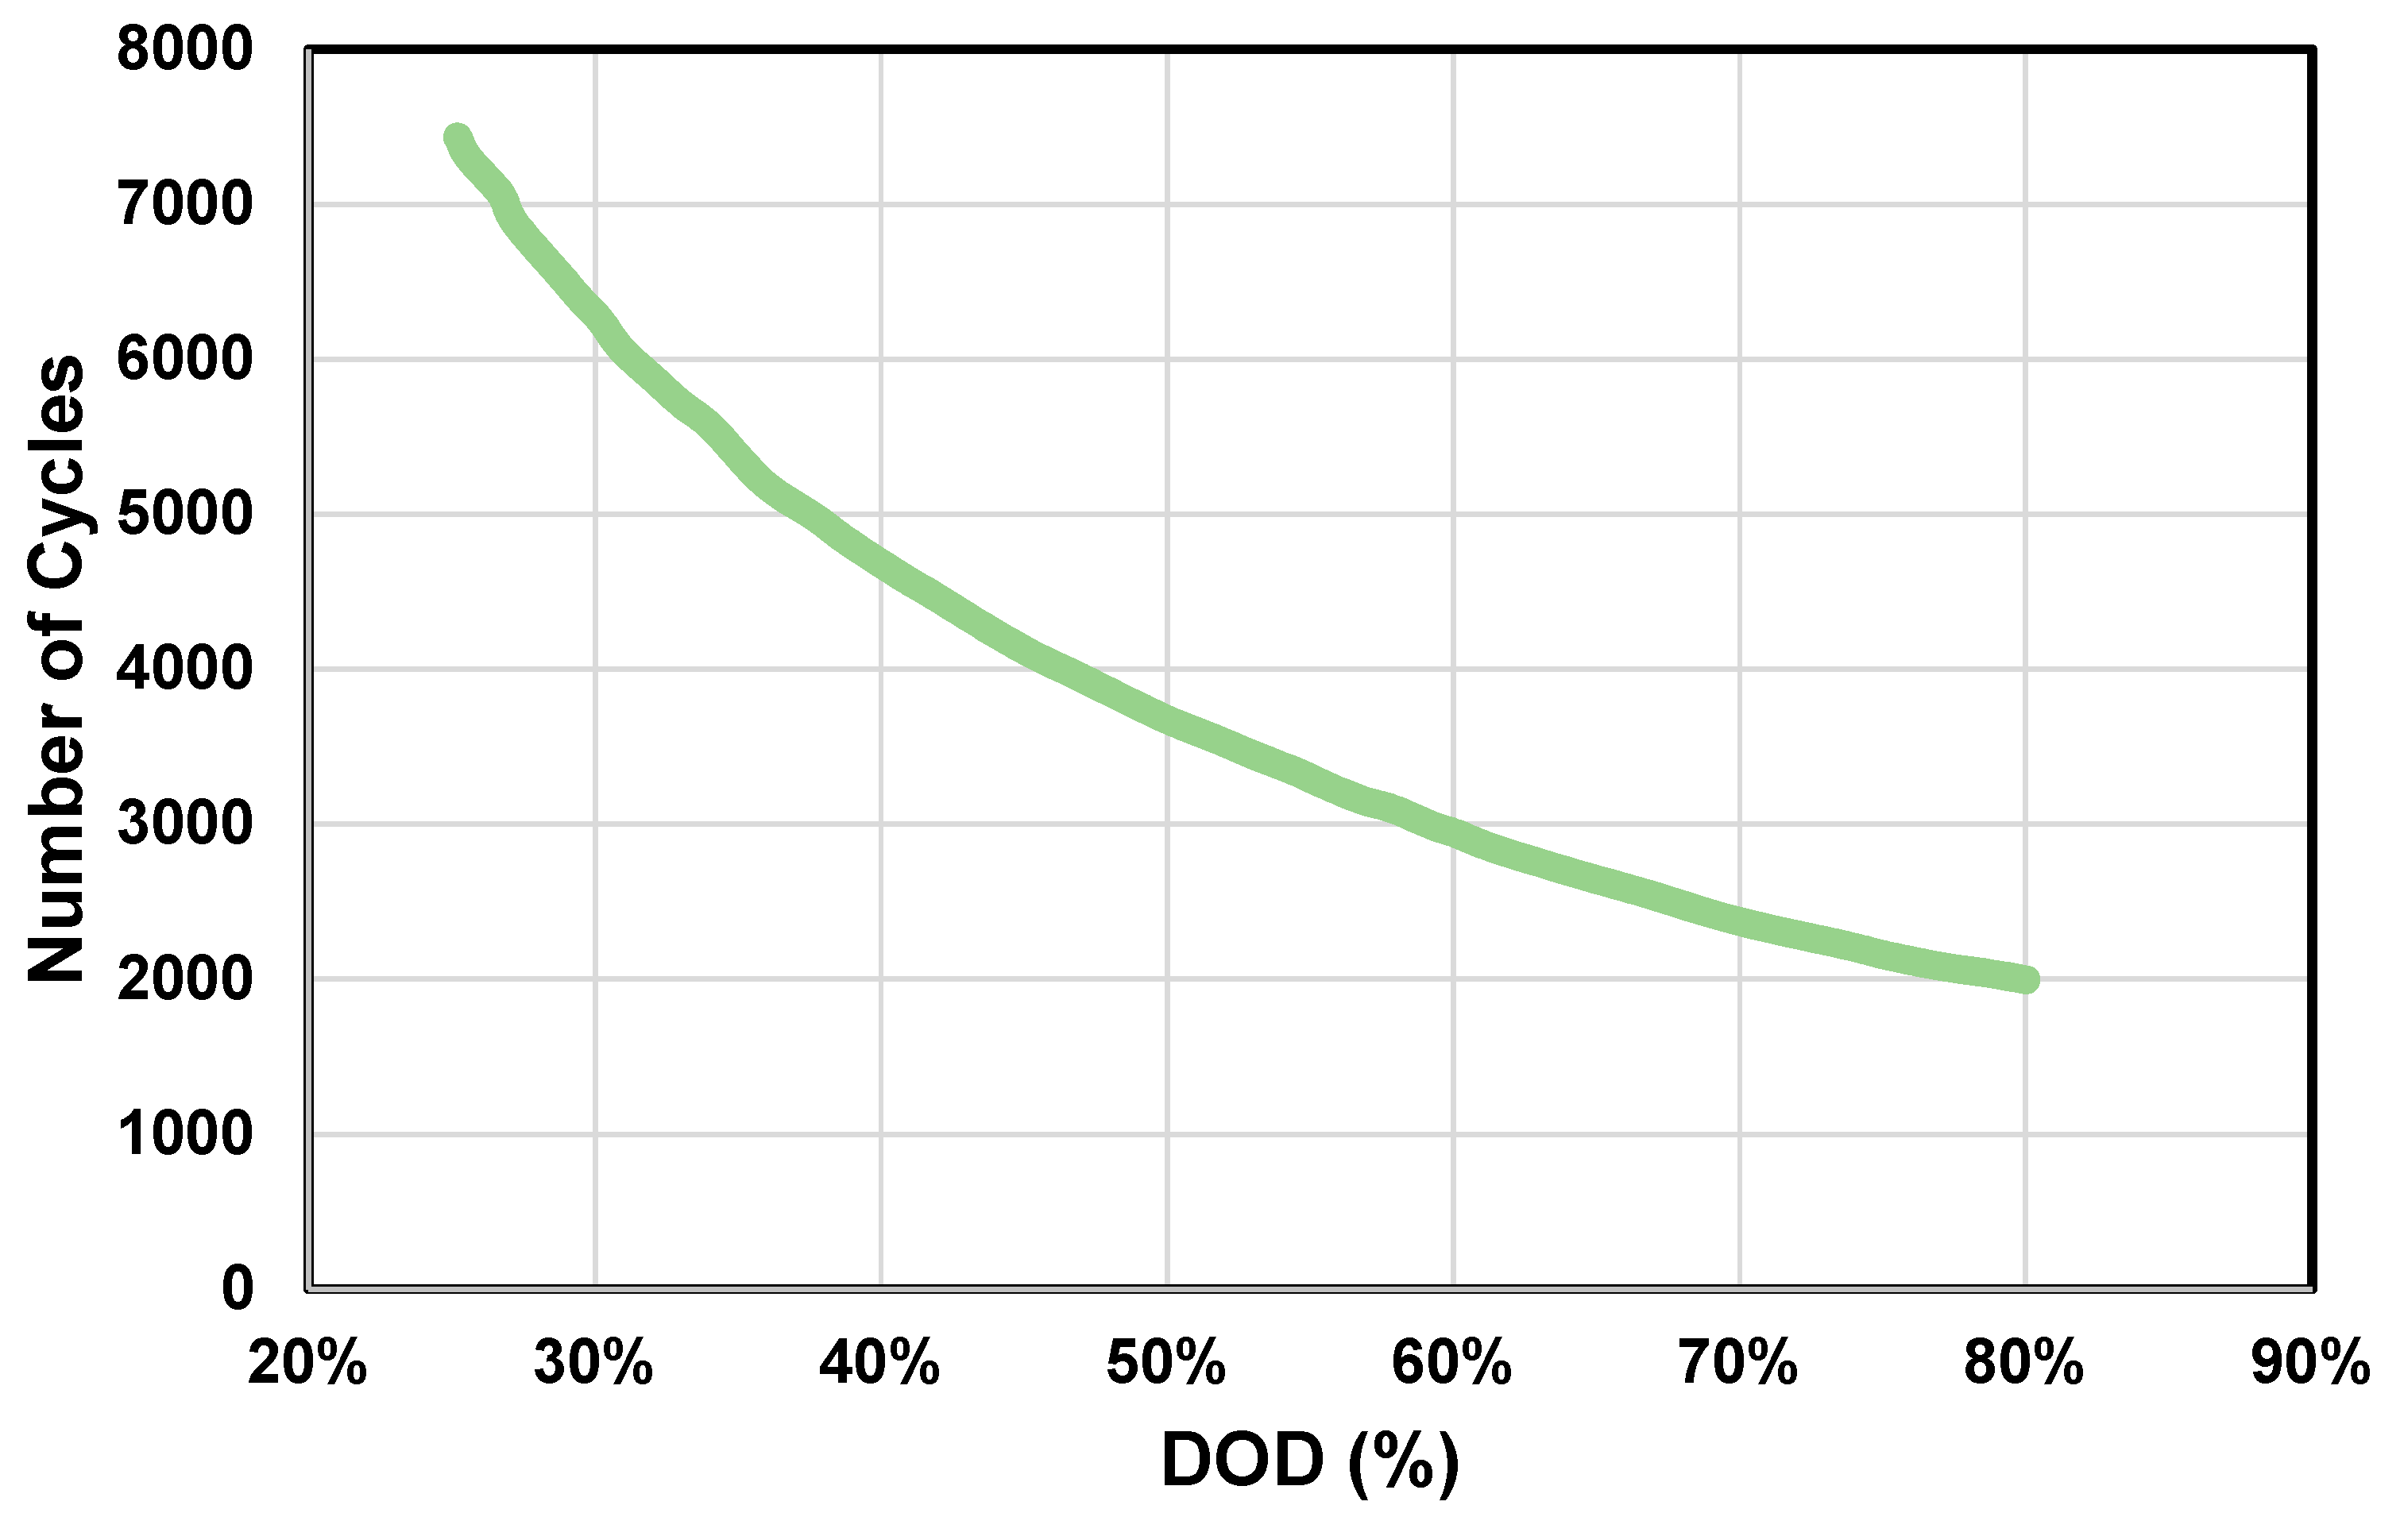
The nonlinear relationship between the number of battery cycles and the SOC (equivalently DOD) is depicted in Figure 3 as provided by the manufacturer. The figure clearly indicates that the lifetime of the battery can be reduced by nearly a third depending on how deeply the battery is depleted. From Figure 3, a relationship that governs the numbers of cycles to failure and the DOD (or SOC) is deduced as:
where N is the number of cycles, and α and β are constants to be fitted which equal 1.321 × 10⁻⁴ and 1.169, respectively. From Equation (1), an estimated throughput is derived via the Rainflow Counting Algorithm as detailed previously [50]. Note that the throughput is different from the calendar lifetime. The replacement of the battery will occur when the throughput or lifetime is reached, whichever comes first.
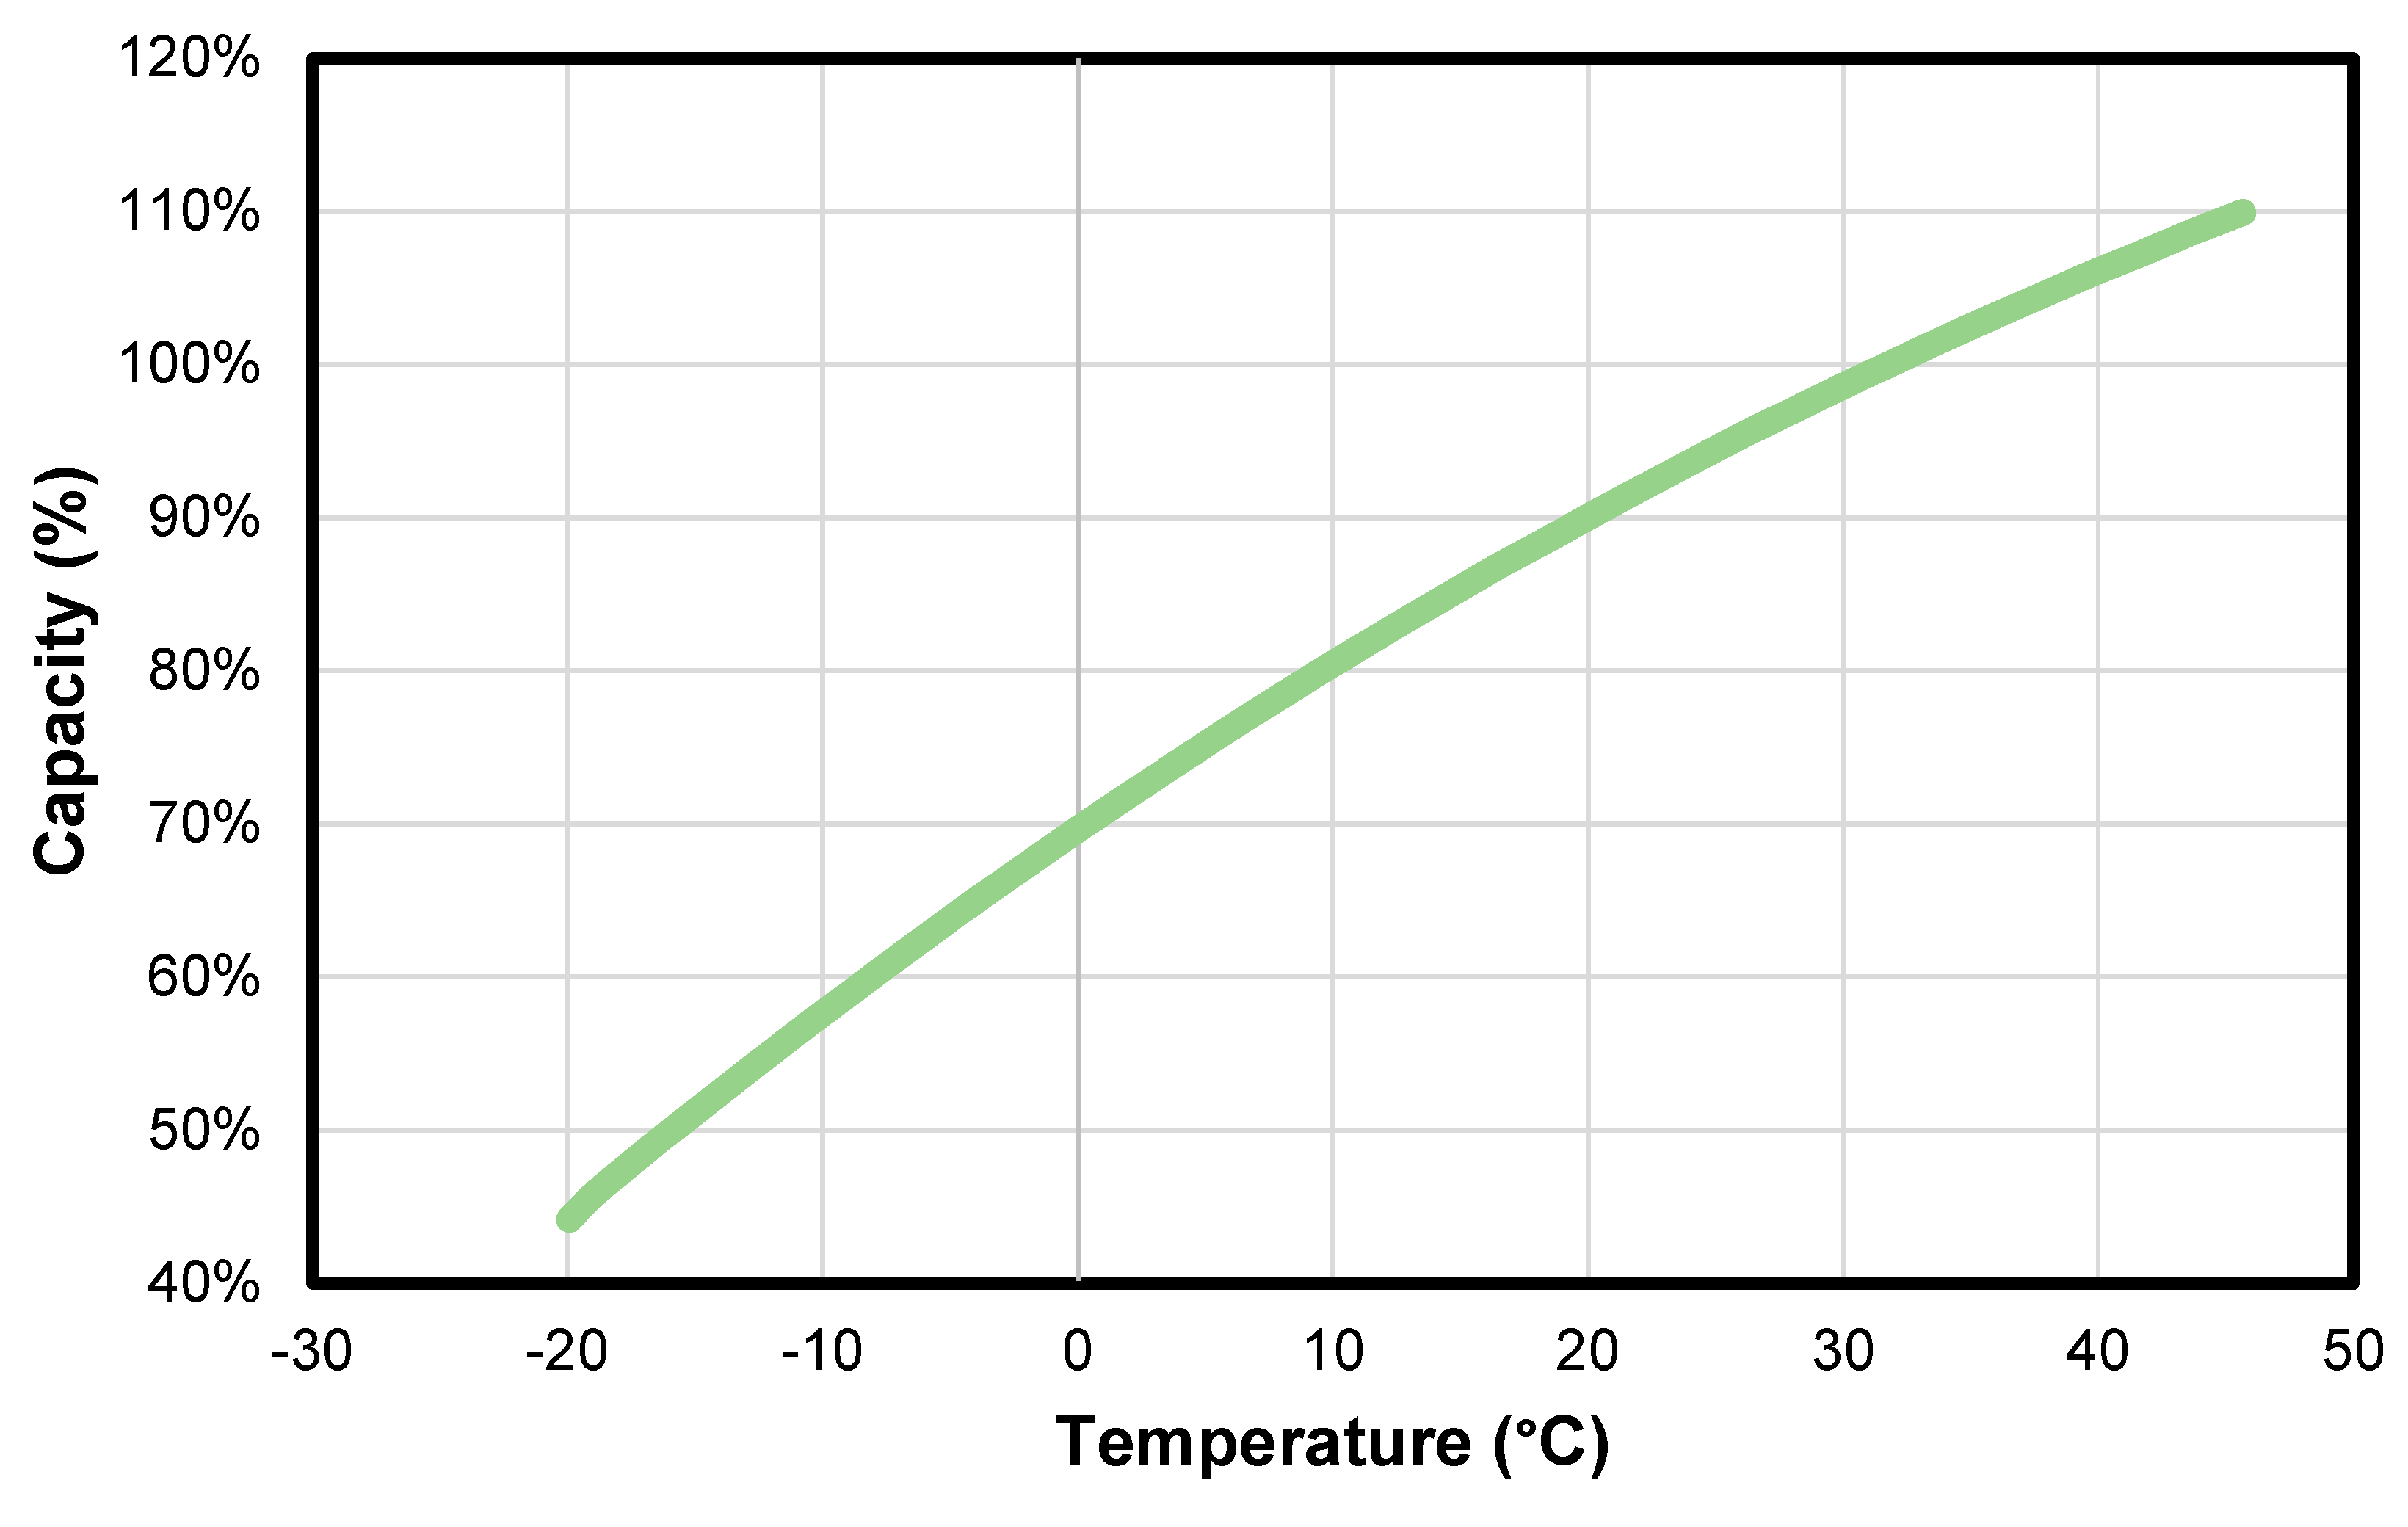
In Figure 4, the relative battery capacity is provided with respect to the temperature. In line with the capabilities of HOMER, a second order polynomial is assumed to describe this behavior. A second order model strikes the right balance between result accuracy and model simplicity. Explicitly:
where BC(T) is the battery capacity as a function of temperature, NBC is the nominal battery capacity, δ0,1,2 are the fitted parameters based on the data available, and Tc is the temperature in degrees Celsius. Based on the provided data sheet, the fitted parameters were calculated as: δ0 = 0.706, δ1 = 0.0113, δ2 = −6.3981 × 10⁻⁵.
The temperature effect on the lifetime of the battery will be considered using the well-known Arrhenius equation. In simplified form, the Arrhenius equation can be written as:
where k is the rate of increase in degradation, μ1,2 are fitted parameters, and Tk is the temperature in degrees kelvin. Based on the typical characteristics of lifetime of lead acid batteries versus temperature [51], μ1 and μ2 were calculated as 71,165.2 and 7234.3 respectively.
4. Results and Discussion
With all the assumptions documented and the methodology explained, we can now provide the results from our analysis. Recall that the paper is attempting to quantify the effects of hot climates on standalone PVB at different MSOC levels and different load profiles. We first present the results for the diurnal load profile.
4.1. Diurnal Load Results
In Table 5, we summarize in the top half the financial results along with the optimum size for the PV system and the battery bank incorporating the temperature effects for different MSOC constraints. Note that because the battery possesses a nominal voltage of 6 V and the battery bank voltage was chosen to be 24 V, there will be 4 batteries in each string. In other words, the total number of batteries allowed in any configuration will be a multiple of 4 to ensure a bank voltage of 24 V is always met.
As can be seen, the minimum NPC appears at a MSOC of 20 percent. From the results acquired, it is seen that replacing a lower number of batteries more often is more economic than replacing a larger number of batteries less often. In the latter, the overall number of batteries replaced throughout the lifetime of the project is smaller than the former. Note that the number of replacements and the total number of batteries used throughout the lifetime of the project for the 20, 30, and 40 MSOC is the same, but is higher in the 50 percent MSOC scenario. However, in order to meet the more stringent requirement of the higher MSOC, the model chooses to increase the PV system size. We note that the battery costs include also their installation costs.
At the 50 percent MSOC level, a large PV system will no longer be able to meet this SOC level, hence the model resorts to a larger battery bank. The larger number of batteries in this case results clearly in a higher NPC and a larger number of batteries required throughout the project lifetime. Note that the minimum NPC is not achieved at 50 percent MSOC, which is the commonly accepted design value. Rather, it is achieved at 20 percent. Explicitly, the NPC at 50 percent MSOC is higher by 68 percent compared to the NPC at 20 percent MSOC.
With stricter design constraints, i.e., as the MSOC value is raised to 60 and 70 percent, the number of batteries required grows exponentially. We note here that the theoretical solution of 108 batteries as arrived at by the model is technically problematic. Battery manufacturers recommend no more than 4–5 strings to be connected in parallel to ensure charge balancing between the strings. Hence, a battery of 108 batteries (i.e., 18 strings) is not practical, and a different battery possessing different characteristics should be sought.
In order to assess the effect of temperature on our results, we re-ran the analysis without incorporating temperature effects. The results are shown in the bottom half of Table 5, where there is a significant difference in the NPC between both cases. Excluding the case where the MSOC is set to 70 percent, the more realistic scenarios which incorporate temperature can more than double the NPC. The additional costs that stem from incorporating the temperature effects are due to the additional battery replacements required.
4.2. Nocturnal Load Results
Adopting the same rationale, Table 6 shows the optimum sizing for a case where the load occurs mainly during nighttime. Once again, we note that the optimum scenario does not occur at the widely accepted rule-of-thumb MSOC value of 50 percent MSOC. Although a lower MSOC means that the homeowner will replace the batteries more often, the total number of batteries that will be bought throughout the lifetime is smaller. Note that in all cases, the days of autonomy condition is always met. In other words, the additional cost that is incurred by the homeowner by specifying a higher MSOC is not fully justified.
Because the load is mainly nocturnal in this case, the batteries will have a larger contribution of meeting the load compared with the previous case and hence higher throughput. Thus, and as expected, we see that the number of batteries required is higher (and so is the NPC) in order to satisfy the MSOC condition. Although there is small reduction in the PV system size and hence its initial cost, these savings are shadowed by the larger number of batteries that is required to meet the load. Similar to what was shown above, we also show the results without accounting for temperature effects, and the differences are substantial—even higher than the diurnal load case.
5. Discussion and Policy Implications
5.1. Nocturnal Load Results
From the results above, we see that designing solar-storage systems while fixing the SOC constraint to 50 percent as generally practiced is not necessarily the most cost-effective route. Generally, higher MSOC translates to a larger battery bank and fewer replacements, whereas a low MSOC requires a smaller battery bank but more frequent replacements. In our analysis, the latter was less costly than the former. Further, and from a temperature perspective, high ambient temperatures increase the battery capacity. In other words, additional discharge power is available before reaching the MSOC that was defined at a temperature of around 25 °C. In the case of Riyadh, Saudi Arabia, this effect can affect the economics significantly as there are more than 100 days where daytime temperatures rise above 40 °C.
The additional effort of trying to capture the dynamics of the system while incorporating temperature is not only worthwhile from a financial perspective. Note that the larger the number of batteries required translates to additional space requirements. If the space is not available, then a different battery with a different capacity should be sought, which may require a different bus voltage and hence require a different inverter. Incorporating the effects of temperature early in the design phase prevents underestimating cost and space requirements, and can also impact the choice of components.
Comparing the results between the diurnal and nocturnal loads, we see, as expected, that the costs to satisfy nocturnal load are substantially higher than diurnal loads. When a higher MSOC is desired, clearly a larger PV size array or a larger battery bank can serve this objective. However, a larger PV array will most probably be the cost-effective option when the load is mostly diurnal. If the load is mostly nocturnal, then the specifics of the load and discharge patterns that occur will determine the most economic option.
Based on the analysis, we see that incorporating temperature, load, and MSOC parameters affect the economics and space requirements of PVB systems significantly. As we noted in the previous section, incorporating temperature effects can more than double the number of batteries replaced throughout the lifetime of the ‘project’. It was shown how the NPC varies quite remarkably between the different cases. Although the NPC considers the initial capital, we have to explicitly affirm how considering these parameters has an immense implication on the capital required. From the perspective of a homeowner, who may be considering to power his home via a PVB, a diesel generation or a hybrid of these, the comparisons will not be meaningful if these operational details are not taken into consideration.
The same argument applies for governments trying to electrify rural communities [52] that have no power—programs knows as rural electrification programs [53], reduce diesel consumption in communities that rely on diesel [8], or completely displace diesel in these communities [54]. Table 5 indicates that using a MSOC 20 percent reduces the net present cost of single home to nearly $70,000 compared with $117,000 when a MSOC of 50 percent was used. Note that if the government is to fund a program of electrification for a village of 1000 homes, then the net present value of the savings over the lifetime of the project reaches $47 million.
For PV applications for example, ignoring the annual panel degradation may not necessarily affect the overall policy direction. However, and in the case of storage systems, ignoring the temperature effects can result in false economic conclusions which can entirely skew the decision-making process. Accounting for temperature provides a more realistic estimate of the financial commitments needed for endeavors encompassing rural electrification and/or diesel displacement.
5.2. The Diesel Alternative
A natural question that may arise here would be related to the overall cost of satisfying the load with diesel only. Hence, we answer this question by rerunning the model created but stipulating that the demand is met by diesel generator(s) and no batteries. To allow a fair comparison, we assumed that the load will be met at all times, which was the same constraint that applied in our previous analysis. In this effort, we deduced the cost of meeting the load if each home owned an independent generator(s) and if the community were to be powered through a diesel-only microgrid. In the case where each home is powered independently, no grid establishment/maintenance costs would be incurred. However, in the microgrid scenario, more efficient generation would be attained due to economies of scale. Large-storage was not considered since they have not matured yet as explained earlier.
In the independent generation and microgrid scenarios, at least two generators would be needed in order to ensure stable supply: one generator would be available at times when the other is undergoing maintenance or being replaced. As expected, and after consulting with several diesel generator provider websites, it was found that smaller generators tend to possess a higher $/W cost and relatively lower efficiency. In addition, the costs of generators vary widely (~0.20 $/W to 1.5 $/W) depending on the manufacturer and additional functionalities the generator may possess (digital panel, electric startups, low-noise, etc.).
For the load under consideration in the individual homeowner scenario, air-cooled diesel generators were used, and these types of generators typically possess lifetimes of less than 3000 h. On the other hand, for the microgrid scenario, a larger diesel generator that is water-cooled would be used, and these possess lifetimes of about 15,000 h. Once again, specifications vary between different models. Table 7 summarizes the assumptions used for both types of generators in our analysis. The discount rate and project lifetime remain the same as indicated in Table 2.
Based on these assumptions, we compare the costs of delivering energy to 1000 homes and summarize the results in Table 8. Note that we have considered several diesel prices that range from 0.10 $/L to 1.5 $/L. These prices reflect actual ranges in many countries worldwide; in fact, prices can reach as high as 1.7 $/L in many countries including for example UK, France, and the Scandinavian nations. The price of diesel in Saudi Arabia, however, for the utility and industrial sectors is 0.10 $/L, and is 0.13 $/L for the transportation sector.
The first observation that could be made about Table 8 is the expected cost difference between the individual generation scenario and the microgrid scenario. Although the individual generation scenario is not entirely practical, it is included herein for comparison and comprehensiveness purposes. As expected, the microgrid scenario is more economic and is also more environmentally friendly. The larger-size generators use the fuel more efficiently and hence emit less carbon.
It is worth noting the difference between the microgrid scenario and the PVB scenarios. Notice how attractive the scenario of PVB without temperature inclusion seems to be at a first glance—it costs nearly half of the case for a microgrid at a diesel price of 0.10 $/L. However, and as shown in this paper, excluding the temperature and MSOC effects from the analysis results in a significant underestimation of the actual costs. A more realistic cost would be in the range of 100 million dollars at a MSOC of 30 percent.
At the current prices of diesel in Saudi Arabia, the microgrid options can be considered cost-effective. However, Saudi Arabia has embarked on an energy price reform journey that will likely result in an increase in primary fuel prices (including diesel) and end-user electricity prices. Note that at 0.50 $/L for example, the cost of a microgrid becomes 105 million dollars while the cost of a PVB scenario remains the same as it is independent of diesel prices. As indicated in Table 8, a PVB avoids burning around 2 million liters of diesel, and avoids emitting more than 5000 tons of carbon.
In our analysis here, there were three parameters that were not included: (1) the likely learning curves (i.e., cost reductions) that storage systems would follow [55], (2) the costs of maintaining the distribution network in the microgrid scenario [56], and (3) the costs of externalities [57]. The latter may be represented by a carbon tax for example for every ton of carbon emitted in the microgrid scenario. These factors, if considered, will make the case for a PVB more favorable. Based on the assumptions used in this paper, we deduce that the microgrid scenario and the PVB (incorporating temperature) would possess the same net present cost if the diesel price were set at ~0.34 $/L. Note that this figure is to always be associated with the assumptions made in Table 7. Changing the values in Table 7 would obviously affect this value. However, it is a representative value that could serve as a benchmark for further policy discussion.
6. Conclusions
This paper has quantified through a technoeconomic model the financial implications of considering temperature, various state-of-charge values, and different load profiles on standalone solar PV systems battery storage in a hot environment. It found that representing the battery performance more realistically by incorporating temperature effects increases the net present cost by at least 73 percent in the case where the load is mainly diurnal. The situation is further exacerbated for mostly nocturnal loads; accounting for temperature effects here at least doubles the net present cost. What distinguishes this paper from other papers with respect to the temperature incorporation is that it has considered, simultaneously, the effect of temperature on battery capacity and lifetime, different load profiles, and different minimum allowed state-of-charge values.
When installing solar-storage systems, the literature mostly recommends that the battery capacity should be chosen while ensuring that the battery does not deplete its capacity below 50 percent. This rule-of-thumb is advised not to damage the battery terminals, which worsens the battery’s state-of-health and, thus, shortens the battery’s lifetime [58]. Based on our study, we find that, in hot climates, specifying a lower minimum state of charge can still satisfy the reliability considerations while achieving a lower net present cost. The latter occurs because the capacity of batteries increases at higher temperatures which means there is more stored energy to meet the load. The additional available energy means that fewer batteries are required in the bank which significantly reduces costs. We also note that the additional costs incurred due to more frequent replacements do not outweigh the savings achieved from the lower number of batteries required in the bank. As deep-cycle batteries are becoming more common, it is expected that lower state of charge values (i.e., below 50 percent) will continue to emerge.
The effect of the load profile on the costs in solar-storage systems was also quantified. Loads that are mostly nocturnal will require a larger battery bank compared to a case where the load is mostly diurnal. Over the lifetime of the project, a load that is mostly nocturnal can require 50 to 100 percent more batteries compared to a scenario where the load is mostly diurnal.
Although these findings are insightful in their own right, they can also provide context when compared to providing energy to a small community. Comparing the cost of delivering energy via a diesel-powered microgrid to a solar-storage system without incorporating temperature effects will misguide decision-makers with respect to the attractiveness of both options. Currently, we find that a diesel microgrid can be deemed as cost-effective compared to solar-storage system in some case (depending on load and state-of-charge). We also find that a diesel microgrid scenario and solar-storage system (incorporating temperature) would possess the same net present cost if the diesel price were raised to 0.34 $/L. Current diesel prices in Saudi Arabia for the industrial and utility sectors is 0.1 $/L.
Author Contributions
All authors contributed the work equally.
Funding
This research received no external funding.
Conflicts of Interest
The authors declare no conflict of interest.
Disclaimer
The views expressed in this paper are those of the authors and do not necessarily represent the views of their affiliated institutions.
Appendix A

Table A1.
Load breakdown for a small dwelling.
| Appliance/Load | Quantity | AC Watts | Hours On per Day | Wh/Day |
|---|---|---|---|---|
| Coffee maker | 1 | 800 | 0.2 | 160 |
| Microwave | 1 | 1300 | 0.15 | 195 |
| Iron | 1 | 900 | 0.25 | 225 |
| TV | 1 | 130 | 4 | 520 |
| Dishwasher | 1 | 1500 | 0.4 | 600 |
| Washing machine | 1 | 500 | 0.4 | 200 |
| Vacuum cleaner | 1 | 700 | 0.25 | 175 |
| Air conditioner (Room) | 1 | 1500 | 10 | 15,000 |
| Ceiling fan (AC) | 2 | 50 | 5 | 500 |
| Laptop | 1 | 50 | 3 | 150 |
| Lights (25 W) | 8 | 25 | 6 | 1200 |
| Refrigerator (22 ft3) | 1 | 68 | 24 | 1632 |
| Toaster | 1 | 1300 | 0.08 | 104 |
| Blender | 1 | 300 | 0.08 | 24 |
| Total | 20,685 | |||
References
- Rehman, S.; Al-Hadhrami, L. Study of a solar pv-diesel-battery hybrid power system for a remotely located population near Rafha, Saudi Arabia. Energy 2010, 35, 4986–4995. [Google Scholar] [CrossRef]
- Rehman, S.; El-Amin, I. Study of a solar pv/wind/diesel hybrid power system for a remotely located population near Arar, Saudi Arabia. Energy Explor. Exploit. 2015, 33, 591–620. [Google Scholar] [CrossRef]
- Renewable Energy Network for the 21st Century (REN21). Renewable 2017 Global Status Report; REN21: Paris, France, 2017. [Google Scholar]
- Eckhouse, B. Battery Storage Still Needs Solar for Growth. Available online: https://www.bloomberg.com/news/articles/2017-09-21/-new-and-cool-battery-storage-still-leans-on-solar-for-growth (accessed on 16 November 2018).
- Ralon, P.; Taylor, M.; Ilas, A. Electricity Storage and Renewables: Cost and Markets to 2030; IRENA: Abu Dhabi, UAE, 2017. [Google Scholar]
- Curry, C. Lithium-Ion Battery Costs: Squeezed Margins and New Business Models. Available online: https://about.bnef.com/blog/lithium-ion-battery-costs-squeezed-margins-new-business-models/ (accessed on 16 November 2018).
- Soulopoulos, N. Cost Projections: Batteries, Vehicles, and TCO; Bloomberg New Energy Finance (BNEF): New York, NY, USA, 2018. [Google Scholar]
- Mandelli, S.; Barbieri, J.; Mereu, R.; Colombo, E. Off-grid systems for rural electrification in developing countries: Definitions, classification and a comprehensive literature review. Renew. Sustain. Energy Rev. 2016, 58, 1621–1646. [Google Scholar] [CrossRef]
- Ahmad, G. Photovoltaic-powered rural zone family house in Egypt. Renew. Energy 2002, 26, 379–390. [Google Scholar] [CrossRef]
- Bhuiyan, M.; Asgar, M.A. Sizing of a stand-alone photovoltaic power system at Dhaka. Renew. Energy 2003, 28, 929–938. [Google Scholar] [CrossRef]
- Jordan, D.C.; Kurtz, S.R. Photovoltaic degradation rates—An analytical review. Prog. Photovolt. Res. Appl. 2013, 21, 12–29. [Google Scholar] [CrossRef]
- Meydbray, J.; Dross, F. PV Module Reliability Scorecard Report 2016; DNVGL: Høvik, Norway, 2016; pp. 1–18. [Google Scholar]
- Topan, P.A.; Ramadan, M.N.; Fathoni, G.; Cahyadi, A.I.; Wahyunggoro, O. State of charge (soc) and state of health (soh) estimation on lithium polymer battery via kalman filter. In Proceedings of the 2016 2nd International Conference on Science and Technology-Computer (ICST), Yogyakarta, Indonesia, 27–28 October 2016; pp. 93–96. [Google Scholar]
- Alsaidan, I.; Khodaei, A.; Gao, W. Determination of optimal size and depth of discharge for battery energy storage in standalone microgrids. In Proceedings of the North American Power Symposium (NAPS), Denver, CO, USA, 18–20 September 2016; pp. 1–6. [Google Scholar]
- Vidal Faez, A.M.; Ruvalcaba Velarde, S.A. Feasibility Study of Photovoltaic Microgrids and Their Application in Powering Remote Onshore Oil and Gas Surface Instrumentation. In Proceedings of the SPE Saudi Arabia Section Annual Technical Symposium and Exhibition, Al-Khobar, Saudi Arabia, 21–23 April 2015. [Google Scholar]
- Kaabeche, A.; Ibtiouen, R. Techno-economic optimization of hybrid photovoltaic/wind/diesel/battery generation in a stand-alone power system. Sol. Energy 2014, 103, 171–182. [Google Scholar] [CrossRef]
- Dufo-López, R.; Lujano-Rojas, J.M.; Bernal-Agustín, J.L. Comparison of different lead–acid battery lifetime prediction models for use in simulation of stand-alone photovoltaic systems. Appl. Energy 2014, 115, 242–253. [Google Scholar] [CrossRef]
- Jossen, A.; Garche, J.; Sauer, D.U. Operation conditions of batteries in PV applications. Sol. Energy 2004, 76, 759–769. [Google Scholar] [CrossRef]
- Rehman, S.; Alam, M.M.; Meyer, J.P.; Al-Hadhrami, L.M. Feasibility study of a wind–pv–diesel hybrid power system for a village. Renew. Energy 2012, 38, 258–268. [Google Scholar] [CrossRef]
- Shaahid, S.; Al-Hadhrami, L.; Rahman, M. Review of economic assessment of hybrid photovoltaic-diesel-battery power systems for residential loads for different provinces of Saudi Arabia. Renew. Sustain. Energy Rev. 2014, 31, 174–181. [Google Scholar] [CrossRef]
- Shaahid, S.; El-Amin, I. Techno-economic evaluation of off-grid hybrid photovoltaic–diesel–battery power systems for rural electrification in Saudi Arabia—A way forward for sustainable development. Renew. Sustain. Energy Rev. 2009, 13, 625–633. [Google Scholar] [CrossRef]
- Shaahid, S.; Elhadidy, M. Economic analysis of hybrid photovoltaic–diesel–battery power systems for residential loads in hot regions—A step to clean future. Renew. Sustain. Energy Rev. 2008, 12, 488–503. [Google Scholar] [CrossRef]
- Aslam, S.; Javaid, N.; Khan, F.; Alamri, A.; Almogren, A.; Abdul, W. Towards efficient energy management and power trading in a residential area via integrating a grid-connected microgrid. Sustainability 2018, 10, 1245. [Google Scholar] [CrossRef]
- Baker, J. New technology and possible advances in energy storage. Energy Policy 2008, 36, 4368–4373. [Google Scholar] [CrossRef]
- Bahramirad, S.; Reder, W.; Khodaei, A. Reliability-constrained optimal sizing of energy storage system in a microgrid. IEEE Trans. Smart Grid 2012, 3, 2056–2062. [Google Scholar] [CrossRef]
- Ma, T.; Yang, H.; Lu, L. Feasibility study and economic analysis of pumped hydro storage and battery storage for a renewable energy powered island. Energy Convers. Manag. 2014, 79, 387–397. [Google Scholar] [CrossRef]
- Li, X.; Chalvatzis, K.; Stephanides, P. Innovative Energy Islands: Life-Cycle Cost-Benefit Analysis for Battery Energy Storage. Sustainability 2018, 10, 3371. [Google Scholar] [CrossRef]
- Dufo-López, R.; Bernal-Agustín, J.L. Techno-economic analysis of grid-connected battery storage. Energy Convers. Manag. 2015, 91, 394–404. [Google Scholar] [CrossRef]
- Riaz, S.; Chapman, A.C.; Verbic, G. Comparing utility and residential battery storage for increasing flexibility of power systems. In Proceedings of the Power Engineering Conference (AUPEC), Wollongong, NSW, Australia, 27–30 September 2015; pp. 1–6. [Google Scholar]
- Yang, Y.; Ye, Q.; Tung, L.J.; Greenleaf, M.; Li, H. Integrated Size and Energy Management Design of Battery Storage to Enhance Grid Integration of Large-Scale PV Power Plants. IEEE Trans. Ind. Electron. 2018, 65, 394–402. [Google Scholar] [CrossRef]
- Charfi, S.; Atieh, A.; Chaabene, M. Modeling and cost analysis for different PV/battery/diesel operating options driving a load in Tunisia, Jordan and KSA. Sustain. Cities Soc. 2016, 25, 49–56. [Google Scholar] [CrossRef]
- Hossain, M.; Mekhilef, S.; Olatomiwa, L. Performance evaluation of a stand-alone PV-wind-diesel-battery hybrid system feasible for a large resort center in South China Sea, Malaysia. Sustain. Cities Soc. 2017, 28, 358–366. [Google Scholar] [CrossRef]
- Eteiba, M.; Barakat, S.; Samy, M.; Wahba, W.I. Optimization of an off-grid PV/Biomass hybrid system with different battery technologies. Sustain. Cities Soc. 2018, 40, 713–727. [Google Scholar] [CrossRef]
- Yahyaoui, I.; Yahyaoui, A.; Chaabene, M.; Tadeo, F. Energy management for a stand-alone photovoltaic-wind system suitable for rural electrification. Sustain. Cities Soc. 2016, 25, 90–101. [Google Scholar] [CrossRef]
- Ardani, K.; O’Shaughnessy, E.; Fu, R.; McClurg, C.; Huneycutt, J.; Margolis, R. Installed Cost Benchmarks and Deployment Barriers for Residential Solar Photovoltaics with Energy Storage: Q1 2016; National Renewable Energy Laboratory (NREL): Golden, CO, USA, 2016.
- Lai, C.S.; McCulloch, M.D. Levelized cost of electricity for solar photovoltaic and electrical energy storage. Appl. Energy 2017, 190, 191–203. [Google Scholar] [CrossRef]
- Pawel, I. The cost of storage—How to calculate the levelized cost of stored energy (LCOE) and applications to renewable energy generation. Energy Procedia 2014, 46, 68–77. [Google Scholar] [CrossRef]
- Boovaragavan, V.; Methakar, R.N.; Ramadesigan, V.; Subramanian, V.R. A mathematical model of the lead-acid battery to address the effect of corrosion. J. Electrochem. Soc. 2009, 156, A854–A862. [Google Scholar] [CrossRef]
- Jacob, A.S.; Banerjee, R.; Ghosh, P.C. Modelling and simulation of a PV battery grid backup system for various climatic zones of India. In Proceedings of the 2016 IEEE 43rd Photovoltaic Specialists Conference (PVSC), Portland, OR, USA, 5–10 June 2016; pp. 1807–1812. [Google Scholar]
- Khasawneh, H.J.; Mondal, A.; Illindala, M.S.; Schenkman, B.L.; Borneo, D.R. Evaluation and sizing of energy storage systems for microgrids. In Proceedings of the 2015 IEEE/IAS 51st Industrial & Commercial Power Systems Technical Conference (I&CPS), Calgary, AB, Canada, 5–8 May 2015; pp. 1–8. [Google Scholar]
- Arun, P.; Banerjee, R.; Bandyopadhyay, S. Optimum sizing of photovoltaic battery systems incorporating uncertainty through design space approach. Sol. Energy 2009, 83, 1013–1025. [Google Scholar] [CrossRef]
- Kaushika, N.; Gautam, N.K.; Kaushik, K. Simulation model for sizing of stand-alone solar PV system with interconnected array. Sol. Energy Mater. Sol. Cells 2005, 85, 499–519. [Google Scholar] [CrossRef]
- Celik, A.; Muneer, T.; Clarke, P. Optimal sizing and life cycle assessment of residential photovoltaic energy systems with battery storage. Prog. Photovolt. Res. Appl. 2008, 16, 69–85. [Google Scholar] [CrossRef]
- Kaldellis, J. Optimum technoeconomic energy autonomous photovoltaic solution for remote consumers throughout Greece. Energy Convers. Manag. 2004, 45, 2745–2760. [Google Scholar] [CrossRef]
- Meunier, J.; Knittel, D.; Collet, P.; Sturtzer, G.; Carpentier, C.; Rocchia, G.; Wisse, J.; Helfter, M. Sizing of a photovoltaic system with battery storage: Influence of the load profile. In Proceedings of the International Conference CISBAT 2015 Future Buildings and Districts Sustainability from Nano to Urban Scale, Lausanne, Switzerland, 9–11 September 2015; pp. 711–716. [Google Scholar]
- Jülch, V. Comparison of electricity storage options using levelized cost of storage (LCOS) method. Appl. Energy 2016, 183, 1594–1606. [Google Scholar] [CrossRef]
- Mundada, A.S.; Shah, K.K.; Pearce, J.M. Levelized cost of electricity for solar photovoltaic, battery and cogen hybrid systems. Renew. Sustain. Energy Rev. 2016, 57, 692–703. [Google Scholar] [CrossRef] [Green Version]
- Obi, M.; Jensen, S.; Ferris, J.B.; Bass, R.B. Calculation of levelized costs of electricity for various electrical energy storage systems. Renew. Sustain. Energy Rev. 2017, 67, 908–920. [Google Scholar] [CrossRef]
- Belderbos, A.; Delarue, E.; Kessels, K.; D’haeseleer, W. Levelized cost of storage—Introducing novel metrics. Energy Econ. 2017, 67, 287–299. [Google Scholar] [CrossRef]
- Manwell, J.F.; McGowan, J.G.; Abdulwahid, U.; Wu, K. Improvements to the Hybrid2 battery model. In Proceedings of the Windpower 2005 Conference, Denver, CO, USA, 17 May 2005. [Google Scholar]
- PowerThru. Lead Acid Battery Working—Lifetime Study. Available online: http://www.power-thru.com/documents/The%20Truth%20About%20Batteries%20-%20POWERTHRU%20White%20Paper.pdf (accessed on 1 December 2018).
- Feron, S.; Cordero, R.; Labbe, F. Rural electrification efforts based on off-grid photovoltaic systems in the Andean Region: Comparative assessment of their sustainability. Sustainability 2017, 9, 1825. [Google Scholar] [CrossRef]
- Barman, M.; Mahapatra, S.; Palit, D.; Chaudhury, M.K. Performance and impact evaluation of solar home lighting systems on the rural livelihood in Assam, India. Energy Sustain. Dev. 2017, 38, 10–20. [Google Scholar] [CrossRef]
- Upadhyay, T.P.; Shahi, C.; Leitch, M.; Pulkki, R. Economic feasibility of biomass gasification for power generation in three selected communities of northwestern Ontario, Canada. Energy Policy 2012, 44, 235–244. [Google Scholar] [CrossRef]
- Schmidt, O.; Hawkes, A.; Gambhir, A.; Staffell, I. The future cost of electrical energy storage based on experience rates. Nat. Energy 2017, 2, 17110. [Google Scholar] [CrossRef]
- Wang, Z.; Chen, B.; Wang, J.; Begovic, M.M.; Chen, C. Coordinated energy management of networked microgrids in distribution systems. IEEE Trans. Smart Grid 2015, 6, 45–53. [Google Scholar] [CrossRef]
- Noel, L.; Brodie, J.F.; Kempton, W.; Archer, C.L.; Budischak, C. Cost minimization of generation, storage, and new loads, comparing costs with and without externalities. Appl. Energy 2017, 189, 110–121. [Google Scholar] [CrossRef] [Green Version]
- Buchman, A.; Lung, C. State of Charge and State of Health Estimation of Lithium-Ion Batteries. In Proceedings of the 2018 IEEE 24th International Symposium for Design and Technology in Electronic Packaging (SIITME), Iasi, Romania, 25–28 October 2018; pp. 382–385. [Google Scholar]
Figure 1.
The average load profiles that will be considered for the analysis. Note the diurnal and nocturnal trends.
Figure 1.
The average load profiles that will be considered for the analysis. Note the diurnal and nocturnal trends.

Figure 2.
The average monthly temperatures in the city of Riyadh, Saudi Arabia. Note that for the purposes of the model, 8760 temperature data points were used for the year (not shown for brevity). Further, the bars show the maximum and minimum temperatures experienced.
Figure 2.
The average monthly temperatures in the city of Riyadh, Saudi Arabia. Note that for the purposes of the model, 8760 temperature data points were used for the year (not shown for brevity). Further, the bars show the maximum and minimum temperatures experienced.

Figure 3.
The number of cycles of the battery versus the depth-of-discharge (DOD) (DOD = 1ߞstate of charge (SOC)) based on data provided by the manufacturer. Note that the lower the battery discharges, the shorter the lifetime is.
Figure 3.
The number of cycles of the battery versus the depth-of-discharge (DOD) (DOD = 1ߞstate of charge (SOC)) based on data provided by the manufacturer. Note that the lower the battery discharges, the shorter the lifetime is.

Figure 4.
Temperature versus battery relative capacity based on data provided by the manufacturer.

Table 1.
Review of papers that designed photovoltaic-battery system (PVBs). The cell with ‘Yes’ are highlighted in gray.
Table 1.
Review of papers that designed photovoltaic-battery system (PVBs). The cell with ‘Yes’ are highlighted in gray.
| Reference | Has the Paper Considered Temperature Effects on Battery Capacity? | Has the Paper Considered Temperature Effects on Lifetime, i.e., Calendar Life and Cyclical Degradation? | Has the Paper Considered Different MSOC Levels for Sizing Optimization? | Has the Paper Tested for Differed Load Profiles? | Was the System Fully Standalone, i.e., No Grid and No Diesel Generation? |
|---|---|---|---|---|---|
| [39] | Yes | Yes | No | No | No |
| [9] | No | No | No | No | Yes |
| [10] | Yes | No | No | No | Yes |
| [40] | Yes | No | No | Yes | No |
| [41] | No | No | No | No | Yes |
| [42] | No | No | No | No | No |
| [1] | No | No | No | No | No |
| [43] | No | Yes | No | No | No |
| [20] | No | No | No | No | No |
| [21] | No | No | No | No | No |
| [44] | No | No | No | No | Yes |
| [15] | No | Yes | No | No | Yes |
| [14] | No | No | Yes | No | No |
| [45] | No | No | No | Yes | No |
| This work | Yes | Yes | Yes | Yes | Yes |
Table 2.
Overall system assumptions.
| Parameter | Value |
|---|---|
| Discounting rate | 5 percent |
| Inflation rate | 2 percent |
| System lifetime | 25 years |
| Supply shortage | 0 percent |
Table 3.
Assumptions used for the photovoltaics (PV) panels.
| Parameter | Value |
|---|---|
| CAPEX (excluding inverter) ($/W) | 1.8 $/W |
| Inverter CAPEX | 0.2 $/W |
| Module efficiency (%) | 16 percent |
| Annual panel degradation (%) | 0.5 percent |
| Temperature power loss coefficient (%/C) | 0.4%/°C |
| Nominal operating cell temperature | 47 °C |
| Maintenance costs ($/kW/year) | 10 $/kW/year |
| Derating factor (including inverter losses) (%) | 85 percent |
| Panel slope from the horizontal | 25° |
| Azimuth degree from the north | 180° |
| Solar irradiation | Hourly irradiation data for Riyadh |
Table 4.
Assumptions used for the battery system.
| Parameter | Value |
|---|---|
| Battery model | Trojan SIND 061225 (lead acid) |
| Battery cost (including installation) | $2205 (300 $/kW h) |
| Nominal voltage | 6 V |
| Energy rating | 7.35 kW h |
| Capacity (current rating) | 1225 Ah |
| Bus voltage | 24 V |
| Days of autonomy | 2 days |
| Allowable throughput | 14,598 kW h (see text for details) |
| Degradation limit | 20 percent |
| Round trip efficiency | 85 percent |
| Temperature effect on capacity | See text for details |
| Temperature effect on calendar lifetime | See text for details |
Table 5.
Optimum size of the PVB minimizing the net present cost (NPC) for a diurnal load profile based on different minimum allowable state of charge (MSOC) constraints. Any slight discrepancies are due to rounding.
Table 5.
Optimum size of the PVB minimizing the net present cost (NPC) for a diurnal load profile based on different minimum allowable state of charge (MSOC) constraints. Any slight discrepancies are due to rounding.
| Results Incorporating Temperature Effects | |||||||
| MSOC (%) | PV Size (kW) | Total Number of Batteries in the Bank | Average Cost of Energy ($/kW h) | Net Present Cost ($) | Initial Capital ($) | Number of Battery Replacements | Total Number of Batteries Used throughout Project Lifetime |
| 20 | 6.7 | 8 | 0.435 | 69,985 | 31,025 | 3 | 32 |
| 30 | 8.0 | 8 | 0.453 | 72,898 | 33,566 | 3 | 32 |
| 40 | 9.9 | 8 | 0.480 | 77,315 | 37,529 | 3 | 32 |
| 50 | 7.1 | 16 | 0.728 | 117,287 | 49,499 | 2 | 48 |
| 60 | 9.4 | 20 | 0.908 | 146,165 | 62,913 | 2 | 60 |
| 70 | 10.8 | 108 * | 4.208 | 677,471 | 259,781 | 2 | 324 |
| Results without Incorporating Temperature Effects | |||||||
| MSOC (%) | PV Size (kW) | Total Number of Batteries in the Bank | Average Cost of Energy ($/kW h) | Net Present Cost ($) | Initial Capital ($) | Number of Battery Replacements | Total Number of Batteries Used throughout Project Lifetime |
| 20 | 6.2 | 8 | 0.244 | 39,306 | 29,961 | 1 | 16 |
| 30 | 6.9 | 8 | 0.254 | 40,928 | 31,421 | 1 | 16 |
| 40 | 8.5 | 8 | 0.277 | 44,549 | 34,682 | 1 | 16 |
| 50 | 11.7 | 8 | 0.321 | 51,655 | 41,082 | 1 | 16 |
| 60 | 6.6 | 20 | 0.488 | 78,637 | 57,225 | 1 | 40 |
| 70 | 13.9 | 20 | 0.590 | 94,992 | 71,954 | 1 | 40 |
* Technically impractical number of batteries in the bank for charge balancing limitations.
Table 6.
Optimum size of the PVB minimizing the NPC for a nocturnal load profile based on different SOC constraints. Any slight discrepancies are due to rounding.
Table 6.
Optimum size of the PVB minimizing the NPC for a nocturnal load profile based on different SOC constraints. Any slight discrepancies are due to rounding.
| Results Incorporating Temperature Effects | |||||||
| MSOC (%) | PV Size (kW) | Total Number of Batteries in the Bank | Average Cost of Energy ($/kW h) | Net Present Cost ($) | Initial Capital ($) | Number of Battery Replacements | Total Number of Batteries Used throughout Project Lifetime |
| 20 | 6.8 | 12 | 0.615 | 99,044 | 40,023 | 3 | 48 |
| 30 | 7.2 | 12 | 0.622 | 100,192 | 40,880 | 3 | 48 |
| 40 | 6.9 | 16 | 0.751 | 120,992 | 49,061 | 3 | 64 |
| 50 | 7.8 | 20 | 0.906 | 145,879 | 59,631 | 3 | 80 |
| 60 | 10.2 | 28 * | 1.231 | 198,166 | 82,161 | 2 | 84 |
| 70 | 7.0 | 148 * | 5.653 | 910,114 | 340,321 | 2 | 444 |
| Results without Incorporating Temperature Effects | |||||||
| MSOC (%) | PV Size (kW) | Total Number of Batteries in the Bank | Average Cost of Energy ($/kW h) | Net Present Cost ($) | Initial Capital ($) | Number of Battery Replacements | Total Number of Batteries Used throughout Project Lifetime |
| 20 | 8.8 | 8 | 0.281 | 45,188 | 35,258 | 1 | 16 |
| 30 | 11.1 | 8 | 0.312 | 50,195 | 39,767 | 1 | 16 |
| 40 | 7.8 | 12 | 0.347 | 55,859 | 42,149 | 1 | 24 |
| 50 | 7.5 | 16 | 0.422 | 68,011 | 50,374 | 1 | 32 |
| 60 | 9.4 | 20 | 0.528 | 84,953 | 62,913 | 1 | 40 |
| 70 | 10.7 | 36 * | 0.864 | 139,118 | 100,818 | 1 | 72 |
* Technically impractical number of batteries in the bank for charge balancing limitations.
Table 7.
Assumptions used for the diesel generators.
| Parameter | Value for Independent Generator | Value for Microgrid Generator |
|---|---|---|
| Capital cost | 0.70 $/W | 0.20 $/W |
| Fuel cost | 0.10, 0.50, 1.00, 1.50 $/L | 0.10, 0.50, 1.00, 1.50 $/L |
| Lifetime of generator | 2500 h | 15,000 h |
| Minimum load ratio | 25 percent | 25 percent |
| Maintenance intervals | Every 400 h of operation | Every 400 h of operation |
| Maintenance cost | $25 | $400 |
| Operation cost | 0.10 $/h of operation | 0.45 $/h of operation |
Table 8.
Net Present Cost, in millions of dollars, of delivering energy to 1000 homes using individual diesel generators provided for each home, a microgrid powering the whole community, and individual PVB systems.
Table 8.
Net Present Cost, in millions of dollars, of delivering energy to 1000 homes using individual diesel generators provided for each home, a microgrid powering the whole community, and individual PVB systems.
| Scenario | Diesel Price ($/L) | Diesel Consumption Per Year (Million Liters) | Carbon Emissions Per Year (Thousand Tons) | Comments | |||
|---|---|---|---|---|---|---|---|
| 0.10 | 0.50 | 1.00 | 1.50 | ||||
| Individual generator for each home | 111 | 133 | 159 | 185 | 3.03 | 7900 | - No grid investment or maintenance costs required - Model run for two generators each with a capacity of 2 kW |
| Microgrid powering complete community | 91 | 105 | 122 | 139 | 1.94 | 5100 | - Cost of supplying diesel, maintaining and upgrading grid, and externalities not included - Model chooses two generators with capacities of 1 MW and 1.75 MW to meet the load |
| PVB: 30% MSOC with temperature effects incorporated | 99 (maximum) | 0 | - No grid investment or maintenance costs required - Learning curve of battery technology not considered | ||||
| PVB: 30% MSOC with temperature effects NOT incorporated | 50 (maximum) | ||||||
© 2019 by the authors. Licensee MDPI, Basel, Switzerland. This article is an open access article distributed under the terms and conditions of the Creative Commons Attribution (CC BY) license (http://creativecommons.org/licenses/by/4.0/).
Share and Cite
MDPI and ACS Style
Elshurafa, A.M.; Aldubyan, M.H. State-of-Charge Effects on Standalone Solar-Storage Systems in Hot Climates: A Case Study in Saudi Arabia. Sustainability 2019, 11, 3471. https://0-doi-org.brum.beds.ac.uk/10.3390/su11123471
AMA Style
Elshurafa AM, Aldubyan MH. State-of-Charge Effects on Standalone Solar-Storage Systems in Hot Climates: A Case Study in Saudi Arabia. Sustainability. 2019; 11(12):3471. https://0-doi-org.brum.beds.ac.uk/10.3390/su11123471
Chicago/Turabian StyleElshurafa, Amro M., and Mohammad H. Aldubyan. 2019. "State-of-Charge Effects on Standalone Solar-Storage Systems in Hot Climates: A Case Study in Saudi Arabia" Sustainability 11, no. 12: 3471. https://0-doi-org.brum.beds.ac.uk/10.3390/su11123471
Note that from the first issue of 2016, this journal uses article numbers instead of page numbers. See further details here.