Buildingmass and Energy Demand in Conventional Housing Typologies of the Mediterranean City


1
SOS Urban Lab—DICEA Department, Sapienza University of Rome, Via Eudossiana 18, 00184 Rome, Italy
2
Department of Architecture and Urban Studies, Politecnico di Milano, Piazza Leonardo da Vinci 32, 20133 Milano, Italy
3
Architecture and Energy—Barcelona School of Architecture, UPC, Av. Diagonal 649, 08028 Barcelona, Spain
*
Author to whom correspondence should be addressed.
Sustainability 2019, 11(13), 3540; https://0-doi-org.brum.beds.ac.uk/10.3390/su11133540
Submission received: 31 March 2019
/
Revised: 21 June 2019
/
Accepted: 24 June 2019
/
Published: 27 June 2019
(This article belongs to the Special Issue Sustainability and Urban Metabolism)
Abstract
:The causal relation among building typology and building energy demand is a complex balance of climate, morphology, technology and use. The assessment of the relation between mass of building elements and energy demand in different housing typologies is the main goal of this study. A novel indicator, namely the Buildingmass, is introduced and tested in the Mediterranean climate region. Explorations on nine conventional housing typologies in Barcelona and Rome are carried out. Buildingmass evaluation is based on the calculation of the mass of building elements. Energy demand is assessed by modelling on multi-space dynamic thermal analysis tool. Our results point out that the Buildingmass has a strong relevance on energy, playing an important role in reducing heating and cooling demand in the Mediterranean city, as described by the proposed correlation (R2 = 0.88). Moreover, this indicator gives a more detailed characterisation of the housing stock of the Mediterranean city. The study aims at bridging the gap between urban physics and urban metabolism studies and fostering energy conservation measures for the built environment.
1. Introduction
In recent years, the complex interaction of urban environment, climate and energy performance of buildings has drawn the attention of researchers from different fields, aiming at exploring acute and actual challenges of cities and making human settlement sustainable, resilient, safe and inclusive [1]. The built environment has a clear and direct impact on daily life and everyone’s wellbeing as well as a central role regarding energy consumption and greenhouse gas emissions. In the European Union, the building sector is responsible for 40% of energy consumption ad 36% of greenhouse gas emissions [2]. Member States are required to establish a roadmap to decarbonise their national building stock up to 95% reduction of GHG emissions by 2050, with a specific milestone within 2030 [3]. Achieving this goal in the cities of the Mediterranean region firstly requires considerable efforts to estimate the building energy performance in relation to different features of the urban texture and, in particular, of the housing that is the core component of urban systems and is responsible for 65% of final energy consumption [4].
In this framework, new conceptual and methodological approaches, which seek to overcome actual limitation merging several disciplines, have been developed. On one side, geographers, ecologists and experts in urban metabolism focus their interest on the comprehension of the city as a hybrid ecosystem using a macro-scale approach for modelling urban functions [5]. On the other side, moving from micro to meso-scale, building physics and urban physics propose approaches to understand the energy-related characteristics of the building stock in order to define successful strategies of energy conservation measures [6]. Both make use of indicators to express the urban complexity in a synthetic way and try to determine their relevance and suitability in describing features of specific elements that presently make up cities.
By considering these features, the comprehension of the interdependencies among the built form, microclimate and energy has been widely investigated resorting to urban/district scale approaches increasingly [7,8,9]. In this regard, building typology strongly influences the urban form: buildings are one of the main components of urban texture and its energy performance is strictly related to physical characteristics at a multi-scale level: urban form affects local microclimate as well as passive and active building energy performance [10,11]. For these reasons, physical-based metrics for describing the urban environment have been recently associated with bottom-up energy assessment methods [6,12]. Presently, most of the bottom-up models for energy assessment of the building stock are based on statistical data at a large-scale city level, neglecting the effect of building typology.
The concept of building typology is widely known to have the ability to describe synthetically the characteristics of a group of buildings [13]. As defined by the TABULA Project, “the term building typology refers to a systematic description of the criteria for the definition of typical buildings as well as to a set of exemplary buildings representing the building types” [14]. Therefore, in addition to the building type description—e.g., detached house, semi-detached house, apartment block, tower building, etc. in the case of housing—building typology expresses the way buildings are made. This concept can describe in more detail factors that contribute to the definition of a group of similar buildings: climate, period of construction, spatial and housing models, technologies, design rules, building codes, planning regulations, economic constraints, building construction techniques, organization of construction companies and worksite organizations, too.
In the bottom-up energy assessment methods, the definition and the selection of archetypes are crucial in order to accurately represent the analysed building stock and to achieve the main goal of identifying energy efficient design strategies and policies. The combination of metrics for the urban environment and archetypes makes possible to give a quick and accurate estimation of the energy performance of a building portfolio, taking into account elements and features of the urban texture: geometry, mutual shadings, microclimate conditions, etc. In addition, it was observed that mass and power consumption of cities follow approximately the scaling laws of complex living organisms [15].
The estimation of the effects of housing typology on the mutual relation mass-energy demand in the urban environment is the main goal of this study. With reference to the Technomass indicator, a novel indicator is introduced and tested for the Mediterranean climate region: the Buildingmass (BM). Technomass is used to measure the matter accumulation in cities and applied to understand urban metabolism distinguishing within different kinds of materials (flows and stocks) [16]. In particular, Technomass, as stated by Inostroza, “focuses on stocks of matter giving a quantitative expression of material accumulation […] that is possible to observe and measure […] in a given urban area, considering only the materials with anthropogenic origin”. Moreover, it is associated with specific compartments: buildings, roads, vehicles, furniture, shoes and clothes, machines and tools and technological assets, too. This study focuses on the building’s compartment, which is subdivided into physical elements and wants to give a more precise estimation of their mass using the BM indicator (measured in unit of Tm/m2).
We explore the relation between BM and energy for heating and cooling in the Mediterranean cities and give a detailed characterisation of the housing stock focusing on conventional building typology archetypes, useful for bottom-up energy analysis at the district scale. Our effort could lead to a more precise description of the building component among the Technomass (useful to synthesising a broad scope of urban features) and could establish some key elements for future analysis on urban metabolism [15,16]. BM analyses one particular aspect strictly related to energy performance that presently has not yet been explored. Based on the results on the Mediterranean housing archetypes, general and specific facts of Barcelona and Rome case studies have been described. Some general trends on the relation BM and energy demand have been highlighted, introducing further suggestions and design implications. Finally, the proposed indicator in the Mediterranean housing stock is tested and discussed both in terms of applicability in the energy assessment both in terms of ability to estimate benefits for implementing passive solutions of retrofit strategies, in order to support European policymakers and to promote appropriate and effectiveness energy conservation measures. This work does not pretend to find an exact law on the relation between BM and energy demand but rather to give an overview of the general trends that are possible to highlight between these two variables, beyond the specific cases and the peculiarities of the selected housing typologies.
1.1. Building Typology and Urban Energy Performance
Several kinds of studies on the energy performance of buildings based on built form and typology have been developed during the last years. Authors began to investigate how to create built form taxonomies for energy analysis. For this reason, they focus on geometrical features that are strictly related to energy demand and its variation [17]. This process shows the complexity of translation of these features in numerical parameters suitable to act as energy indicators. Besides, facing with the importance of evaluating the baseline energy performance of the existing building stocks, tools developed at the building scale show the problem to operate with the lack of available input detailed data, the limited understanding of the parameters variations on predicted demand and the uncertainty of the impact of users behaviour—social and economic aspects [18].
It has been demonstrated that building typology is a useful tool to understand energy performance of building stock and to provide an estimation of the impact of energy saving scenarios for housing [19]. According to different building types, an energy benchmarking could be proposed as representative of a great part of entire national building stock. This approach has been further developed in TABULA project in order to reduce the effort for the energy assessment of the total building portfolio [14,20,21]. It takes into account the concept of building typology as a group of parameters that affecting the global building energy performance, with the use of a reference building for evaluating similar ones. Such parametric energy analysis, developed for space heating and hot water consumptions; however, is based on archetypes: exemplary buildings using multi-parametric taxonomy. The energy performance of these archetypes is considered to be a reference for the entire represented typologies. To overcome the difficulty in representing typology through a reference building, latest investigations on this concept, helped develop a method that evaluates the energy performance index (EPI) of an entire building stock using algorithms [22].
All the above-mentioned studies, either simplified calculation procedures or detailed dynamic simulation models focus on building scale energy benchmarking methods. These methods reveal some difficulties to express and consider the impact of the very complex environmental interactions occurring in the existing built environment between buildings and the urban context. In addition, empirical data collected by researchers have suggested that urban form plays a relevant role in the prediction of energy performance in our cities. A range of studies, starting from theories of Martin and March on urban form archetypes, analyses their geometrical properties in order to define methodologies and to assess the impact on daylighting, heating and cooling in relation to city texture, proving the accuracy and consistency of different geometrical parameters and the impact of urban geometry on energy demands [11,23]. Initially, Ratti showed the primary importance of urban geometry on daylight passive strategies [23]. Later, this method has been developed integrating the LT Method for building in urban analysis, revealing the accuracy of different parameters on describing urban fabric energy performance for office buildings in heating-dominated climate [11]. The study focuses on urban aspects without considering the effects of typologies and building technologies and find out that the ratio of passive zone is a useful parameter to describe energy performance more reliable than sky view factor or surface to built volume ratio. In another work—for the same kind of climate and building type—it has been demonstrated that considering only the variation of urban geometry, site layout and orientation is not easy to predict urban heating demand [24,25].
This range of studies neglects the evaluation of the impact of typology and building technology aspects in combination with the characteristics of the urban context. Only a few of these investigate the topic by applying a parametric methodology to a residential urban texture in Stuttgart: heating and cooling demand has been estimated in relation to different site density, glazing ratio and building typology in order to propose an energy benchmarking [26].
1.2. Urban Metabolism and Mass
With the aim of exploring the way it functions, the idea of city is increasingly associated with the concepts of (hybrid) ecosystem and complex living organism. Both these concepts have been largely applied in the urban metabolism studies that evaluate material and energy flows in cities. With the goal of describing the complexity, several studies make use of scaling laws at the regional or city scale [27,28].
Among these studies it has been demonstrated that the metabolic rate of modern cities (mass-power ratio) approximately follows the scaling laws of the living organisms [15]. Therefore, at the city scale, a relation between mass of its built elements and energy could be found. However, the process of matter and energy accumulation into the different urban textures have been rarely investigated and determining material accumulation and energy flows at a smallest scale remains an open question.
Furthermore, most of the above-mentioned studies do not focus on the urban areas in the Mediterranean climate, where the typical variation of climate conditions produces energy loads depending equally on heating and cooling. Besides, in this region, both historical and current building technologies are based on medium weight or heavy weight construction elements. In the Mediterranean cities, the phenomenon has been explored at the scale of the urban texture finding out that the mass of the building elements plays a crucial role in reducing energy demand for heating and cooling [29,30].
Even though the body of research has increased in recent years, more efforts are necessary to set out the influence of the BM—the proposed parameter—on energy performance and to evaluate its reliability as indicator for energy benchmarking. Thus, in order to bridge this gap, our study lays between the evaluation methods at the building scale with extensive analysis—that neglect the effect of urban form—and evaluation methods at the urban scale that neglect the effect of building typology and construction systems.
2. Materials and Methods
This work focuses on the relation between BM and energy demand considering the effect of housing typology. The exploration process is based on the following steps:
- identification and description of the housing typologies and of the corresponding urban forms;
- description of building archetypes for energy analysis and modelling of the housing typologies;
- Buildingmass estimation;
- energy demand calculation.
Each step has been conceived to describe the above-mentioned relation as clear as possible, taking into account all variables affecting the mass of the building elements and the building energy demand. Other variables have been estimated, considering standard values from previous studies with similar housing typologies. Heating and cooling energy demand is considered in order to verify the real influence of BM on energy performance: among the overall energy demand—that includes lighting and electricity, DHW, cooking—heating and cooling were directly attributable to the characteristics of housing typologies and building materials.
The study compares nine housing typologies, different in construction period, built form and construction systems. Tests through different case study simulations have been carried out, to represent conventional housing models making up different and widespread urban fabrics, built during the historical reference period.
2.1. Housing Typologies Identification and Description
The analysed buildings, selected as conventional housing typologies, are the main components of various existing urban fabrics comprised in the metropolitan areas of Rome (Italy) and Barcelona (Spain). The following criteria have been established for the selection of case studies:
- typical urban forms of the European compact city: widespread housing typologies and urban textures;
- urban textures representatives of the main urban evolution phases for the Mediterranean city;
- urban texture nearly uniform in terms of housing typology and building construction;
- urban forms that represent conventional urban textures in relation to different density levels and building constructions.
2.2. Building Archetypes for Energy Analysis and Modelling of Housing Typologies
To study the relation between BM and energy demand, the selected urban forms—representing different phases in the shaping of the European city—need a more detailed description including non-geometric building properties such as construction and building envelope technologies, building use and systems types. As a large number of building unit should be involved, this process has been developed introducing building archetypes: reference buildings that represent a group with similar properties seeking to reduce the energy analysis to a smaller subset of buildings. This approach has been significantly applied to evaluate energy performance at urban and regional level [6,36,37,38,39]. In addition, the concept of archetype could be easily applied to better characterise existing approaches on ecological urban indicators and metabolism [15,16,40].
Therefore, the housing typologies have been analysed and modelled in order to act as archetypes for the energy analysis. The characterisation of archetype parameters is based on building survey and data collection from several sources, as explained in the following subsections. With the aim to prevent geometrical inconsistencies and singularities of construction systems from affecting the results, housing typologies underwent a filtering process: as substitution of the original solutions, conventional and coherent solutions were applied, if necessary.
2.3. Buildingmass Estimation Process
The estimation of the BM indicator refers to the building compartment as defined in the Technomass indicator. This indicator has been proposed as a more accurate way to describe the buildings within the Technomass [16,40]. The latter is calculated at the city scale by deriving spatial data from GIS and by evaluating the parametric weight of four reference housing types (detached house, semi-detached house, terraced house and apartment blocks). BM is obtained as the sum of the masses of building elements (the physical parts of the building construction in each housing typology) divided by the total conditioned area and is expressed as follows:
where BMi is the Buildingmass of each housing typology (i), mk (metric tonnes—Tm) is the mass of each building element (k) and Ai (m2) is the total conditioned area of each housing typology.
To simultaneously estimate the impacts of each component of the building elements, the mass calculation has been subdivided into subsystems e.g., foundation, vertical structure, slabs, façade, etc. The assessment of volume of building materials was based on an accurate building survey, while to establish their density properties the IteC Database was used [41]. This database disassembles building elements regarding weight and material, allowing to analyse even the most complex recent component. The mass associated with the construction process which is not part of the building, as well as the mass of urbanizations, exterior spaces, supply networks and movable elements (appliances, furniture, electrical households, etc.) was not included in the calculation. Default weight values were applied to all building systems [42]. Results shown are represented by the BM indicator and expressed in metric tons referring to thermal conditioned areas as specific mass (Tm/m2). The process of identification of the most suitable area of reference is based on the comparison of the net area, the above-ground area and the conditioned area in relation to the mass of each building, for the case studies. The net area might include unconditioned areas both underground (generally used for car parking) both above-ground (for example storage, equipment spaces, etc.). Those last areas do not affect the energy use in the dwellings because they can be sheltered or separated from the conditioned areas.
2.4. Energy Demand Calculation
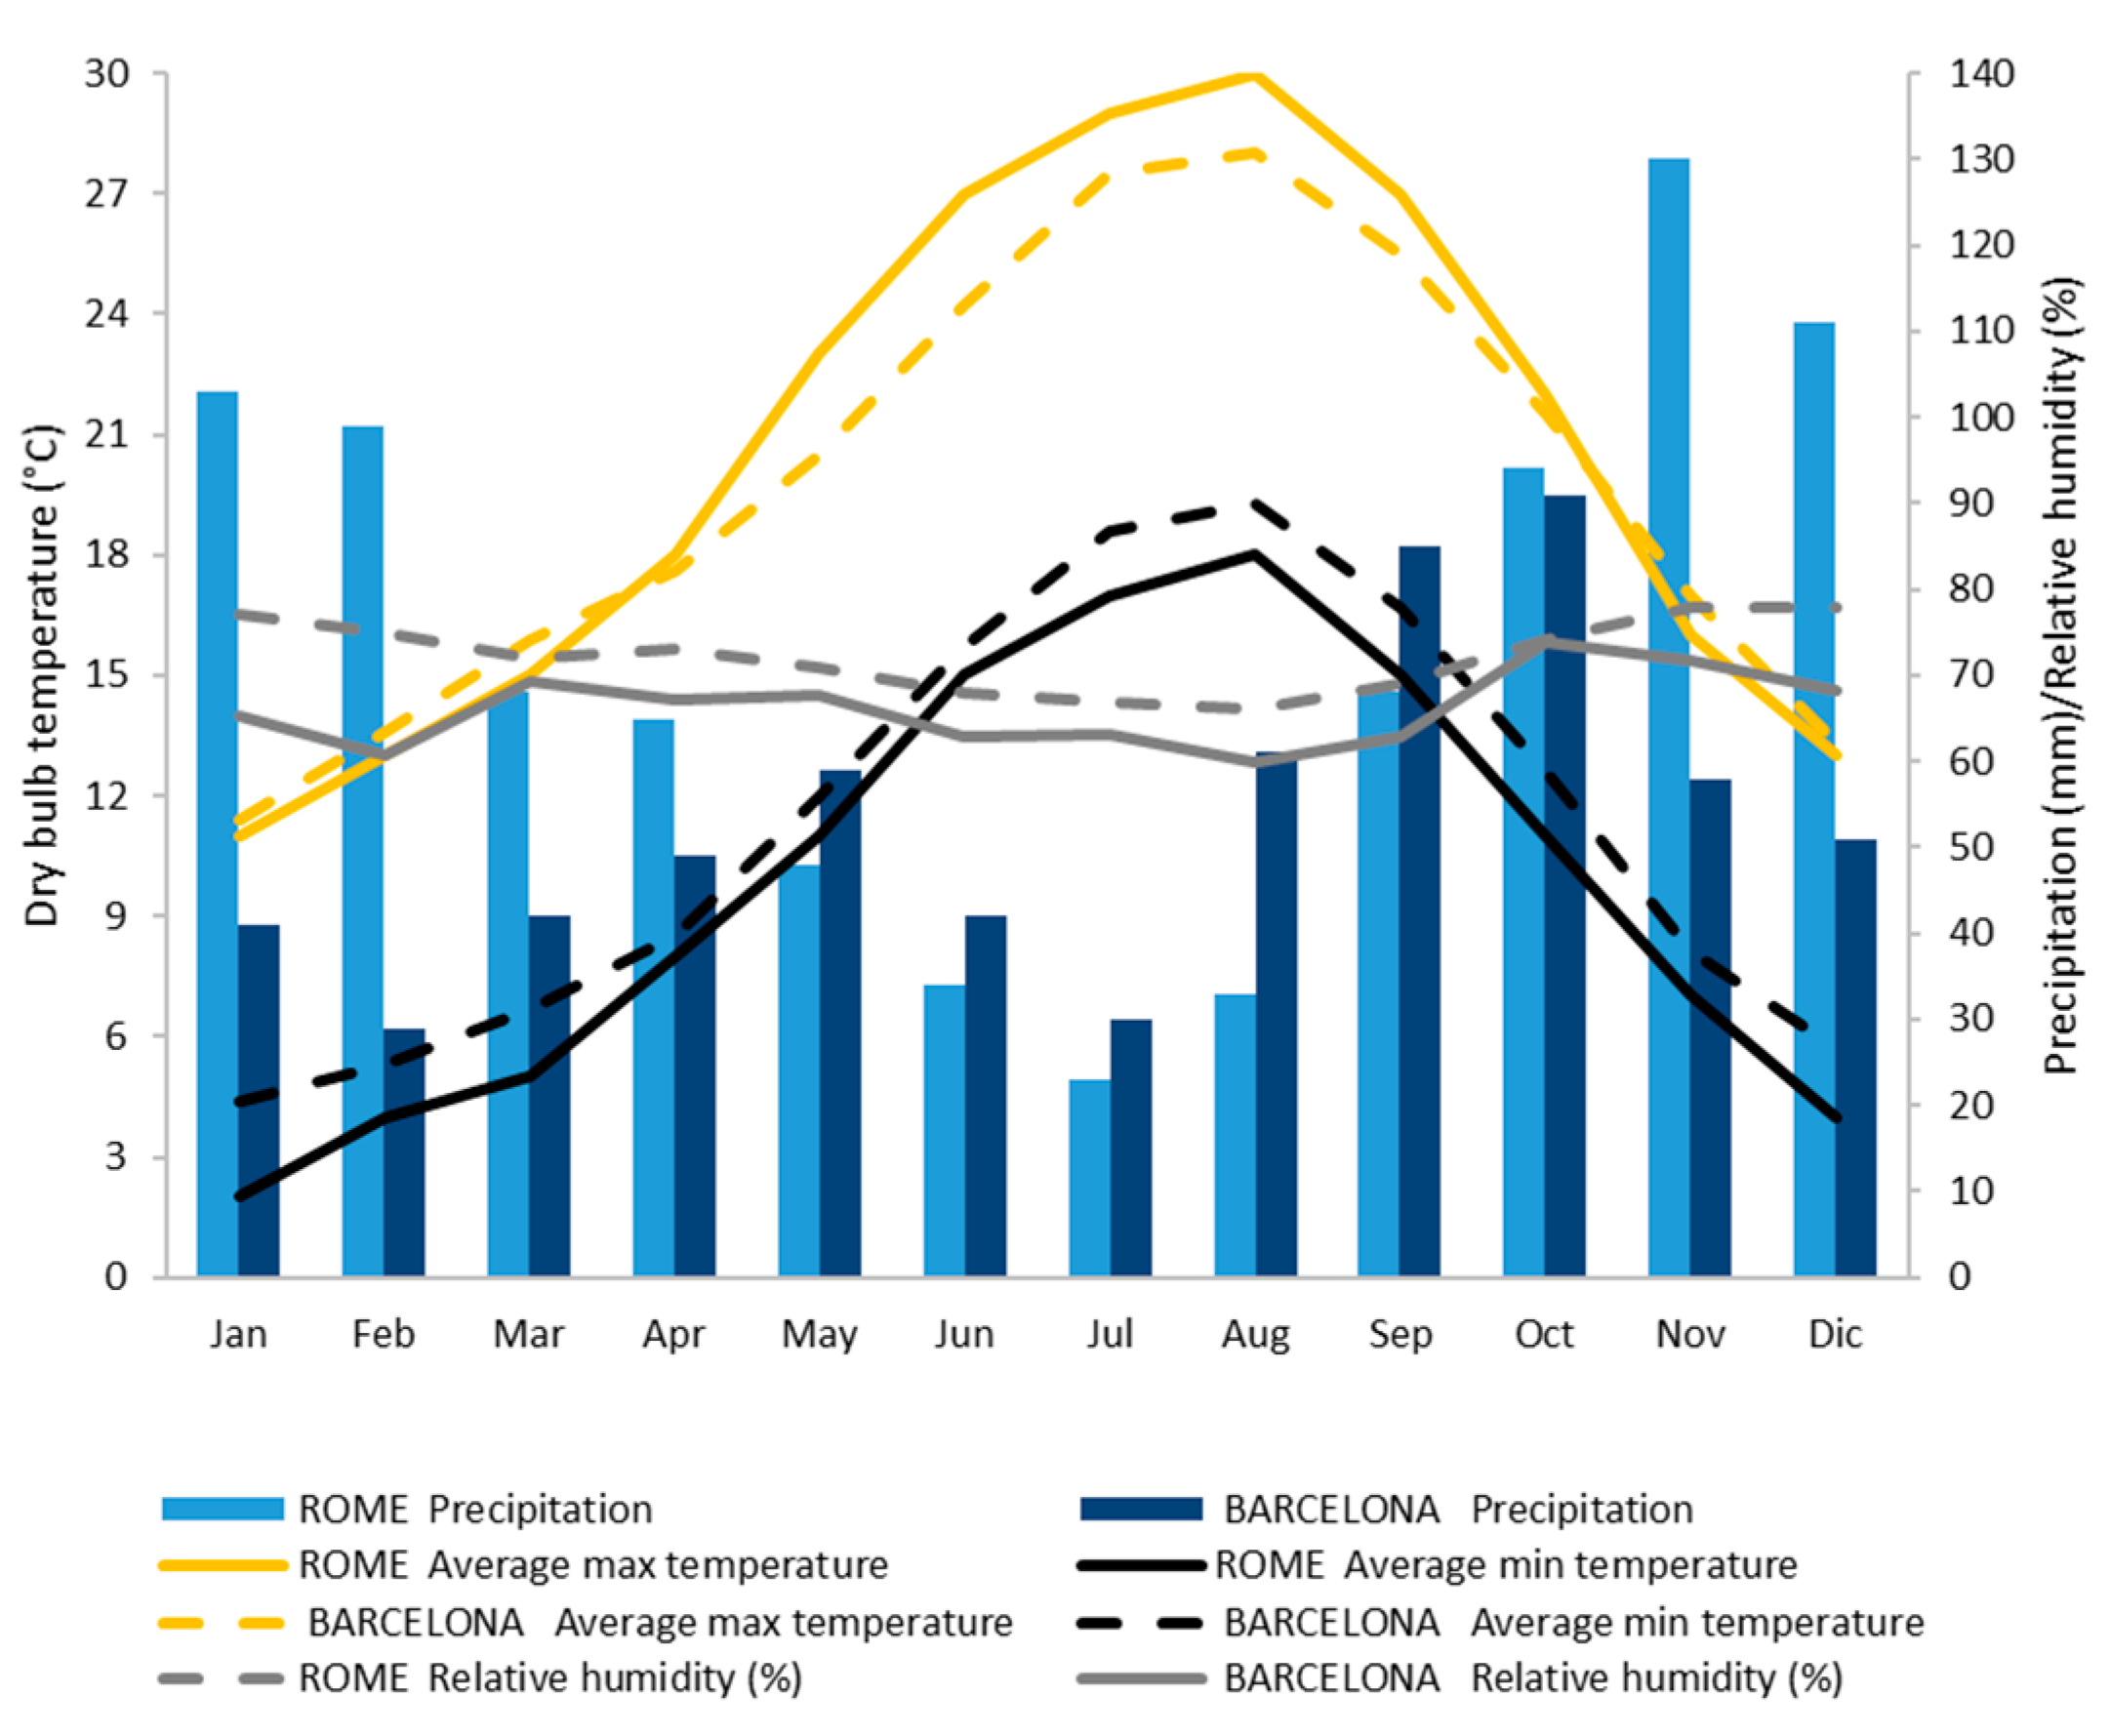
The climate of reference for energy analysis is the Mediterranean environment of Barcelona. Even though the case studies are located in Barcelona and Rome, the choice of a single reference climate, allows us to obtain reliable energy performance for the housing typology that constitutes the urban texture and to make results on case studies comparable each other. However, it worth to underline similarities and differences between the climate conditions of the two cities (Figure 1). Both are classified with a temperate climate in the map of Köppen-Geiger, both have very similar latitude (41.9° Rome and 41.4° Barcelona); a difference between the two cities exists due to thermoregulatory effect of the sea (significant in both but slightly stronger in Barcelona) that produces marginally lower temperature range in Barcelona and due to more precipitation in Rome. These aspects help the understanding and the interpretation of the results, as well as explains to what extent these results could describe the real condition in the case of the housing typologies of Rome and Barcelona.
Energy demand was evaluated by modelling on Lider, the thermodynamic software associated with the Spanish Building Code [43,44]. Lider provides for energy demand for heating and cooling measured in kWh/m2 per year. Mean, minimum and maximum values of heating and cooling demand were obtained by taking into account eight possible orientations. Since reliable local climate data within the urban context were not available, the Barcelona El Prat Airport is the reference weather station for the study. To consider the effect of urban obstructions, the selected buildings were modelled into their effective urban fabrics. For each selected case, the modelling of all building elements and subsystems, fixed shadows (balconies, walls, etc.) and internal partitions were performed starting from a building surveys and a detailed data acquisition. Default values were attributed to user dependent factors, i.e., ventilation rate, hygrometry and movable solar protections. The latter is taken into account by simulation through two solar mean reduction factors (hot and cold seasons).
3. Results
As follows we present results divided into three parts: built mass estimation, energy demand analysis and their mutual relation. Moreover, the Buildingmass is tested as energy indicator through the analysis of case studies.
3.1. Built Mass Estimation
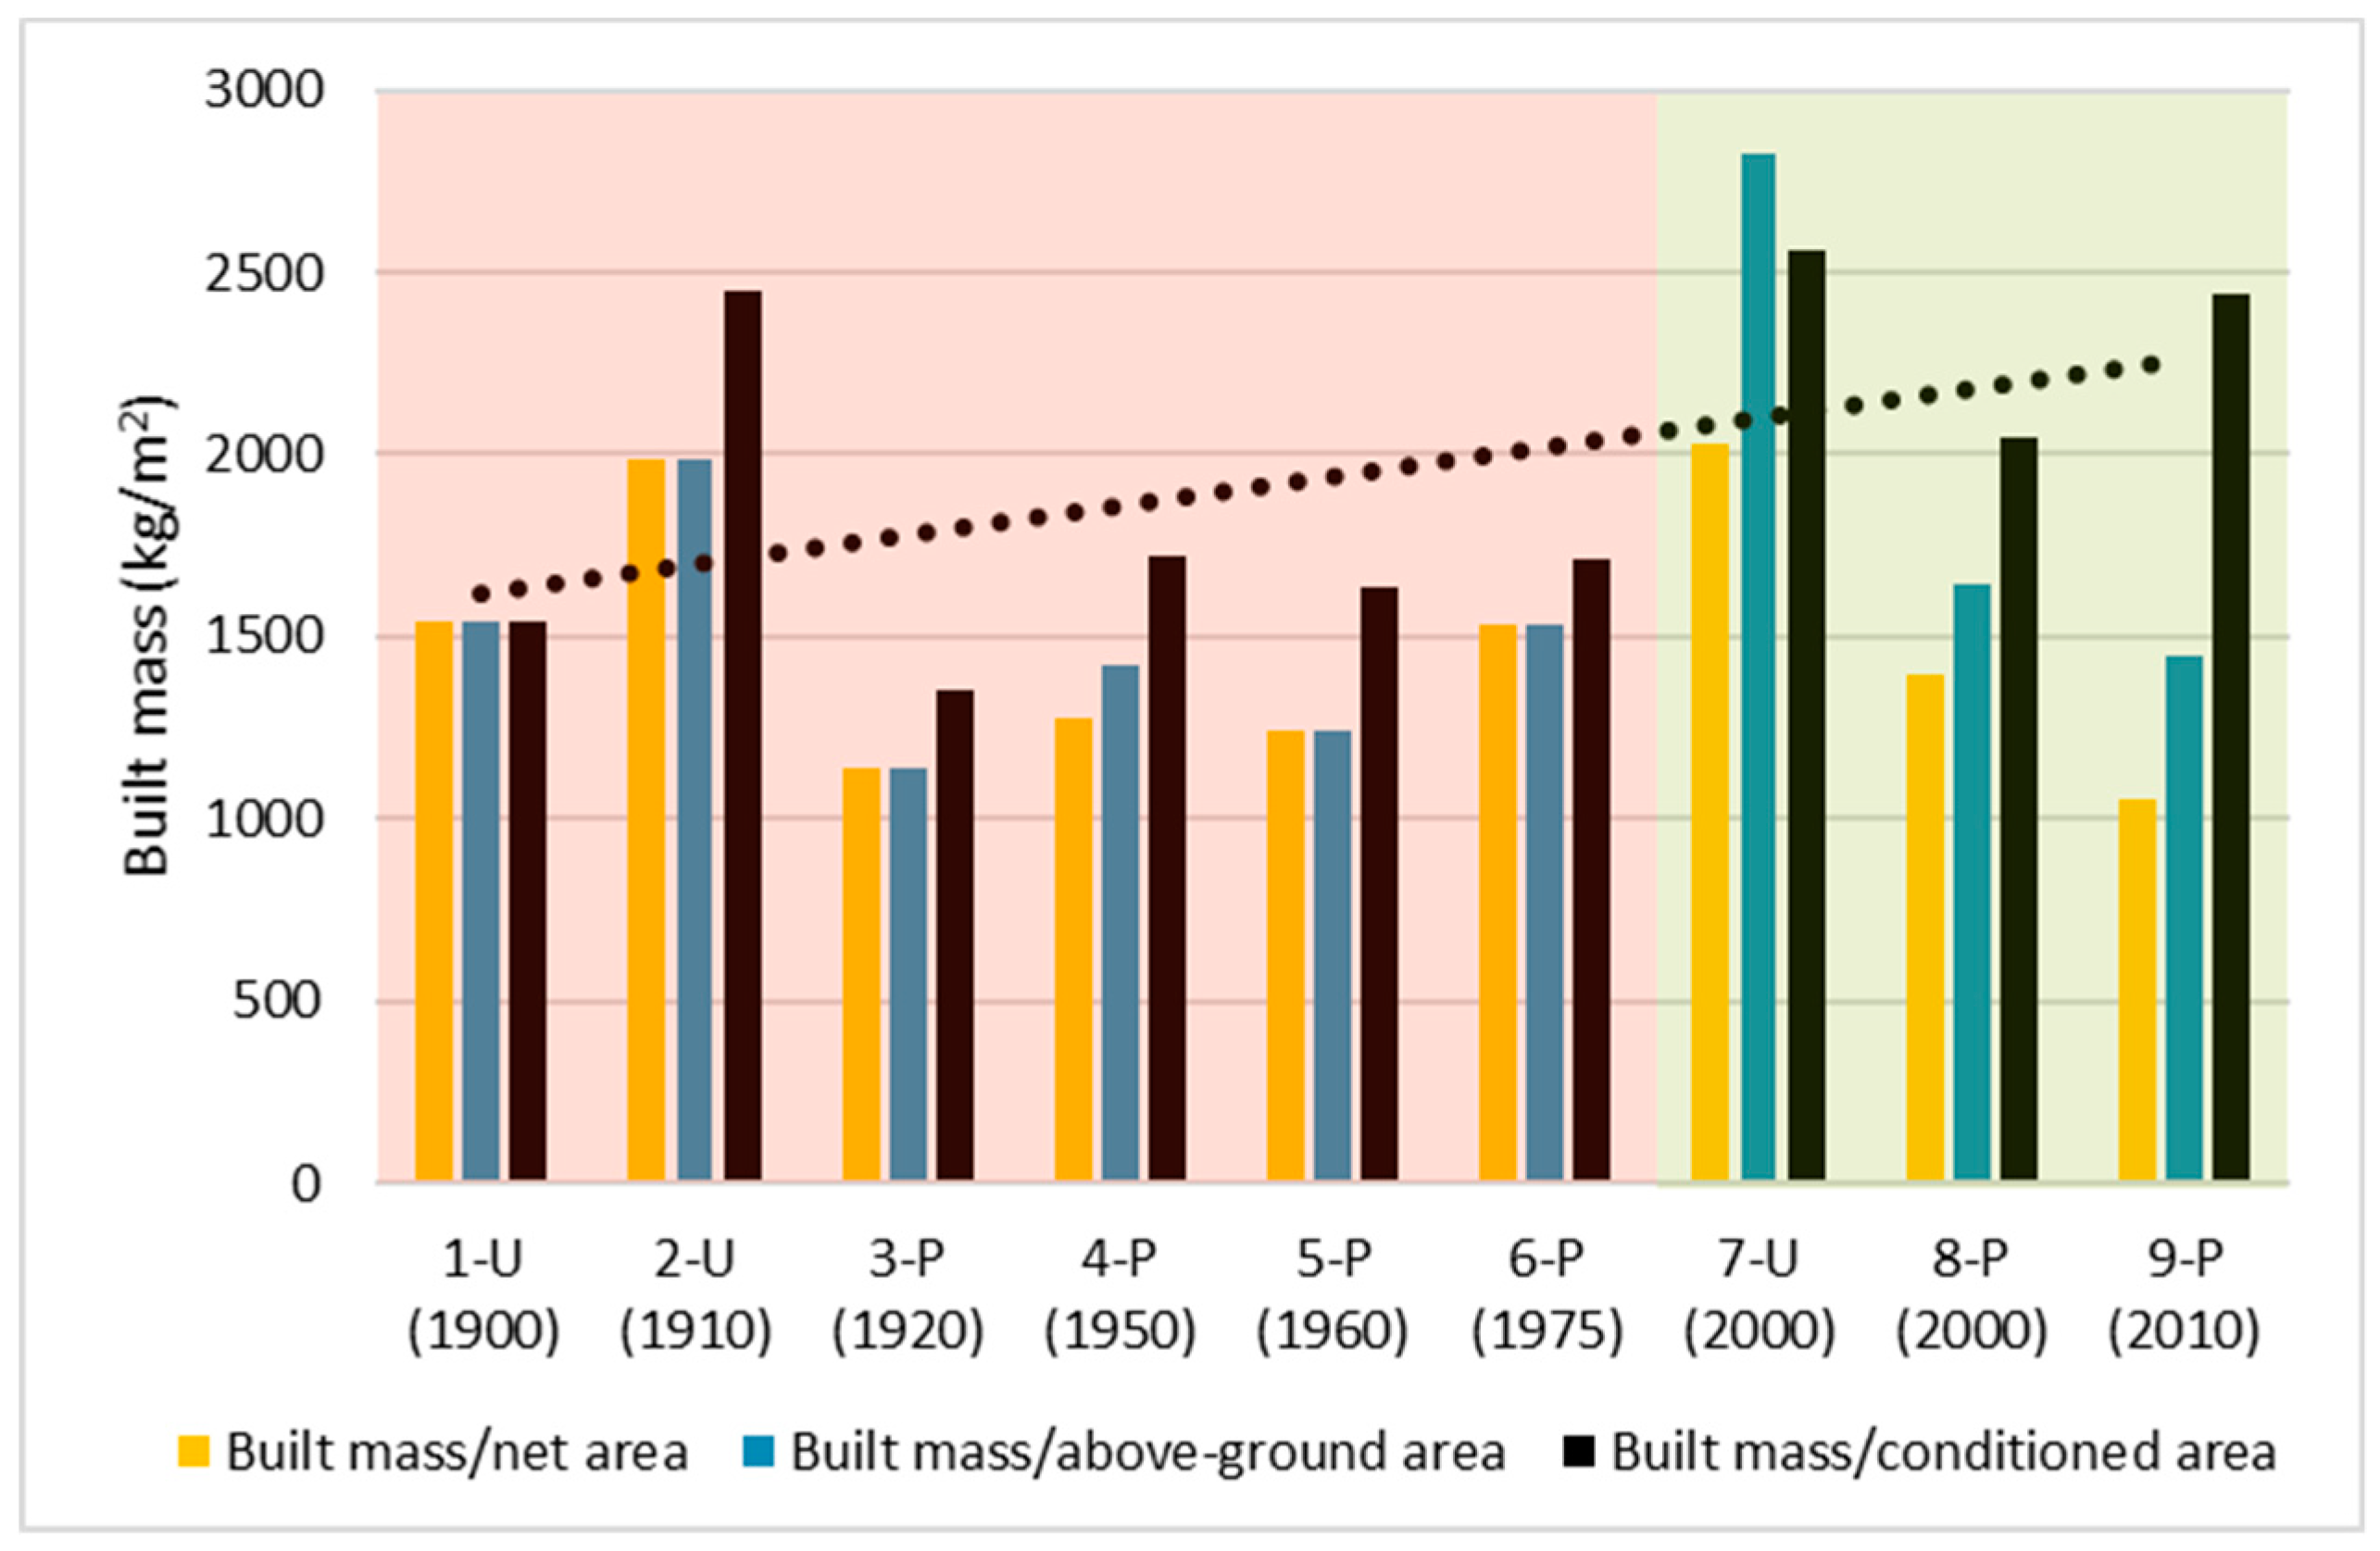
The mass of building elements for housing typologies is shown in Table 3 and Figure 2. By comparing values for each considered area, a significant variation can be observed, up to above 2-fold (1052–2030 kg/m2). In general, recent buildings, built after the first Thermal Insulation Ordinance (post-TIO), result heavier than traditional buildings, built before the Ordinance, (pre-TIO), as well as row houses have more BM per unit area than apartment blocks.
The mass variation among the three areas (net, above-ground and conditioned) helps us identify the most suitable area to be put in relation to the energy demand. Net area, since includes car parking, equipment rooms and storage in the computation has some difficulty in the application as reference value among different housing types that not always contain this sort of spaces. Except for case 4-P, pre-TIO buildings do not have underground spaces and, for this reason, it is not appropriate to compare the above-ground area when considering historical buildings, as in this case. On the contrary, the built mass to conditioned area ratio, namely the BM, could represent a reliable parameter of the relation between mass of building elements and energy demand, because it could describe differences both in term of housing types both in terms of building technologies. In fact, the growth of mass during the last century is due to the combined effect of the introduction of new building technologies, housing standards and building codes. The reinforced concrete has established itself as one of the most diffused building materials of the last century, especially in Southern Europe cities like Rome and Barcelona. The building construction methods and technologies based on this material have produced heavier building elements e.g., floors, roofs, frame structures, retaining walls, etc. In addition, in response to the growing demand of structural safety building and structural design codes provide minimum requirements to safeguard public health, safety, comfort and wellbeing of the occupants. These codes address structural strength, sanitation, adequate lighting and ventilation, energy conservation, fire safety and minimum standards for building elements during different periods in history. As a general trend, the combined effect of all these aspects determine that the more recent the building the more the BM per unit area.
At the same time, BM could represent differences in housing types i.e., apartment blocks used to have more common spaces compared to row houses and detached houses, such as atrium, stairs, storage, underground car parking, etc. Moreover, each building typology is characterised by specific relations among the different parts: floor area ratio, built-up volume, served to servant spaces ratio, conditioned area to total area ratio, glazed to opaque envelope ratio, etc.
It seems clear that the BM would be the most appropriate indicator, among those presented, to be related to building energy use. Moreover, this indicator might give a more precise quantitative evaluation of building matter accumulation in urban texture, compared to others indicators established in the field, such as building volume and Technomass. Consequently, a more accurate description of the building compartment within the Technomass is given, including a positive impact on urban metabolism studies.
3.2. Energy Demand Analysis
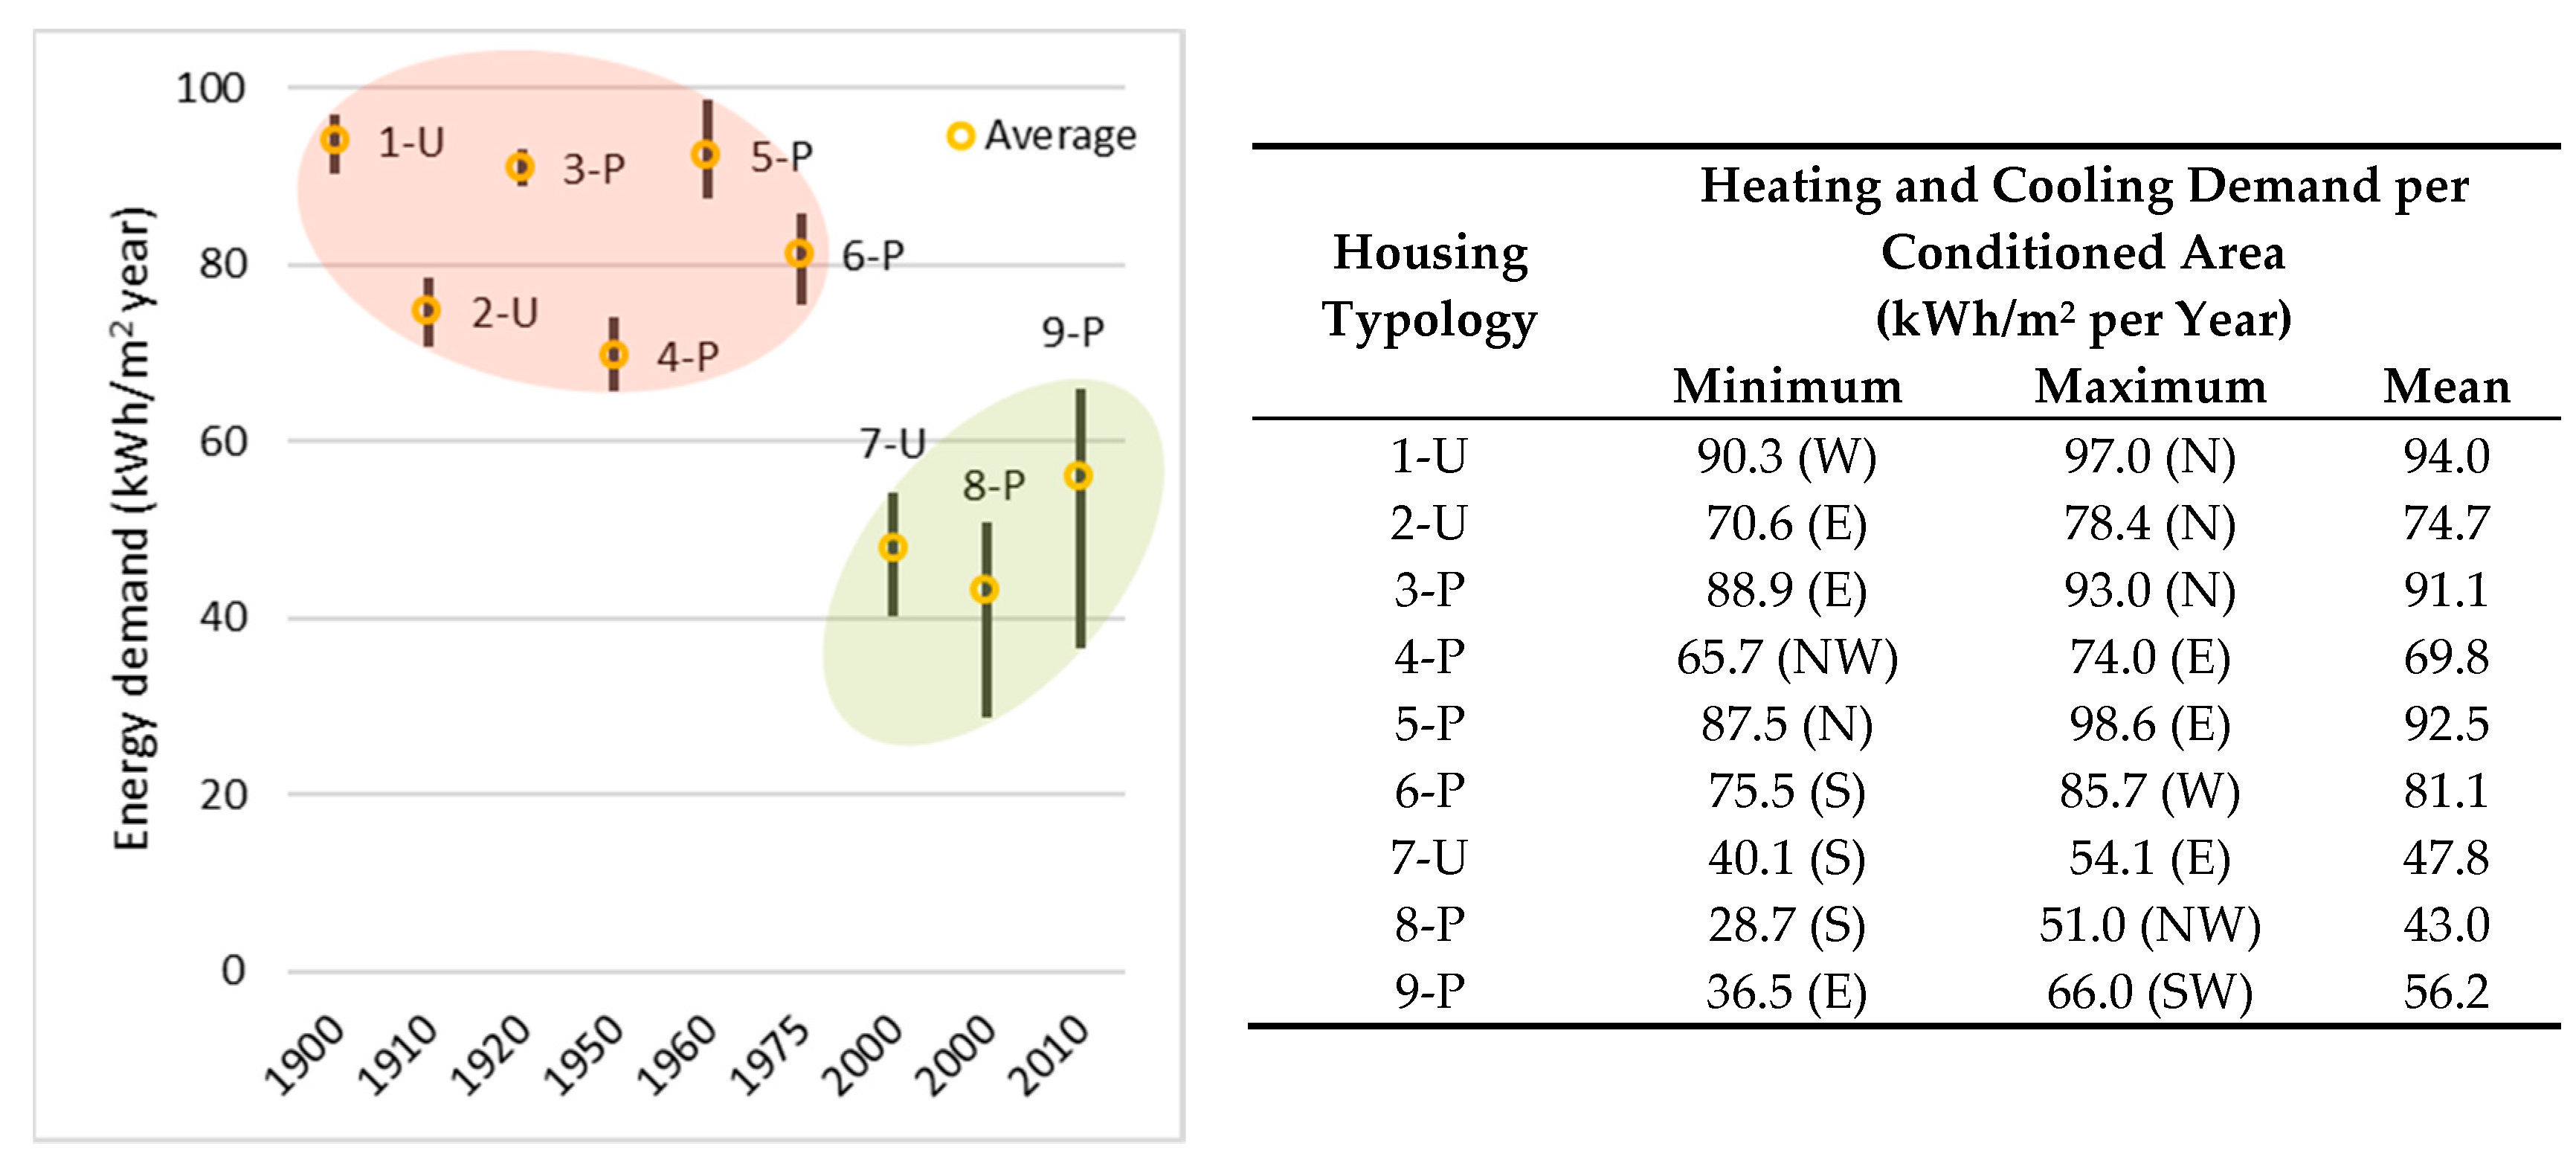
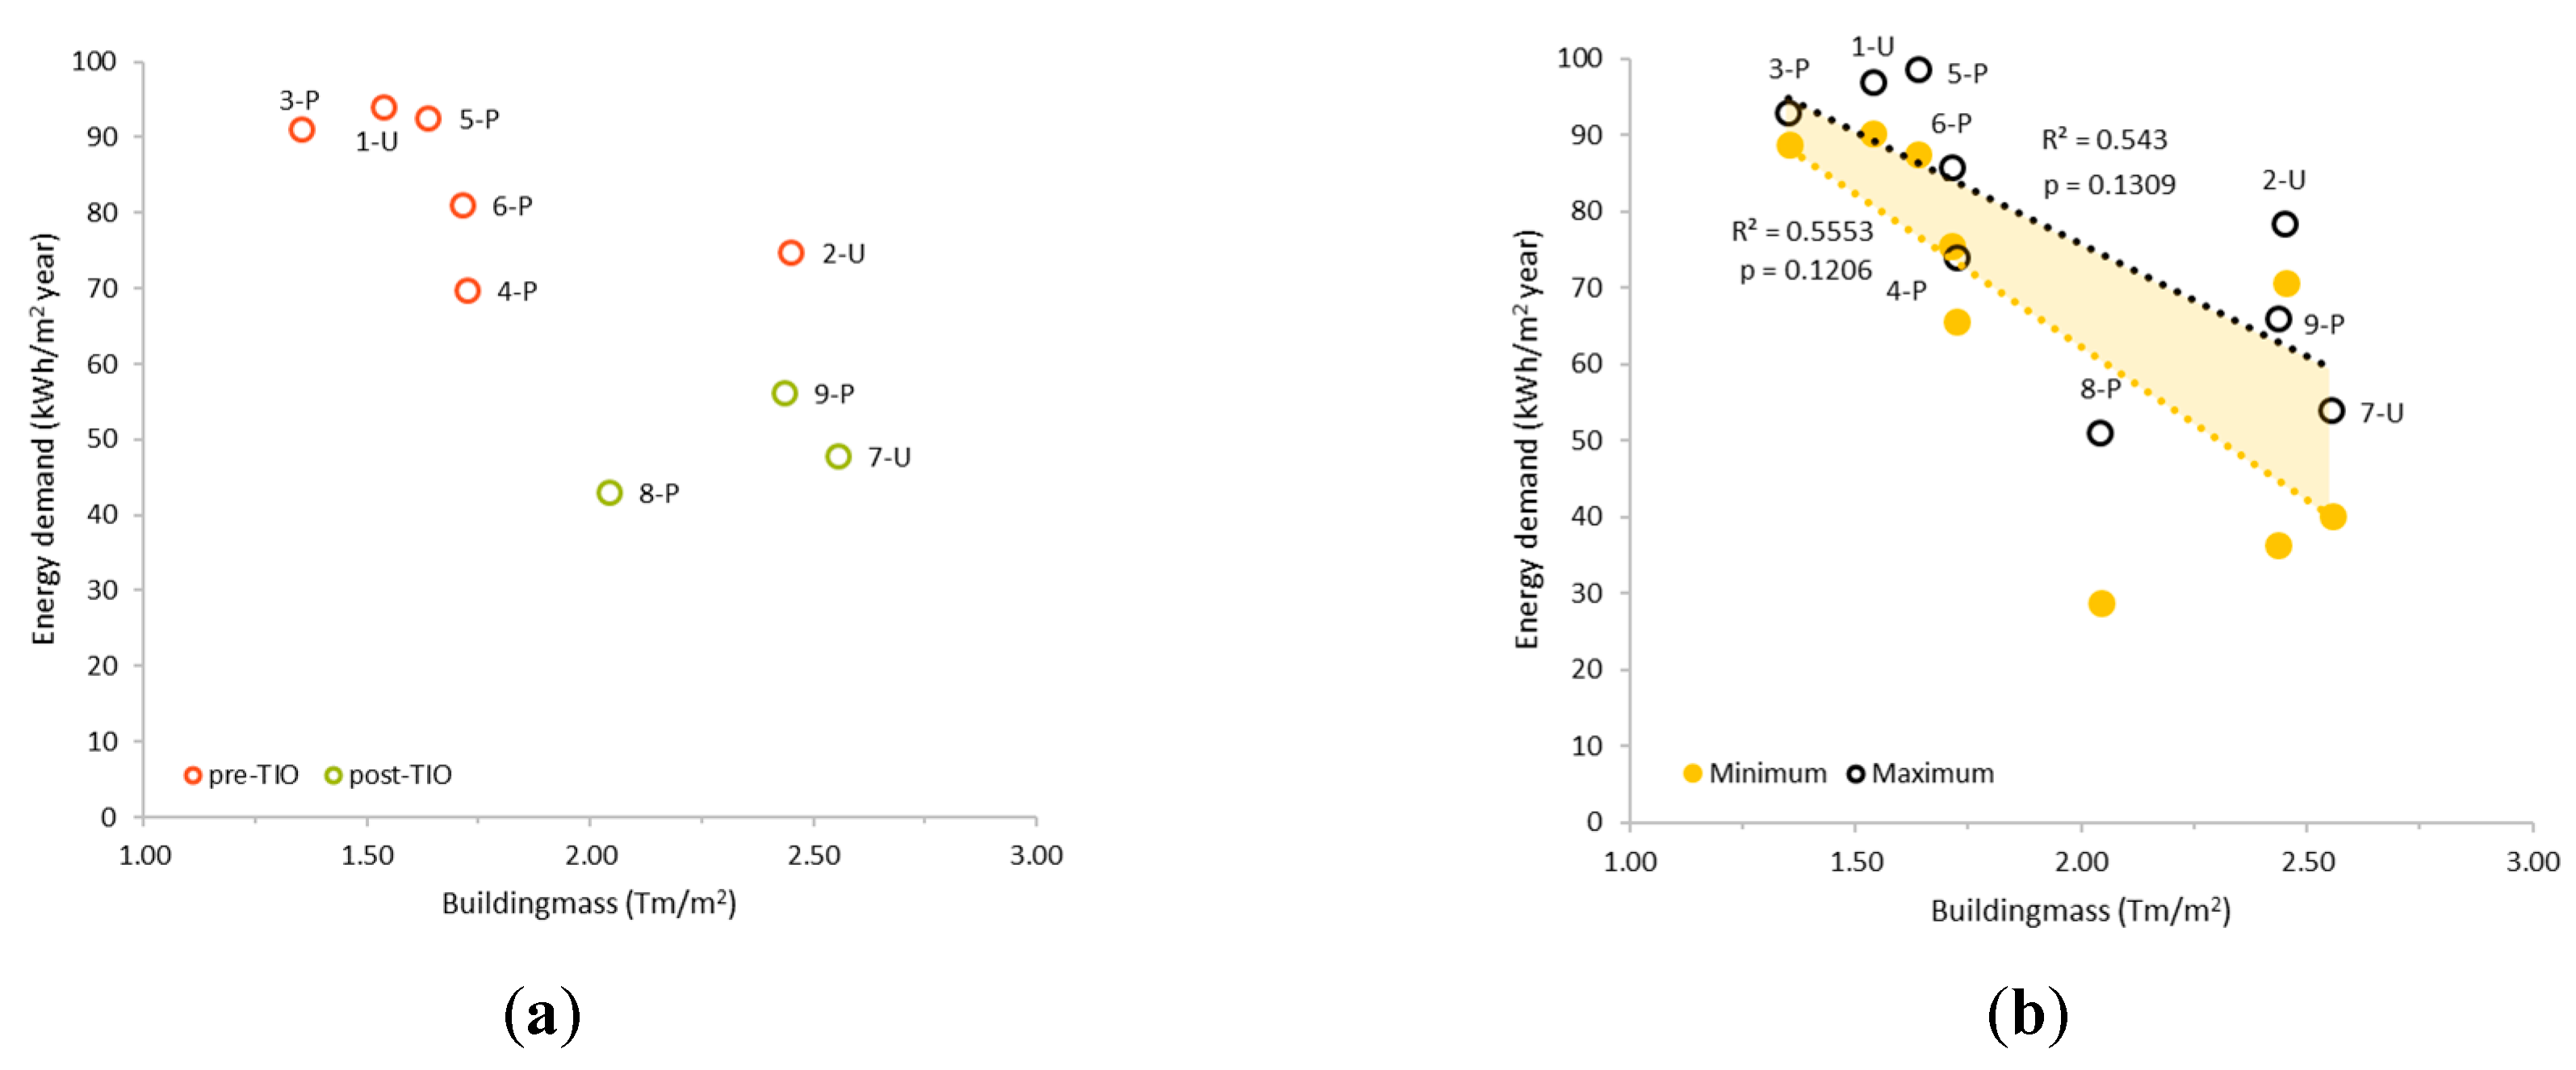
Figure 3 shows mean, minimum and maximum values of energy demand related to conditioned area, derived by all the analysed orientations for case studies. Pre-TIO buildings perform differently compared to post-TIO buildings. The former group of building is less sensitive to orientation changes, as described by variations among minimum and maximum energy demand values (an increase of 5–14% and of 4–11 kWh/m2 per year) but requires more energy per conditioned area compared to the latter (an increase equal to about 70%). On the contrary, post-TIO group is more sensitive to orientation but more energy efficient due to thermal properties of the building envelope. In this group, differences between minimum and maximum values reach up to 80% and additional energy demand of about 30 kWh m–2 per year (9–P).
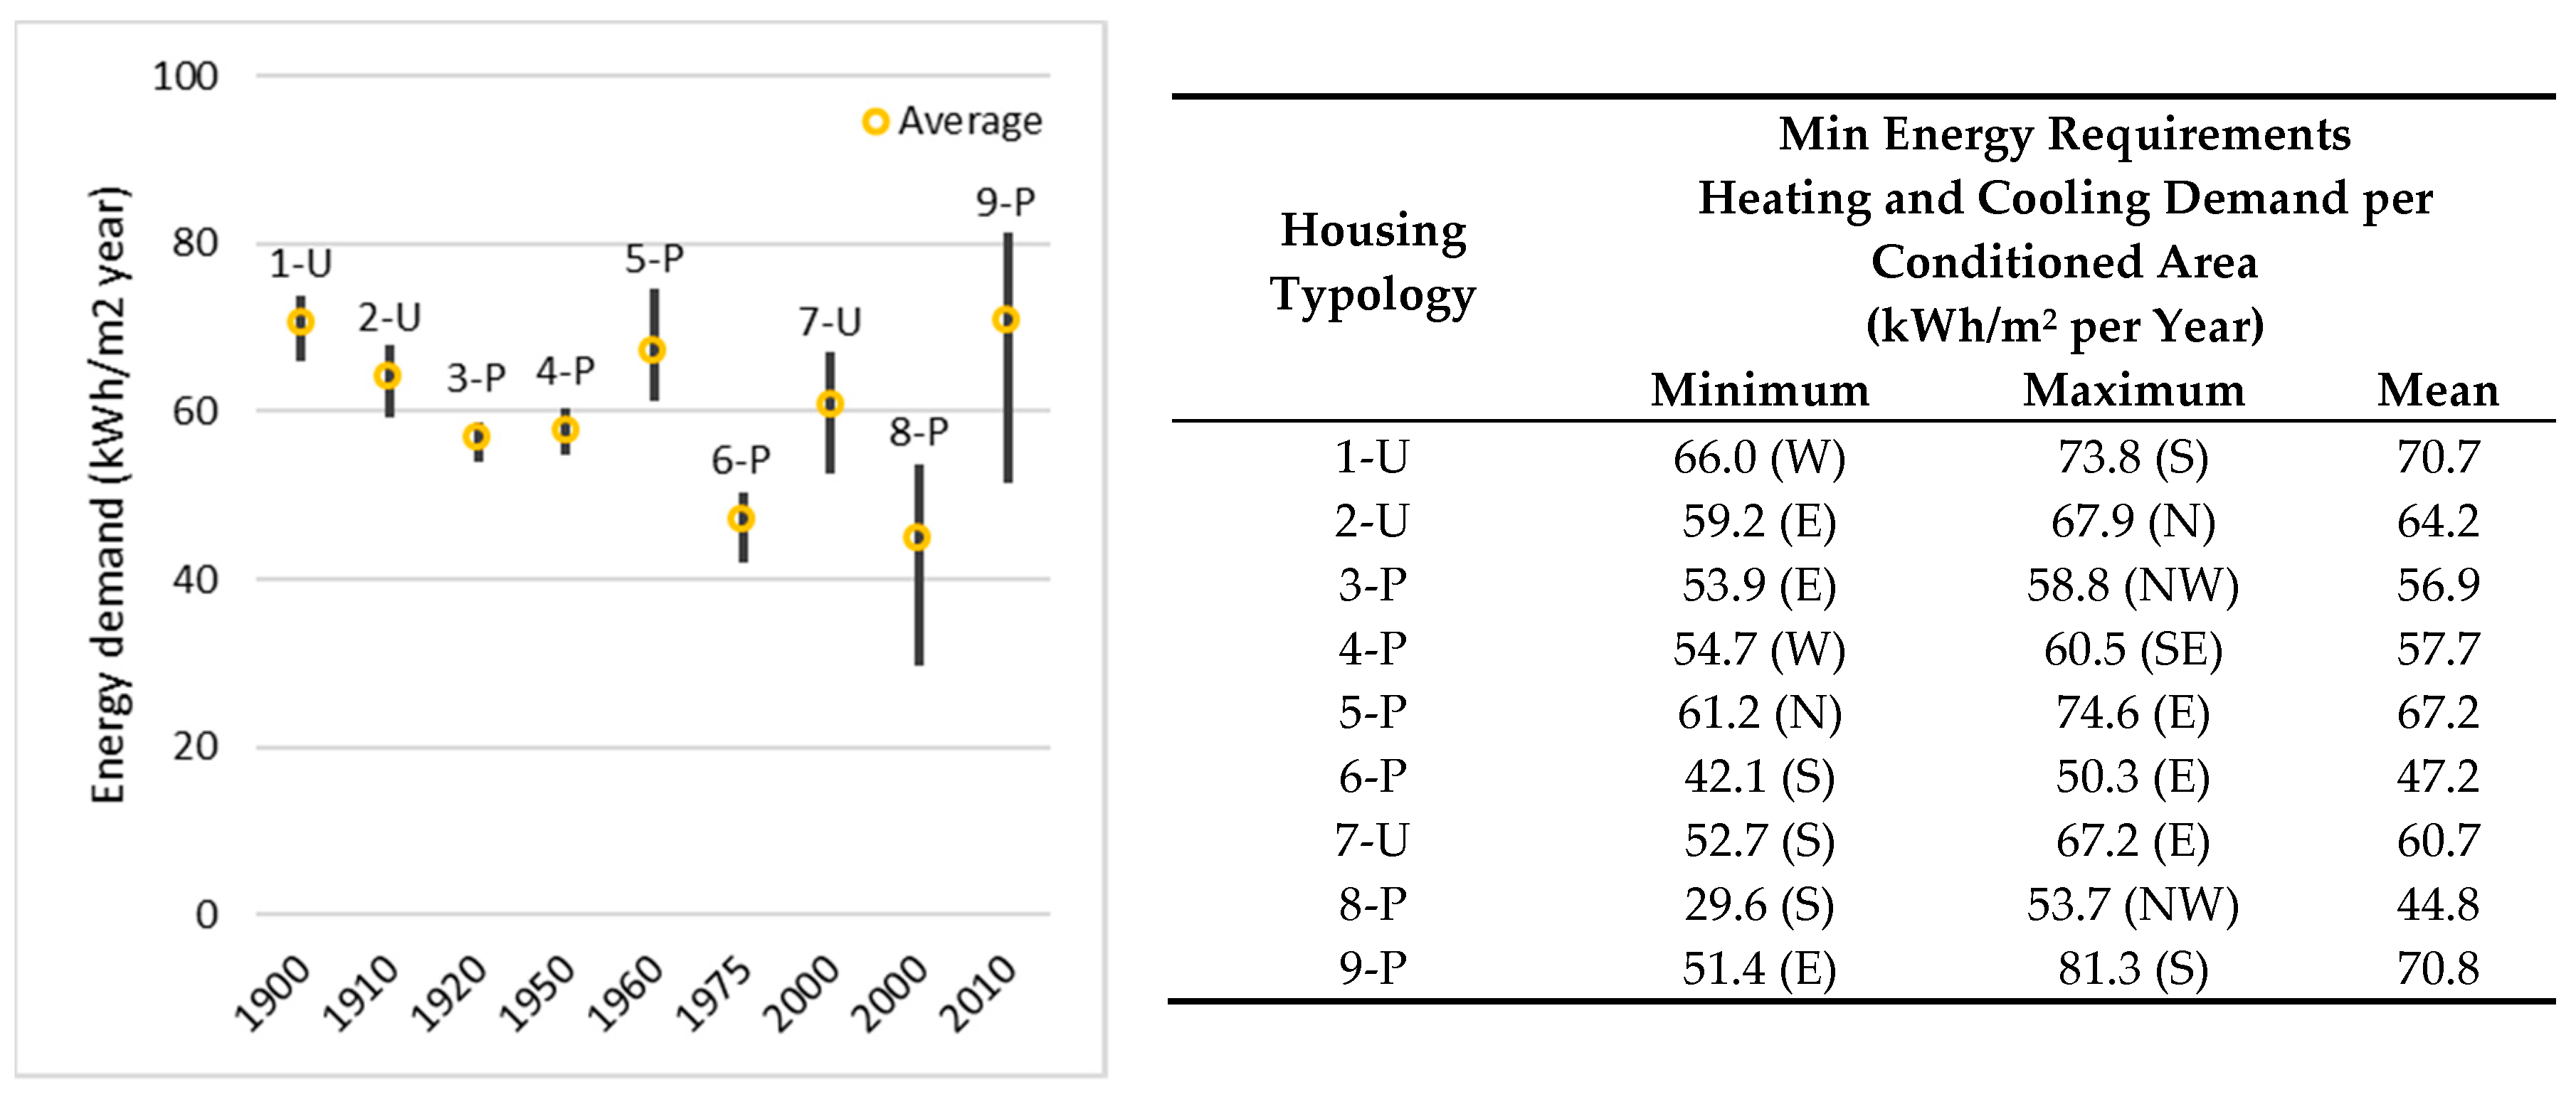
To explore the effect of energy retrofit on case studies, we estimate heating and cooling demand introducing minimum energy performance requirements of the Spanish Building Code as shown in [44]. It should be noted that the retrofit actions applied to post-TIO buildings must be understood as an estimation that aims to uniformly compare post-TIO buildings with pre-TIO buildings. Actually, the post-TIO buildings exceed the minimum energy performance requirements as shown in Figure 3 and Figure 4.
Figure 4 shows a comparison of the effect of retrofit actions on the envelope based on minimum energy requirements among the different housing typologies. The results show the positive effect of these actions in pre-TIO buildings that can rely on the combination of high thermal inertia of traditional building technologies based on masonry for the envelope and, specifically, for the façades.
3.3. Buildingmass and Energy Demand
The relation between BM and energy demand in the selected housing typologies is shown in Figure 5. In general, this relation shows that in the Mediterranean climate, the mass has relevance on the energy performance of traditional housing buildings (pre-TIO), characterised by envelopes with low thermal resistance: the heavier the building elements per unit area are, the more efficient the building is. Moreover, recent buildings are heavier and more energy efficient than traditional buildings (Figure 5a). Although the results demonstrate that a reliable trend cannot be found, we can state that the more the mass per unit area is, the more the housing typology is sensitive to changes in orientation (Figure 5b). In the most of case studies, as we expected, the south orientation helps reducing energy demand, while it is worth noting that east orientation generates both the minimum energy demand for cases 2-U, 3-P and 9-P, both the maximum energy demand for cases 4-P, 5-P and 7-U (Figure 3).
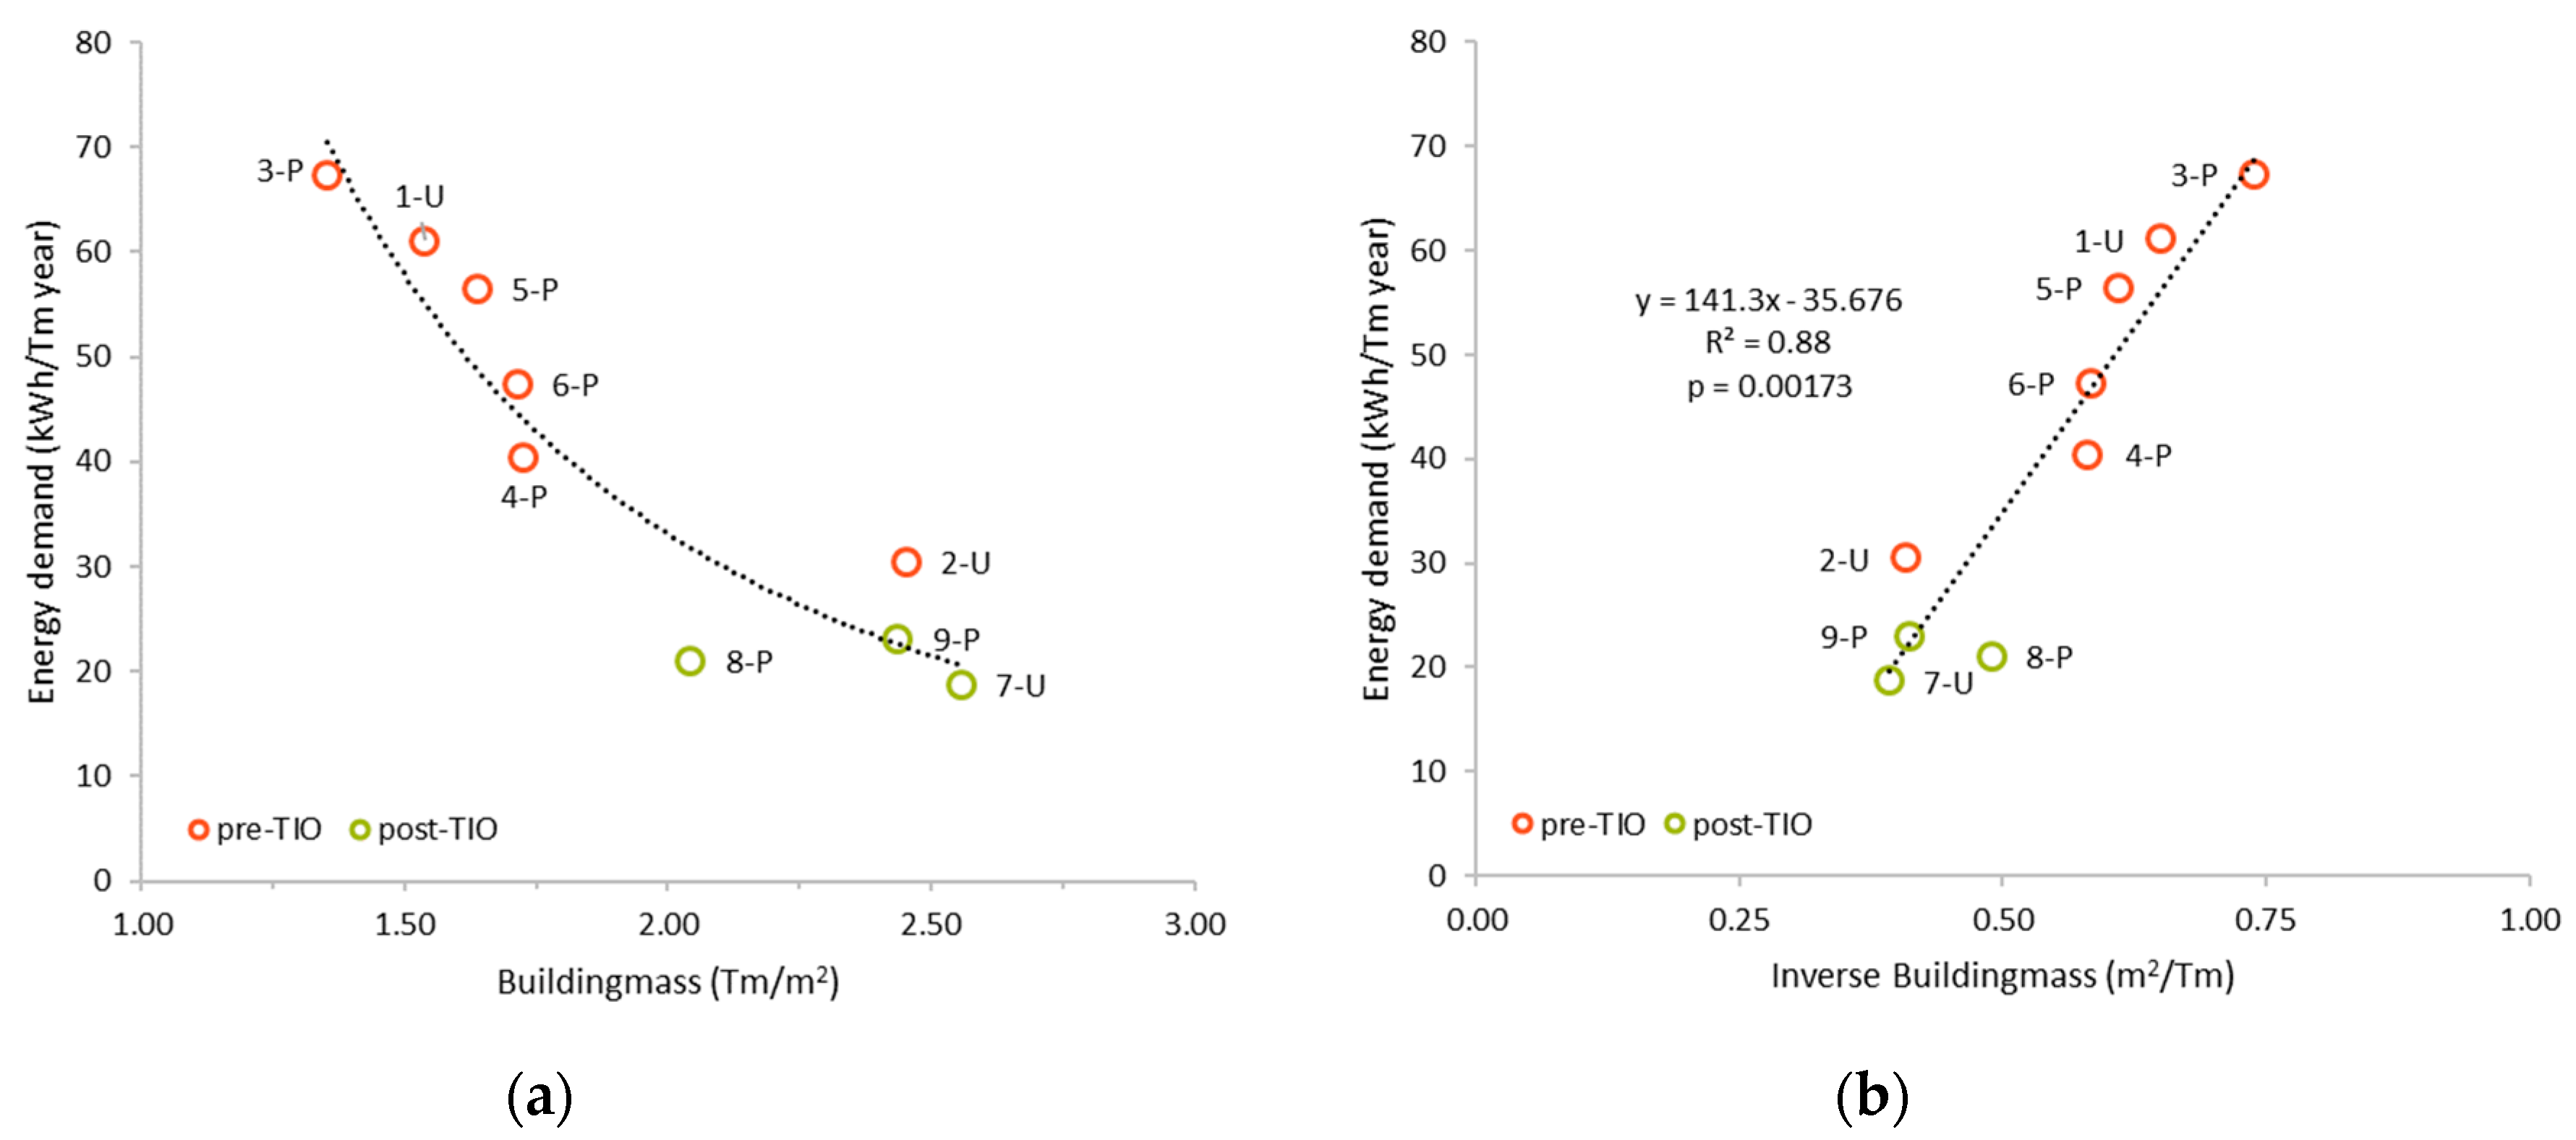
On the contrary, if we use the kWh/Tm per year as energy indicator a more clear correlation could be found with BM (Table 3 and Figure 6). Results point out that mass has strong relevance on energy as described by the fittings as Formulas (2) (Figure 6a) and the linearization of (3) (Figure 6b):
where y represents the annual energy demand per conditioned BM unit (kWh/Tm per year) and x respectively the BM of thermal conditioned area in Equation (2) (Tm/m2) and the inverse of BM in Equation (3). Hence, the greater the mass per conditioned area, the less its energy demand for heating and cooling per mass unit. Recent housing typologies have heavier construction systems (mass per conditioned area) and, at the same time, they have a lower energy demand (because of building energy codes). This trend could also depend on the large amount of built mass corresponding to unconditioned spaces such as underground car parks. It should be stressed that cases 2-U and 8-P are outliers in relation to the general trend. The former, probably due to a heavy-weight load-bearing walls in relation to the building surface; the latter, on the contrary, benefits from wider structural spans and from lighter construction system for the envelope combined to a bigger dwelling size. Moreover, results show that the greater the mass per conditioned area is, the more similar the relation between mass and energy is, in both traditional and recent cases.
y = 126.6x−1.935
y = 141.3x − 35.676 [R2 = 0.88; p = 0.00173]
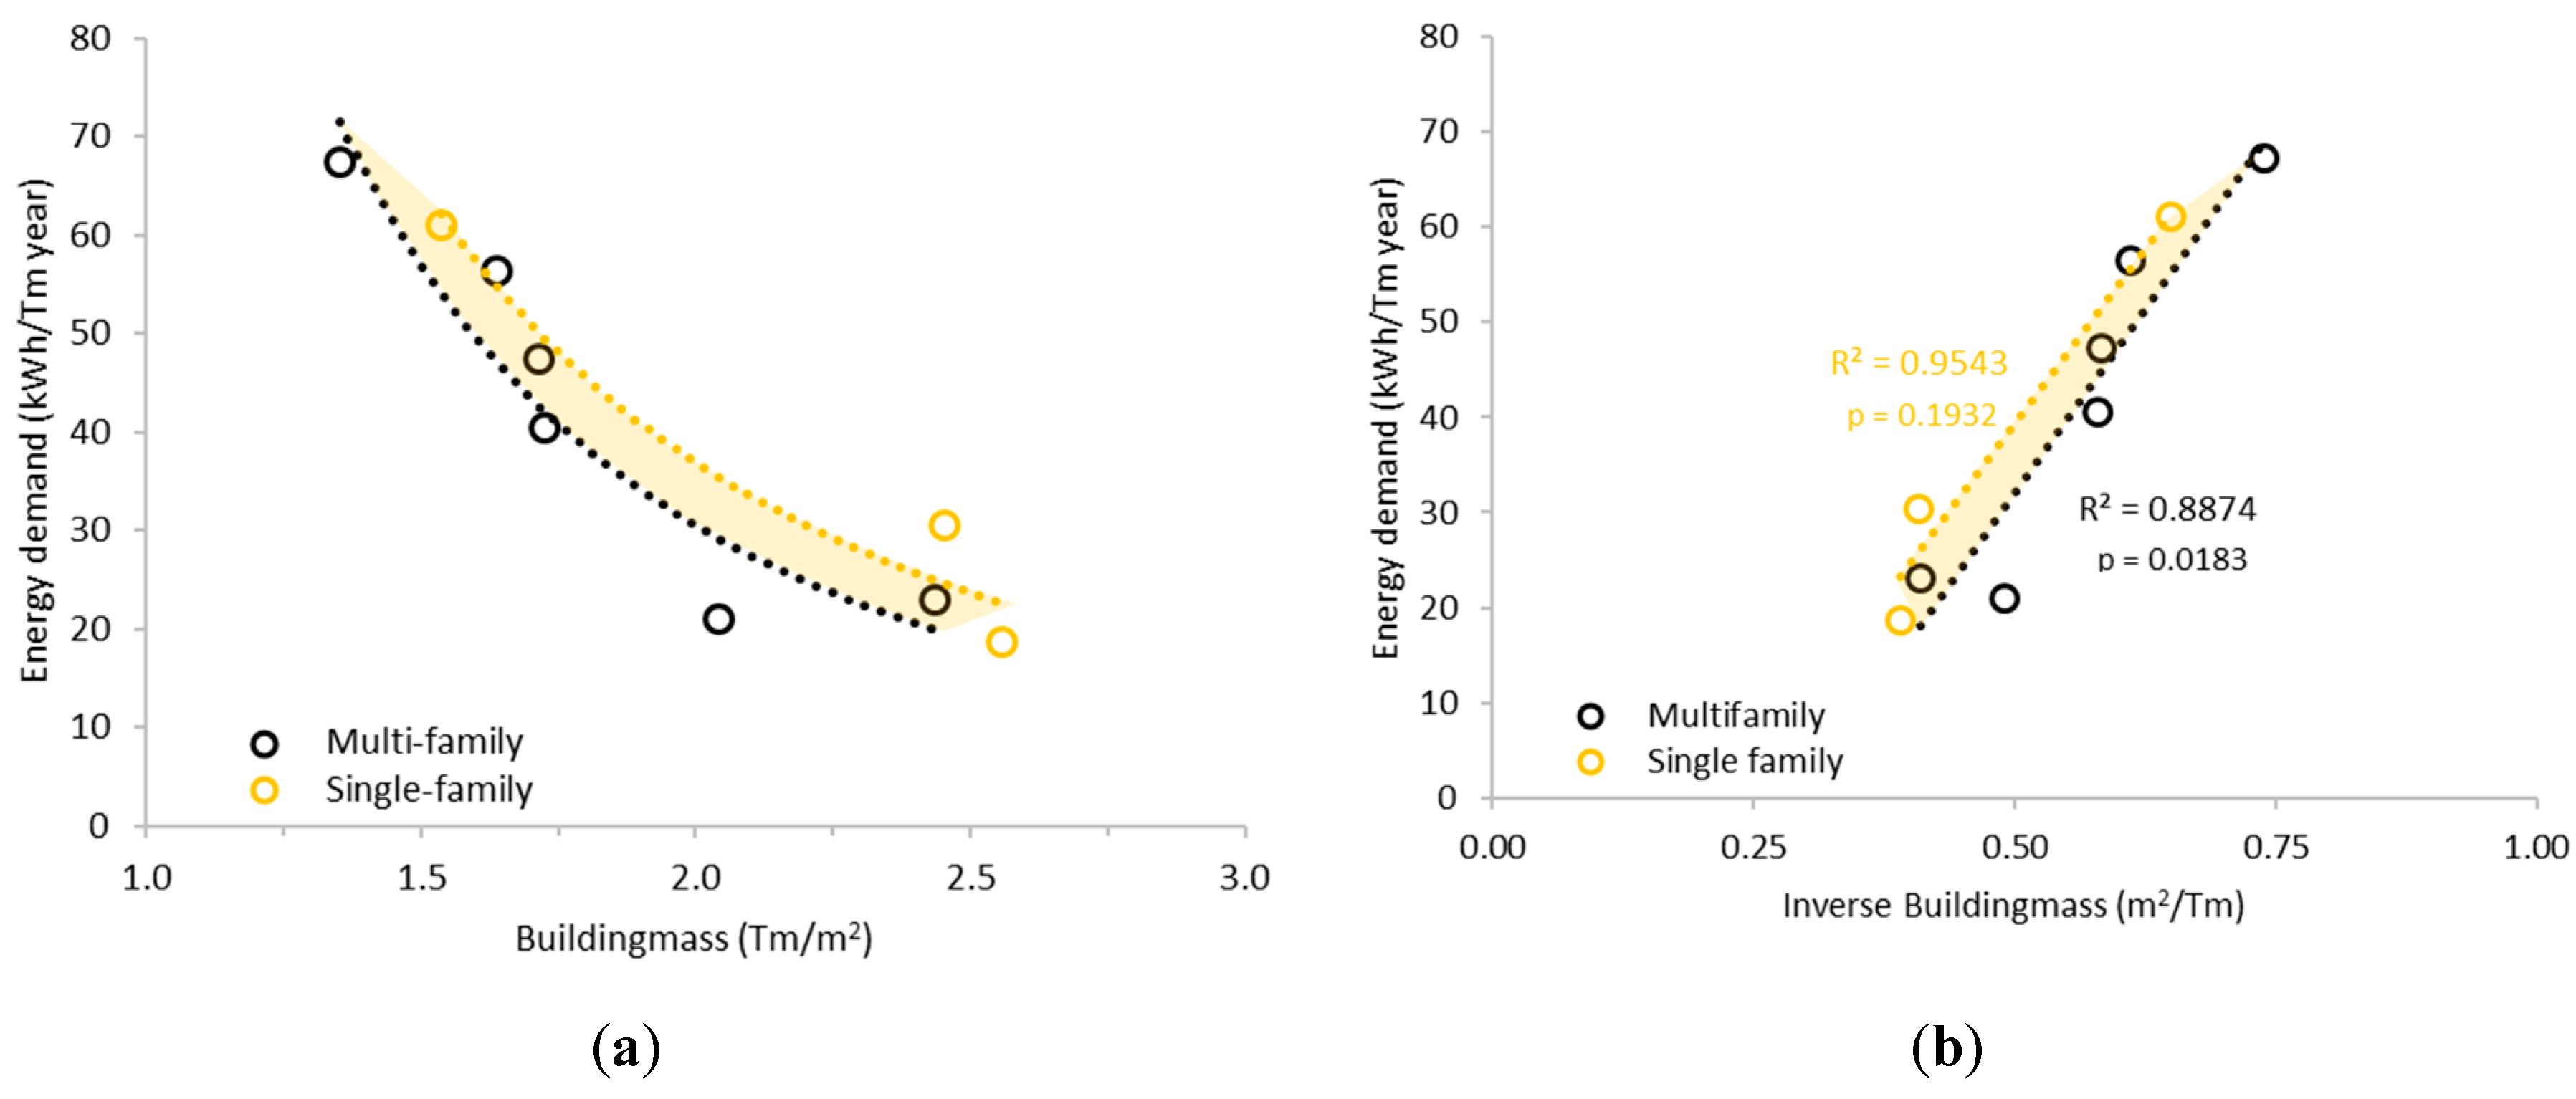
By separating case studies in two groups, depending on housing type, it is possible to notice that BM clearly describes the difference in energy efficiency between single-family and multi-family houses with good correlation. For a given BM, the latter group performs better than the former whatever the BM value is.
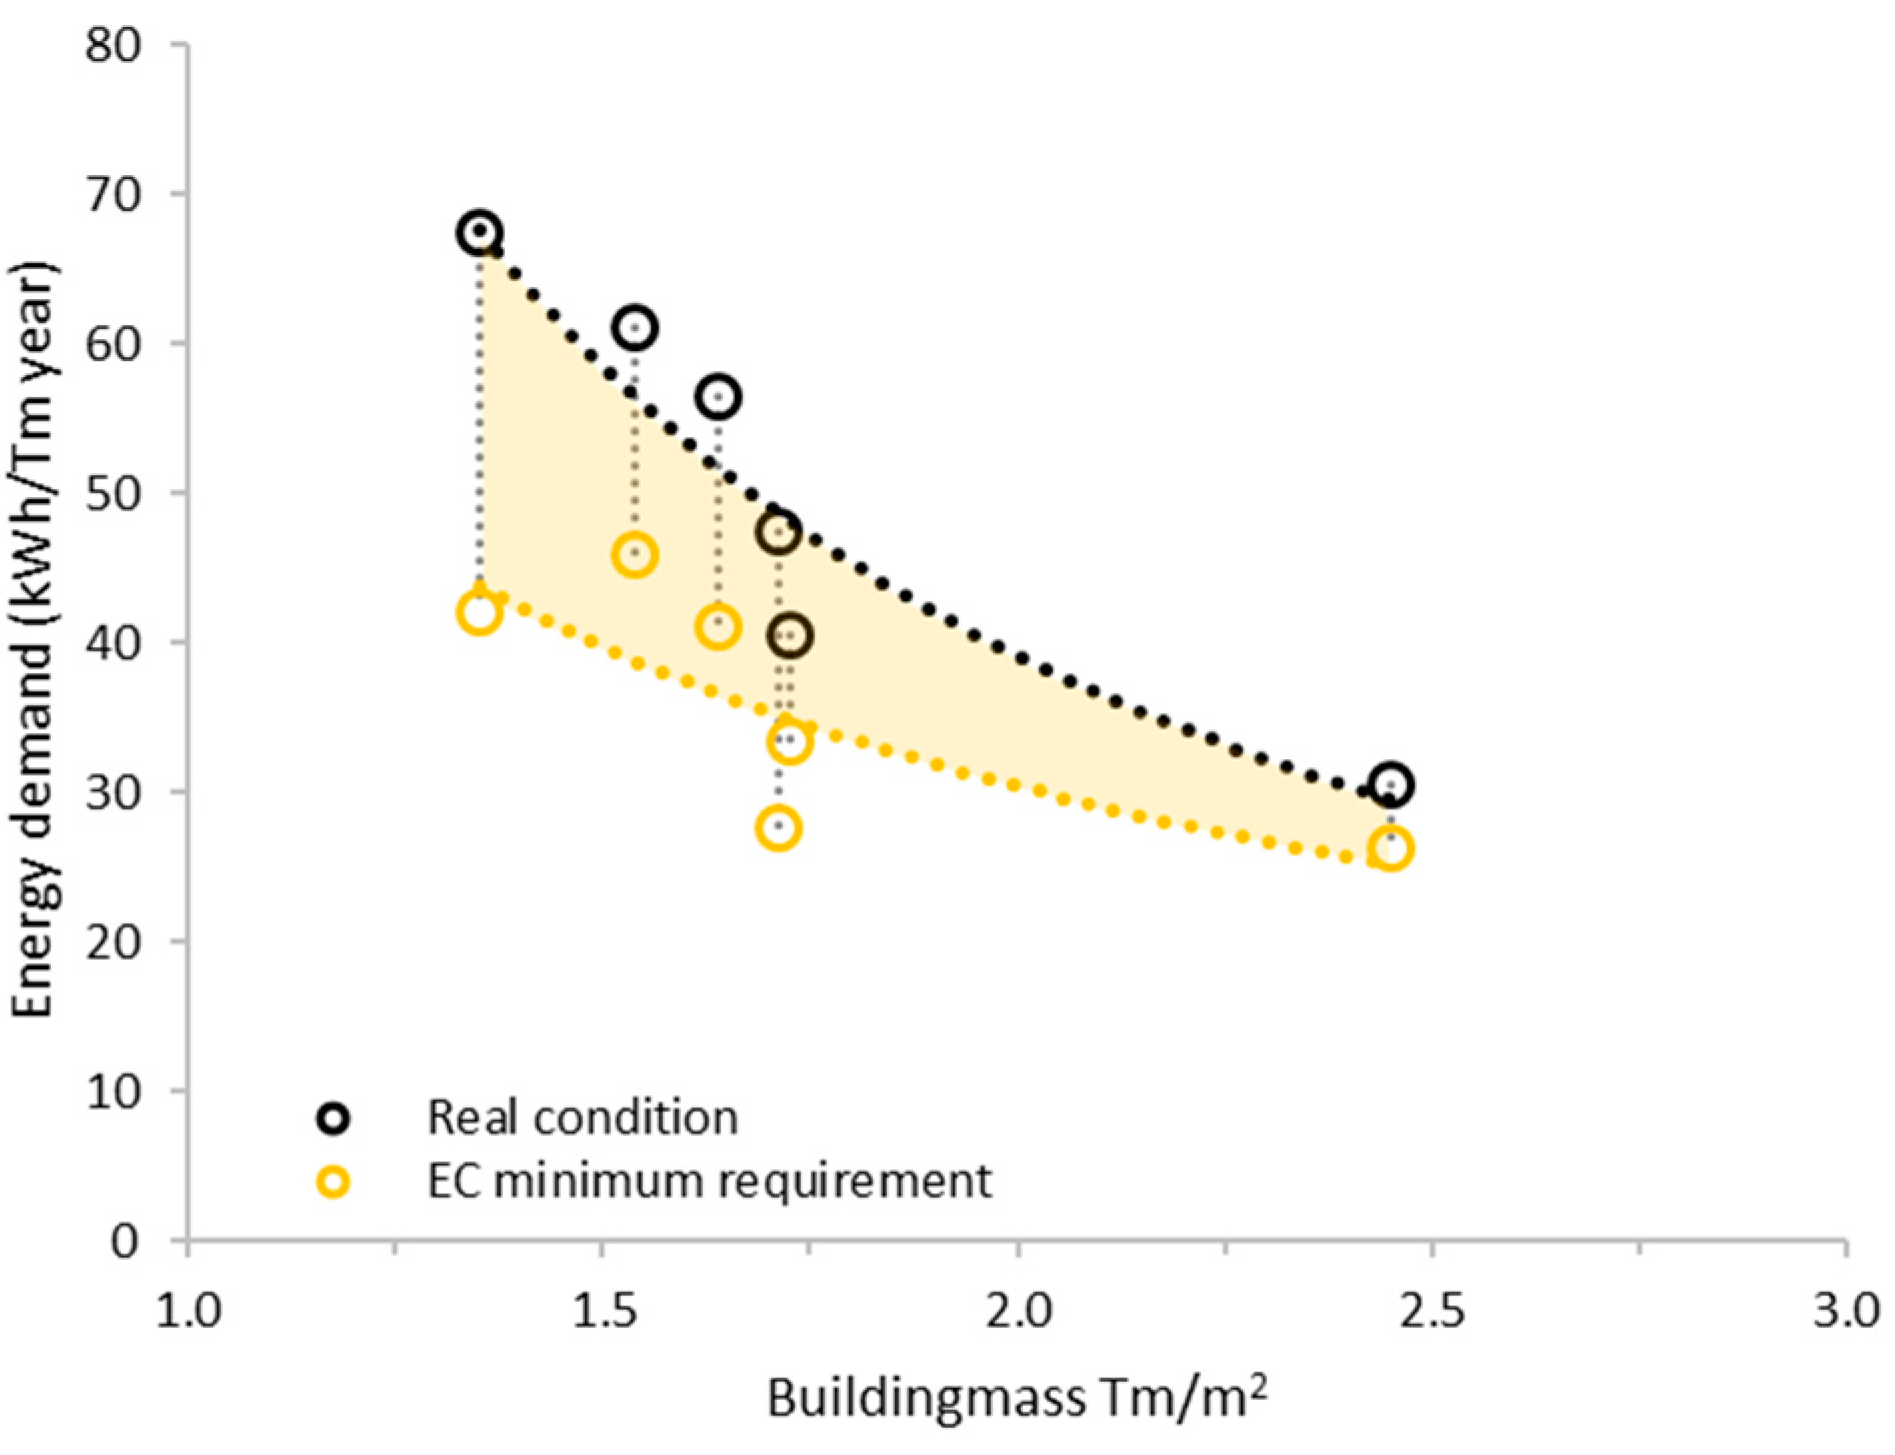
Finally, in order to understand the impact of large-scale energy retrofit design strategies, Figure 7 and Table 4 show the effect of introducing the minimum energy requirements prescribed by the Spanish Energy Code, in the case of pre-TIO housing buildings. We notice a range of reductions in energy demand between 13% and 37%, respectively, for case 2-U and 3-P. In general, it is possible to state that the more the mass, the less effective the retrofit measure.
4. Discussion and Conclusions
The Mediterranean city is an urban system characterised by a specific relation among climate, urban form, building type and building technology that affects global energy demand. Several disciplines, from urban metabolism and geography to urban and building physics are trying to explore the energy-related characteristics of urban environment and to make use of indicators to express in a synthetic way the relation between physical factors and energy performance, with the purpose of bridging the gap among existing approaches.
In this study, the Buildingmass indicator (BM) has been proposed in relation to building energy demand for heating and cooling and the method is tested in conventional housing typologies of the Mediterranean cities. Beyond the specific cases and the peculiarities of the selected housing typologies, the results give an overview of the trends that could be found among these variables. The BM plays an important role in reducing heating and cooling demand, as demonstrated by the correlation here described. The proposed indicator should be mainly applied to existing buildings of the above-mentioned cities with a threefold purpose:
- to assess the heating and cooling energy demand in order to set a framework of the housing stock;
- to estimate energy savings potential—as prescribed by national regulations of energy efficiency in Europe—and the effectiveness of minimum energy performance requirements in relation to housing typologies;
- to support policymakers in the definition of typology-oriented incentives aiming at fostering energy conservation measures for the housing stock.
In details, several specific implications of the findings can be discussed. The combination of high BM and low energy demand makes the building orientation a key factor for energy efficiency of modern housing buildings. On the contrary, traditional housing buildings, characterised by higher energy demand and lower BM, match with different orientations of the urban textures more easily, reducing the energy demand range. In addition, as such traditional buildings are based on masonry load-bearing walls, the great part of the global BM is located in the opaque envelope and have lower glazing ratios. These features increase the thermal inertia of the envelope and, in the Mediterranean climate, help both to level out wintertime fluctuations in air temperature caused by solar heat gains and heat losses, both to moderate high daytime temperatures, reducing energy demand and fostering indoor thermal comfort.
To significantly improve the energy efficiency of the Mediterranean city, it is crucial to promote energy retrofit strategies especially on housing buildings with lighter building elements. By comparing pre-TIO and post-TIO building groups, a greater impact of BM on the former can be observed; however, a further study is necessary in order to give a more detailed description of this condition. Moreover, this effort could lead to a more precise definition of the correlation BM-energy demand by grouping the housing typologies into different housing types, as suggested by Figure 8. This figure shows that the relation between BM and energy demand is useful to describe different efficiency level for each housing type. On one side, this suggests that the concept of housing type is a synthetic way to understand the energy efficiency of the housing stock. It describes, through geometrical factors, different ways and intensities to accumulate building matters and people in the urban textures: row houses, apartment blocks, towers, etc. are the basic components of the urban form; it even indicates different efficiency levels in the use of space and energy. On the other side, housing type is not able to describe other key factors in the energy efficiency of the built environment: climate, period of construction, spatial and housing models, technologies, design rules, building codes, planning regulations, economic constraints, building construction techniques, organization of construction companies and worksite organizations, too. Indeed, housing typology, rather than housing type, could be a concept useful to express the complexity of city, as comprises in its definition the inhabitants’ needs and several of those factors. For this reason, it is crucial to deeper explore the ability of the BM to act as energy indicator for housing typologies.
However, the proposed method has some limitations in terms of validity of the results, size of the housing typology set and time needed for the evaluation. At this stage, the effectiveness of BM to compare different energy systems and the associated energy consumption (renewable, storage, etc.) has not yet been tested. However, since it was observed that the relation between BM and energy demand could be useful to guide energy retrofit actions based on the characteristics of the building stock, future work will have to be oriented in defining these actions taking into account energy systems as well as generation and storage capability.
The energy performance should be interpreted as a relative assessment rather than an absolute value in relation to the buildings selected as representative of the conventional housing typologies. As stated above, this assessment aims at characterising the housing building stock in urban metabolism studies through a synthetic indicator. An extension of the number of case studies is necessary both in order to obtain a more precise correlation between BM and energy, both to achieve a wider group of building archetypes. The accuracy of the absolute estimations depends on several parameters of the Lider dynamic model: among others the most directly related to the characteristics of building typologies are the microclimate conditions and the urban heat island effect, as well as the impact of the building envelope on the heat transfer model (air infiltration rate, thermal bridges and thermal properties of materials).
The mass estimation process is based on detailed analysis of the housing buildings and their building elements that requires a quite amount of time. An evolution of this phase toward an automated process based both on physical features and available data should be considered. With reference to this aspect, a more detailed analysis of the BM in association with distinct building elements—i.e., the envelope and the others internal building elements—would help to define a more accurate correlation between BM and energy demand thanks to a better adherence of the heat transfer process with thermal properties of building materials in the Mediterranean climate, highlighting the importance of thermal inertia.
Finally, this work has a twofold purpose. Firstly, moving from the definition of Technomass in urban metabolism [16], it contributes to a more precise description of buildings (and in particular of the building compartment) based on housing archetypes rather than statistical or spatial data. In this way, the set of housing types, as defined by Palme et al., could be enlarged, fitting the different urban textures [40]. Secondly and in conclusion, bridging the existing gap between urban physics and urban metabolism studies, this work can support policymaker decisions according to building energy performance, in order to differentiate public investments and incentives and foster energy conservation measures in the Mediterranean cities.
Author Contributions
Conceptualization, M.M.; methodology, M.M. and A.P. with A.I.; investigation, M.M. and A.P.; data curation, A.I.; writing—original draft preparation, M.M.; writing—review and editing, M.M.; visualization, M.M.; supervision, H.C. and A.I.; funding acquisition, M.M.
Funding
This research and the APC were funded by Sapienza Università di Roma, grant number AR21715C82226BCC.
Acknowledgments
The authors acknowledge support from Spanish project BIA 2016-77675-R.
Conflicts of Interest
The authors declare no conflict of interest.
References
- United Nations Agenda 2030 Sustainable Development Goals. Available online: https://sustainabledevelopment.un.org/sdg11 (accessed on 29 January 2019).
- WWF. Position Paper on the Revision of the EPBD; WWF: Brussels, Belgium, 2017. [Google Scholar]
- European Climate Foundation. Roadmap 2050: A Practical Guide to a Prosperous, Low Carbon Europe; ECF: The Hague, The Netherlands, 2010. [Google Scholar]
- Market Observatory for Energy, European Commission. Europe’s Energy Position: Markets & Supply; Market Observatory for Energy Report; Publications Office of the European Union: Luxembourg, 2010. [Google Scholar]
- Inostroza, L.; Hamstead, Z.; Spyra, M.; Qhreshi, S. Beyond urban–rural dichotomies: Measuring urbanisation degrees in central European landscapes using the technomass as an explicit indicator. Ecol. Indic. 2019, 96, 466–476. [Google Scholar] [CrossRef]
- Reinhart, C.F.; Davila, C.C. Urban building energy modeling: A review of a nascent field. Build. Environ. 2016, 97, 196–202. [Google Scholar] [CrossRef]
- Rodríguez-álvarez, J. Landscape and Urban Planning Urban Energy Index for Buildings (UEIB): A new method to evaluate the effect of urban form on buildings’ energy demand. Landsc. Urban Plan. 2016, 148, 170–187. [Google Scholar] [CrossRef]
- de Lemos Martins, T.A.; Adolphe, L.; Bastos, L.E.G.; de Lemos Martins, M.A. Sensitivity analysis of urban morphology factors regarding solar energy potential of buildings in a Brazilian tropical context. Sol. Energy 2016, 137, 11–24. [Google Scholar] [CrossRef]
- Kesten, D.; Tereci, A.; Eicker, U. A method to quantify the energy performance in the Urban Quarters. In Proceedings of the IAQVEC 2010: 7th International Conference on Indoor Air Quality, Ventilation and Energy Conservation in Buildings, Syracuse, NY, USA, 15–18 August 2010. [Google Scholar]
- Baker, N.; Steemers, K. Energy and Environment in Architecture: A Technical Design Guide; E & FN Spon: London, UK; New York, NY, USA, 2000; ISBN 0419227709. [Google Scholar]
- Ratti, C.; Baker, N.; Steemers, K. Energy consumption and urban texture. Energy Build. 2005, 37, 762–776. [Google Scholar] [CrossRef]
- Nault, E.; Peronato, G.; Rey, E.; Andersen, M. Review and critical analysis of early design phase evaluation metrics for the solar potential of neighborhood designs. Build. Environ. 2015, 92, 679–691. [Google Scholar] [CrossRef]
- Martí Arís, C. Le Variazioni Dell’identità il Tipo in Architettura; CittaStudiEdizioni: Torino, Italy, 1994; ISBN 9788870059052. [Google Scholar]
- Loga, T.; Diefenbach, N.; Stein, B.; Dascalaki, E.; Balaras, C.A.; Droutsa, K.; Kontoyiannidis, S.; Villatoro, O.; Wittchen, K.B. Main Results of the TABULA Project. In Typology Approach for Building Stock Energy Assessment; Institut Wohnen und Umwelt: Darmstadt, Germany, 2012. [Google Scholar]
- Isalgue, A.; Coch, H.; Serra, R. Scaling laws and the modern city. Phys. A Stat. Mech. Appl. 2007, 382, 643–649. [Google Scholar] [CrossRef]
- Inostroza, L. Measuring urban ecosystem functions through “Technomass”—A novel indicator to assess urban metabolism. Ecol. Indic. 2014, 42, 10–19. [Google Scholar] [CrossRef]
- Steadman, P.; Bruhns, H.R.; Holtier, S.; Gakovic, B.; Rickaby, P.A.; Brown, F.E. A classification of built forms. Environ. Plan. B Plan. Des. 2000, 27, 73–91. [Google Scholar] [CrossRef]
- Kavgic, M.; Mavrogianni, A.; Mumovic, D.; Summerfield, A.; Stevanovic, Z.; Djurovic-Petrovic, M. A review of bottom-up building stock models for energy consumption in the residential sector. Build. Environ. 2010, 45, 1683–1697. [Google Scholar] [CrossRef]
- Dascalaki, E.G.; Droutsa, K.G.; Balaras, C.A.; Kontoyiannidis, S. Building typologies as a tool for assessing the energy performance of residential buildings—A case study for the Hellenic building stock. Energy Build. 2011, 43, 3400–3409. [Google Scholar] [CrossRef]
- Csoknyai, T.; Hrabovszky-Horváth, S.; Georgiev, Z.; Jovanovic-Popovic, M.; Stankovic, B.; Villatoro, O.; Szendrő, G. Building stock characteristics and energy performance of residential buildings in Eastern-European countries. Energy Build. 2016, 132, 39–52. [Google Scholar] [CrossRef]
- Loga, T.; Diefenbach, N.; Stein, B.; Dascalaki, E.; Balaras, C.A.; Droutsa, K.; Kontoyiannidis, S.; Villatoro, O.; Wittchen, K.B. Final Project Report: Appendix Volume. In Typology Approach for Building Stock Energy Assessment; Institut Wohnen und Umwelt: Darmstadt, Germany, 2012; p. 172. [Google Scholar]
- Florio, P.; Teissier, O. Estimation of the energy performance certificate of a housing stock characterised via qualitative variables through a typology-based approach model: A fuel poverty evaluation tool. Energy Build. 2015, 89, 39–48. [Google Scholar] [CrossRef]
- Ratti, C.; Raydan, D.; Steemers, K. Building form and environmental performance: Archetypes, analysis and an arid climate. Energy Build. 2003, 35, 49–59. [Google Scholar] [CrossRef]
- Morello, E.; Ratti, C. Sunscapes: “Solar envelopes” and the analysis of urban DEMs. Comput. Environ. Urban Syst. 2009, 33, 26–34. [Google Scholar] [CrossRef]
- Morello, E.; Gori, V.; Balocco, C.; Ratti, C. Sustainable Urban Block Design through Passive Architecture A tool that uses urban geometry optimization to compute energy savings. In PLEA2009—26th Conference on Passive and Low Energy Architecture; Demers, C., Potvin, A., Eds.; Les Presses de l’Université Laval: Quebec City, QC, Canada, 2009. [Google Scholar]
- Tereci, A.; Ozkan, S.T.E.; Eicker, U.; Elias Ozkana, S.T.; Eickerb, U. Energy benchmarking for residential buildings. Energy Build. 2013, 60, 92–99. [Google Scholar] [CrossRef]
- Kühnert, C.; Helbing, D.; West, G.B. Scaling laws in urban supply networks. Phys. A Stat. Mech. Appl. 2006, 363, 96–103. [Google Scholar]
- Lämmer, S.; Gehlsen, B.; Helbing, D. Scaling laws in the spatial structure of urban road networks. Phys. A Stat. Mech. Appl. 2006, 363, 89–95. [Google Scholar] [CrossRef] [Green Version]
- Morganti, M.; Pages-Ramon, A.; Isalgue, A.; Coch, H.; Cecere, C. Built-form, mass and energy: Urban fabric performance. In Proceedings—28th International PLEA Conference on Sustainable Architecture + Urban Design: Opportunities, Limits and Needs—Towards an Environmentally Responsible Architecture; Pontificia Universidad Católica del Perú: Lima, Peru, 2012. [Google Scholar]
- Morganti, M.; Pages-Ramon, A.; Isalgue, A.; Cecere, C.; Coch Roura, H. Urban Fabric Performance in the Mediterranean City: A Typology Based Mass-Energy Analysis; EPFL: Lausanne, Switzerland, 2013; pp. 581–586. [Google Scholar]
- Cocchioni, C.; De Grassi, M.; Vittori, A.M. La Casa Popolare a Roma: Trent’anni di Attività del I. C. P.; Kappa: Roma, Italy, 1984. [Google Scholar]
- Paricio Casademunt, A. Secrets d’un Sistema Constructiu: l’Eixample, 2nd ed.; Edicions UPC: Barcelona, Spain, 2008; ISBN 9788483019719. [Google Scholar]
- Fondo Ridolfi-Frankl-Malagricci. Available online: http://www.fondoridolfi.org/ (accessed on 29 January 2019).
- Díaz Gómez, C. Aproximació a L’evolució i al Comportament Derivat de les Tècniques Constructives Utilitzades en els Tipus Edificatoris Exempts Destinats a Habitatge Econòmic a Catalunya (Periode 1954/1976). Ph.D. Thesis, UPC Barcelona Tech, Barcelona, Spain, 1991. [Google Scholar]
- Todaro, B.; Giancotti, A.; De Matteis, F. Il Secondo Progetto. Interventi Sull’abitare Pubblico; Prospettive Edizioni: Roma, Italy, 2013; ISBN 9788889400920. [Google Scholar]
- Sandberg, N.H.; Sartori, I.; Heidrich, O.; Dawson, R.; Dascalaki, E.; Dimitriou, S.; Vimm-r, T.; Filippidou, F.; Stegnar, G.; Šijanec Zavrl, M.; et al. Dynamic building stock modelling: Application to 11 European countries to support the energy efficiency and retrofit ambitions of the EU. Energy Build. 2016, 132, 26–38. [Google Scholar] [CrossRef] [Green Version]
- Julia, S.; Davila, C.; Reinhart, C.F. Validation of a Bayesian-based method for defining residential archetypes in urban building energy models. Energy Build. 2017, 134, 11–24. [Google Scholar] [CrossRef]
- Li, Q.; Quan, S.J.; Augenbroe, G.; Yang, P.P.; Brown, J. Building Energy Modelling at Urban Scale: Integration of Reduced Order Energy Model with Geographical Information. In Proceedings of the BS2015: 14th Conference of International Building Performance Simulation Association, Hyderabad, India, 7–9 December 2015. [Google Scholar]
- Kristensen, M.H.; Hedegaard, R.E.; Petersen, S. Hierarchical calibration of archetypes for urban building energy modeling. Energy Build. 2018, 175, 219–234. [Google Scholar] [CrossRef]
- Palme, M.; Inostroza, L.; Salvati, A. Technomass and cooling demand in South America: A superlinear relationship? Build. Res. Inf. 2018, 46, 864–880. [Google Scholar] [CrossRef]
- Instituto de Tecnología de la Construcción de Cataluña Banco BEDEC-ITeC. Available online: https://metabase.itec.cat/vide/es/bedec (accessed on 29 January 2019).
- CIES—Centre d’Iniciatives per a l’Edificació Sostenible. Treballs de Recerca Previs per a la Redacció del Llibre Blanc per a l’Etiquetatge Verd dels Productes per a la Construcció; Departament de Medi Ambient de la Generalitat de Catalunya: Barcelona, Spain, 2011. [Google Scholar]
- Ministerio de Fomento. Código Técnico de la Edificación de España-Documento Básico HE Ahorro de energía; Gobierno de Espana: Madrid, Spain, 2017. [Google Scholar]
- Ministerio de Fomento. LIDER-CALENER (HULC); Gobierno de Espana: Madrid, Spain, 2017. [Google Scholar]
Figure 1.
Comparison between the monthly average of minimum and maximum dry bulb temperature, relative humidity and precipitation in Rome and Barcelona, respectively based on historical series of data from Ciampino and El Prat airport weather stations.
Figure 1.
Comparison between the monthly average of minimum and maximum dry bulb temperature, relative humidity and precipitation in Rome and Barcelona, respectively based on historical series of data from Ciampino and El Prat airport weather stations.

Figure 2.
Mass estimation for housing typologies in relation to net area (yellow), above-ground area (blue) and conditioned area (black) and separated in traditional housing buildings built before (pre-TIO, light red background) and after (post-TIO, light green background) the first Thermal Insulation Ordinance. Dotted line suggests that housing standards, building codes, construction technologies and habits tend to cause higher built mass values in more recent times.

Figure 3.
Energy demand for heating and cooling in housing typologies (pre-TIO in light red background and post-TIO in light green background). The corresponding building orientation is expressed in brackets.
Figure 3.
Energy demand for heating and cooling in housing typologies (pre-TIO in light red background and post-TIO in light green background). The corresponding building orientation is expressed in brackets.

Figure 4.
Energy demand for heating and cooling related to housing typologies, considering minimum energy requirements of the Spanish Building Code; the corresponding building orientation is expressed in brackets.
Figure 4.
Energy demand for heating and cooling related to housing typologies, considering minimum energy requirements of the Spanish Building Code; the corresponding building orientation is expressed in brackets.

Figure 5.
Buildingmass versus annual energy demand for heating and cooling: (a) mean energy demand considering eight possible orientations; (b) minimum and maximum energy demand. Empty circles: experimental values; dotted tendencies: computed fits.
Figure 5.
Buildingmass versus annual energy demand for heating and cooling: (a) mean energy demand considering eight possible orientations; (b) minimum and maximum energy demand. Empty circles: experimental values; dotted tendencies: computed fits.

Figure 6.
(a) Buildingmass versus energy demand (dotted tendency: guide to the eye). (b) Linear fit of energy demand as a function of inverse Buildingmass (dotted tendency: computed fit). Empty circles: experimental values.
Figure 6.
(a) Buildingmass versus energy demand (dotted tendency: guide to the eye). (b) Linear fit of energy demand as a function of inverse Buildingmass (dotted tendency: computed fit). Empty circles: experimental values.

Figure 7.
Comparison between reference cases (real condition) and minimum energy requirements of Spanish Building Code in the case of pre-TIO housing buildings: variation range in relation to the Buildingmass.
Figure 7.
Comparison between reference cases (real condition) and minimum energy requirements of Spanish Building Code in the case of pre-TIO housing buildings: variation range in relation to the Buildingmass.

Figure 8.
(a) Buildingmass versus energy demand. (b) Linear fit of energy demand as a function of inverse Buildingmass. Empty circles: experimental values; dotted lines: computed fits.
Figure 8.
(a) Buildingmass versus energy demand. (b) Linear fit of energy demand as a function of inverse Buildingmass. Empty circles: experimental values; dotted lines: computed fits.


Table 1.
Aerial images, typical plans, density indicators and description for housing typologies.
 | H/W 1 0.77-1.47 GSI 2 0.45 FSI 3 0.87 | Historic Row House (1900)—Two-level dwelling, with narrow façades of 5 m (length/width ratio L/W ≈ 0.4). The structure consists of load-bearing walls (15 ÷ 40 cm) above-ground masonry continuous foundation; dry stone drain; floors with wooden beams and brick vaulted ceiling; Catalan ventilated roof without thermal insulation. |
 | H/W 0.39-1.02 GSI 0.35 FSI 1.07 | Row house (1920)—Two-level dwelling (plus one basement) with load-bearing walls, above-ground masonry continuous foundations and dry stone drain; vaulted floor at ground level, floors with iron beams and hollow bricks for first level; ventilated hipped roof without thermal insulation [31]. |
 | H/W 1.21-2.83 GSI 0.49 FSI 2.92 | Historic Apartment Block (1900)—We have referred to this as a typical model of the Eixample island during the first expansion period and regulated by urban ordinance. The building has six stories (height 24 m) with planned dimensions 12 × 24 m (L/W ≈ 0.4) and internal courtyards. As in case A, the structure consists of load-bearing walls (15 ÷ 40 cm) above-ground masonry continuous foundation; dry stone drain; floors with wooden beams and brick vaulted ceiling; Catalan ventilated roof without thermal insulation. The “galeria” of the internal façade is a typical architectural element pointed out for our interests. Depending on the façade orientation and season, it could be used as an indirect solar captation system or as a simple balcony [32]. |
 | H/W 1.08-2.56 GSI 0.21 FSI 2.35 | Apartment block (1960)—Nine-level apartment block with basement and floor service on top. The construction system is based on concrete frame, shallow footing and dry stone drain; floors with one-way reinforced concrete slab and ceramic filler blocks; external hollow brick cavity walls and flat roof without thermal insulation [33]. |
 | H/W 0.41-1.27 GSI 0.13 FSI 0.77 | Historic Apartment Block (1960)—Nine level apartment block connected by L/W ≈ 0.3. The construction system is based on 14 cm hollow bricks load-bearing walls on a concrete continuous foundation; one-way slab with ceramic filler block; external cavity walls and flat concrete roof without thermal insulation [34]. |
 | H/W 1.14-1.90 GSI 0.13 FSI 0.89 | Apartment block (1975)—Seven level apartment block with floor service on top, based on concrete frame construction system and shallow footing; floors made by hollow-core concrete slab and partially by reinforced concrete slab; external precast concrete wall panels with cavity and flat roof without thermal insulation [35]. |
 | H/W 0.30-1.22 GSI 0.16 FSI 0.62 | Contemporary Row House (2000)—Three level house (and underground level) with L/W ≈ 2, consisting of hollow brick load-bearing walls on concrete base slabs; external cavity walls with thermal insulation; one-way slab with ceramic filler block; flat concrete roof with thermal insulation. |
 | H/W 0.45-0.83 GSI 0.37 FSI 2.43 | Contemporary Apartment Block (2000)—Six story dwelling and underground level; each dwelling faces only one side (“bilateral back to back” type) with L/W ≈ 2. The structure is made up of concrete columns and two-way concrete slabs; above-ground isolated footing on pile foundation and base slab; external cavity walls and flat concrete roof, all with thermal insulation. |
 | H/W 0.56-1.11 GSI 0.24 FSI 1.48 | Apartment block (2010)—Five-level apartment block with underground level made up of concrete frame and slab-on-grade foundation and floors with one-way reinforced concrete slab and ceramic filler block; external hollow brick walls with thermal insulated cavity and flat roof thermal insulated. |
1Building height/width ratio; 2gross space index or coverage: built up area/base land area; 3floor space index or building intensity: gross floor area/base land area.
Table 2.
Thermal transmittance of building elements in selected housing typologies.
| Housing Typologies | Housing Type | Construction Year | Façades Wm−2K−1 | Roofs Wm−2K−1 | Floors Wm−2K−1 | Windows Wm−2K−1 |
|---|---|---|---|---|---|---|
| 1-U | RH | 1900 | 1.57 | 1.17 | 3.73 | 4.59 |
| 2-U | RH | 1910 | 1.31 | 1.17 | 3.73 | 4.59 |
| 3-P | AB | 1920 | 1.93 | 1.17 | 1.78 | 4.40 |
| 4-P | AB | 1950 | 1.11 | 1.03 | 1.17 | 5.00 |
| 5-P | AB | 1960 | 0.83 | 1.45 | 1.29 | 5.00 |
| 6-P | AB | 1975 | 1.85 | 1.17 | 1.42 | 5.70 |
| 7-U | RH | 2000 | 0.47 | 0.33 | 0.71 | 3.23 |
| 8-P | AB | 2000 | 0.47 | 0.43 | 0.83 | 3.20 |
| 9-P | AB | 2010 | 0.46 | 0.25 | 0.66 | 3.20 |
Table 3.
Main characteristics of case studies and built mass estimation.
| Housing Typology | Net Area | Above-Ground Area | Conditioned Area | Built Mass/Net Area (kg/m2) | Built Mass/Above-Ground Area (kg/m2) | Built Mass/Conditioned Area * (kg/m2) |
|---|---|---|---|---|---|---|
| 1-U | 114 | 114 | 114 | 1538 | 1538 | 1538 |
| 2-U | 480 | 480 | 390 | 1990 | 1990 | 2452 |
| 3-P | 966 | 966 | 812 | 1137 | 1137 | 1353 |
| 4-P | 2196 | 1983 | 1631 | 1281 | 1418 | 1724 |
| 5-P | 785 | 785 | 595 | 1242 | 1242 | 1638 |
| 6-P | 865 | 865 | 775 | 1534 | 1534 | 1713 |
| 7-U | 491 | 353 | 390 | 2030 | 2824 | 2556 |
| 8-P | 2896 | 2456 | 1977 | 1395 | 1644 | 2043 |
| 9-P | 1038 | 754 | 448 | 1052 | 1448 | 2437 |
* As explained above, this value is equivalent to the Buildingmass.
Table 4.
Buildingmass versus annual energy demand for heating and cooling.
| Building | Buildingmass (Tm/m2) | Energy Demand (kWh/Tm per Year) | ||||
|---|---|---|---|---|---|---|
| Mean | Minimum | Maximum | Minimum Energy Requirement | |||
| pre-TIO | 1-U | 1.54 | 61 | 59 | 63 | 46 |
| 2-U | 2.45 | 30 | 29 | 32 | 26 | |
| 3-P | 1.35 | 67 | 66 | 69 | 42 | |
| 4-P | 1.72 | 40 | 38 | 43 | 33 | |
| 5-P | 1.64 | 56 | 53 | 60 | 41 | |
| 6-P | 1.71 | 47 | 44 | 50 | 28 | |
| post-TIO | 7-U | 2.56 | 19 | 16 | 21 | 24 |
| 8-P | 2.04 | 21 | 14 | 25 | 22 | |
| 9-P | 2.44 | 23 | 15 | 27 | 29 | |
© 2019 by the authors. Licensee MDPI, Basel, Switzerland. This article is an open access article distributed under the terms and conditions of the Creative Commons Attribution (CC BY) license (http://creativecommons.org/licenses/by/4.0/).
Share and Cite
MDPI and ACS Style
Morganti, M.; Pages-Ramon, A.; Coch, H.; Isalgue, A. Buildingmass and Energy Demand in Conventional Housing Typologies of the Mediterranean City. Sustainability 2019, 11, 3540. https://0-doi-org.brum.beds.ac.uk/10.3390/su11133540
AMA Style
Morganti M, Pages-Ramon A, Coch H, Isalgue A. Buildingmass and Energy Demand in Conventional Housing Typologies of the Mediterranean City. Sustainability. 2019; 11(13):3540. https://0-doi-org.brum.beds.ac.uk/10.3390/su11133540
Chicago/Turabian StyleMorganti, Michele, Anna Pages-Ramon, Helena Coch, and Antonio Isalgue. 2019. "Buildingmass and Energy Demand in Conventional Housing Typologies of the Mediterranean City" Sustainability 11, no. 13: 3540. https://0-doi-org.brum.beds.ac.uk/10.3390/su11133540
Note that from the first issue of 2016, this journal uses article numbers instead of page numbers. See further details here.