The Effect of Corporate Visibility on Corporate Social Responsibility

1
Department of Finance, Ivey Business School, University of Western Ontario, London, ON N6G 0N1, Canada
2
Economics Department, Western University, London, ON N6G 0N1, Canada
3
Finance Department, Wake Forest University, Winston-Salem, NC 27109, USA
*
Author to whom correspondence should be addressed.
Sustainability 2019, 11(13), 3698; https://0-doi-org.brum.beds.ac.uk/10.3390/su11133698
Submission received: 16 April 2019
/
Revised: 7 June 2019
/
Accepted: 30 June 2019
/
Published: 5 July 2019
(This article belongs to the Special Issue New Trends in Finance and Investment Related to Sustainability)
Abstract
:Outside of direct ownership, the general public may feel it is an implicit stakeholder of a firm. As the public becomes more vested in a firm’s actions, the firm may be more likely to engage in Corporate Social Responsibility (CSR) activities. We proxy for the public’s stake in a firm with public visibility. Based on 3400 unique newspaper publications from 1994–2008, we measure visibility for the S&P 500 firms with the frequency of print articles per year concerning the firm. We find that visibility has a signficant, positive relationship with the CSR rating. Evidence also suggests this relationship may be causal and working in one direction, from visibility to CSR. While the existing literature provides other factors that influence CSR, visibility proves to have the most significant impact when tested alongside those other factors. Visibility also has a mediating effect on the relationship between CSR rating and firm size. CSR rating and firm size relate negatively for the lowest visibility firms and positively for the highest. This paper provides strong evidence that visibility is an important factor to consider for studies on corporate social performance.
1. Introduction
There has been a large amount of discussion in the literature regarding the impact of corporate social responsibility (CSR) on firm financial performance. However, there is less discussion on what motivates a firm to participate in social initiatives. Some common hypotheses include firm attributes such as size [1], profitability and financial performance [2,3], regulation and tax incentives [4], executive characteristics and contractual obligations [5,6] and more recently, media exposure or visibility [7,8]. Given that firms care about their reputation and the positive impact CSR has on that reputation, we focus on the visibility motivation. We define visibility for our purposes as the number of print media articles published in a given year that directly report on the Standard and Poor’s (S&P) 500 firms. In particular, we hand collect our data by searching the ProQuest Series Solution news search engine which provides access to over 3400 unique newspaper publications. We use these data to explore whether there is a relationship between visibility and CSR and if visibility affects the strength of other factors, such as firm and executive characteristics, that could possibly affect CSR as shown in the previous literature.
Stakeholder theory has long suggested that a corporation may be accountable to members of society other than their shareholders (the very definition of CSR) [9,10]. A stakeholder is any person or group that has or claims ownership, rights or interests in a corporation and its past, present or future activities [9]. This paper focuses on the secondary stakeholder. Secondary stakeholders are those who are influenced or affected by the corporation but do not engage directly in transactions [9]. The media and the public are key secondary stakeholders who can mobilize general/public opinion in favor of or in opposition to a corporation. Prominent examples include the protests and media coverage of the Dakota Access Pipeline (opposed) and the positive media response to charities such as McDonald’s Ronald McDonald House (in favor). Stakeholder theory has suggested for some time that a firm’s exposure to external stakeholder claims impacts corporate decision making and strategy [10]. Cornell and Shapiro [10] argue that a corporation may be responsible to claimants for both implicit and explicit claims. This can be highly relevant to CSR if we presume the media and public have come to expect a degree of social responsibility from a corporation, thus categorizing social responsibility an implicit claim. The International Institute for Sustainable Development (IISD) [11] found that 42% of North Americans care about a company’s social responsibility, which implies that CSR is an issue of importance to secondary stakeholders. Media coverage and visibility could increase a corporation’s exposure to implicit claims. Failure to comply could lead to negative opinions of the corporation, impact performance and even lead to regulatory intervention (explicit claim). Therefore, as a corporation’s visibility increases, the general public’s stake in a firm increases and strong CSR initiatives will become increasingly necessary.
This study makes three contributions to the literature. First, it contributes to the literature with a new measure of visibility and provides evidence for the significant impact of visibility on CSR. Second, it contributes to the literature on CSR by presenting visibility as a more consistent and more powerful predictor of CSR initiatives than other factors previously studied. Third, this paper is the first to show that visibility has important mediating effects on the relationships between commonly used firm and CEO characteristics and CSR. It presents a new opportunity for researchers to understand the antecedents and consequences of CSR in the context of corporate visibility.
2. Literature Review and Hypotheses
2.1. Visibility and Corporate Social Responsibility
As stated above, corporate social responsibility has become an important topic in the literature and one of concern to both the media and the public. One important motive for firms to engage in social initiatives is to enhance reputation. Therefore, studying the impact that media coverage and public interest has on a corporation’s social responsibility initiatives has become a topic of interest. This paper looks to answer the question: does growing media visibility, proxying for the degree to which the public is a stakeholder in the firm, increase a corporation’s CSR initiatives?
Existing research has touched on the issues of motivations for CSR and how firms respond to visibility. Useem [12] found that the most important single firm characteristic in determining charitable giving (a form of CSR) was firm size. We will attempt to separate the size and visibility factors to give a more focused interpretation of this trend. Campbell and Slack [7] found in a size-controlled study of visibility, highly visible firms gave more charitable donations than those with low visibility. It is important to note that this paper measured visibility based on a survey of 500 British college students and we attempt to proxy for visibility with perhaps a broader and more reliable measure. In addition, charitable donations are a subset of CSR actions and therefore cannot be assumed to represent all CSR actions. Erfle and McMillian [13] found that firm and product visibility affected oil companies’ reactions to regulatory and price threats for visible products but not invisible ones. This study will add to the current literature by testing the relationship between CSR and visibility (controlling for size) and the direction of causality in the CSR-visibility relationship. More recently studied motivations for CSR include coercive pressure [14] and mimetic force [15].
The empirical study of visibility has raised many questions regarding the proper measurement of the visibility metric. Campbell and Slack [7] proposed one method by using name recognition. They performed their study by providing a list of firms from the FTSE 500 index to 500 surveyors and asked them to tick a box if they had “heard of” the firm. From these results they created a “heard of” metric that was sorted into deciles, the top decile being highly visible and the lowest decile being the least. Erfle and McMillian [13] proposed an alternative measure by using an index called the Television News Index and Abstracts (TNIA) collected by Vanderbilt University. This index summarizes the nightly news programs for three major news outlets. They were able to analyze this data and determine the media visibility of their study topic by counting the number of related news segments presented in the news cycle. This study will investigate a different measurement of visibility: the number of newspaper publications in a given year. More details are provided in the data description section of this paper.
2.2. Firm Performance and Corporate Social Responsibility
The literature up to this point has been contentious in developing the relationship between a firm’s past and current financial performance and their CSR initiatives. For instance, there are two schools of thought for how CSR should affect profitability. One hypothesis is that profitability should decline with CSR due to the cost of such initiatives [16]. Another argues that some degree of social responsibility will increase profits due to the presence of stakeholders [10] and regulatory bodies [17] which ensure that not engaging in CSR increases a firm’s cost through explicit claims. On the other hand, Aupperle et al. [2] found no relationship between CSR and firm profitability. Looking at other performance metrics, McGuire et al. [3] found significant correlations between social responsibility and return on assets (ROA), Debt/Assets, Beta and standard deviation of total returns. More recent studies focus on different aspects of CSR and their impacts on firm outcomes, including labor reputation [18], customer awareness [19], labor productivity [20] and improved transparency [21]. In this study, we attempt to use numerous firm and executive characteristics to determine if consistent results can be obtained. This will add to the study by providing a point of reference for the strength of the relationship between visibility and CSR. We also look to determine if visibility is not only a single causal factor affecting CSR but if it can influence the firm’s CSR involvement through other channels by using interaction terms.
2.3. CEO Characteristics and Corporate Social Responsibility
There is also a branch of literature that links a firm’s CSR decisions to the characteristics of its CEO. For example, Manner [5] found that the type of university education, gender and breadth of experience of a CEO could explain differences in CSR, even when firm and industry effects were controlled for. McGuire et al. [22] found that there was no link between CEO incentives and CSR. Ikram et al. [6] found that there was a distinct correlation between CSR clauses in executive contracts and a firm’s CSR involvement. This paper will look to determine if a link between CEO characteristics and CSR can be identified as it has with these previous studies and provide a point of reference for the strength of the relationship between visibility and CSR. In addition, we test whether these relationships are amplified by a visibility instrumental variable.
2.4. Hypotheses
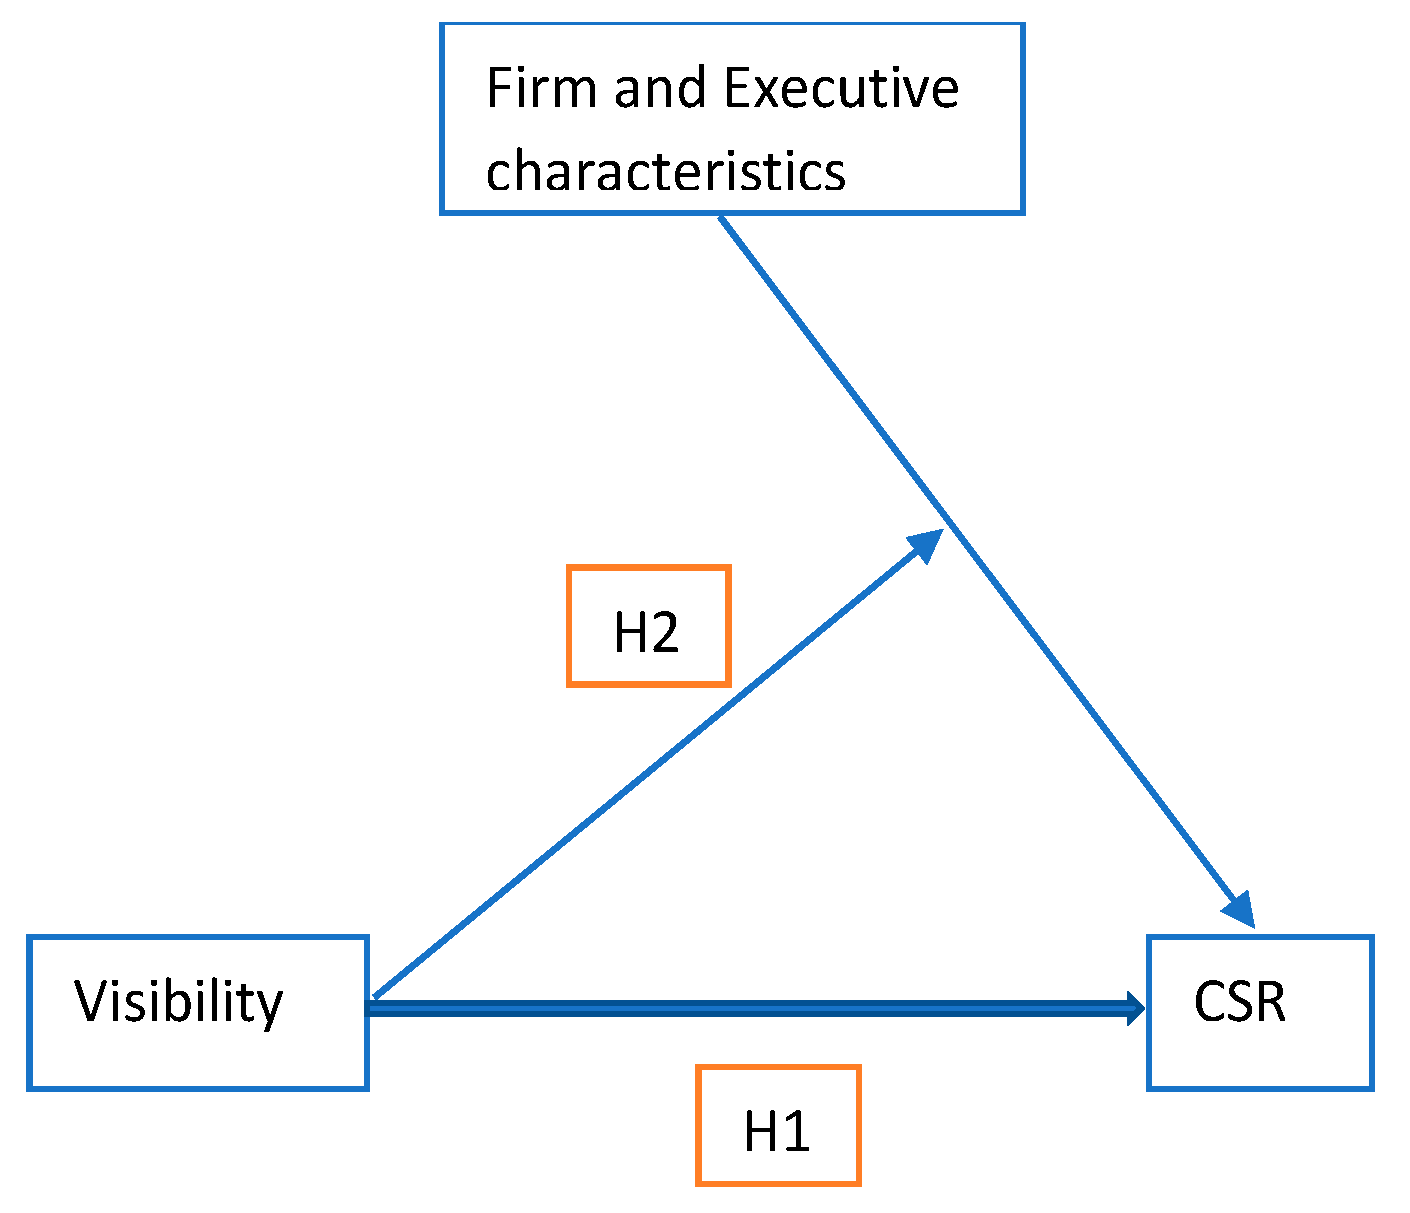
This study will examine the relationship between visibility and corporate social responsibility. There are two hypotheses: (1) visibility increases the firm’s exposure to implicit claims made by the media and the general public and therefore will lead to higher CSR; visibility is a more consistent and more powerful predictor of CSR initiatives than other factors previously studied; and (2) visibility can work to amplify the impact of firm and CEO characteristics on CSR. These hypotheses are demonstrated in Figure 1.
This study hopes to add to the literature by reaffirming the correlation between visibility and CSR and providing evidence on the direction of this relationship. This study also hopes to solidify visibility as one of the main contributing factors to CSR and provide evidence of its indirect effects on firm and CEO factors.
3. Data Description
3.1. Data Construction
Data on CSR ratings are collected from the MSCI database on Wharton Research Data Service (WRDS) website. The ratings are determined quantitatively and qualitatively by MSCI. The MSCI database was originally created by KLD Research & Analytics. This same database has been used for empirical research on CSR by prominent studies such as [22] and [23]. MSCI reports ratings of strengths and concerns for each firm across five categories: community activities, diversity, employee relations, environmental policies and product development. Following much of the literature on CSR we begin by defining an aggregate CSR score using the data on a firm’s strengths (str) and concerns (con) in the categories of community (com), diversity (div), employee (emp), environment (env), human (hum) and product (pro), we sum the total number of CSR strengths and subtract the total number of CSR concerns across these five categories. The firm CSR rating is determined using the equation below:
Data points with missing CSR rating variables are removed from the data set.
Data on firm-specific factors (Net Income, Gross Profit, Cash, Total Assets, Total Debt, etc.) in this study are collected from the CRSP database on the WRDS website. The data set is pared down to include only firms in the S&P 500. Test variables are calculated in the following manner:
Gross Profit is used as a profitability measurement. Cash is used as a secondary measure of the firm’s financial position and access to liquidity. Firms that are missing Total Assets are eliminated as size is an important variable in this study. All monetary values are reported in millions of US Dollars ($).
CEO data is collected from the Capital IQ Execucomp database on WRDS. The data are filtered to contain only CEO data as CEOs are considered the primary decision-makers in a corporation. Variables collected include gender, the date the executive became CEO and their bonuses. The CEO’s tenure is computed and a dummy variable is assigned for gender.
Data on CSR contracts is provided by Ivey Business School at Western University. This dataset was created by Li and associates and was used in the paper CSR Executive Compensation Contracts [6]. The dataset provides information on the CEOs of firms within the S&P 500 and indicates if the publicly available CEO contracts contain clauses pertaining to CSR obligations or goals using a dummy variable.
CSR rating, firm, CEO and contract datasets are merged to ensure that the dataset has full CSR rating, size and CEO gender data. This is done to create a more consistent data set. There is a total of 611 observations in this dataset and it spans the period between 1995–2008.
Additionally, we collect visibility metrics. As discussed previously, there is ample debate on how to properly measure visibility. Our proxy for visibility is the total number of newspaper articles covering a firm in a single year. Due to data limitations, we cannot eliminate redundant articles, nor can we know how many individuals read each article. In addition, the nature of each article is not known but we believe the volume of publishing activity suggests the public’s interest in the firm. Another limitation of studying print media is that we do not consider social media, which in the last decade has become widely popular and accessible to the public. To the best of our knowledge, this is the first paper to focus on the effect of print media on corporate social performance.
To create a comprehensive list of the number of newspaper articles documented for a given firm in a given year, we use the Western University Summon, sponsored by SeriesSolutions—a ProQuest Company—which provides access to over 3400 unique newspaper publications. The advantage of using this database is the ability to filter search results by company, year and publication type—a necessary requirement for this study. When performing the searches, the full company name as reported in the CRSP dataset is entered into the advanced search and the time bounds are set to 1 January to 31 December of the required year. The search results yielded are then recorded, providing an empirical measure of newspaper coverage or visibility for that company in that year. Endogeneity between visibility and CSR is a concern for this study. For example, a large CSR initiative undertaken by a firm may warrant high media coverage. To address this, we compute both contemporaneous and one-year lagged CSR for each firm-year. Contemporaneous and lagged relationships are compared throughout the results section.
3.2. Basic Statistics
The basic statistics for the test variables are presented in Table 1 (contemporaneous CSR). Visibility has a mean of 4832 (number of articles published per year per firm) and a standard deviation of 9112. There is much variation in the data, which is understandable given the diversity of the firms being studied which span from dentistry firms to Apple Inc. It is also important to note that there is a large difference in the magnitude of the visibility metric and the CSR rating. To avoid small coefficients in the regression analysis, a standardized variable is to be used for visibility (Z-score).
The correlations between all test variables are reported below in Table 2 (contemporaneous CSR). Visibility has a high positive correlation with the CSR rating metric. This is consistent with the hypothesis that more visibility should create incentives for a firm to engage in social initiatives and is also in line with results in the current literature [7]. We are cautious about making conclusions based on correlations because some firm fundamentals could drive the correlation results. For example, there is also a significant (p-value < 0.0001) positive correlation between visibility and firm size of 0.30. This is expected as larger firms should have more visibility and access to media. This relationship will drive the positive correlation between visibility and CSR, considering larger firms may also have better social performance. Instead, we rely on multivariate regressions in the next section to draw our conclusions.
Visibility also has strong (p-value < 0.0001) correlations with both Cash (0.26) and Profit (0.28), which are measures of a firm’s financial viability [24]. This is reasonable given that financially secure firms should be more willing to spend on “non-essential” items such as CSR.
There is no significant correlation reported between CSR and firm size in our sample. This is inconsistent with the literature up to this point which has supported strong positive correlations between size and CSR [12]. CSR and ROA are positively correlated at the 1% level of confidence. This finding is consistent with McGuire et al. [3] but is inconsistent with the negative significant relationship observed between visibility and ROA previously mentioned. There is a significantly negative correlation between CSR and the debt ratio at the 5% level of confidence. This implies that firms which participate in more CSR initiatives are more likely to be less leveraged. This is expected as firms which are highly leveraged should find it more difficult to participate in “non-essential” spending (CSR) and is consistent with the findings of McGuire et al. [3]. This is further supported by the positive relationship between cash and CSR. Firms with higher debt and lower cash are less likely to excel in social performance. There is a non-significant negative relationship observed between profit and CSR. This relationship could be presumed to be consistent with the school of thought that believes CSR’s only impact on a firm’s profitability is an increase in costs [17]. However, given that this relationship is non-significant, conclusions cannot be drawn.
Strong correlations are observed between visibility and CEO bonuses and CSR clauses in CEO contracts. These relationships imply that more visible firms are more likely to provide bonuses and contractually enforce socially responsible behavior from CEOs. Unexpected results are seen in the correlations between CSR and CEO characteristics. We would expect to see a positive relationship between CSR contracts and CSR [6]. However, we observe a negative relationship that is significant at the 1% level. This implies that CSR contract clauses are hurtful to CSR initiatives.
The univariate analysis for CSR and lagged CSR shown in Table 3A,B respectively indicate that the only predictor of CSR that is significant at all levels of confidence is visibility. The coefficients on visibility are 0.56344 and 0.54651 for present and lagged CSR, respectively. This roughly corresponds to a positive unit of CSR for every 18,000 articles published annually. Visibility also presents with very significant F statistics indicating that it may be able to explain a large portion of the variation in CSR. This is confirmed by the high relative R-Squared value (0.0434). However, even if the R-Squared is relatively high, it should be a point of concern that all the R-squared values in the study are low (between 0.0002 and 0.0434 for present CSR and 0.0005 and 0.0403 for lagged CSR).
The univariate analysis of Cash and CSR has significant coefficients and F statistics at the 1% level for both the contemporaneous time and lagged datasets (Table 3A,B). In contemporaneous time, Cash has a coefficient of 1.1000 × 10⁻⁴ which corresponds to approximately 1 unit of CSR for every 10,000 units of cash ($ millions) held by a firm in the fiscal year. A positive relationship is expected as it is consistent with the theory that positive cash means a more financially secure firm. If a firm is more financially secure, it should be more likely to take on “non-essential spending.” However, the average firm only has 1172 units of cash, thus, most of the sample has the inability to spend the required 10,000 units needed to increase the CSR rating by one point. Consequently, cash cannot be considered economically significant, even if it is statistically significant. The coefficient for cash with lagged CSR is not significantly different from the contemporaneous (1.2151 × 10⁻⁴), while we see an increase in the F statistic from 8.8 to 10.3.
The ROA results for the univariate analysis of the lagged CSR data set (Table 3B) are found to be positive and significant at the 1% level with a coefficient of 3.5272 (0.0353 CSR units for every 1% of ROA). This finding is consistent with those of McGuire et al. [3], although the magnitude of coefficients cannot be compared as the two studies use different CSR metrics. ROA is the measure of income a firm earns in relation to its overall resources. In this way, it can be considered a measure of efficiency. Therefore, this result indicates that more efficient firms, those that generate more income per unit of asset, are more socially responsible. This is expected because more efficient firms tend to be more profitable which allows for more spending on CSR initiatives. The ROA coefficient in the contemporaneous time dataset (Table 3B) is of the same sign and is only slightly larger in magnitude. However, it is insignificant at the 5% level. The same interpretation can, therefore, be applied. Given that the mean ROA in this sample is ~7%, this result can also be considered economically significant.
The CSR contract coefficient is found to be significant and negative in both the contemporaneous and lagged datasets (Table 3A,B respectively). Coefficients are given as −0.80260 (1% level of confidence) and −0.59764 (5% level of confidence). This implies that some of the variances in CSR can be explained by the presence of CSR clauses in CEO contracts. However, the R-squares for both regressions are small at 0.0154 for contemporaneous CSR and 0.0086 for lagged CSR. Thus, the amount of variance explained is small. Theoretically, the negative relationship between CSR contracts and CSR involvement does not make sense as it implies that CSR contracts in the current or previous period diminish a firm’s CSR involvement in the current period. This finding is inconsistent with results found by Ikram et al. [6] but is consistent with the correlation results.
All other insignificant variables have coefficients that are consistent with their correlations with CSR. Descriptions of the theory and implications of these results can be found in the Basic Statistics section of this paper.
It is evident that there is minimal difference between the contemporaneous and the lagged data sets. This implies minimal endogeneity issues associated with the simultaneous occurrence of CSR and other factor variables. It also indicates that there are minimal time series effects on CSR rating. CSR ratings are consistent over time for a given firm and therefore a lag of one year is ineffectual. Future studies should investigate if further time horizons impact the results.
The results presented thus far are consistent with hypothesis (1) visibility increases the firm’s exposure to implicit claims made by the media and the public and therefore will lead to higher CSR. This is shown by the significant positive visibility coefficient in the univariate regression with CSR. These results are also consistent with hypothesis (2) visibility is, therefore, a more consistent and more powerful predictor of CSR initiatives than other factors previously studied. This is shown by the high significance and size of the visibility coefficient and relatively high R-squared value when compared with the other benchmark factors. Visibility has the highest R-squared and therefore explains the greatest amount of the variance in CSR when compared to the other regressors in a univariate analysis.
4. Multivariate Regression Results and Discussion
We perform generalized linear model (GLM) regressions on the firm and CEO models with the addition of visibility. The models we use in the multivariate analysis are given below.
Firm Factors Model:
CEO Factors Model:
Contributions to Visibility:
Table 4A,B report the results from the firm models with contemporaneous CSR (Equation (1)) and lagged CSR (Equation (2)), respectively, as the dependent variables. The visibility metric is found to be significant and positive at all levels of significance (p-value < 0.0001) in the GLM multivariate regressions for CSR rating in both contemporaneous and lagged time. The coefficients for visibility in the contemporaneous time and lagged time are 1.6728 (t-statistic 4.13) and 1.2040 (t-statistic 4.04) respectively. The positive relationship between CSR and visibility is consistent with hypothesis (1) and the findings in the literature [7]. As visibility is standardized here, a one unit increase in visibility means an increase of approximately 9000 articles (one standard deviation) published annually and either a 1.6728 or 1.2040 increase in a firm’s CSR rating. This indicates that the coefficients on visibility are not only statistically significant but also economically significant as many firms meet or exceed this amount of tracked publications. It is also interesting to note that the effect is diminished when CSR is lagged to control for endogeneity, as seen by the decline in the coefficient and the t-statistic. This is consistent with the conjecture mentioned earlier that an increase in CSR could warrant media coverage and therefore increase visibility in the same year (variables are determined simultaneously in the model). By utilizing a lagged variable, we can control for this effect. However, we do not yet know if this is a causal relationship with visibility as the initiator. This is explored in Table 5A,B.
Table 5A,B show the results from a linear regression as given by the models in Equations (5) and (6), where visibility is the dependent variable and the independent variables are CSR rating and size. These variables were chosen to determine the relationship between CSR and visibility (i.e., the direction of the interaction) and if size is a significant contributor to visibility as hypothesized by Useem [12]. Table 5A reports significant relationships between visibility and both CSR rating (1% level of confidence) and size (5% level of confidence). The coefficients are 0.01802 and 0.04967, respectively. Table 5B reports a significantly positive relationship between visibility and size at the 1% level and an insignificant and positive relationship between visibility and CSR rating. The coefficients are 0.0671 (t-statistic 3.04) and 0.0095 (t-statistic 1.35) respectively. First, these results indicate that the direction of the relationship between CSR rating and visibility may be in favor of hypothesis (1) visibility effects CSR. The model in Equation (1) and the coefficient reported in Table 4A indicate that a unit of CSR is added for approximately every 5380 articles published. The model in Equation (3) and presented in Table 5A indicates that approximately 162 articles are added for every unit of CSR. The combination of these two tests suggest that CSR’s effect on visibility is very small given the mean visibility of 4832 articles. This is further seen by the smaller and less significant coefficient that is presented in Table 5B. Secondly, we can see that from Table 5A,B that visibility and size are positively related. The model given by Equations (5) and reported in Table 5A gives a coefficient on firm size of 0.0497, significant at the 5% level of confidence (t-statistic of 2.42). The model given by Equation (6) and reported in Table 5B gives a coefficient on the firm size of 0.0671, significant at the 1% level of confidence (t-statistic of 3.04). These results indicate that size is indeed linked to visibility and is therefore consistent with the findings in Reference [12]. This could indicate that size is the factor that truly influences CSR [1] by working through visibility as larger firms are inherently more visible. However, the results presented in Table 4A,B, firm factor models for consistent and lagged time, show non-significant negative and positive relationships between size and CSR and therefore provide some evidence against this theory. If size and visibility were closely related, we would expect size to have positive, significant coefficients in the firm factor models, which we do not. Thus, the relationship between CSR and firm size is inconclusive. Therefore, we can say with some degree of confidence that the results presented here are consistent with hypothesis (1) visibility affects the CSR involvement of a firm through a causal relationship, independent of the size factor hypothesized by Reference [1].
As discussed, visibility has a strong relationship with CSR that may even be causal but does it do a better job than other predictors explored in the current literature? We can see that in the firm model for both consistent and lagged time (Table 4A,B) the only other significant regressors are Cash and ROA. Cash has coefficients for contemporaneous and lagged time of 3.1595 × 10⁻⁴ (t-statistic 6.63) and 2.6779 × 10⁻⁴ (t-statistic 5.98) respectively, both of which are significant at all levels of confidence. This implies, as was previously discussed in the correlation and univariate analysis sections, that Cash is positively related with CSR. This relationship most likely exists because Cash can be an indicator of financial stability which allows for spending on “non-essential” items like CSR. However, as previously discussed, the economic significance of this regressor and coefficient is questionable given the number of cash units ($ millions) needed to effect CSR change is quite large. ROA also shows significance in both the contemporaneous and lagged time regressions. The coefficients of 2.2463 (t-statistic of 2.25) and 2.2793 (t-statistic of 2.44) respectively are significant at the 5% level. These results indicate that for every 1% increase in ROA there is approximately a 0.0226 increase in CSR in either the current period or the next. As discussed previously in the univariate analysis section, given that the mean ROA for this sample is ~7%, this result is mildly economically significant. A 7% increase means approximately 0.16 additional units of CSR. All other factors in the firm models for contemporaneous and lagged time are insignificant and have directions that correspond with their correlations in Table 2. The CEO models shown in Equations (3) and (4) and reported in Table 4C,D show significant results only for visibility in contemporaneous time and CSR contract in lagged time. The coefficients are given as 0.8818 significant at all levels (t-statistic of 2.75) and 0.5985 significant at the 5% level (t-statistic of 2.14) respectively. A positive relationship between CSR contracts and lagged CSR makes sense and is consistent with the findings in the literature [6]: as executives become contractually obligated to meet CSR requirements, the CSR rating of the firm should increase in the next period (year). This finding contradicts the correlation result reported in Table 2.
The findings discussed here support hypothesis (2) visibility is a more consistent and more powerful regressor than other firm or CEO factors studied in the literature. ROA shows both economic and statistical significance but as discussed, it still lacks the economic power that visibility offers. Using lagged CSR, the CSR rating is 0.5985 greater with the presence of a CSR contract. However, as this result is inconsistent with the correlation study and the univariate analysis, further research is required before conclusions can be drawn. Visibility is consistent and significant in all studies except for the CEO factor model in lagged time. Therefore, of all variables studied, visibility offers the most consistency and strength.
A visibility interaction term (High_vis) is used to test hypothesis (3), visibility may impact the strength of firm or CEO variables. The interaction term was created by dividing the data into quartiles based on the visibility metric. High_vis is a dummy variable equal to one for the highest visibility quartile, zero for the lowest and null for the remainder. CSR rating differs significantly between the groups based on the difference in the means test. The mean CSR rating is −0.5247 for the lowest visibility quartile and 1.3610 for the highest visibility quartile; the two groups are significantly different at all confidence intervals (p-value 2.1270e-11). We repeat the firm factor and CEO factor tests as specified in Equations (1) and (2) with the addition of visibility interaction terms for each variable. The models for CEO effects were found to be insignificant so results are not reported. Firm models are reported in Table 6A,B.
Size is negative and significant in both Table 6A,B. This is consistent with univariate and multivariate regressions conducted previously in this study. It is interesting to note that the size and visibility interaction term has a coefficient that is positive and significant. Coefficients for the size and visibility interaction terms are 2.2960 and 2.2687, both significant at the 1% level, for contemporaneous and lagged time, respectively. In addition, these coefficients are greater than the associated size coefficients. This is interpreted as size having a negative effect for low visibility firms but being a positive factor for high visibility firms. In other words, when the firm is not visible to the public through print media, the size negatively impacts CSR (larger invisible firms are less socially responsible) but for high visibility firms, size positively affects CSR (larger, visible firms are more socially responsible). This is indicated by the larger coefficient on the interaction term then on the size factor alone. Thus, the weight given to size when a firm is visible will be the sum of the two terms, which will be positive. Therefore, when the firm is visible, the relationship between CSR and size is consistent with the findings of [12]. It is evident that visibility changes the way size affects CSR, which is consistent with hypothesis (3).
The remainder of the results from Table 6A,B are statistically insignificant and therefore will not be discussed.
5. Conclusions
As society continues to progress and evolve, we are growing more enlightened to the important impact organizations have on people and our environment. Under the assumption that firms must continue to progress with social responsibility, it is important to understand what actors and mechanisms can advance this agenda. Our work demonstrates that one such group is the general public and that firms will respond to the public when people have a high awareness of a firm’s activities. Thus, the implication is that greater media visibility will continue to increase Corporate Social Responsibility, as long as firms believe it is important to the public.
We demonstrate the existence of this visibility—CSR relationship through the support of three hypotheses. Hypothesis (1) proposes that visibility increases the firm’s exposure to implicit claims made by the media and the public and therefore will lead to higher CSR. In support of hypothesis (1), this study has shown highly significant positive relationships between visibility and CSR demonstrated in correlations, univariate and multivariate analyses. These results are consistent throughout the study and with findings in the literature [7]. This study is also able to establish evidence of causality and direction consistent with the hypothesis (1). We demonstrate the relative economic significance of visibility produced due to CSR is quite small and insignificant compared to CSR that is caused by visibility (Table 4B and Table 5B). These results hold when endogeneity is controlled for using lagged CSR rating. Multiple linear regression models demonstrate that among all factors considered, visibility is the strongest and most consistent predictor of a firm’s CSR rating (Table 4A,B). These results are consistent with hypothesis (2). Next, the effects of the high/low visibility interaction term significantly impact the effect of size on CSR. Size negatively impacts CSR when the firm is in the lowest quantile for visibility but size positively affects CSR when the firm is in the highest quantile for visibility. These findings provide evidence that visibility influences the relationship between other factors and CSR which supports hypothesis (3). Therefore, this study has shown that visibility is a significant factor that must be considered when discussing a firm’s level of corporate social responsibility involvement. We contribute to the literature with a new measure of visibility, provide evidence for the direction of causation between visibility and CSR and explore the impact of visibility on other factors. This paper presents a new opportunity for researchers to understand the antecedents and consequences of CSR in the context of corporate visibility.
6. Limitations of the Study and Next Steps
There are a few limitations of this study that are associated with the visibility metric. For one, we do not consider the effects of corporate governance. Our future research is to study the mediating effects of corporate governance measures, such as industry competition [25], mutual monitoring among managers [26,27], inside debt [28], job market competition [29]. In addition, researchers should consider more managerial characteristics, especially the proxies for managerial power [30] and the unobservable managerial ability and risk aversion [30], all of which can capture managerial incentives to influence corporate visibility and CSR initiatives. Second, it is unclear as to whether the Summons Database is subject to any selection bias. Should this be the case, the number of articles would be biased downward because it only includes articles that are recorded on the Summons Database, not all articles published during our sample period. However, given that all data points are pulled from the same source, the bias is likely to affect all firms similarly given we know of no specific selection criteria. This still needs more research to determine the possible effect. Second, when searching for published articles, “formal” CRSP company names are used, not the common informal company names (for example: Amazon.com Inc not just Amazon), since we attempt to avoid counting wrong firms and some trivial mentions of the firms. This again may have biased the visibility metrics downward. In this case, we might assume that this would have a more significant effect on companies who are more visible as they are more likely to have common or informal names in the media. Future efforts may attempt to mitigate this issue in the dataset. Last, the size of the dataset is quite small and the data are only available through 2008. Further work could be done to expand it to improve statistical significance.
For future studies, it would be interesting to investigate a combined visibility metric that looks at a variety of visibility factors. Factors to be considered include social media presence, google search hits (google trends) and product and name recognition. By looking at these factors as well as print media presence, a more complete measurement of visibility in the modern age could be achieved to allow for more meaningful studies into the impact of visibility on CSR. More importantly, future researchers should attempt to open the black box to explore the channels, such as industry tournament and competition [29] and CSR-linked compensation [6,31], through which visibility affects corporate social performance.
Author Contributions
F.L. provided oversight of this paper and worked directly with T.M. who performed the statistical analysis. All three authors contributed to the writing of this paper.
Funding
This research received no external funding.
Acknowledgments
We thank Yaman Aswad for research assistance. All errors remain our own responsibilities.
Conflicts of Interest
The authors declare no conflict of interest.
References
- Udayasankar, K. Corporate SOcial responsibility and firm size. J. Bus. Ethics 2008, 83, 167–175. [Google Scholar] [CrossRef]
- Aupperle, K.E.; Carroll, A.B.; Hatfield, J.D. An empirical examination of the relationship between corporate social responsibility and profitability. Acad. Manag. J. 1985, 28, 446–463. [Google Scholar]
- McGuire, J.B.; Sundgren, A.; Schneeweis, T. Corporate social responsiblity and firm financial performance. Acad. Manag. J. 1988, 31, 854–872. [Google Scholar]
- Campbell, J.L. Why would corporations behave in socially responsible ways? An institutional theory of corporate social responsibility. Acad. Manag. Rev. 2007, 32, 946–967. [Google Scholar] [CrossRef]
- Manner, M.H. The impact of CEO characteristics on corporate social performance. J. Bus. Ethics 2010, 93, 53–72. [Google Scholar] [CrossRef]
- Ikram, A.; Li, Z.; Minor, D. CSR-Contingent Executive Compensation Contracts. Available online: https://ssrn.com/abstract=3019985 (accessed on 20 April 2018).
- Campbell, D.; Slack, R. Public visibility as a determinant of corporate charitable donations. Bus. Ethics A Eur. Rev. 2006, 15, 19–29. [Google Scholar] [CrossRef]
- Pérez, A.; García De Los Salmones, M.D.M.; López-Gutiérrez, C. Corporate social responsibility in the media: A content analysis of business news in Spain. J. Media Ethics 2018, 33, 66–79. [Google Scholar] [CrossRef]
- Clarkson, M.B. A stakeholder framework for analyzing and evaluating corporate social performance. Acad. Manag. Rev. 1995, 20, 92–117. [Google Scholar] [CrossRef]
- Cornell, B.; Shapiro, A. Corporate stakeholders and corporate finance. Financ. Manag. 1987, 16, 5–14. [Google Scholar] [CrossRef]
- International Institute for Sustainable Development (IISD). IISD’s Business and Sustainable Developement: A Global Guide. 2013. Available online: https://www.iisd.org/business/issues/sr_csrm.aspx (accessed on 4 July 2019).
- Useem, M. Market and institutional factors in corporate contribution. Calif. Manag. Rev. 1988, 30, 77–88. [Google Scholar] [CrossRef]
- Erfle, S.; McMillan, H. Media, political pressure, and the firm: The case of petroleum pricing in the late 1970s. Q. J. Econ. 1990, 105, 115–134. [Google Scholar] [CrossRef]
- Boiral, O.; Gendron, Y. Sustainable development and certification practices: Lessons learned and prospects. Bus. Strategy Environ. 2011, 20, 331–347. [Google Scholar] [CrossRef]
- Peters, G.F.; Romi, A.M. The association between sustainability governance characteristics and the assurance of corporate sustainability reports. Audit. A J. Prac. Theory 2014, 34, 163–198. [Google Scholar] [CrossRef]
- Abbott, W.F.; Monsen, J. On the measurement of corporate social responsibility: Self-Reported disclosures as a method of measuring corporate social involvement. Acad. Manag. J. 1979, 22, 501–515. [Google Scholar]
- Bragdon, J.H.; Marlin, J.A. Is pollution profitable? Environmental virtue and reward: Must stiffer pollution controls hurt profits? Risk Manag. 1972, 19, 9–18. [Google Scholar]
- Odriozola, M.D.; Martin, A.; Luna, L. Labour reputation and financial performance: Is there a causal relationship? Empl. Relat. 2018, 40, 43–57. [Google Scholar] [CrossRef]
- Servaes, H.; Tamayo, A. The impact of corporate social responsibility on firm value: The role of customer awareness. Manag. Sci. 2013, 59, 1045–1061. [Google Scholar] [CrossRef]
- Gong, N.; Grundy, B. Can socially responsible firms survive competition? An analysis of corporate employee matching grant schemes. Rev. Financ. 2018, 23, 199–243. [Google Scholar] [CrossRef]
- Dhaliwal, D.; Li, O.; Zhang, A.; Yang, Y. Voluntary nonfinancial disclosure and the cost of equity capital: The initiations of corporate social responsibility reporting. Account. Rev. 2011, 86, 59–100. [Google Scholar] [CrossRef]
- McGuire, J.; Dow, S.; Argheyd, K. CEO incentives and corporate social performance. J. Bus. Ethics 2003, 45, 341–359. [Google Scholar] [CrossRef]
- Li, Z.F.; Li, T.; Minor, D. A test of agency theory: CEO power, firm value, and corporate social responsibility. Int. J. Manag. Financ. 2016, 12, 611–628. [Google Scholar] [CrossRef]
- Hategan, C.D.; Sirghi, N.; Curea-Pitorac, R.I.; Hategan, V.P. Doing well or doing good: The relationship between corporate social responsibility and profit in romanian companies. Sustainability 2018, 10, 1041. [Google Scholar] [CrossRef]
- Giroud, X.; Mueller, H. Corporate governance, product market competition, and equity prices. J. Financ. 2011, 66, 563–600. [Google Scholar] [CrossRef]
- Li, F. Mutual monitoring and corporate governance. J. Bank. Financ. 2014, 45, 255–269. [Google Scholar]
- Li, F. Mutual Monitoring and Agency Problem. 2018. Available online: https://www.researchgate.net/publication/272305464_Mutual_Monitoring_and_Agency_Problems (accessed on 4 July 2019).
- Li, F.; Lin, S.; Sun, S.; Tucker, A. Risk-Adjusted inside debt. Glob. Financ. J. 2018, 35, 12–42. [Google Scholar] [CrossRef]
- Coles, J.; Li, Z.F.; Wang, A. Industry tournament incentives. Rev. Financ. Stud. 2018, 31, 1418–1459. [Google Scholar] [CrossRef]
- Coles, J.; Li, Z. Managerial attributes, incentives, and performance. Available online: https://papers.ssrn.com/sol3/papers.cfm?abstract_id=1680484 (accessed on 4 July 2019).
- Hong, B.; Li, Z.F.; Minor, D. Corporate governance and executive compensation for corporate social responsibility. J. Bus. Ethics 2016, 136, 199–213. [Google Scholar] [CrossRef]
Figure 1.
Hypothesized Relationships.


Table 1.
Summary Statistics. This table presents the summary statistics of the data used in the study.
Table 1.
Summary Statistics. This table presents the summary statistics of the data used in the study.
| # Observations | Mean | Standard Deviation | Minimum | Maximum | |
|---|---|---|---|---|---|
| CSR rating | 611 | 0.30115 | 2.70415 | −8 | 8 |
| Visibility | 611 | 4832 | 9112 | 0 | 58,839 |
| Size | 611 | 8.95288 | 1.42058 | 4.69428 | 13.26255 |
| Cash | 598 | 1171 | 2986 | 0 | 35,283 |
| Gross Profit | 596 | 3454 | 5410 | −3906 | 42,386 |
| Firm Debt Ratio | 457 | 0.19791 | 0.16917 | 0 | 1.32584 |
| ROA | 558 | 0.07011 | 0.08569 | −0.8526 | 0.34437 |
| Tenure | 608 | 6.21875 | 7.30732 | −12 | 38 |
| BONUS | 611 | 1165 | 2350 | 0 | 43,512 |
| CSR Contract | 546 | 0.24359 | 0.42964 | 0 | 1 |
Table 2.
Correlation Table for all Test Factors. This table presents the correlations between all variables. The superscripts *, ** and *** indicate significance at the 5%, 1% and 0.01% levels, respectively. Corporate Social Responsibility (CSR) in contemporaneous time is used, correlations where also studied for lagged time CSR, however results did not differ significantly, so they are not presented.
| CSR Rating | Visibility | Firm Size | Cash | Gross Profit | Debt Ratio | ROA | CEO Tenure | Bonus | |
|---|---|---|---|---|---|---|---|---|---|
| Firm Specific Factors: | |||||||||
| Visibility | 0.21 *** | ||||||||
| Firm Size | −0.04 | 0.30 *** | |||||||
| Cash | 0.12 ** | 0.26 *** | 0.49 ** | ||||||
| Gross Profit | 0.02 | 0.28 ** | 0.62 *** | 0.76 *** | |||||
| Debt Ratio | −0.09 * | −0.06 | 0.19 *** | 0.17 ** | 0.21 *** | ||||
| ROA | 0.13 ** | −0.09 * | −0.35 *** | −0.15 ** | −0.10 ** | −0.35 *** | |||
| CEO Specific Factors: | |||||||||
| Tenure | 0.04 | 0.07 | −0.05 | −0.06 | 0.01 | −0.08 | 0.15 ** | ||
| Bonus | 0.01 | 0.31 *** | 0.21 *** | 0.10 ** | 0.20 *** | −0.004 | −0.02 | 0.06 | |
| CSR Contract | −0.12 ** | 0.14 ** | 0.28 *** | 0.30 *** | 0.33 *** | 0.06 | −0.13 ** | 0.004 | 0.04 |
Table 3.
Univariate Regression Results. The following tables present the univariate regression results for all independent variables (factors) with contemporaneous CSR rating (A) and lagged CSR rating (B) as the dependent variable. Univariate regression results are given from 1995 through 2008. The z-score for visibility is used here. Standard errors are given in brackets with coefficients and intercepts. Pr > F is given in brackets with F stat. The superscripts *, ** and *** indicate significance at the 5%, 1% and 0.01% levels, respectively.
| Panel A: Univariate Regression Results with Contemporaneous CSR rating as the Dependent Variable | |||||
| Independent Variable: | Coefficient | Intercept | F Statistic | R Squared | Adjusted R Squared |
| Firm Specific Factors: | |||||
| Visibility | 0.56344 *** | 0.30115 ** | 27.64 | 0.0434 | 0.0418 |
| (0.10717) | (0.10708) | (<0.0001) | |||
| Firm Size | −0.0719 | 0.94487 | 0.87 | 0.0014 | 0.0002 |
| (−0.07708) | (0.69872) | (0.3513) | |||
| Cash | 1.1000 × 10⁻⁴ ** | 0.18741 | 8.88 | 0.0147 | 0.013 |
| (<0.0001) | (0.11817) | (0.003) | |||
| Gross Profit (Loss) | 9.17 × 10⁻⁶ | 0.23845 | 0.2 | 0.0003 | 0.0013 |
| (<0.0001) | (0.13194) | (0.6558) | |||
| Debt Ratio | −1.4651 | 0.68383 | 3.88 | 0.0085 | 0.0063 |
| (−0.7436) | (0.19351) | (0.0494) | |||
| ROA | 4.21157 | −0.09633 | 9.76 | 0.0173 | 0.0155 |
| (1.3481) | (0.14917) | (0.0019) | |||
| CEO specific factors: | |||||
| Tenure | 0.01459 | 0.21024 | 0.94 | 0.0015 | 0.0001 |
| (0.01506) | (0.14441) | (0.3329) | |||
| Bonus ($) | 1.53 × 10⁻⁵ | 0.28328 * | 0.11 | 0.0002 | 0.0015 |
| (<0.0001) | (0.1222) | (0.7423) | |||
| CSR Contract | −0.80260 ** | 0.55448 *** | 8.51 | 0.0154 | 0.0136 |
| (0.27507) | (0.13576) | (0.0037) | |||
| Panel B: Univariate Regression Results with Lagged CSR rating as the Dependent Variable | |||||
| Independent Variable | Coefficient | Intercept | F | R Squared | Adjusted R Squared |
| Firm specific Factors: | |||||
| Visibility | 0.54651 *** | 0.31365 ** | 27.64 | 0.0403 | 0.0389 |
| (0.10395) | (0.10387) | (<0.0001) | |||
| Firm Size | −0.05061 | 0.76389 | 0.48 | 0.0007 | 0.0008 |
| (0.07332) | (0.66079) | (0.4902) | |||
| Cash | 1.2151 × 10⁻⁴ ** | 0.2003 | 10.83 | 0.0166 | 0.0151 |
| (<0.0001) | (0.11404) | (0.0011) | |||
| Gross Profit (Loss) | 1.66 × 10⁻⁵ | 0.22982 | 0.71 | 0.0011 | 0.0005 |
| (0.4012) | (0.12702) | (0.4012) | |||
| Firm Debt Ratio | −1.27517 | 0.65615 ** | 3.2 | 0.0064 | 0.0044 |
| (0.71337) | (0.18515) | (0.0745) | |||
| ROA | 3.52720 ** | −0.03851 | 7.82 | 0.0128 | 0.0112 |
| (1.26156) | (0.14319) | (0.0053) | |||
| CEO Specific Factors: | |||||
| Tenure | 0.02007 | 0.18745 | 2.04 | 0.0031 | 0.0016 |
| (0.01406) | (0.13996) | (0.1539) | |||
| Bonus ($) | 2.58 × 10⁻⁵ | 0.28415 * | 0.31 | 0.0005 | 0.001 |
| (<0.0001) | (0.11851) | (0.5781) | |||
| CSR Contract | −0.59764 * | 0.52018 *** | 5.08 | 0.0086 | 0.0069 |
| (0.26509) | (0.13027) | (0.0245) | |||
Table 4.
Multifactor Regression Results. This table presents the regression results for firm factor (A,B) and CEO factor (B,C) models with contemporaneous (A,C) and lagged (B,D) CSR as the dependent variable. Firm effects have been controlled for and the z-score visibility metric has been used. Firm effects have been controlled. The coefficient term for the independent variable is given with corresponding t-statistics; standard errors given in brackets. The superscripts *, ** and *** indicate significance at the 5%, 1% and 0.01% levels, respectively.
| Panel A: Firm Factor Model Regression; Contemporaneous CSR as the Dependent Variable | ||
| Variable | Beta | t-Statistic |
| Visibility | 1.6728 *** (0.40550) | 4.13 |
| Size | −0.23055 (0.23098) | −1.00 |
| Cash | 3.1595 × 10⁻⁴ *** (4.7660) | 6.63 |
| Profit | −1.5884 × 10⁻⁵ (4.5700 × 10⁻⁵) | −0.35 |
| Firm Debt Ratio | −1.1977 (0.99537) | −1.20 |
| ROA | 2.2463 * (0.99918) | 2.25 |
| Adjusted R-Squared | 0.78 | |
| Panel B: Firm Factor Model Regression; Lagged CSR as Dependent Variable | ||
| Independent Variable | Beta | t-Statistic |
| Visibility | 1.2040 *** (0.29800) | 4.04 |
| Size | 0.14125 (0.20024) | 0.71 |
| Cash | 2.6779 × 10⁻⁴ *** (4.4760 × 10⁻⁵) | 5.98 |
| Profit | −7.8261 × 10⁻⁵ (4.632 × 10⁻⁵) | −1.69 |
| Firm Debt Ratio | −0.48010 (0.97438) | −0.49 |
| ROA | 2.2793* (0.93470) | 2.44 |
| Adjusted R-Squared | 0.77 | |
| Panel C: CEO Factor Model Regression; Contemporaneous CSR as the Dependent Variable | ||
| Independent Variable | Beta | t-Statistic |
| Visibility | 0.88179 *** (0.32033) | 2.75 |
| Tenure | −1.8773 × 10⁻³ (0.01176) | −0.16 |
| Bonus | −4.9093 × 10⁻⁵ (3.2350 × 10⁻⁵) | −1.52 |
| Contract | 0.32929 (0.28545) | 1.15 |
| Adjusted R-Squared | 0.74 | |
| Panel D: CEO Factor Model Regression; Lagged CSR as the Dependent Variable | ||
| Independent Variable | Beta | t-Statistic |
| Visibility | 0.26101 (0.25579) | 0.308 |
| Tenure | 0.00375 (0.01121) | 0.33 |
| Bonus | −4.5794 × 10⁻⁵ (3.2090 × 10⁻⁵) | −1.43 |
| Contract | 0.59848 * (0.27974) | 2.14 |
| Adjusted R-Squared | 0.74 | |
Note A: GLM procedure is used for linear regression over the period 1999–2008, 471 observations are used. Model given by Equation (2). Note B: GLM procedure is used for linear regression over the period 1999–2008, 471 observations are used. Model given by Equation (2). Note C: GLM procedure is used for linear regression over the period 1995–2008, 544 observations are used. Model given by Equation (3). Note D: GLM procedure is used for linear regression over the period of 1995–2008, 544 observations are used. Model given by Equation (4).
Table 5.
Linear Regression of CSR and Firm Size Model with Visibility as Dependent Variable. This table presents the results for the generalized linear model (GLM) linear regression models given in Equations (5) and (6). The independent variables are CSR rating in contemporaneous (A) and lagged (B) time and firm size and the dependent variable is the visibility metric (z-score). Firm effects are controlled in both regressions. Coefficients for each independent variable is given with the corresponding t-statistic; standard errors are given in brackets. The superscripts * and ** indicate significance at the 5% and 1% levels, respectively.
| Panel A: Linear Regression, Size and Contemporaneous CSR as Independent Variables, Visibility as Dependent Variable | ||
| Independent Variable | Beta | t-Statistic |
| CSR Rating | 0.01802 ** (0.00610) | 2.95 |
| Firm Size | 0.04967 * (0.02053) | 2.42 |
| Adjusted R-Squared | 0.74 | |
| Panel B: Linear Regression, Size and Lagged CSR as Independent Variables, Visibility as Dependent Variable | ||
| Independent Variable | Beta | t-Statistic |
| CSR Rating | 0.00946 (0.00702) | 1.35 |
| Firm Size | 0.06712 ** (0.02207) | 3.04 |
| Adjusted R-Squared | 0.74 | |
Note A: GLM procedure is used for linear regression over the period of 1995–2008, 611 observations are used. Note B: GLM procedure is for linear regression over the period of 1994–2008, 660 observations are used.
Table 6.
Linear Regression results for Firm Factor Models. This table presents the results for the firm factor linear regression models with contemporaneous CSR (A) and lagged CSR (B) as the dependent variables. Regression coefficients are presented for each independent variable in the model and standard errors are given in brackets. Firm effects have been controlled for. High_vis is an interaction term equal to one if the data is in the top quartile of visibility and 0 if it is in the bottom, null value given otherwise. The superscripts * and ** indicate significance at the 5%, 1% and 0.01% levels, respectively.
| Panel A: Linear Regression for Firm Factors with Contemporaneous CSR as Dependent Variable | ||
| Independent | Beta | t-Statistic |
| Size | −1.3725 * (0.60335) | −2.27 |
| Size * High_vis | 2.2960 ** (0.78975) | 2.91 |
| Cash | −2.8606 × 10⁻⁴ (3.2657 × 10⁻⁴) | −0.88 |
| Cash * High_vis | 5.5356 × 10⁻⁴ (3.1653 × 10⁻⁴) | 1.68 |
| Profit | 2.9748 × 10⁻⁴ (3.1100) | 0.96 |
| Profit * High_vis | −3.3904 × 10⁻⁴ (3.1653) | −1.07 |
| Debt Ratio | −1.6438 (2.6432) | −0.62 |
| Debt Ratio * High_vis | −5.9916 (2.6432) | −1.69 |
| ROA | 1.5810 (1.6983) | 0.93 |
| ROA * High_vis | −3.7279 (3.4714) | −1.07 |
| Adjusted R-squared | 0.75 | |
| Panel B: Linear Regression Results for Firm Factors with Lagged CSR as Dependent Variable | ||
| Independent | Beta | t-Statistic |
| Size | −1.0836 * (0.52980) | −2.05 |
| Size * High_vis | 2.2687 ** (0.68324) | 3.32 |
| Cash | 2.9301 × 10⁻⁴ (3.2580) | 0.09 |
| Cash * High_vis | −6.7563 × 10⁻⁵ (3.2929 × 10⁻⁴) | −0.21 |
| Profit | 2.5396 × 10⁻⁴ (3.0125 × 10⁻⁴) | 0.84 |
| Profit * High_vis | −3.5146 × 10⁻⁴ (3.0747 × 10⁻⁴) | −1.14 |
| Debt Ratio | −0.84197 (2.6352) | −0.32 |
| Debt Ratio * High_vis | −7.1662 * (3.6274) | −1.98 |
| ROA | 1.6012 (1.7450) | 0.92 |
| ROA * High_vis | −0.08334 (2.6708) | −0.03 |
| Adjusted R-squared | 0.70 | |
Note A: GLM procedure is used for linear regression over the period of 1999–2008, 224 observations are used. Note B: GLM procedure is used for linear regression over the period of 1994–2008, 283 observations are used.
© 2019 by the authors. Licensee MDPI, Basel, Switzerland. This article is an open access article distributed under the terms and conditions of the Creative Commons Attribution (CC BY) license (http://creativecommons.org/licenses/by/4.0/).
Share and Cite
MDPI and ACS Style
Li, F.; Morris, T.; Young, B. The Effect of Corporate Visibility on Corporate Social Responsibility. Sustainability 2019, 11, 3698. https://0-doi-org.brum.beds.ac.uk/10.3390/su11133698
AMA Style
Li F, Morris T, Young B. The Effect of Corporate Visibility on Corporate Social Responsibility. Sustainability. 2019; 11(13):3698. https://0-doi-org.brum.beds.ac.uk/10.3390/su11133698
Chicago/Turabian StyleLi, Frank, Taylor Morris, and Brian Young. 2019. "The Effect of Corporate Visibility on Corporate Social Responsibility" Sustainability 11, no. 13: 3698. https://0-doi-org.brum.beds.ac.uk/10.3390/su11133698
Note that from the first issue of 2016, this journal uses article numbers instead of page numbers. See further details here.