Article

Recycling Agricultural Wastes and By-products in Organic Farming: Biofertilizer Production, Yield Performance and Carbon Footprint Analysis

by
Mariangela Diacono
1,*,
Alessandro Persiani
1,
Elena Testani
2,
Francesco Montemurro
3 and
Corrado Ciaccia
2
1
Consiglio per la ricerca in agricoltura e l’analisi dell’economia agraria—Research Centre for Agriculture and Environment, Via Celso Ulpiani 5, 70125 Bari, Italy
2
Consiglio per la ricerca in agricoltura e l’analisi dell’economia agraria—Research Centre for Agriculture and Environment, Via della Navicella 2-4, 00184 Roma (RM), Italy
3
Consiglio per la ricerca in agricoltura e l’analisi dell’economia agraria—Research Centre for Vegetable and Ornamental Crops, Via Salaria 1, 63030 Monsampolo del Tronto (AP), Italy
*
Author to whom correspondence should be addressed.
Sustainability 2019, 11(14), 3824; https://0-doi-org.brum.beds.ac.uk/10.3390/su11143824
Submission received: 27 May 2019 / Revised: 10 July 2019 / Accepted: 10 July 2019 / Published: 12 July 2019

Abstract

:
The Circular Economy concept implies the re-design of existing production systems in agriculture, by promoting agricultural waste recycling. In an organic zucchini—lettuce rotation, two different agroecological tools were considered: biofertilizer and presence or absence of green manure (GM+ and GM−). In particular, we compared: (i) anaerobic digestate from cattle manure, co-composted with vegetable wastes, with the presence of GM (AD GM+); (ii) olive pomace compost, re-composted, with the presence of GM (OWC GM+); (iii) municipal waste compost with GM (MWC GM+); (iv) municipal waste compost without GM (MWC GM−). These materials were tested with a commercial organic fertilizer without GM (COF GM−) as a positive control. The objectives were: (i) assessing the environmental sustainability of biofertilizers through carbon footprint analysis by greenhouse gas—GHG—emissions; (ii) evaluating the agronomic performance on the vegetable rotation, by energy output assessment. The total carbon emissions of biofertilizers production was 63.9 and 67.0 kg of CO2 eq Mg−1 for AD and OWC, respectively. The co-composting and re-composting processes emitted 31.4 and 8.4 kg CO2 per Mg of compost, respectively. In AD the ventilation phase of composting accounted for 37.2% of total emissions. The total CO2 emission values for the two-crop cycles were the highest in COF GM− and the lowest in OWC GM+, due to different fertilizer sources. On the average of the treatments, the input that induced the highest CO2 emission was irrigation (37.9%). The energy output assessment for zucchini and lettuce highlighted similar performance for all the treatments. Our findings demonstrated the validity of the tested processes to recycle agro-industrial wastes, and the potential of agroecological practices (GM) to mitigate GHG emissions.

1. Introduction

Europe is experiencing unsustainable exploitation of natural resources, unpredictable severe changes of climate, loss in biodiversity and increasing food waste production, in a context of a world population increase of more than 9 billion by 2050 [1,2,3]. Overcoming these challenges requires research and innovation in agriculture, to achieve radical switches in lifestyle and resource use.
In 2015, the European Commission published ‘Closing the loop—An EU action plan for the circular economy’ [4]. The new model of economy can support the EU’s commitments to reach the Sustainable Development Goal n.12 ‘Responsible consumption and production’. In closed systems, for example, the goal is to use wastes from one sector as an input for other ones. To this aim it is necessary to consider that different Agricultural Wastes, Co-products and By-products (AWCB) are generated during the production, industrial manufacturing and consumption of agricultural produce. The studies reviewed by Corrado and Sala [5] showed that food waste generation along the supply chain ranges between 194 kilograms per capita−1 year−1 (kg/p/yr) and 389 kg/p/yr at the global level, and between 158 kg/p/yr and 298 kg/p/yr at the European scale. In the European Union, AWCB have been estimated to be more than 700 million Mg every year [6]. They potentially represent an enormous loss of resources in the form of both materials and energy. In addition, the management and incorrect disposal of AWCB have huge environmental impacts, such as groundwater contamination, soil pollution and greenhouse gases emission to the air [7].
In Italy, AWCB are produced in different stages of supply chain, and in particular 3.3 and 2.6% of agri-food products and final products, respectively, from the food industry are discarded before sale (17 and 1.7 Mt yr−1, respectively), while the loss occurring in food retailers is about 250,000 t yr−1 [3].
As a matter of fact, the long-term aim of the revised Waste Framework Directive (EU, 2018/851) is to decrease the quantity of waste produced and achieve high levels of recycling, as well as phase out landfilling except for non-recyclable wastes. In the frame of development of the European Bioeconomy [8,9], sustainable valorization of the abovementioned AWCB through conventional or novel processes seems crucial. Therefore, waste management and global resource depletion can be solved together, for an eco-innovation focused on a “zero waste” society and economy. This model of circular chain, often defined as closed loops, could recover valuable components from AWCB. Much of the most important organic materials generated as AWCB contain, in fact, many components (e.g., proteins, sugars and lipids) that could be utilized as substrates and nutrients in different microbial/enzymatic processes, to originate innovative added-value products. Possible uses of residual organic materials include production of biofertilizers and soil amendments, energy recovery, production of chemicals (volatile organic acids, alcohols, etc.) and utilization in farm animal nutrition [10,11].
Following the most widespread waste streams of the production chains in the study area (Southern Italy), AWCB from farm livestock (cattle manure), olive milling (wet olive pomace and olive pruning) and vegetable processing (aubergines, peppers) were selected for the study. For the purposes of this research, two traditional technologies of waste treatment, namely anerobic digestion and composting were considered, to study the contribution of integrated methodologies applied in the circular economy [12].
Digestates are co-products from biogas plants for methane production by anaerobic digestion of different organic matrices (e.g., farm livestock manure) and can be separated into a solid and a liquid fraction. In particular, according to Møller et al. [13] the solid digestate fraction can contain 60–80% of the organic matter and phosphorus, 20–25% of the nitrogen and 10–15% of the potassium compared to the original material. However, since phytotoxicity, viscosity and odor limit the direct application of digestate on agricultural soils, pre-treatments are required to obtain a valuable biofertilizer, thus allowing sustainable crop cultivation without environmental risks [14]. To improve the quality of this pre-processed solid fraction, co-composting could be a feasible way, providing easily degradable materials to foster the microbial activity during the treatment [15]. The co-composting process is a controlled biological degradation under aerobic conditions, where organic material compounds are transformed in shorter molecular chains and a more stable humus, which is important in agricultural production and to recycle organic matter [16]. The resulting co-composted anaerobic digestate (AD) can be easily produced at farm scale, by using raw materials available in the farm/area. The farmers knowledge on how apply organic fertilizers and their possible positive effects (e.g., soil health, suppressiveness, environmental benefits, etc.) is crucial [17]. Hence, soil application of this biofertilizer needs a higher farmer’s expertise, to synchronize the mineralization rate with the plant growth, reducing the risk of leaching of excess N.
Among the AWCB, olive pomace (OP) is one of the most important organic agro-industrial wastes in Mediterranean countries, with a high content of organic matter (about 90%) that could profitably be recycled through composting, so that it can be used in agriculture as fertilizer [18]. Olive pomace is a semisolid fraction derived after the extraction of olive oil by two-phase centrifugation systems, generated in huge amounts in a short period of time (October-November), which incorrect disposal may determine a damaging environmental impact. This is due to the phytotoxic and antimicrobial effects of phenolic compounds and the lipid fraction [19]. Re-composting the pre-processed OP with an on-farm compost from vegetable residues could be a feasible treatment to recycle this waste, producing a biofertilizer with an adequate degree of stability and maturity. The re-composting of OP can lead to a decrease in the C/N ratio, compared to the starting material, and to an improvement of the microbial activity.
There is a large literature relating to the influence of composted digestate and olive pomace both on soils and different crops [20,21,22,23]. The combination of cover crops introduction (green manure) and application of organic materials was also studied for different crops in organic production [24,25]. However, to the best of our knowledge there is a lack of information on environmental sustainability assessment of recycled organic matrices applied in association with green manure on vegetable crops in organic farming, under Mediterranean conditions.
Vandermeersch et al. [26] in particular found that food waste management options can be evaluated according to several assessment methods. These methods are material flow analysis, energy balance, exergy analysis and life cycle assessment. Indeed, carbon footprint method can also be applied [27], to assess the environmental impact and sustainability of the waste recycling treatments used. The carbon footprint is a measure of the total amount of carbon dioxide emissions that is directly and indirectly caused by an activity or is accumulated over the life stages of a product [28]. The unit is kg CO2 when only CO2 is considered, while if other greenhouse gases (GHG) are included the unit changes to kg CO2-e, indicating the mass of CO2-equivalents. During biological waste treatments, the organic materials are metabolized by microorganisms, so a part of their embedded carbon is emitted into the air, and the remainder is stored as compost or digestate that can be assessed by carbon footprint analysis.
The objectives of the research were: (i) to produce biofertilizers from AWCB so to close the organic materials cycle from field to productive sector and return back to the field, (ii) to test the environmental sustainability and effectiveness of co-composting procedures through carbon footprint analysis, (iii) to evaluate the agronomic performance of the biofertilizers obtained on a zucchini–lettuce rotation under organic farming management and Mediterranean conditions.

2. Materials and Methods

2.1. Experimental Site

The experimental field trial was carried out in 2016–2017 on an organic zucchini—lettuce rotation at the ‘Azienda Sperimentale Metaponto’ (one of the Research Centers of the Consiglio per la ricerca in agricoltura e l’analisi dell’economia agraria), located in Metaponto (MT)—South Italy (lat 40° 24’ N; long 16° 48’ E and 8 meters a.s.l.).
The climate is classified as “accentuated thermomediterranean” according to the UNESCO-FAO classification [29], with an average month temperature of 8.8 and 24.4 °C in the winter and summer, respectively. Sometimes the winter and summer temperatures fall below 0 °C and rise above 40 °C, respectively. The mean rainfall is about 490 mm year−1 but it is unevenly distributed, since it is concentrated in the winter months.
The soil of the experimental trial is classified as a Typic Epiaquert [30]. It has a clay loam texture (60 and 36% of the clay and silt, respectively) with a soil bulk density of 1350 kg m−3, and it contains 1.0 and 19.0 g kg−1 of N and organic matter, respectively.

2.2. Experimental Design, Composting Processes and Measurements

2.2.1. AWCB Tested

The experiment was divided into two complementary stages. In the first one, co-composting/re-composting processes of pre-processed organic matrices were carried out on selected wastes, sub-products and biofertilizers (as outlined above) derived from local production systems and residues from experimental farm activities. In the second stage, the obtained stable materials were tested in an experimental field, in comparison with a commercial fertilizer.
The anaerobic digestate from cattle manure (80% of total dry weight) was co-composted, in a six-weeks process, to improve the quality of this solid fraction, with (highly fermentable) organic vegetable wastes (10%)—i.e., Aubergines, peppers—and straws (10%) acting as bulking agent, so obtaining an anaerobic digestate-based compost (AD). The olive pomace compost was a powdery compost obtained by olive pomace (80% of total dry weight) and olive pruning (20%), which was supplied by the Research Centre of Composting—CESCO—in Laurino (SA), Campania region (south of Italy). The olive pomace compost (75% of the final product) was re-composted at the CREA experimental farm together with a Municipal Waste Compost (MWC; 5% of the total dry weight) and an on-farm compost (20%) obtained by highly fermentable farm residues (grass clippings and straws) and organic vegetable wastes, to obtain an olive waste-based compost (OWC). The percentage of each raw material used for the composting process was decided also on the C/N ratio basis, to ensure an equilibrate compost process and to obtain the best final C/N ratio. The obtained compost was a stable material with total N content of 2.4% (dry matter) and C/N of 18 (compared to C/N of 21 of the starting material).
All the raw materials that we have used in this research were chosen to accomplish different level of agro-ecological intensification. In particular, the raw materials used for the co- and re-composting processes were sampled and analyzed, to determine their Total Nitrogen (N) and Total Organic Carbon (TOC) contents. The total N (%) and TOC (%) contents of each raw material sample were determined by an elemental LECO analyzer (LECO, mod. RC-612; St. Joseph, MI, USA) using a dry combustion method [31]. In Table 1 the Total N and TOC content of the raw materials used in AD and OWC composting processes are reported.
The mixtures were manually prepared on the experimental farm and the composting process was carried out in static aerated piles (1.0 m high × 1.5 m base diameter) of about 300 kg each. The piles were set up on a concrete platform to avoid the loss of percolates. During composting, the pile moisture content was weekly checked and kept between 40 and 70%. In order to allow aeration and temperature control, the piles were manually turned in a first stage. Then, the aeration of the co-composted AD was ensured by the ventilation with a blower (1 kW), which was linked with a timer, ensuring 5 minutes of aeration for each hour for the first two weeks.
No aeration with a blower was necessary for the re-composted OWC, since the original materials were more stable and had less oxygen demand. The maturity of the compost was not monitored through humification index but only indirectly, considering the microbiological activity linked to the temperature of the composting process. In particular, we monitored the temperature of the re-composting process turning the material with a shovel once per week during the first three weeks of the entire six-week process, whereas we did not turn the materials when the temperature was stable.
The heavy metals content (cadmium, Cd; chromium, Cr; copper, Cu; nickel, Ni; lead, Pb; zinc, Zn) of anaerobic digestate (AD) and olive wastes compost (OWC) before and after the co-/re-composting processes was determined by inductively coupled plasma emission spectrophotometer (ICP-AES Iris; Thermo Optek, Milan, Italy). Data recorded from spectrophotometer have been submitted to Analysis of Variance (by using SPSS Inc. Released 2007, SPSS for Windows, Version 16.0. SPSS Inc., Chicago, IL, USA).

2.2.2. Experimental Design Treatment, Measurements

The experimental design was a split-plot with two factors and three replicates (blocks). The main-plot factor was the green manure (GM) presence or not (GM+ and GM−, respectively). The subplot factor was assigned to fertilizer (F), comparing: (i) the co-composted anaerobic digestate (AD); (ii) the re-composted olive waste compost (OWC); (iii) a commercial organic fertilizer, based on dried animal manure (COF) (Ca’ verde—ED & F Man Liquid Products Italia srl, Bagnasco, Italy) as positive control; (iv) a municipal solid waste compost (MSW), as second positive control, obtained with municipal solid waste from separate collection and biodegradable wastes from parks and gardens management in processing plant of Tersan S.p.A. (Bari, Italy). Each sub-plot was 4 × 5 m. All the fertilizers were allowed in organic farming, in accordance to the European Regulation (Commission Regulation N° 889/2008 of 5 September 2008 for EU Council Regulation N° 834/2007).
The fertilizers were applied to soil at the dose of 150 kg N ha−1, split in two amounts in separate stages of the rotation in both years: before GM sowing (70% of the total quantity) and before zucchini transplanting (the remaining 30%), to reduce potential N immobilization phenomena during the cash crop cycle. No fertilization was applied before the lettuce crop. The 150 kg ha−1 of N was derived as the sum of the marketable N uptake of both crops in our environmental conditions and, consequently, we applied a different amount of organic materials, according with their N content.
Irrigation was done with the same volume of water in all treatments, calculated to reach 100% of available soil water for a soil depth of 0–40 cm for each irrigation.
The green manure treatment was a mixture of common vetch (Vicia sativa L.) and oat (Avena sativa L.) sown at rate of 80 and 220 kg ha−1 for vetch and oat, respectively, on 3rd November 2016. The green manure crops sowing was replicated on 28th December 2017, mainly due to the dry period occurred on the autumn 2016 (data not reported). The GM was then chopped and incorporated into the soil (about at 20 cm depth) by plowing on 26th April 2017. Zucchini (cv President) 25-days old seedlings were hand-transplanted at an inter-row × row distance of 1.0 × 1.0 m (1.0 plant m−2) on 3rd May in 2017. The harvest began the 9th of June and was completed by the 25th July, with a cropping cycle of 81 days. Lettuce (var. Iceberg,) transplanting was done after a rotary tillage and it occurred on 24th August 2017. Lettuce harvest was completed on 23rd October, with a cropping cycle of 60 days. Furthermore, no chemicals to control pests and diseases were used in both cropping cycles.
In order to compare the systems production capacity including different crops, according to other studies [32,33], yields were transformed in energy output equivalent. The energy output was obtained by multiplying the productions by their corresponding energy equivalents [34].
At GM termination, the aboveground biomass was sampled by placing two randomly-selected 1.0 × 1.0 m2 quadrat within each sub-plot. Samples were dried for 48 h at 70° to determine dry content, and total N content (%) of each biomass sample was determined by LECO analyzer (dry combustion), thus allowing the calculation of the above soil biomass N (N content × biomass dry weight). At zucchini and lettuce harvest stage, yield and residues (Mg ha−1) were sampled from a 1.0 m2 area in the middle of each sub-plot. Biomasses were then dried for 48 h at 70°C for the dry content determination. At the beginning and at the end of the rotation, two soil samples (0–30 cm depth) were randomly taken from each sub-plot, air dried, 2-mm sieved and then analyzed for organic carbon content by means of an elemental analyzer (LECO, mod. RC-612; St. Joseph, MI, USA), using a dry combustion method [31].
To answer to the specific aims of this study, only selected treatments—corresponding to different and actual scenarios—were taken into consideration. Therefore, results are reported for the following treatment combinations: AD GM+, OWC GM+, MWC GM+, MWC GM− and COF GM−. The flowchart of the entire analyzed systems is described in Figure 1.

2.2.3. Statistical Analysis

A parametric one-way Analysis of Variance (ANOVA) was used to verify the effect of the treatments on energy output, and the Duncan Multiple Range Test (DMRT) was performed for mean comparisons (p ≤ 0.05 probability level). Statistical analysis was carried out by using SPSS for Windows, Version 16.0.

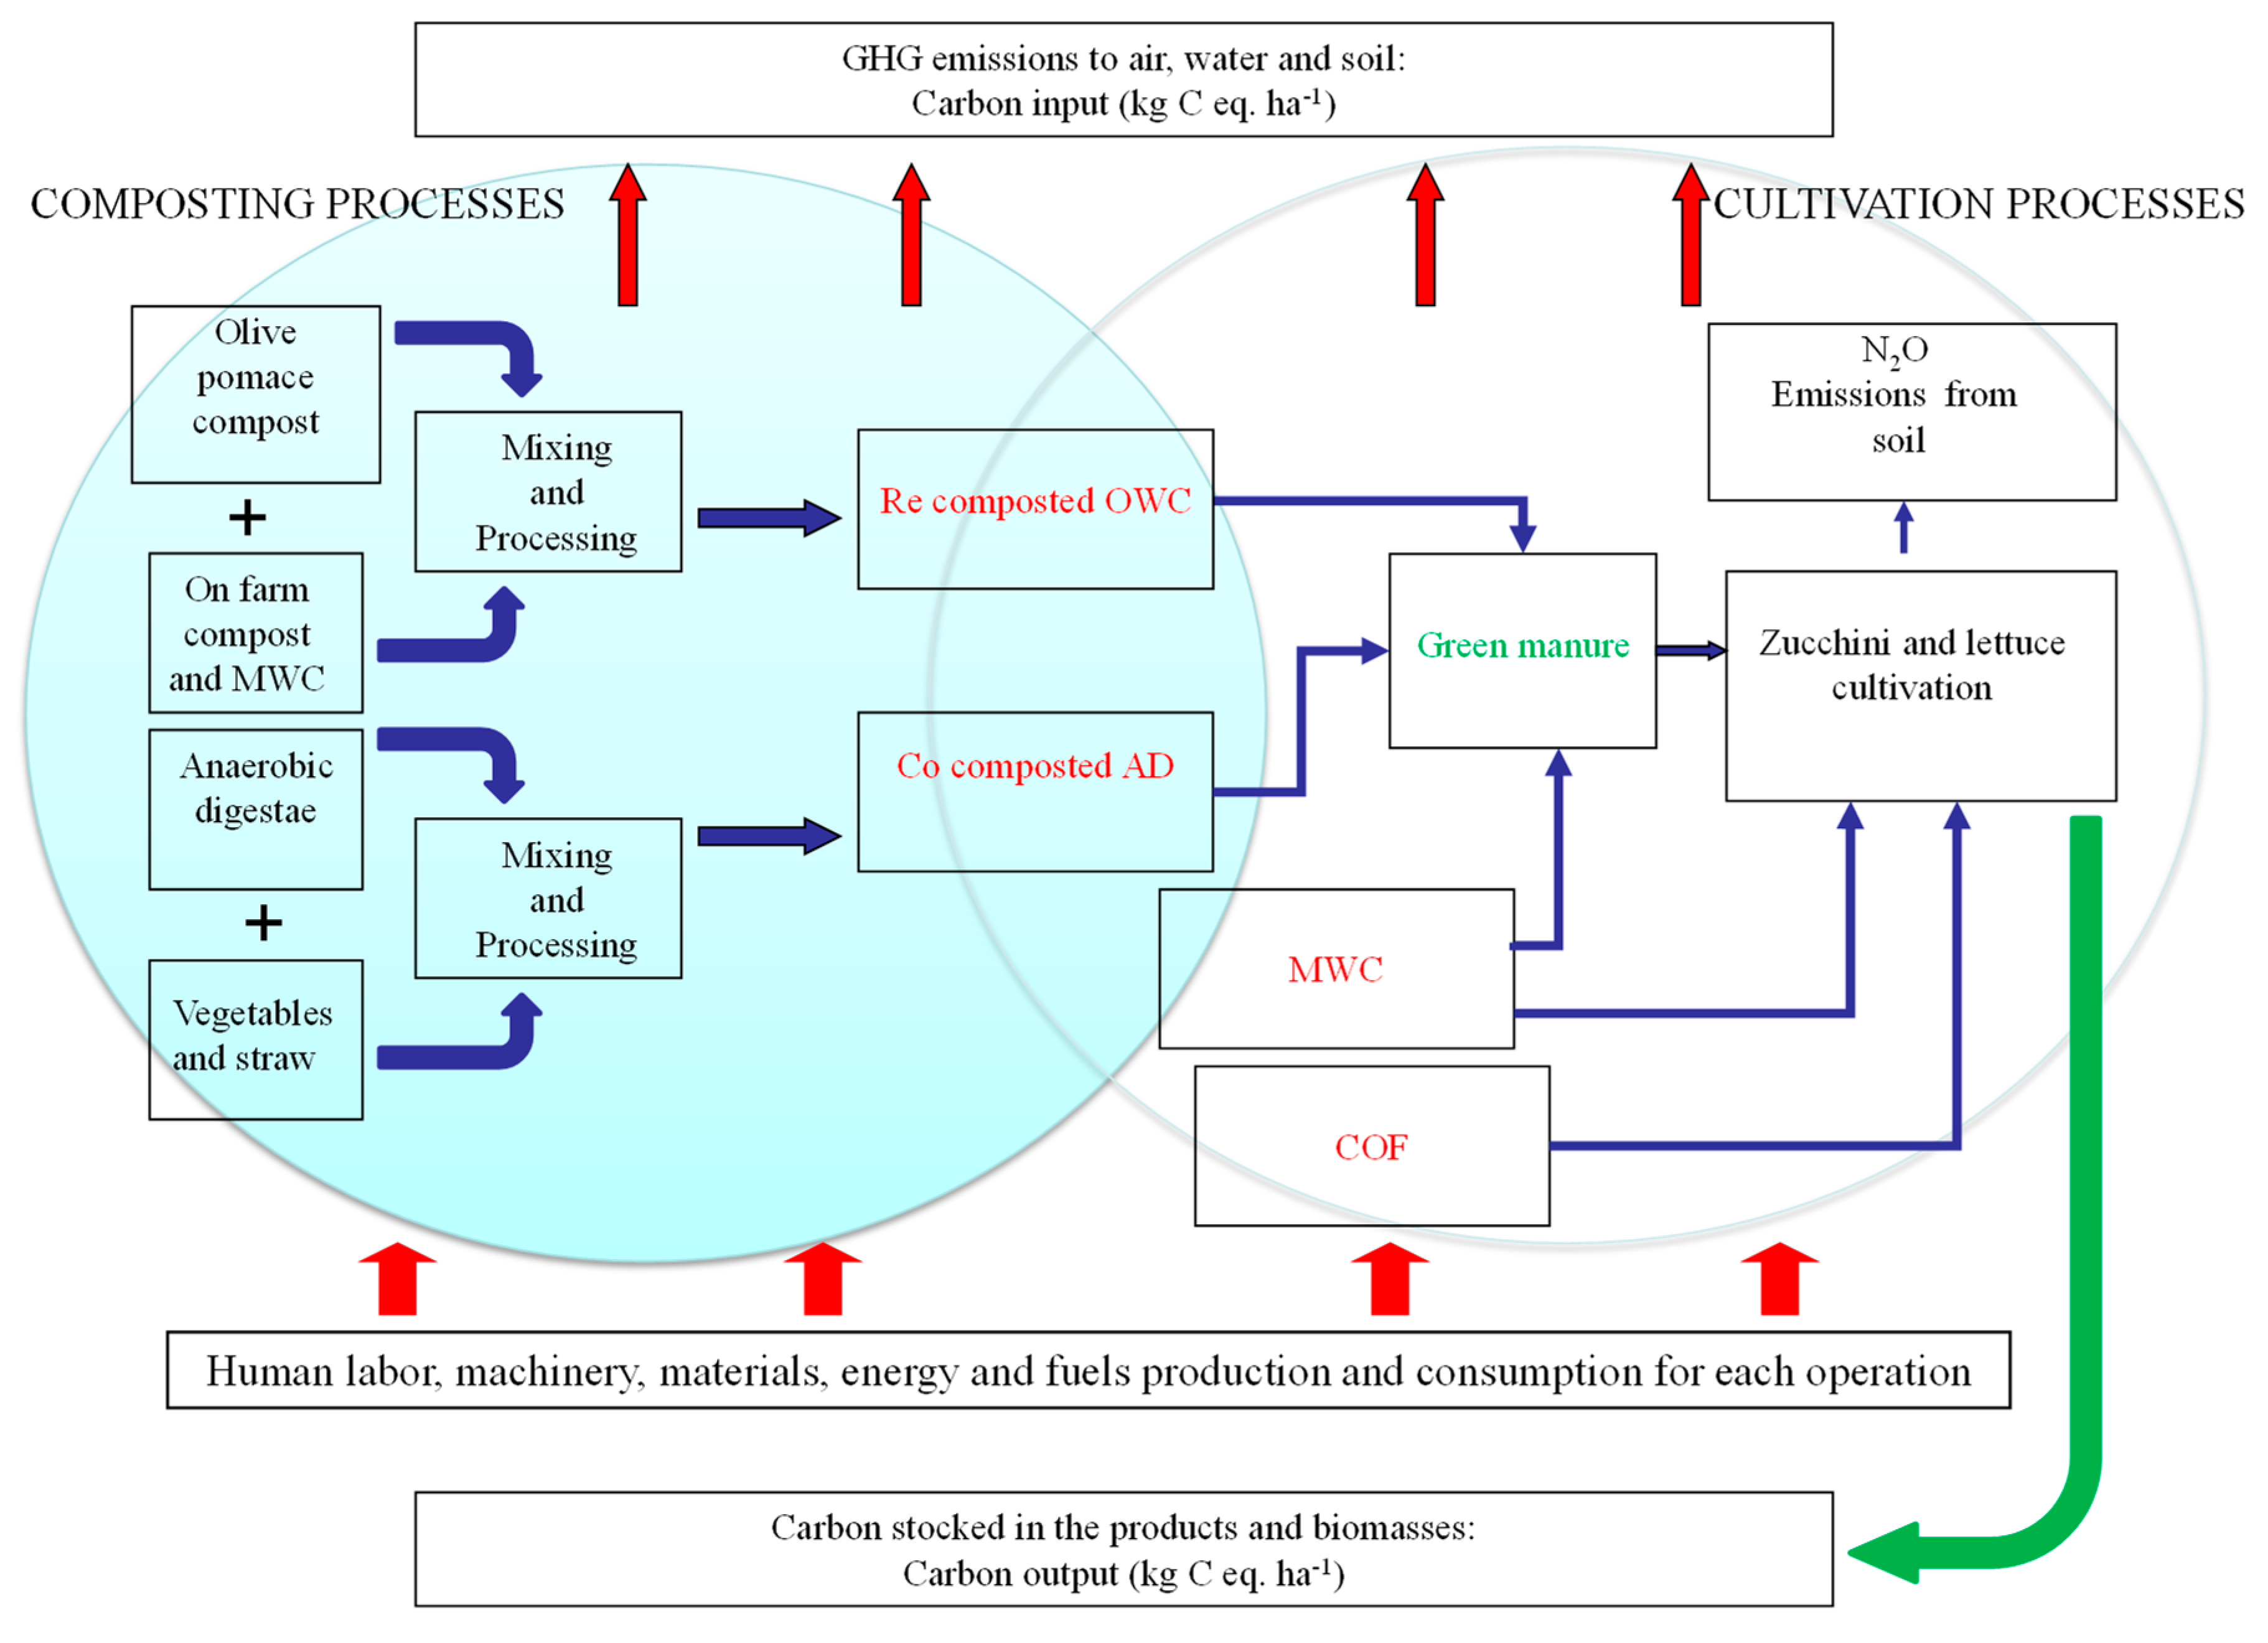
2.3. Environmental Impact and Sustainability Assessment

Greenhouse Gases Emissions

To assess the environmental impact and the sustainability of the different fertilization strategies implemented in the field trial, the global warming potential (GWP) analysis was applied [35]. The GWP is the total array of GHG emissions (CO2, N2O and CH4), which is produced directly and indirectly during the cultivation cycles. However, we did not take into account the CH4 and ammonia emissions in our operations, since the CH4 in the composting process was already included in the coefficient reported in the Table 2. Furthermore, the CH4 emission is considered negligible when the aerobic conditions occurred, as reported in Luske [36] and Brown et al. [37]. Pampuro et al. [38] also showed that if during the composting process the materials are adequately turned and aerated the CH4 emissions are reduced. Moreover, in calculations the CH4 emission was not included since during the processes (in our conditions) this emission is much less than N2O, as reported by Pratibha et al. [35]. Also, since we re-composted the materials and considering their nature, the amounts of the ammonia should be considered negligible [37].
The GHG emissions were transformed into CO2 equivalent by using GWP equivalent factors of 1 and 310 for CO2 and N2O, respectively [39]. In this study, the amount of GHG emissions in terms of CO2 equivalent was estimated both in the composting processes and in the subsequent crop cycle activities by means of several parameters, including human labor, machineries, fuels, fertilizers, seeds and pesticides, and marketable yields (Table 2). More specifically, also the emissions by the composts used as raw materials before co-composting and re-composting are already included in the considered coefficients (Table 2). The labor time was measured for each operation, and the diesel consumption was directly measured in the farm. The machineries and implements weight for each operation were calculated as follows:
W = M × t / l
where:
  • W = machinery and implement weights for each operation (kg)
  • M = mass (kg)
  • t = duration of each operation (h)
  • l = lifespan of the tools (h)
The variability factor was the fertilization strategy used, whereas the soil and phytosanitary managements were not changed in the different treatments. The GHG values of unit inputs were obtained by multiplying each input by its own emission coefficient taken from the literature (Table 3) and were reported by Mg of compost produced and by production unit (hectare) per year, for the whole cultivation cycle. The GHG emissions were divided both by category (e.g., human labor, fuels, fertilizers) and operations (e.g., sowing, tillage, fertilizers application) [27,32,40].
Aside from the CO2 equivalent emissions measured during the crop’s cultivation operations, a further direct and indirect GHG impact of fertilizers use, and plants biomass decomposition arises from N2O emissions from soils. Nitrous oxide is produced in soils mainly due to microbially-mediated processes (nitrification and denitrification) [51]. The direct and indirect N2O emissions from the fertilizer application and the plant biomass decomposition were estimated by IPCC methodology [39], by using the coefficients reported in Table 3.
The direct soil N2O emissions (N2ODirect), in terms of CO2 equivalents, from the application of N fertilizer (NF) and the N derived from the green manure and crop residues biomass degradation (NB) were estimated following the equation by Pratibha et al. [35]:
N 2 O D i r e c t = ( N F + N B ) × E F × ( 44 / 28 ) × 310
where:
  • 44/28 = coefficient converting N2O–N into N2O
  • 310 = global warming potential coefficient.
The indirect soil N2O emissions (N2OIndirect) from nitrate leaching and volatilization of NH3 and NOx were calculated as:
N 2 O I n d i r e c t = ( ( N F + N B ) × F R A C L e a c h × E F L e a c h + N F × F R A C G a s × E F v o l a t ) × ( 44 / 28 ) × 310
where:
  • NF = N derived from fertilizers application (kg ha−1)
  • NB = N derived from the green manure and residues biomasses degradation (kg ha−1)
  • FracLeach = fraction of N lost by leaching and runoff (%);
  • FRACGas = fraction of volatilized nitrogen from fertilizer (%).
  • EFleach = leaching emission factor (kg N2O-N kg−1)
  • EFvolat = volatilization emission factor (kg N2O-N kg−1)
The total carbon output, that is the sum of the carbon equivalent of the zucchini and lettuce yields, was calculated as:
C a r b o n   O u t p u t   ( C O )        = ( Z u c c h i n i   Y i e l d   d r y   m a t t e r × T O C ) + ( L e t t u c e   Y i e l d   d r y   m a t t e r × T O C )
The carbon balance (CB), the difference between total carbon output and total carbon input, and the carbon efficiency (CE) of the different cropping systems were calculated according to Lal [49]:
C a r b o n   b a l a n c e = c a r b o n   o u t p u t   ( C O ) c a r b o n   i n p u t   ( C I ) C a r b o n   e f f i c i e n c y   ( C E ) = c a r b o n   o u t p u t   ( C O )   /   c a r b o n   i n p u t   ( C I )
where:
  • Carbon input (CI) = Sum of total GHG emission in CO2 eq. × 12/44 (stoichiometric coefficient from CO2 to C)

3. Results

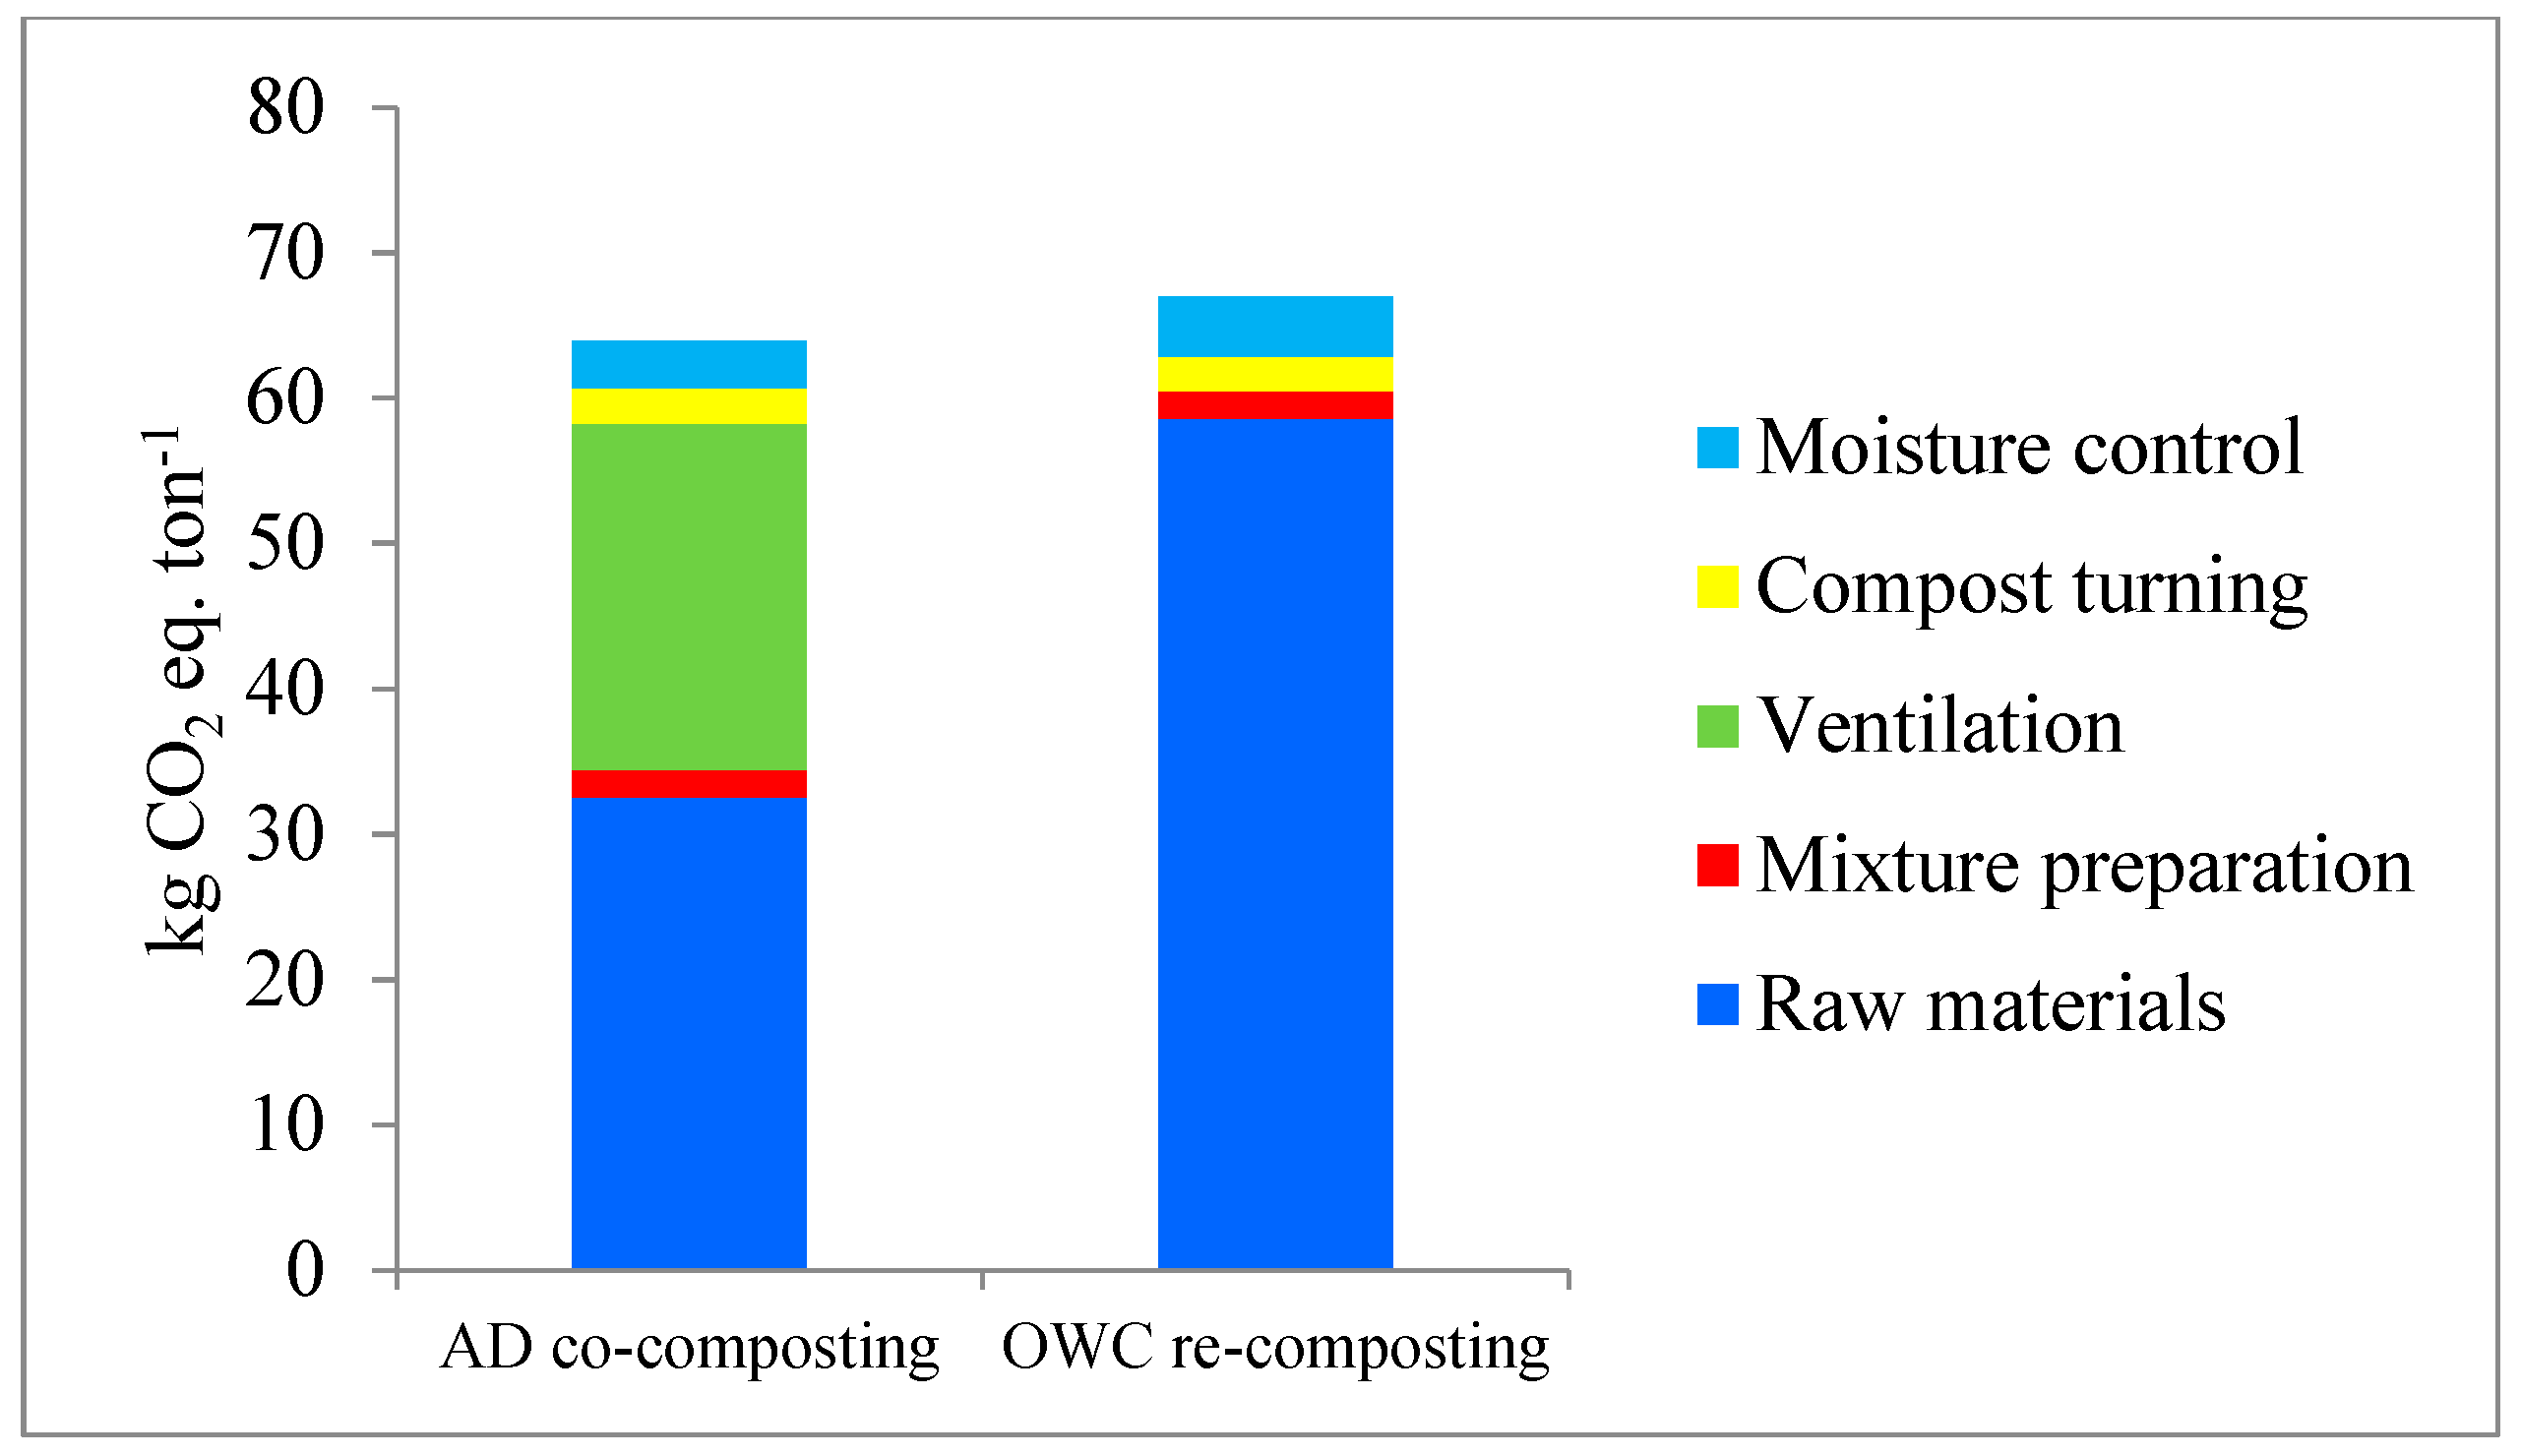
3.1. Co-Composting and Re-Composting Processes

Main changes due to co-composting and re-composting of the main chemical parameters of OWC and AD are reported in Table 4. The results evidence opposite trends for TOC, N and heavy metals (Cd, Cr, Cu, Ni, Pb, Zn) for both composts. An opposite trend for TOC and N concentrations vs heavy metal contents before and after the process for both the studied materials can be detected. In particular, TOC decreased by 17.8 and 23.5% for AD and OWC, respectively, whereas N decreased by 8.33% in both composting processes (no significant differences except TOC in OWC). Conversely, heavy metals content significantly increased between 82.8% of Cu and 95.8% of Ni in AD, and between 84.7% of Cd and 97.6% of Pb in OWC.

3.2. Environmental Sustainability Assessment

3.2.1. Composting Processes Analysis

Emissions of carbon dioxide during the composting processes for each of the two on-farm composts were estimated (Figure 2). The results illustrate that the total carbon emission associated with the AD on-farm co–composting process was 63.9 kg of CO2 eq t−1. The main factors that contributed to this result were the raw materials, that represent 50.9% of the total impact, and the emission associated to the energy use for the ventilation, that was the 37.2% of the total emissions (Figure 2). In particular, this last GHG emission was generated by the energy consumption of the compost aeration phase by the blower.
Higher values for the OWC re-composting were found, and the emission associated with the treatment process was 67 kg of CO2 eq t−1. Considering the estimated GHG emissions of each management operation, the raw materials showed the highest value (87.4%), followed by moisture control and compost turning.

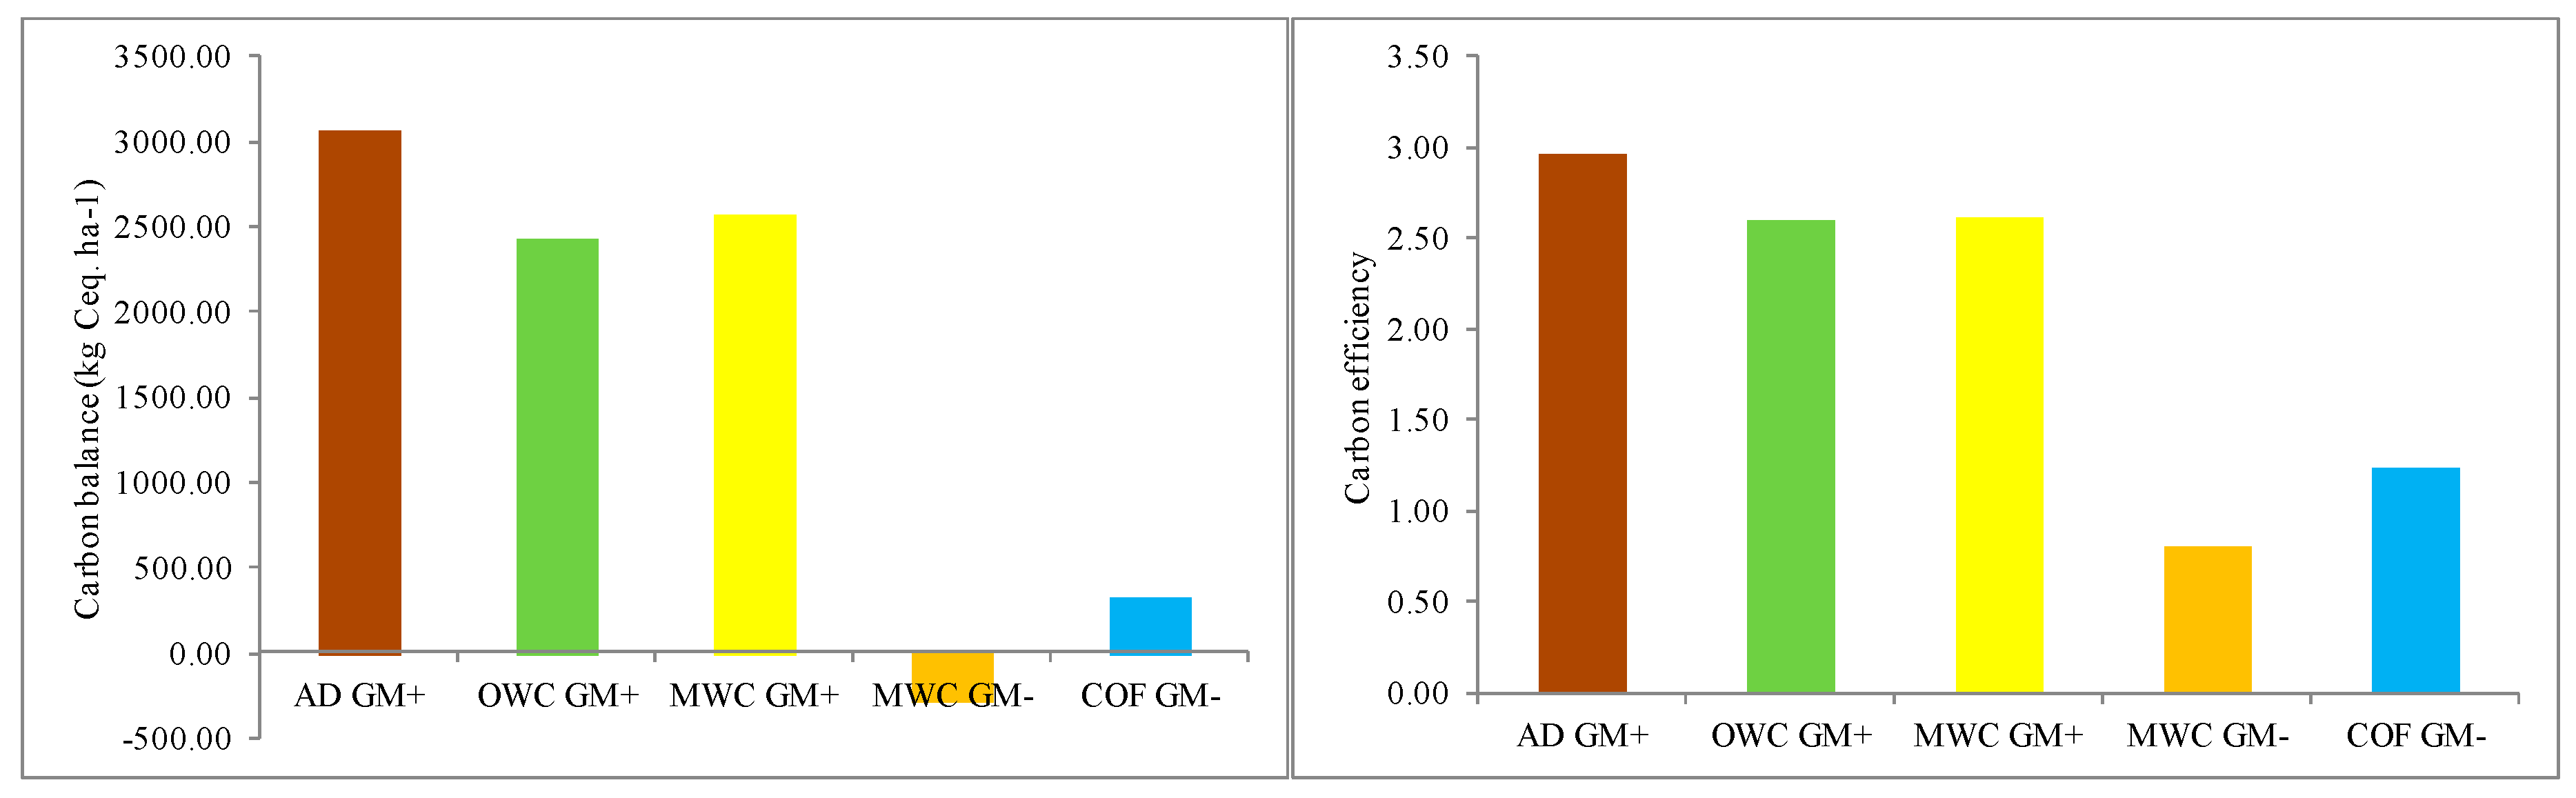
3.2.2. Cropping Cycle Analysis

Table 5 shows the CO2 emissions for zucchini and lettuce production. The total CO2 emission values for the two-crops cycle were the highest in COF GM− as compared to the other treatments, followed by MWC GM+ (−4% than COF GM−) and AD GM+ (−7% than COF GM−), whereas OWC GM+ showed the lowest emissions (−9% than COF GM−). On the average of all the five treatment combinations, the input that caused the highest CO2 emission was the water for irrigation (37.9%), followed by fertilizers (23.6%) and fuels (14.7%). The emission associated to the fertilizers varied across the treatments from 29.6% of COF GM− to 19.3% of OWC GM+. Furthermore, since no chemicals were used in both cropping cycles, they did not contribute to GHG emissions and, therefore, they are not reported in the table.
Among the different agricultural operations (Table 6), the highest value of total GHG emissions, as overall average, was found for irrigation (37.9%). Moreover, fertilization (24.4%) and irrigation system preparation (10.4%) showed high values.
The data on N2O-based CO2 emission from soils revealed that the sum of GWP from zucchini and lettuce cultivation was the highest in MWC GM+, followed by AD GM+ and OWC GM+ (Table 7). The 60.5% of the GWP derived from the direct emissions, while the 39.5% derived from the indirect emissions (leaching and volatilization). Moreover, the GWP related to GM− was −27% than the GM+ treatment.
The highest Carbon input was found in MWC GM+, which was higher by −3% and −5% than AD GM+ and OWC GM+, respectively (Table 8). The fertilization strategy influenced C output and AD GM+ had the highest value, followed by MWC GM+ and OWC GM+ (Table 8).
Carbon balance (CB) and carbon efficiency (CE) were higher in AD GM+, MWC GM+ and OWC GM+ compared to the other two treatments (Figure 3). The CB was positive in all the analyzed systems except MWC GM− that showed the lowest value (−276.17kg C ha−1).

3.3. Agronomic Performances

The energy output assessment highlighted similar performance for all the selected treatments (Table 9). Zucchini showed no significant differences among treatments, even if a reduction trend was determined for OWC GM+ and MWC GM−. Results showed a different behavior in lettuce, for which the treatments without green manure (MWC GM− and COF GM−) had a significant reduction compared to treatments in presence of green manure (OWC GM+ and MWC GM+). By analyzing the total energy output, the MWC GM− showed the lowest output compared to all the other treatments, while the same compost showed the highest (absolute) value in GM presence.

4. Discussion

4.1. Composting Findings

The characteristics of the materials after the composting processes confirm the compliance of their use in organic farming with the EU and Italian regulations (EU 889/2008 and 834/2009 and Italian Decree n. 217, 29/04/06). Since the raw materials that we have used in this research were chosen to accomplish different level of agro-ecological intensification, our findings indicated that it is possible to recycle particularly in organic agriculture different wastes, following the idea of “circular economy”, which is relevant at European level [4].
The changes in chemical parameters after the processes confirm other studies, in which the TOC value decrease was mainly related to the organic matter degradation [52,53]. Furthermore, after the co-/re-composting processes the C/N ratio decreased both in the AD and OWC composts reaching 10.3 and 19.2, respectively. This high difference of the two composts, due to the raw materials (11.8 and 21.4 of C/N before process for AD and OWC, respectively), could influence the mineralization rate and, consequently, the zucchini and lettuce energy outputs. The increase in heavy metal contents due to the co- and re-composting processes are in accordance with the literature and are probably due to the concentration effect, as a consequence of weight reduction as CO2 [54,55]. Our findings confirm the compliance of these materials after the process with the law limits for their application to the soil as fertilizers. However, the aerobic composting processes usually increase the complexation of heavy metals in organic waste, since metals are strongly bound to the compost matrix, thus limiting their solubility (and potential bioavailability to crops) in soil after application [56].

4.2. Environmental Sustainability Assessment

The results showed lower GHG emissions in the AD co-composting process than in OWC. The difference between treatments was due to emissions related to the raw materials as it was found in the literature [43,44,46,47]. Furthermore, Pampuro et al. [38] reported cumulative emission of GHG of about 120 and 60 kg CO2 eq. ton−1 for turned and not turned composting process of pig slurry solid fraction. These data are slightly higher than our emission values (Figure 2), due to the different raw materials considered. In AD co-composting, the most important factors affecting the CO2 emissions were the raw materials followed by the ventilation (compost aeration phase), which reached the 37% of the co-composting emissions. No considerable differences were found for the other variables. In the OWC re-composting process the 87% of the emissions were due to the raw materials collection while the moisture control and the compost turning phases accounted for the 6.2 and 3.6% of the total emissions, respectively. There are few data available on farm-composting in Europe, despite this technology has the advantage of saving transport costs and reducing emissions [47]. Conversely, there are different studies on composting processes for animal wastes and their GHG emissions, especially after soil application of these materials [38,57]. The amount of CO2 emissions associated to the composting process (excluding the materials collection phase) were comparable with the values in Pergola et al. [45]. This last study, that considered aerated composting technologies, showed that the emissions related to the composting processes were from 1.85 to 80.94 kg CO2 eq per ton of compost produced (the wide range of values is generated by the raw materials nature and humidity). In our study, the AD co-composting process (aerated composting technology) and OWC re-composting process (not aerated) emitted 31.4 and 8.4 kg CO2 per ton of compost, respectively.
The GHG analysis on the whole crop cycle reveals that GHG emitted for zucchini and lettuce productions were higher in COF GM−, followed by MWC GM+ and AD GM+, which is mainly due to the use of commercial fertilizers. In fact, despite of the same amount of N unit utilized, different GHG equivalent per unit of fertilizer should be considered. Emissions from manure and composts are lower compared to chemical and commercial fertilizers [47,58]. The analysis of the GHG input divided by agricultural operations, in agreement with other studies in the same environment [59], also revealed that the introduction of the cover crops as green manure implies more emissions as fuels and labor related to their sowing and termination operations. However, the impact of these operations is lower compared to the emissions related to the irrigation and fertilization [32]. As observed by Lal [48], identifying strategies to reduce water consumption and the use of commercial fertilizers is crucial to reduce the CO2 emissions. Thus, the use of irrigation methods such as the drip irrigation and the adoption of no tillage techniques with natural mulch to reduce the soil evaporation losses [60], should be considered by the farmers as good practices going towards a sustainable agriculture.
N2O emission from soils is one of the key GHG source in agriculture [35], and our study reveals that the GWP in the presence of manured cover crops was 28% higher than for GM− treatment. This GWP increase was generated by the direct and indirect N2O released in the biomass residues.
The carbon total input, that is sum of the carbon equivalent emissions from the processes and the N2O from the soil, was higher in the GM+ theses mostly because of the differences in the amount of N2O related to biomass residues. However, the carbon output, that is sum of the carbon in the production and the carbon in the cover crops and plants residues, was substantially higher in the GM+ theses. The carbon in the products was directly proportional to the yields. In agreement with what was observed in other studies [61,62], the carbon in the systems was strongly influenced by the presence of green manure. The data reveals that carbon balance was higher in GM+ theses and the AD GM+ was the most sustainable system. Although the carbon efficiency was higher in AD GM+, confirming an increase of the ecosystem C pool by raising the carbon outputs with the introduction of the cover crops and the organic fertilizers, exploiting the use efficiency of carbon input and decreasing losses are crucial for sustainable horticultural productions [32,35,48].

4.3. Agronomic Performances

Our findings highlighted similar results for all the selected treatments, pointing out the evidence that all the studied combinations of green manure and fertilizers are equivalent in terms of energetic output of the system. More specifically, in the zucchini crop the energy output (absolute value) of the AD GM+ treatment was comparable with COF GM−. This would indicate that the co-composted material could be a possible alternative to commercial organic amendment without reducing the energy output, at least in the short-time period. In lettuce crop, the opposite trend of energy output was found, and in particular the OWC GM+ and MWC GM+ showed the statistically significant highest values. This result was a consequence of the residual fertilization effects of these composts compared to commercial and AD treatments, probably due to the difference of mineralization rate (C/N ratio of the materials). Despite this, our results evidence a higher trend for combination of organic fertilizers with green manure. This is in accordance with several authors, underlying the role of cover crops in yield production, limiting possible risks of nitrogen immobilization or delayed release of nutrients, often associated to application of soil amendments (e.g., compost) as fertilizers [18,63]. The absence of differences among the combinations of organic fertilizer with green manure and the commercial organic one (COF) highlighted the feasibility of co-composted AD and re-composted OWC to substitute the standard system.

5. Conclusions

In a global climate change context and considering the increase of anthropogenic greenhouse gas emissions, the environmental sustainability of agricultural systems may be enhanced with increased carbon-based input use efficiency. Agro-industrial wastes and feedstock management through composting processes have the potential to generate GHG emissions due to the composting processes and materials transportation. However, these processes generate positive effects both directly, through the carbon sequestration, and indirectly due to the avoided impacts of waste disposal, improved soil quality and minimized soil loss.
The findings of this study revealed that horticultural systems, if well managed in organic farming following an agro-ecological approach (combining green manuring and biofertilizers use), can have considerable and positive effects on the control of GHG emissions, mainly due to a carbon sequestration potential. The holistic approach that considers not only the anthropogenic emissions but also the effect on the resources used in the systems and the outcome on the environment, represents the base for the implementation of environmental-friendly organic horticultural productions. Moreover, the results on the agronomic performances (total energy output) showed that the yield gaps between the theses with different level of agro-ecological intensification and the control thesis with COF may be negligible.

Author Contributions

Conceptualization, M.D., A.P., E.T., F.M. and C.C.; Collection and analysis of the data, A.P., E.T. and C.C.; writing—original draft preparation, M.D., A.P., E.T., F.M. and C.C; writing—review and editing, M.D.

Funding

This research was funded by the European Commission’s Horizon 2020 Research and Innovation Programme (2014–2020)—Sustainable techno-economic solutions for the agricultural value chain (AgroCycle), under Grant Agreement n. 690142.

Acknowledgments

The authors wish to acknowledge the work of Angelo Fiore, Rosalba Scazzarriello, Marco Favale, and Angelo Raffaele Quaranta for technical assistance and field management.

Conflicts of Interest

The authors declare no conflict of interest. The funders had no role in the design of the study; in the collection, analyses, or interpretation of data; in the writing of the manuscript, or in the decision to publish the results.

References

  1. Spiertz, J.H.J.; Ewert, F. Crop production and resource use to meet the growing demand for food, feed and fuel: Opportunities and constraints. NJAS Wagen. J. Life Sci. 2009, 56, 281–300. [Google Scholar] [CrossRef]
  2. Tomich, T.P.; Brodt, S.; Ferris, H.; Galt, R.; Horwath, W.R.; Kebreab, E.; Leveau, J.H.J.; Liptzin, D.; Lubell, M.; Merel, P.; et al. Agroecology: A review from a global-change perspective. Annu. Rev. Environ. Resour. 2011, 36, 193–222. [Google Scholar] [CrossRef]
  3. Mirabella, N.; Castellani, V.; Sala, S. Current options for the valorization of food manufacturing waste: A review. J. Clean. Prod. 2014, 65, 28–41. [Google Scholar] [CrossRef]
  4. European Commission. Closing the Loop—An. EU Action Plan for the Circular Economy; COM (2015) 614 Final; European Commission: Brussels, Belgium, 2015. [Google Scholar]
  5. Corrado, S.; Sala, S. Food waste accounting along global and European food supply chains: State of the art and outlook. Waste Manag. 2018, 79, 120–131. [Google Scholar] [CrossRef] [PubMed]
  6. Pavwelczyk, A. EU policy and legislation on recycling of organic wastes to agriculture. In Proceedings of the 12th International Congress International Society for Animal Hygiene, Warsaw, Poland, 4–8 September 2005; Volume 1. [Google Scholar]
  7. Kosseva, M.R. Processing of food wastes; Chapter 3. Adv. Food Nutr. Res. 2009, 58, 57–136. [Google Scholar]
  8. European Commission. Communication from the Commission to the European Parliament, the Council, the European Economic and Social Committee and the Committee of the Regions Innovating for Sustainable Growth: A Bio Economy for Europe; COM (2012) 60 Final; European Commission: Brussels, Belgium, 2012. [Google Scholar]
  9. European Commission. A Sustainable Bioeconomy for Europe: Strengthening the Connection between Economy, Society and the Environment. Updated Bioeconomy Strategy; Directorate-General for Research and Innovation Unit F—Bioeconomy: Brussels, Belgium, 2018; ISBN 978-92-79-94145-0. [Google Scholar] [CrossRef]
  10. Westerman, P.W.; Bicudo, J.R. Management considerations for organic waste use in agriculture. Bioresour. Technol. 2005, 96, 215–221. [Google Scholar] [CrossRef] [PubMed]
  11. Kasapidou, E.; Sossidou, E.; Mitlianga, P. Fruit and vegetable co-products as functional feed ingredients in farm animal nutrition for improved product quality. Agriculture 2015, 5, 1020–1034. [Google Scholar] [CrossRef]
  12. Toop, T.A.; Ward, S.; Oldfield, T.; Hull, M.; Kirby, M.E.; Theodorou, M.K. AgroCycle—Developing a circular economy in agriculture. Energy Proc. 2017, 123, 76–80. [Google Scholar] [CrossRef]
  13. Möller, K.; Müller, T. Effects of anaerobic digestion on digestate nutrient availability and crop growth: A review. Eng. Life Sci. 2012, 12, 242–257. [Google Scholar] [CrossRef]
  14. Hao, X.; Ben, W.T.; Nelson, V. Agronomic values of anaerobically digested cattle manure and the separated solids for barley forage production. Soil Sci. Soc. Am. J. 2016, 80, 1572–1584. [Google Scholar] [CrossRef]
  15. Torres-Climent, A.; Martin-Mata, J.; Marhuenda-Egea, F.; Moral, R.; Barber, X.; Perez-Murcia, M.D.; Paredes, C. Composting of the solid phase of digestate from biogas production: Optimization of the moisture, C/N ratio, and pH conditions. Commun. Soil Sci. Plant. Anal. 2015, 46, 197–207. [Google Scholar] [CrossRef]
  16. Oreopoulou, V.; Russ, W. Utilization of Byproducts and Treatment of Waste in the Food Industry; Springer: New York, NY, USA, 2007. [Google Scholar]
  17. Pampuro, N.; Caffaro, F.; Cavallo, E. Reuse of animal manure: A case study on stakeholders’ perceptions about pelletized compost in northwestern Italy. Sustainability 2018, 10, 2028. [Google Scholar] [CrossRef]
  18. Montemurro, F.; Ciaccia, C.; Leogrande, R.; Ceglie, F.; Diacono, M. Suitability of different organic amendments from agro-industrial wastes in organic lettuce crops. Nutr. Cycl. Agroecosyst. 2015, 102, 243–252. [Google Scholar] [CrossRef]
  19. Diacono, M.; Ferri, D.; Ciaccia, C.; Tittarelli, F.; Ceglie, F.; Verrastro, V.; Ventrella, D.; Vitti, C.; Montemurro, F. Bioassays and application of olive pomace compost on emmer: Effects on yield and soil properties in organic farming. Acta Agr. Scand. Sect. B Soil Plant Sci. 2012, 62, 510–518. [Google Scholar] [CrossRef]
  20. Altieri, R.; Esposito, A. Evaluation of the fertilizing effect of olive mill waste compost in short-term crops. Int. Biodeterior. Biodegrad. 2010, 64, 124–128. [Google Scholar] [CrossRef]
  21. Montemurro, F.; Vitti, C.; Diacono, M.; Canali, S.; Tittarelli, F.; Ferri, D. A three-year field anaerobic digestates application: Effects on fodder crops performance and soil properties. Fresen. Environ. Bull. 2010, 19, 2087–2093. [Google Scholar]
  22. Montemurro, F.; Tittarelli, F.; Lopedota, O.; Verrastro, V.; Diacono, M. Agronomic performance of experimental fertilizers on spinach (Spinacia oleracea L.) in organic farming. Nutr. Cycl. Agroecosyst. 2015, 102, 227–241. [Google Scholar] [CrossRef]
  23. Toscano, P.; Casacchia, T.; Diacono, M.; Montemurro, F. Composted olive mill by-products: Compost characterization and application on olive orchards. J. Agr. Sci. Tech. Iran 2013, 15, 627–638. [Google Scholar]
  24. Ciaccia, C.; Montemurro, F.; Campanelli, G.; Diacono, M.; Fiore, A.; Canali, S. Legume cover crop management and organic amendments application: Effects on organic zucchini performance and weed competition. Sci. Hortic. 2015, 185, 48–58. [Google Scholar] [CrossRef]
  25. Montemurro, F.; Fiore, A.; Campanelli, G.; Tittarelli, F.; Ledda, L.; Canali, S. Organic fertilization, green manure, and vetch mulch to improve organic zucchini yield and quality. HortScience 2013, 48, 1027–1033. [Google Scholar] [CrossRef]
  26. Vandermeersch, T.; Alvarenga, R.A.F.; Ragaert, P.; Dewulf, J. Environment sustainability assessment of food waste valorization options. Resour. Conserv. Recycl. 2014, 87, 57–64. [Google Scholar] [CrossRef]
  27. Mohammadi-Barsari, A.; Firouzi, S.; Aminpanah, H. Energy-use pattern and carbon footprint of rain-fed watermelon production in Iran. Inf. Process. Agric. 2016, 3, 69–75. [Google Scholar] [CrossRef] [Green Version]
  28. Wiedmann, T.; Minx, J. A definition of ‘carbon footprint’. In Ecological Economics Research Trends; Pertsova, C.C., Ed.; Nova Science Publisher, Inc.: New York, NY, USA, 2007; pp. 1–11. [Google Scholar]
  29. UNESCO-FAO. Bioclimatic Map of the Mediterranean Zone; NS162/III, 22A; UNESCO: Paris, France; FAO: Rome, Italy, 1963; p. 60. [Google Scholar]
  30. USDA-NRCS. Soil Survey Staff, Soil Taxonomy. A Basic System of Soil Classification for Making and Interpreting Soil Surveys; Agriculture Handbook 436; USDA-NRCS: Washington, DC, USA, 1999. [Google Scholar]
  31. LECO Corporation. Instruction Manual—CHN—600 Elemental Analyzer for Macro-Samples System; LECO Corporation: St. Joseph, MI, USA, 1987; p. 49085. [Google Scholar]
  32. Persiani, A.; Diacono, M.; Monteforte, A.; Montemurro, F. Agronomic performance, energy analysis and carbon balance comparing different fertilization strategies in horticulture under Mediterranean conditions. Env. Sci. Pollut. Res. 2019, 26, 19250–19260. [Google Scholar] [CrossRef] [PubMed]
  33. Ozkan, B.; Akcaoz, H.; Fert, C. Energy input–output analysis in Turkish agriculture. Renew. Energy 2004, 29, 39–51. [Google Scholar] [CrossRef]
  34. USDA. United States Department of Agriculture Agricultural Research Service National Nutrient. Database for Standard Reference Legacy Release 2019. Available online: https://ndb.nal.usda.gov/ndb/ (accessed on 11 July 2019).
  35. Pratibha, G.; Srinivas, I.; Rao, K.V.; Raju, B.M.K.; Thyagaraj, C.R.; Korwar, G.R.; Venkateswarlu, B.; Arun Shanker, K.; Deepak Choudhary, K.; Srinivas Rao, K.; et al. Impact of conservation agriculture practices on energy use efficiency and global warming potential in rainfed pigeonpea-castor systems. Eur. J. Agron. 2015, 66, 30–40. [Google Scholar] [CrossRef]
  36. Luske, B. Reduced GHG Emissions Due to Compost Production and Compost use in Egypt Comparing Two Scenarios: 2010–2016; LbD; Louis Bolk Instituut: Bunnik, The Netherlands, 2010; p. 30. [Google Scholar]
  37. Broun, S.; Kruger, C.; Subler, S. Greenhouse gas balance for composting operations. J. Env. Qual 2008, 37, 1396–1410. [Google Scholar] [CrossRef]
  38. Pampuro, N.; Dinuccio, E.; Balsari, P.; Cavallo, E. Evaluation of two composting strategies for making pig slurry solid fraction suitable for pelletizing. Atmos. Pollut. Res. 2016, 7, 288–293. [Google Scholar] [CrossRef]
  39. Intergovernmental Panel on Climate Change (IPCC). IPCC Guidelines for National Greenhouse Gas Inventories. Agriculture, Forestry and other Land Use; IPCC: Paris, France, 2006; Volume 4. [Google Scholar]
  40. Ozalp, A.; Yilmaz, S.; Ertekin, C.; Yilmaz, I. Energy analysis and emissions of greenhouse gases of pomegranate production in Antalya province of Turkey. Erwerbs-Obstbau 2018, 60, 321–329. [Google Scholar] [CrossRef]
  41. Dyer, J.A.; Desjardins, R.L. Simulated farm fieldwork, energy consumption and related greenhouse gas emissions in Canada. Biosyst. Eng. 2003, 85, 503–513. [Google Scholar] [CrossRef]
  42. Khoshnevisan, B.; Rafiee, S.; Omid, M.; Yousefi, M.; Movahedi, M. Modeling of energy consumption and GHG (greenhouse gas) emissions in wheat production in Esfahan province of Iran using artificial neural networks. Energy 2013, 52, 333–338. [Google Scholar] [CrossRef]
  43. Cadena, E.; Colón, J.; Artola, A.; Sánchez, A.; Font, X. Environmental impact of two aerobic composting technologies using life cycle assessment. Int. J. Life Cycle. Assess. 2009, 14, 401–410. [Google Scholar] [CrossRef] [Green Version]
  44. Fiore, A.; Lardo, E.; Montanaro, G.; Laterza, D.; Loiudice, C.; Berloco, T.; Dichio, B.; Xiloyannis, C. Mitigation of global warming impact of fresh fruit production through climate smart management. J. Clean Prod. 2018, 172, 3634–3643. [Google Scholar] [CrossRef]
  45. Pergola, M.; Persiani, A.; Palese, A.M.; Di Meo, V.; Pastore, V.; D’Adamo, C.; Celano, C. Composting: The way for a sustainable agriculture. Appl. Soil Ecol. 2018, 123, 744–750. [Google Scholar] [CrossRef]
  46. Møller, J.; Boldrin, A.; Christensen, T.H. Anaerobic digestion and digestate use: Accounting of greenhouse gases and global warming contribution. Waste Manag. Res. 2009, 27, 813–824. [Google Scholar] [CrossRef] [PubMed]
  47. Smith, A.; Brown, K.; Bates, J.; Ogilvie, S.; Rushton, K. Waste Management Options and Climate Change. Final Report to the European Commission; DG Environment, AEA Technology: Abingdon, UK, 2001; p. 224. [Google Scholar]
  48. Lal, R. Carbon emission from farm operations. Environ. Int. 2004, 30, 981–990. [Google Scholar] [CrossRef] [PubMed]
  49. Graefe, S.; Tapasco, J.; Gonzalez, A. Resource use and greenhouse gas emissions of eight tropical fruits species cultivated in Colombia. Fruits 2013, 68, 303–314. [Google Scholar] [CrossRef]
  50. Martinez-Mate, M.A.; Martin-Gorriz, B.; Martínez-Alvarez, V.; Soto-García, M.; Maestre-Valero, J.F. Hydroponic system and desalinated seawater as an alternative farm productive proposal in water scarcity areas: Energy and greenhouse gas emissions analysis of lettuce production in southeast Spain. J. Clean Prod. 2018, 172, 1298–1310. [Google Scholar] [CrossRef]
  51. Mosier, A.R. Nitrous oxide emissions from agricultural soils. In Proceedings of Methane and Nitrous Oxide—Methods of National Emissions Inventories and Options for Control; RIVM: Dordrecht, The Netherlands, 1994. [Google Scholar]
  52. Montemurro, F.; Diacono, M.; Vitti, C.; Debiase, G. Biodegradation of olive husk mixed with other agricultural wastes. Bioresour. Technol. 2009, 100, 2969–2974. [Google Scholar] [CrossRef]
  53. Paredes, C.; Bernal, M.P.; Cegarra, J.; Roig, A. Bio-degradation of olive mill wastewater sludge by its co-composting with agricultural wastes. Bioresour. Technol. 2002, 85, 1–8. [Google Scholar] [CrossRef]
  54. Zheng, G.D.; Gao, D.; Chen, T.B.; Luo, W. Stabilization of nickel and chromium in sewage sludge during aerobic composting. J. Hazard. Mater. 2007, 142, 216–221. [Google Scholar] [CrossRef]
  55. Tandy, S.; Healey, J.R.; Nason, M.A.; Williamson, J.C.; Jones, D.L. Heavy metal fractionation during the co-composting of biosolids, deinking paper fibre and green waste. Bioresour. Technol. 2009, 100, 4220–4226. [Google Scholar] [CrossRef] [PubMed]
  56. Smith, S.R. A critical review of the bioavailability and impacts of heavy metals in municipal solid waste composts compared to sewage sludge. Environ. Int. 2009, 35, 142–156. [Google Scholar] [CrossRef] [PubMed]
  57. Pampuro, N.; Busato, P.; Cavallo, E. Gaseous emission after soil application of pellet made from composted pig slurry solid fraction: Effect of application method and pellet diameter. Agriculture 2018, 8, 119. [Google Scholar] [CrossRef]
  58. Stout, B.A. Handbook of Energy for World Agriculture; Elsevier: New York, NY, USA, 1990. [Google Scholar]
  59. Diacono, M.; Persiani, A.; Canali, S.; Montemurro, F. Agronomic performance and sustainability indicators in organic tomato combining different agro-ecological practices. Nutr. Cycl. Agroecosyst. 2018, 112, 101–117. [Google Scholar] [CrossRef]
  60. Diacono, M.; Ciaccia, C.; Canali, S.; Fiore, A.; Montemurro, F. Assessment of agro-ecological service crop managements combined with organic fertilisation strategies in organic melon crop. Ital. J. Agron. 2018, 13, 951. [Google Scholar] [CrossRef]
  61. Mandal, B.; Majumder, B.; Bandyopadhyay, P.K.; Hazra, G.C.; Gangopadhyay, A.; Samantaray, R.N.; Mishra, A.K.; Chaudhury, J.; Saha, M.N.; Kundu, S. The potential of cropping systems and soil amendments forcarbon sequestration in soils under long-term experiments in sub-tropical India. Glob. Chang. Biol. 2007, 13, 357–369. [Google Scholar] [CrossRef]
  62. Lardo, E.; Fiore, A.; Quinto, G.A.; Dichio, B.; Xiloyannis, C. Climate change mitigation role of orchard agroecosystems: Case studies in Southern Italy. Acta Hortic. 2018, 1216, 13–18. [Google Scholar] [CrossRef]
  63. Diacono, M.; Montemurro, F. Long-term effects of organic amendments on soil fertility. A review. Agron. Sustain. Dev. 2010, 30, 401–422. [Google Scholar] [CrossRef] [Green Version]
Figure 1. Flowchart to describe the analyzed systems: the system boundaries of the composting processes and cultivation processes.
Sustainability 11 03824 g001
Figure 2. GHG emission values for AD and OWC composting processes divided by each treatment operation (kg CO2 eq t−1 compost produced).
Sustainability 11 03824 g002
Figure 3. Carbon balance (kg C eq ha−1) and carbon efficiency in the different analyzed systems.
Sustainability 11 03824 g003
Table 1. Total organic carbon (TOC) and Total nitrogen (N) content of the raw materials used for AD and OWC composting processes.
TOC (%)N (%)
Straw58.7 ± 1.2 10.1 ± 0.0
Grass clippings52.9 ± 0.21.7 ± 0.1
Organic vegetable wastes
Peppers52.7 ± 0.13.3 ± 0.2
Aubergines53.3 ± 1.32.5 ± 0.1
On-farm compost23.0 ± 3.21.9 ± 0.3
Municipal Waste Compost30.0 22.0
1 mean value and standard deviation; 2 commercial data.
Table 2. Greenhouse gases (GHG) coefficients (kg CO2 eq unit−1) of farm facilities for horticultural crops production.
InputsUnitGHG Coefficient
(kg CO2 eq./unit)
References
Human laborh0.36[40]
MachineryMJ0.071[41]
Electricity)kWh0.608[42]
Fuels
DieselL2.76[41]
Fertilizers
MWC/Industrial/ on farm Compostskg0.040–0.063[43,44,45]
Anaerobic digestate (AD) 0.031[46]
Nitrogen (N)kg5.29[47]
Phosphate (P2O5)kg0.52[47]
Potash (K2O)kg0.38[47]
Chemicals
Insecticideskg5.1[48]
Fungicideskg3.9[49]
Herbicideskg6.3[49]
Irrigation waterm30.27[40]
Plastic pipes PEkg2.2[50]
Table 3. Parameters and emission factors used in the calculation of greenhouse gas emissions.
FactorUnitCoefficientReference
Emission factor (EF)kg N2O-N kg−10.0125[39]
Leaching factor of N (FRACLeach)%0.3[39]
Volatilization of NH3 and NOx (FRACgas)%0.1[39]
Leaching emission factor (EFLeach)kg N2O-N kg−10.025[39]
Volatilization emission factor (EFvolat)kg N2O-N kg−10.01[39]
Table 4. Chemical parameter (dry weight) changes before and after the co-/re-composting processes of anaerobic digestate (AD) and olive wastes compost (OWC).
Pre-Processed MaterialsParameterBefore ProcessAfter ProcessP ValueΔ (%)
ADTOC (%)30.425.80.056−17.8
N (%)2.572.510.245-8.33
Cd (ppm)0.07 b 10.56 a0.000+87.1
Cr (ppm)0.43 b8.23 a0.000+94.8
Cu (ppm)1.85 b10.7 a0.000+82.8
Ni (ppm)0.11 b2.7 a0.000+95.8
Pb (ppm)0.31 b2.5 a0.000+87.9
Zn (ppm)13.1 b90.0 a0.000+85.4
OWCTOC (%)56.3 a45.6 b0.013-23.5
N (%)2.632.370.284-8.33
Cd (ppm)0.02 b0.16 a0.012+84.7
Cr (ppm)0.09 b2.59 a0.024+96.5
Cu (ppm)0.88 b11.9 a0.009+92.6
Ni (ppm)0.06 b1.97 a0.008+96.9
Pb (ppm)0.11 b4.56 a0.043+97.6
Zn (ppm)3.05 b40.3 a0.010+92.4
1 Mean values in each row followed by a different letter are significantly different according to p value ≤ 0.05.
Table 5. Greenhouse gases emissions of zucchini and lettuce productions divided by input categories (kg CO2 eq. ha−1 year−1). AD = co-composted anaerobic digestate; OWC = re-composted olive wastes compost; MWC = municipal solid waste compost; COF = commercial organic fertilizer; GM+ = green manure; GM− = no green manure.
AD GM+ OWC GM+ MWC GM+ MWC GM− COF GM−
Inputskg CO2 eq ha−1 year−1%kg CO2 eq ha−1 year−1%kg CO2 eq ha−1 year−1%kg CO2 eq ha−1 year−1%kg CO2 eq ha−1 year−1%
Human labor2046.51866.01966.01645.22116.2
Machinery2568.12568.32567.82297.32296.7
Fuels51416.350816.451115.540913.141312.1
Fertilizers64020.359819.377823.777824.9100729.6
Irrigation equipment33010.433010.733010.033010.63309.7
Water121538.5121539.3121537.0121538.9121535.7
Total emissions3159 3092 3285 3125 3405
Table 6. Greenhouse gases emissions of zucchini and lettuce productions divided by crop operation (kg CO2 eq. ha−1 year−1). AD = co-composted anaerobic digestate; OWC = re-composted olive wastes compost; MWC = municipal solid waste compost; COF = commercial organic fertilizer; GM+ = green manure; GM− = no green manure.
Crop OperationsAD GM+OWC GM+MWC GM+MWC GM−COF GM−
kg CO2 eq. ha−1 year−1%kg CO2 eq. ha−1 year−1%kg CO2 eq. ha−1 year−1%kg CO2 eq. ha−1 year−1%kg CO2 eq. ha−1 year−1%
Tillage611.9612611.9822.6822.4
Harrowing/seedbed preparation3049.6304103049.33049.73048.9
Irrigation systems preparation33310.53331133310.133310.63339.8
Fertilization67021.26282080824.680825.9102530.1
Irrigation121638.5121639121637.0121638.9121635.7
Planting/sowing722.3722722.2301.0300.9
Weeds control481.5482481.5481.5481.4
Biomass chopping2006.320062006.11003.21002.9
Harvest2548.022972427.42046.52677.8
Table 7. Direct and indirect CO2 equivalent (kgCO2 eq. ha−1) emission derived from N2O.
N2O Based CO2 eq. EmissionsAD GM+OWC GM+MWC GM+MWC GM−COF GM−
kg CO2 eq. ha−1 year−1kg CO2 eq. ha−1 year−1kg CO2 eq. ha−1 year−1kg CO2 eq. ha−1 year−1kg CO2 eq. ha−1 year−1
Direct emissions15551511157110631150
Indirect emissions10069791016711763
Leaching emission933906942638690
Volatilization emission7373737373
Total GWP25612490258617741914
Table 8. Carbon input (kg C eq. ha−1) and output (kg C eq. ha−1) in the different analyzed systems. AD = co-composted anaerobic digestate; OWC = re- composted olive wastes compost; MWC = municipal solid waste compost; COF = commercial organic fertilizer; GM+ = green manure; GM− = no green manure.
ParametersAD GM+OWC GM+MWC GM+MWC GM−COF GM−
Carbon input (CI)15601522160113361450
carbon eq. during crop cultivation operations 861.5843.3895.9852.3928.5
carbon eq. N2O698.5679.1705.3483.9521.9
Carbon output (CO)46203945417410601780
carbon in the products122911571152657.71213
carbon in the green manure and residues339127883021402.3567.1
Table 9. Field energy output. AD = co-composted anaerobic digestate; OWC = re-composted olive wastes compost; MWC = municipal solid waste compost; COF = commercial organic fertilizer; GM+ = green manure; GM− = no green manure.
Energy Output (MJ ha−1)
TreatmentZucchiniLettuceTotal
MeanSt. devMeanSt. devMeanSt. dev
AD GM+11,4264960.119,800 ab 14794.831,226 a9544.9
OWC GM+8726.71925.621,633 a3978.830,360 a4546.5
MWC GM+10,1552658.522,000 a1983.132,155 a3374.0
MWC GM−6016.5241311,183 b3127.417,199 b725.7
COF GM−12,7576862.619,066 b7487.531,823 a9957.8
Level of significancen.s.**
Note: n.s., not significant at the probability level p > 0.05. 1 Mean values in each column followed by a different letter are significantly different according to p value ≤ 0.05.

