Article

Potential Indicators of Soil Health Degradation in Different Land Use-Based Ecosystems in the Shiwaliks of Northwestern India

1
Department of Soil Science, Punjab Agricultural University, Ludhiana 141004, India
2
Department of Natural Resources and Environmental Design, North Carolina A&T State University, Greensboro, NC 27411, USA
3
Kellogg Biological Station, Michigan State University, Hickory Corners, MI 49060, USA
*
Author to whom correspondence should be addressed.
Sustainability 2019, 11(14), 3908; https://0-doi-org.brum.beds.ac.uk/10.3390/su11143908
Submission received: 30 May 2019 / Revised: 15 July 2019 / Accepted: 15 July 2019 / Published: 18 July 2019

Abstract

:
Identifying the importance of soil biology in different land use systems is critical to assess the present conditions of declining soil (C) and global land degradation while regulating soil health and biogeochemical nutrient cycling. A study was undertaken in a mixed watershed comprising of different land use systems (agricultural, grassland, agroforestry, and eroded); situated in the Shiwalik region in the foot hills of the lower Himalayas in India, a fragile ecosystem susceptible to land degradation. Soil samples from 0–15 and 15–30 cm depths were collected from these land use systems and analyzed for a suite of different soil health indicators, including physio-chemical soil properties, aggregate stability, soil microflora, and the enzymatic activities that are critical for nutrient cycling. Principal component analysis was used to group different land uses and understand their association with soil microflora, enzyme activities, and soil physio-chemical properties. We found that a greater number of soil microflora and enzymatic activities were associated with grassland and agroforestry land use systems. Aggregate-associated soil C correlated well with the soil microflora under different land use systems studied. The biplots revealed that the fungal:bacterial ratio (2 × 10³–0.1 × 10³) was a robust indicator of C accumulation and soil health, and was in greater association with the agroforestry land use system. Random forest, a non-parametric statistical test, on average explained that 68% to 92% of the variability in soil microbial population was due to land use and other soil health properties. Overall, the biological soil health indicators used in this study demonstrated the fact that land use management systems that employ constant crop cover with minimal disturbance have the potential to improve soil sustainability and ecological functioning.

1. Introduction

Human-induced land and environmental degradation has been a major global issue during the twentieth century, and is of high priority in the twenty-first century as well [1,2]. Land degradation due to improper soil management, removal of organic matter from land without replenishing it back through crop cover, intensive tillage, soil erosion, atmospheric pollution, and desertification, has resulted in deterioration of soil health, a fundamental component of ecological sustainability [3]. Soil health is defined as the capacity of soil to promote biological productivity and maintain environmental quality [4]. Soil health indicators are measurable soil properties which are useful in defining the status of soil over a range of ecological situations reflecting the influence of soil management now and in the future. However, it has always been a challenge for land managers to propose a set of effective, desirable, and sensitive soil health indicators due to the wide range over which these indicators vary in magnitude and importance. Effective soil health indicators should relate to major ecosystem functions like nutrient cycling (e.g., C and nitrogen (N) cycle) in the field under a specific land use management system. Biological soil health indicators are biological properties or processes within the soil component of an ecosystem that reflect the normality of function of ecosystems. Although they vary at several spatial and temporal scales, biological soil health indicators are worth examining in relation to the key driving variables and knowledge of soil processes due to change in management [5].
Healthy soils are responsible for providing a good habitat for microorganisms that play a vital role in biogeochemical cycling of plant nutrients and preventing it from erosion and loss of soil organic matter [5,6,7,8]. Soil acts as the largest terrestrial C pool and land use is a vital component that determines the soil organic carbon (SOC) storage and aggregate stability [1,9,10]. Soil organic C is a biological indicator of soil health and it harbors diverse organisms contributing to ecosystem functions [6,7,8,11]. Soil microorganisms play a key role in determining the structure and function of an ecosystem but their use as reliable indicators are often criticized because of being too dynamic and too dependent on the levels of resolution. Land management practices influence soil microbial diversity and the other abiotic environmental conditions or driving variables, which in turn regulate critical ecosystem functions like soil organic matter and nutrient dynamics [3]. Agricultural intensification without sustainable management practices, like cover cropping and reduced tillage, along with the conversion of natural forests and grasslands to cultivated lands have led to increased rates of soil organic matter mineralization resulting in poor soil health [12]. Although these land use conversions are necessary in order to feed the growing population, a robust set of biological soil health indicators that are sensitive to such changes and reflect the biological functional in these systems need to be addressed. Enzymes catalyze biochemical reactions in soil and are considered as integrative process-level indicators of soil microbial nutrient cycling and biological soil health [13,14,15,16]. For example, dehydrogenase activity is an indicator of oxidative metabolism and thus of the microbial activity in soils [17]. Furthermore, rapid assessment of soil enzymes can be done easily by soil testing laboratories at a low cost [18], and they often correlate very well with microbial diversity and soil properties [18,19]. More efforts to use these biological indicators as a tool to monitor soil health degradation and ecosystem functioning under different land uses and management practices should be reported.
Soil erosion due to improper land management or land use changes is considered to outrank among the various reasons for soil health degradation in many parts of the world including India [9]. The fragile ecosystems of the Shiwalik region, situated in the foothills of lower Himalayas and extending over a length of 2400 km along northwestern India, face serious problems of soil erosion primarily due to deforestation, incompatible land use changes, and soil fertility decline [20,21]. The SOC and aggregate stability have been reported to vary as a function of land use in northwestern India and has been declining due to lack of proper soil management practices [9,22,23,24]. A detailed understanding of soil health indicators that include prevailing microfloral communities, enzyme activities in conjunction with physio-chemical properties, and to a wide range of land use management practices is currently missing but critical to the identification of a biologically healthy soil ecosystem in the region. We hypothesize that biological soil attributes could be used as sensitive indicators of soil health due to its potential to differentiate the effect of different land use systems on soil nutrient cycling and ecological functions. The objective of this study is to decipher the respective soil microfloral composition, enzymatic activities, and their association with soil physio-chemical properties, with respect to land use and soil depth. The overall goal is to use these potential soil health indicators as a quick tool to assess the biological functioning of a land use system leading towards improvement of soil ecosystem services.

2. Materials and Methods

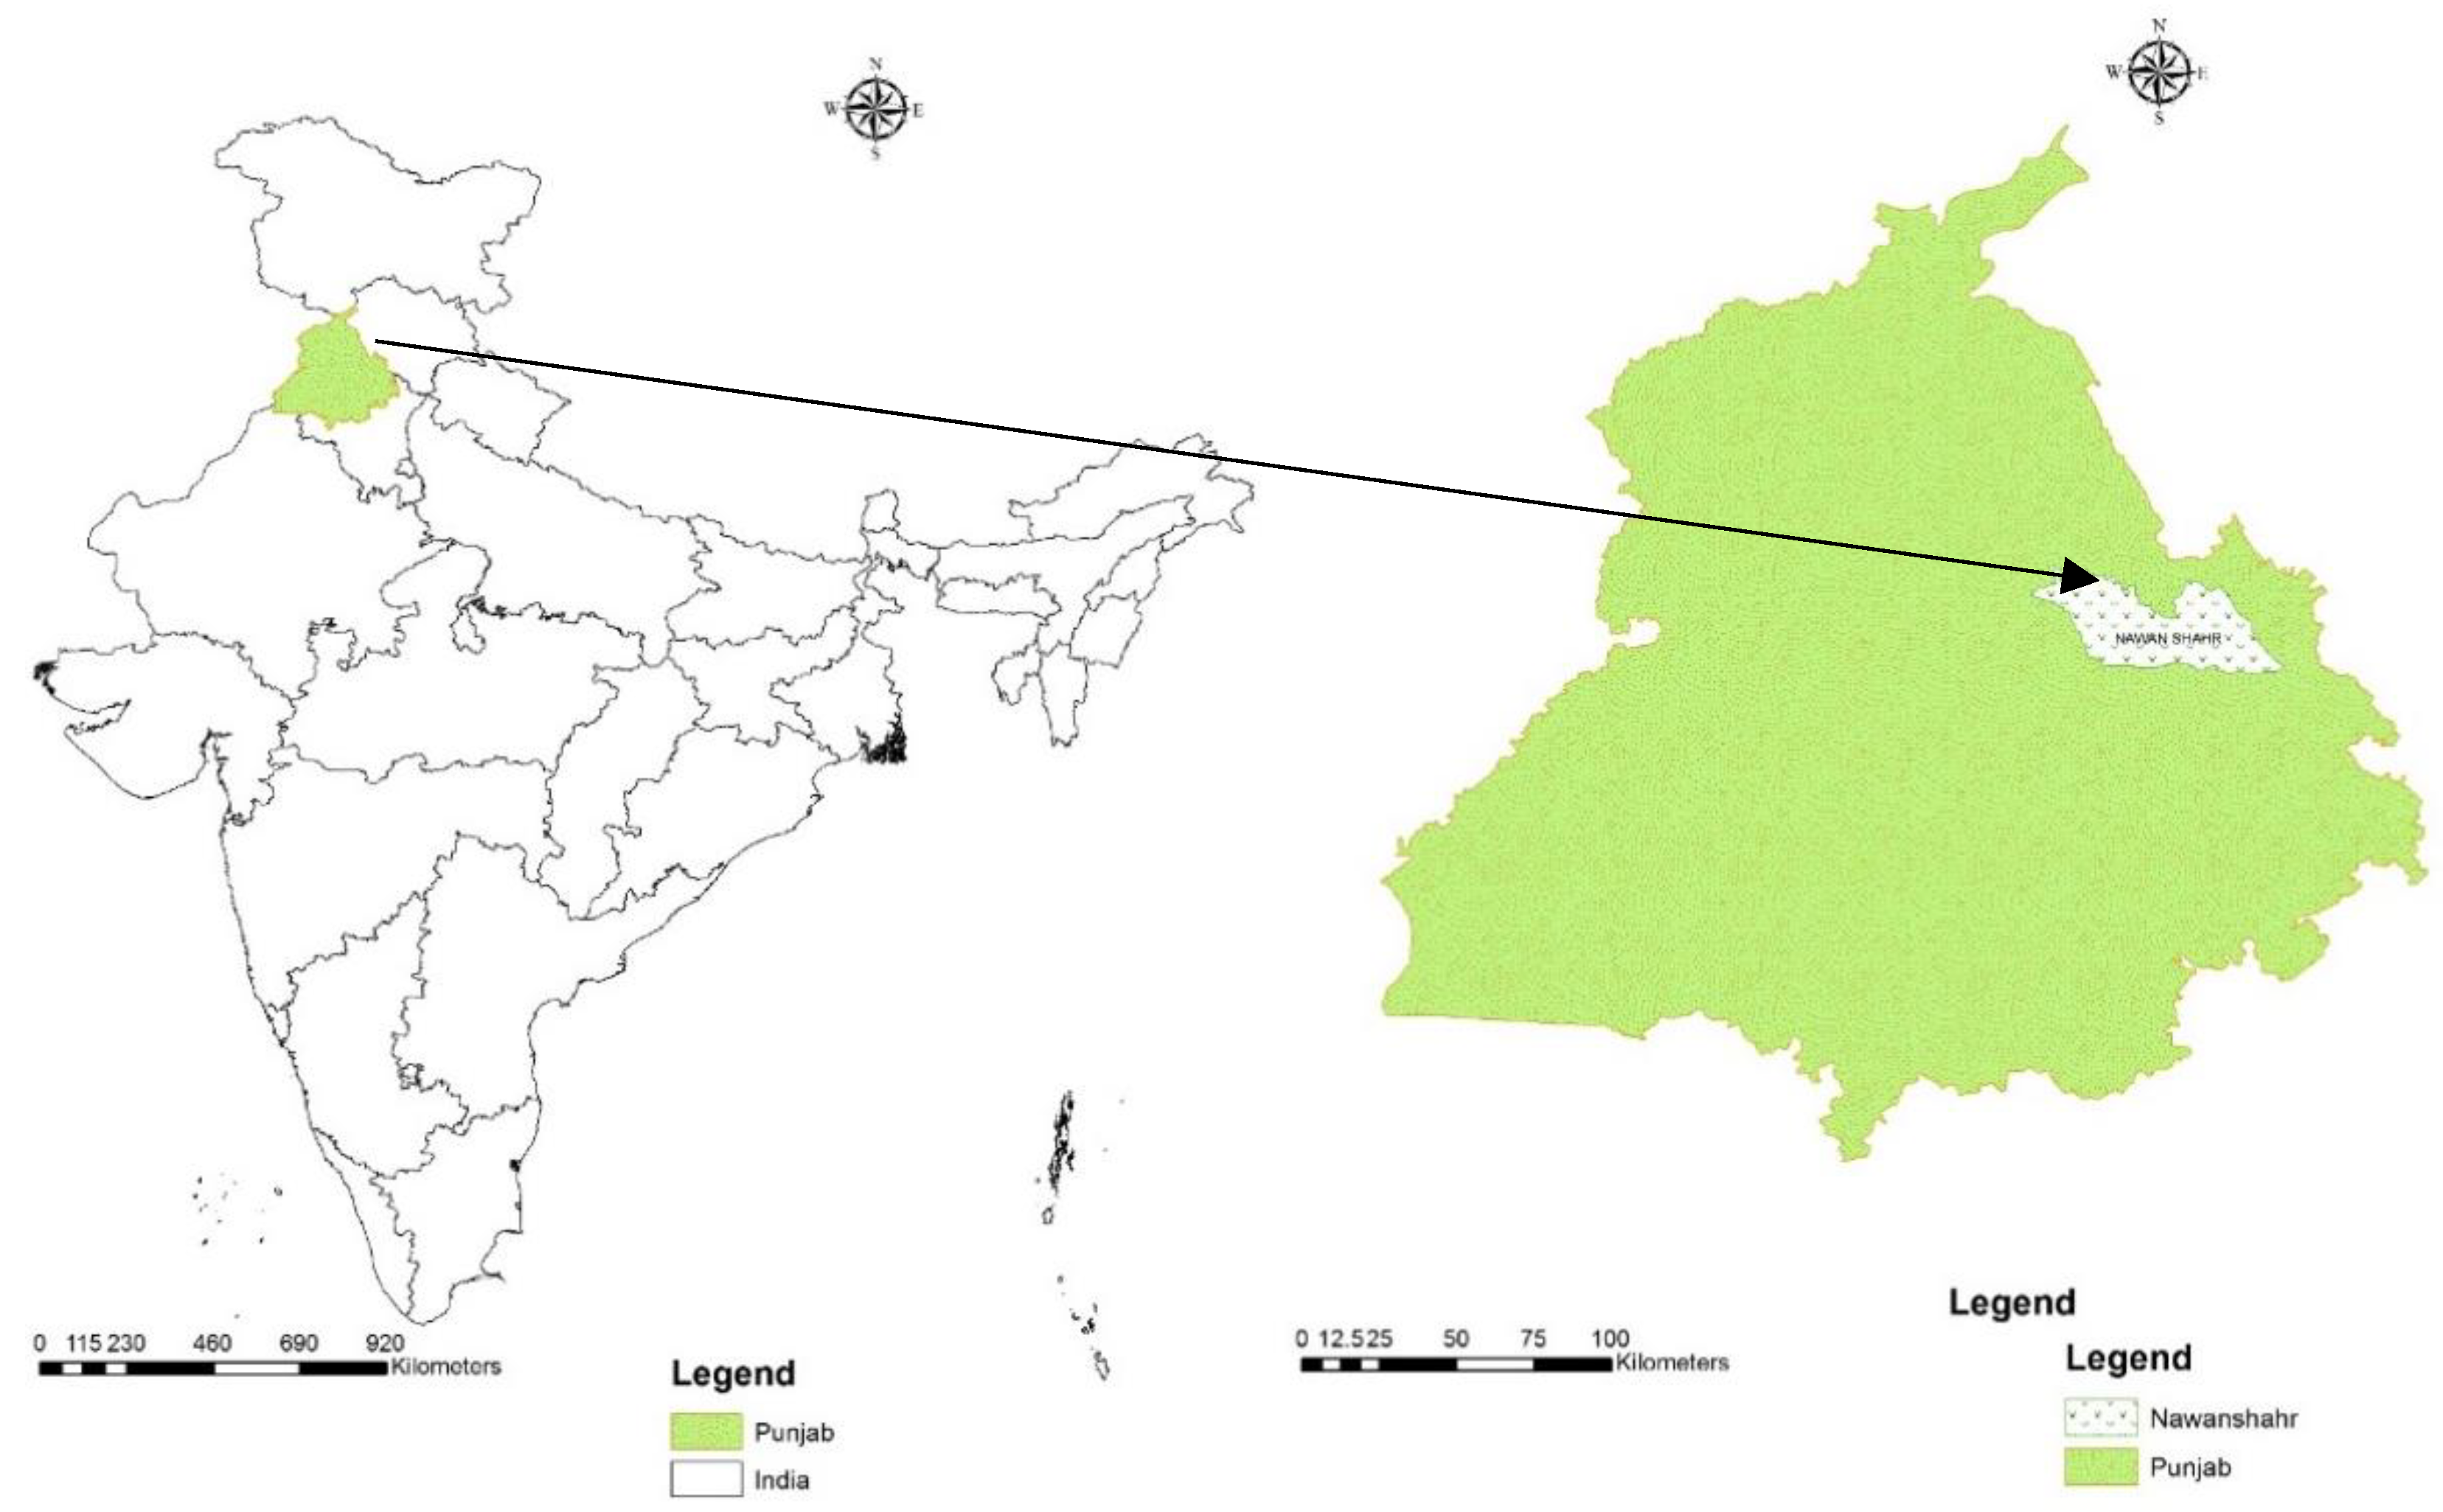
2.1. Study Site Description, Soil Sampling, and Basic Properties

This study was conducted in a watershed with differing soil uses (district Nawanshahr of Indian Punjab) located in the foothills of lower Shiwaliks in lower Himalayas of northwestern India (latitudes of 30°48′45′′ and 31°16′15′′ and longitudes of 75°46′00′′ and 76°26′30′′) (Figure 1). It is situated at an altitude of 330 m above the mean sea level and has an average rainfall of 700 mm. Most of the rainfall (about 80%) is received during the months of July to September. The region experiences a tropical steppe, hot, and semi-arid type of climate. The Shiwalik deposits are mainly comprised alluvial detritus of inner mountain ranges by rivers and seasonal streams and are prone to soil-water erosion [9]. The Shiwaliks, because of its close proximity to the plains, experience great biotic pressure from human and animals, resulting in land denudation due to continuous deforestation and overgrazing. Even today, the soil profiles are constantly being modified due to the erosion of sediments from the hilly portions and their deposition on the foot and toe slopes. The soils of this area are represented by the great group of Haplustepts.
Bulk and aggregate soil samples were collected from 0–15 and 15–30 cm soil depths, during early spring in 2012, from the mini-watershed (~40 ha) that comprised four distinct land use systems distributed in the form of agricultural (49%), agroforestry (14%), grassland (15%), and eroded lands (22%). The agricultural or cultivated arable lands were intensively tilled before growing pearl millet (Pennisetum glaucum) during the kharif (summer, rainy) season and occasionally wheat (Triticum aestivum L) or left barren during the rabi (winter) season. Cover cropping was not practiced in this region and; therefore, almost negligible residue was returned to the soil. The agricultural land use was located on 0.5%­–2% slope steepness towards the toe position of the watershed. During soil sample collection for this study, the agricultural land use did not have any crop cover. The agroforestry system with a slope steepness ranging from 5%–8% consisted of Sangwan (Tectona grandis) trees with pearl millet. The trees were planted at a row to row and plant to plant distance of 13 m. The grasslands were mainly dominated by lantana (Lantana camara) grass and had sparsely distributed Erythrophleum suaveolens and Acacia arabica trees with a slope steepness between 3%–5%. In the grassland soils, the samples were collected after clearing the surface litter. The eroded lands were previously under forest lands until severe deforestation occurred in the lower Shiwaliks. The eroded lands had a slope steepness of 8%–10%, with sparsely distributed small herbs and grasses in some depressions, and suffered from the menace of soil erosion by water and had top layer eroded at some places and deposited sediments at other. The samples from eroded soils were collected from the sites of visible erosion features (i.e., the bottom and sides of the rill and gully erosion areas.
Three locations were selected from each land use based on similar texture and topography for soil sampling. Ten soil samples were randomly sampled to make a composite sample from each of the three locations for a particular land use and soil depth (0–15 and 15–30 cm) using a tilling spade with a blade dimension of 7 cm wide × 20 cm deep. The spade was carefully sterilized using 90% ethanol solution for sampling between land uses. The soil clods were immediately transported to the laboratory where they were allowed to fall freely from waist height of 90–100 cm on a sterile collecting mat placed on a grassy surface to break at points of natural cleavage. They were then passed through an 8 mm sieve and the portion of soil that retained in a 4 mm sieve was used. The 4–8 mm soil from the 10 random samples per land use was then mixed thoroughly to provide a fresh composite soil sample. Half of the fresh composite soil sample was passed through a 2 mm sieve and immediately stored at –20 °C to conduct inorganic N, microbial, and enzymatic analysis. The rest of the 4–8 mm soil sample was air dried and kept separately to conduct aggregate stability analysis by wet sieving.
Soil bulk density was measured in situ using metallic cores with an internal diameter of 7 cm and depth of 4.5 cm by the method described by [25]. Inorganic N (ammonium and nitrate-N) was extracted from 10 g (field moist soil) with 100 mL of 2 M KCl solution. The available phosphorus (P) was determined by Olsen’s extraction method [26]. The size distribution of aggregates was measured by wet sieving method [27] using a nest of sieves of 2, 0.25 mm diameter and a pan. The amount of soil material retained on each sieve after sand correction was oven-dried at 105 °C for 24 h and expressed as percentage of aggregates for a particular size class. The data was analyzed to compute percent water stable aggregates of different sizes [28] and mean weight diameter [29] of the sample. The oven-dried (at 50 °C) soil aggregates of different sizes were ground with a wooden pestle and mortar to < 0.25 mm size and aggregate-associated C was determined by Walkley and Black’s chromic acid wet oxidation method [30].

2.2. Enzyme Assay

Soil dehydrogenase activity was assayed as described by [31]. Briefly 1 g of field moist soil sieved to 2 mm was weighed in a screw capped sterile centrifuge tube of 15 ml volume. Thereafter, 0.2 ml of 2,3,5-triphenyltetrazolium chloride and 0.5 ml of 1% glucose were added to it before incubating it at 35 °C for 24 h. After the incubation period, 10 ml of methanol was added to the tube and mixed thoroughly for 1 min and kept at 4 °C for 3 h. The production of triphenyl formazan was determined colorimetrically at an absorbance of 485 nm.
The acid and alkaline phosphatase was estimated based on the colorimetric estimation of the p-nitrophenol released by phosphatase activity during soil incubation with buffered sodium p-nitrophenyl phosphate solution (pH 5.4 for acid phosphatases and pH 9.2 for alkaline phosphatase) [32]. One gram of field moist soil (2 mm) was added to 0.2 ml of toluene, 4 ml of p-nitrophenyl phosphate solution prepared in acetate (pH 5.4 for assay acid phosphatase) and borax-NaOH buffer (pH 9.2 for assay of alkaline phosphatase) in a 15-ml capacity screw cap centrifuge tube and incubated at 35 °C. After 1 h of incubation, 1 ml of 0.5 M CaCl2 and 4 ml of 0.5 M NaOH was added and the filtrate through a Whatman No. 42 filter paper was analyzed spectrophotometrically at 420 nm wavelength.

2.3. Culturable Soil Microbial Count

The culturable soil microbial counts were estimated by the colony forming units (cfu) of aerobic bacteria using nutrient agar, fungi using Potato dextrose agar, facultative and strictly anaerobic cellulosic bacteria using cellulosic agar, filamentous bacteria (i.e., Actinobacteria) using Martin’s Rose Bengal agar, differential bacterial groups including tricalcium phosphate-solubilizing bacteria using Pikovskya agar, plant growth promoting fluorescent Pseudomonas using King’s B agar, diazotrophs like Azotobacter using Jensen’s agar, and Rhizobium and Agrobacterium using Nitrogen free agar (congo-red supplemented). Serial dilutions of the soil sample were prepared in 0.85% normal saline. The detailed methods for culturing and counting the microorganisms were adapted from [33]. Briefly, the flasks containing suspension were set on a rotary shaker for 5 min at 140 rpm at room temperature for proper mixing. Later the flasks were placed on a sampling bench top and soil particles were allowed to decant by keeping the flasks undisturbed for at least 30 to 40 min. The dilution series of the clear decanted suspensions were prepared in phosphate buffer saline (pH = 7.2) and spread plated on eight differential agar-based media to support the growth of different groups of microorganisms. The viable cell counts of different groups were estimated as the number of cfu of the microorganisms per gram of dry soil on different media after 24 and 120 h of incubation at 27 ± 2°C for nutrient agar and other differential media, respectively.

2.4. Statistical Analysis

The means were compared for significant differences by least significant difference (LSD) at 5% level of significance by analysis of variance (ANOVA) using completely randomized design. A combination of parametric and non-parametric statistics to understand the impact of land use on soil microbial parameters. The R statistical software (R 3.3.2; R Core Team) was used for all statistical analysis. We used biplots that use points to represent the score of the land uses on the principle component analysis (PCA) and vectors that represent the coefficient of the microbial parameters (soil microflora and enzyme activities) on the principle components. The observations that are in proximity have similar scores on the components displayed in the plot. The vectors pointing away from the origin represent the measured variables. The vectors in the same direction indicate the soil variables that have similar response profiles.
The R random Forest package [34,35] was used to perform random forest analysis to identify which variables best explain the observed variation in different soil microorganisms with respect to different land use. We used the following control parameters for random forest model: seed = 1000 (to set random number), ntree = 500 (number of trees used to grow the model), and mtry = 3 (number of variables considered at each split). The random forest was applied on the pooled data from the surface (0–15 cm) and subsurface (15–30 cm) soil. The independent variables used for random forest were: land use, moisture content, aggregate-associated carbon, dehydrogenase, acid phosphatase, and alkaline phosphatase activity. The function varImpPlot was used to plot the variable importance.

3. Results

3.1. Soil Physio-Chemical Properties and Microfloral Composition as Potential Indicators of Soil Health

The basic soil physio-chemical properties are provided in Table 1. The soil pH and EC ranged from 6.61–7.62 and 0.56–0.64 dS m−1 among the various land use systems and soil depths. The aggregate-associated C was highest in the 0–15 and 15–30 cm soil depth from the agroforestry land use system and lowest in the eroded lands. In the 0–15 cm soil depth, the water stable macro-aggregates > 2 mm was highest in grassland soils, followed by agroforestry, agricultural and eroded lands. However, agroforestry land use system had the highest 15–30 cm water stable macro-aggregates >2 mm. The micro-aggregates > 2 mm were higher in agricultural and eroded lands as compared to agroforestry and grasslands. The mean weight diameter, which is widely used as a soil health indicator of soil physical stability, was higher in agroforestry and grasslands as compared to agricultural and eroded lands. The viable bacterial cell counts in the surface soil (0–15 cm) was significantly (p < 0.05) higher (18 × 106 cfu g−1 soil) in grassland soils, followed by eroded (12 × 106 cfu g−1 soil), agriculture (8 × 10⁶ cfu g−1 soil), and lowest in agroforestry (5 × 10⁶ cfu g−1 soil) soils (Table 2). However, the fungal counts in the agroforestry soils were five times higher than that in the grassland and eroded soils and 1.4 times higher than the agricultural soils. The Actinobacteria counts in the agricultural soils were remarkably higher by 23, 116, and 233 times than the grassland, eroded, and agroforestry soils, respectively. On the other hand, the anaerobic microorganism counts followed the trend: grassland (10.6 × 10⁴ g−1 soil) > agriculture (3.9 × 10⁴ g−1 soil) > agroforestry (2 × 10⁴ g−1 soil) > eroded soils (0.8 × 10⁴ g−1 soil). In the subsurface (15–30 cm) soil depth, the Actinobacteria counts in the grassland and eroded soils were significantly higher as compared to the agroforestry and agricultural soils. The anaerobic microbial viable cell count was 11, 15, and 23 times higher in the agricultural soils than that in the grassland, eroded, and agroforestry soils, respectively.

3.2. Soil Bacterial Composition in Different Land Use Systems and Soil Depths

The average tricalcium phosphate-solubilizing bacterial counts were significantly (p < 0.05) higher in both the surface and subsurface soil depths of the agroforestry and eroded than the grassland and agricultural land use systems (Table 3). The average fluorescent Pseudomonas counts were in the order of agroforestry (40 × 104 g−1 soil) > grassland (14 × 104 g−1 soil) > agriculture (7 × 10⁴ g−1 soil) > eroded soils (2 × 10⁴ g−1 soil). However, these differences were narrowed in the subsurface soil depth. The 0–15 cm soil depth in both grassland and agroforestry land use systems exhibited significantly higher Azotobacter populations as compared to other land use systems. The Azotobacter populations decreased in the subsurface of grassland and eroded lands. However, a remarkable increase was observed in soils from agroforestry and agricultural land use systems. The symbiotic diazotroph counts were estimated based on congo-red dye uptake. In general, the mean counts of congo-red dye stained bacterial colonies (Agrobacterium) were higher than the bacterial colonies that did not take up the dye (Rhizobium). A higher Rhizobium population was observed in surface soils from grassland, whereas it was significantly higher in the subsurface soils from the agroforestry land use system. However, soils from grassland dominated in Agrobacterium population over other land uses in both surface and subsurface soil depths.

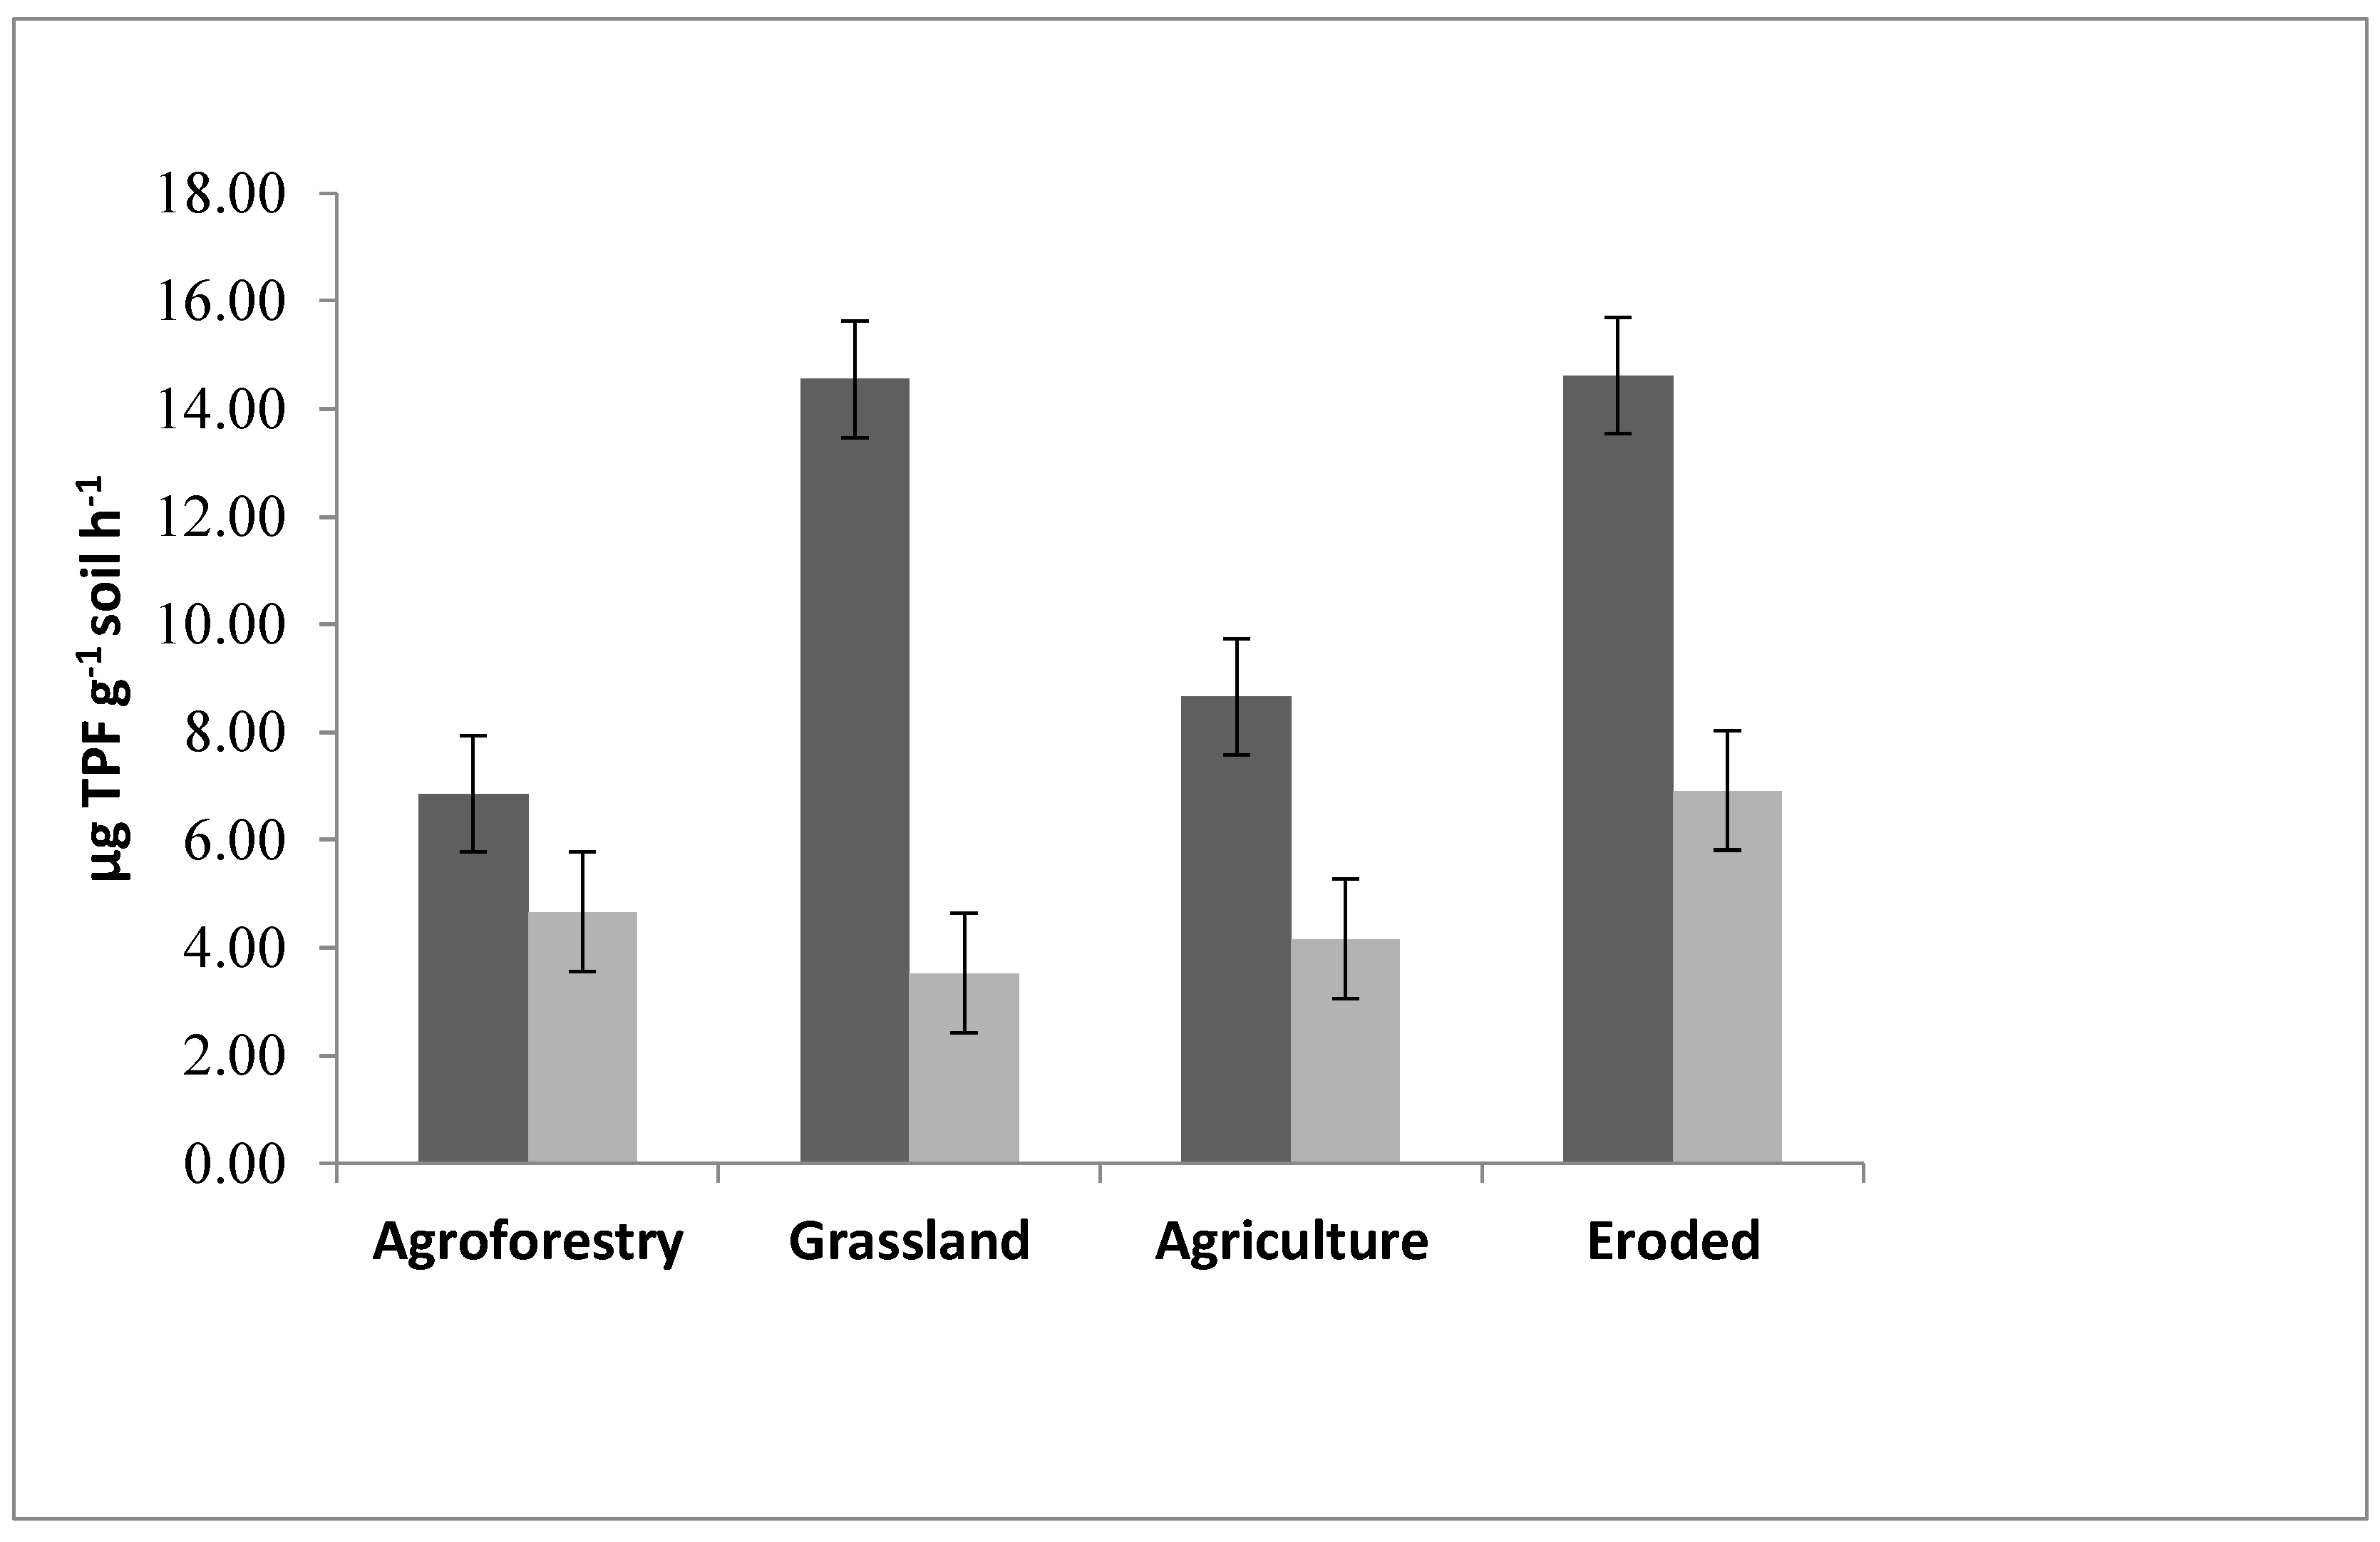
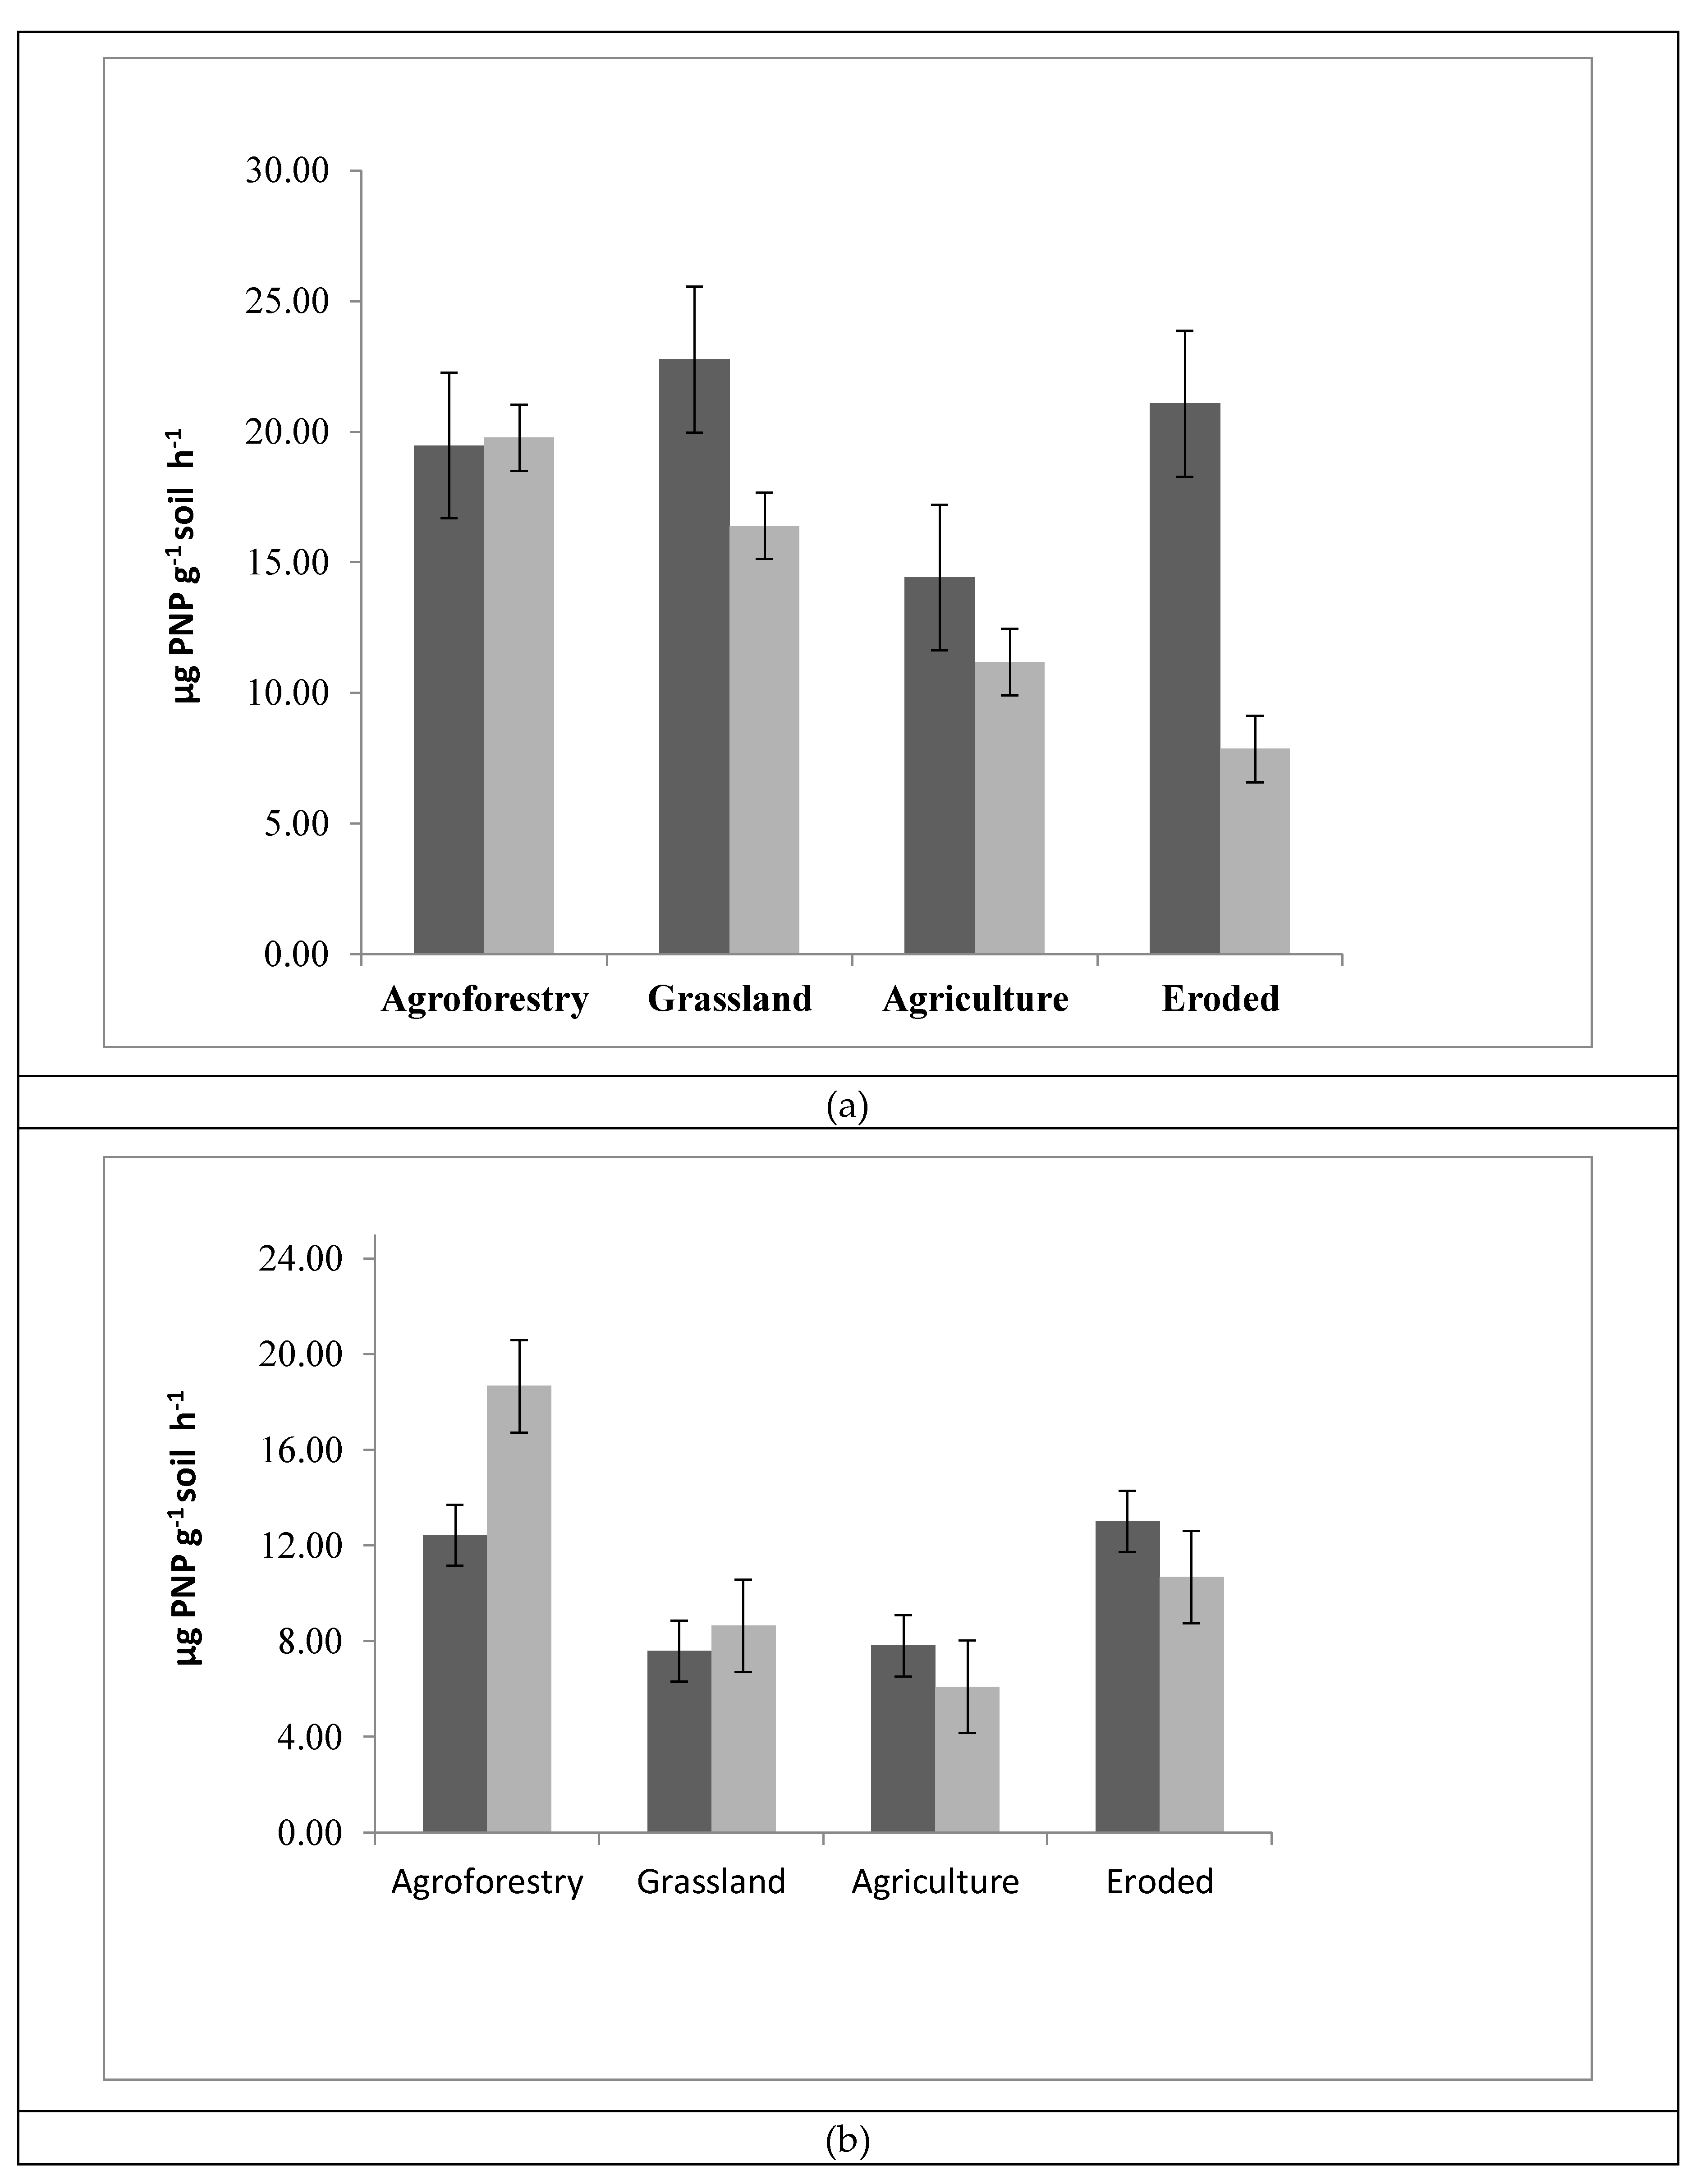
3.3. Enzyme Activities

The soil dehydrogenase enzyme activity in the 0–15 cm soil depth was significantly higher in soils from grassland and eroded as compared to agricultural and agroforestry land use systems (Figure 2). The subsurface soils showed relatively lower enzyme activity as compared to the surface soils and differences among the land uses were narrow. Accordingly, the alkaline phosphatase activity in 0–15 cm soil depth was highest (22.77 µg PNP g−1 soil h−1) in grassland, followed by eroded (21.08 µg PNP g−1 soil h−1), agroforestry (19.48 µg PNP g−1 soil h−1), and lowest (14.43 µg PNP g−1 soil h−1) in agricultural soils (Figure 3). The trend for acid phosphatase activity in 0–15 cm soil depth was agroforestry (19.77 µg PNP g−1 soil h−1) > grassland (16.41 µg PNP g−1 soil h−1) > agriculture (11.19 µg PNP g−1 soil h−1) > eroded lands (7.85 µg PNP g−1 soil h−1, Figure 3). In the 15–30 cm soil depth, the soils from agroforestry land use had significantly higher alkaline and acid phosphatase activity as compared to the grassland and agricultural land uses systems (Figure 3).

3.4. Relationships between Soil Properties and Culturable Microbial Viable Cell Counts

We explored the correlations of bacteria as clustered by land use through PCA, with the first two components of the PCA together explaining 72% (41% and 31%, respectively) and 71% (45% and 26%, respectively) in 0–15 and 15–30 cm soil depth, respectively (Figure 4). The clustering of the land uses by PCA was more prominent in the 0–15 cm soil depth, where grassland and agricultural land use systems were clearly separated from other land uses and primarily dominated the first and second components, respectively. At this depth, the first component was dominated by Rhizobium, Agrobacterium, and Azotobacter, while Actinobacteria, Pseudomonas, and tricalcium phosphate solubilizer dominated the second component. The observations from grassland and agroforestry land use systems were aligned with maximum number of bacterial viable cell counts. The alignment of bacterial communities to the land use clusters was inconsistent in the subsurface soils. However, the Agrobacterium was consistently associated with the grassland system in both the soil depths.
The biplots were also used to correlate soil enzymes, aggregate-associated carbon, and total viable bacteria and fungi cell counts to the land use clusters (Figure 5). In 0–15 cm soil depth, the first two PCA components explained 81% variability (55% and 26% by first and second components, respectively). The observations from the grassland and eroded land use systems were prominently separated by the second component. Most of the variables in the surface soil were aligned to the grassland and agroforestry and least to the eroded lands. The aggregate-associated C in the surface soil was closely associated with soils from grassland, whereas the alignment was with the agroforestry land use system in the subsurface soil. The observations from the agroforestry land use systems were aligned with variables that favor soil fungal population (soil moisture and acid phosphatase activity).

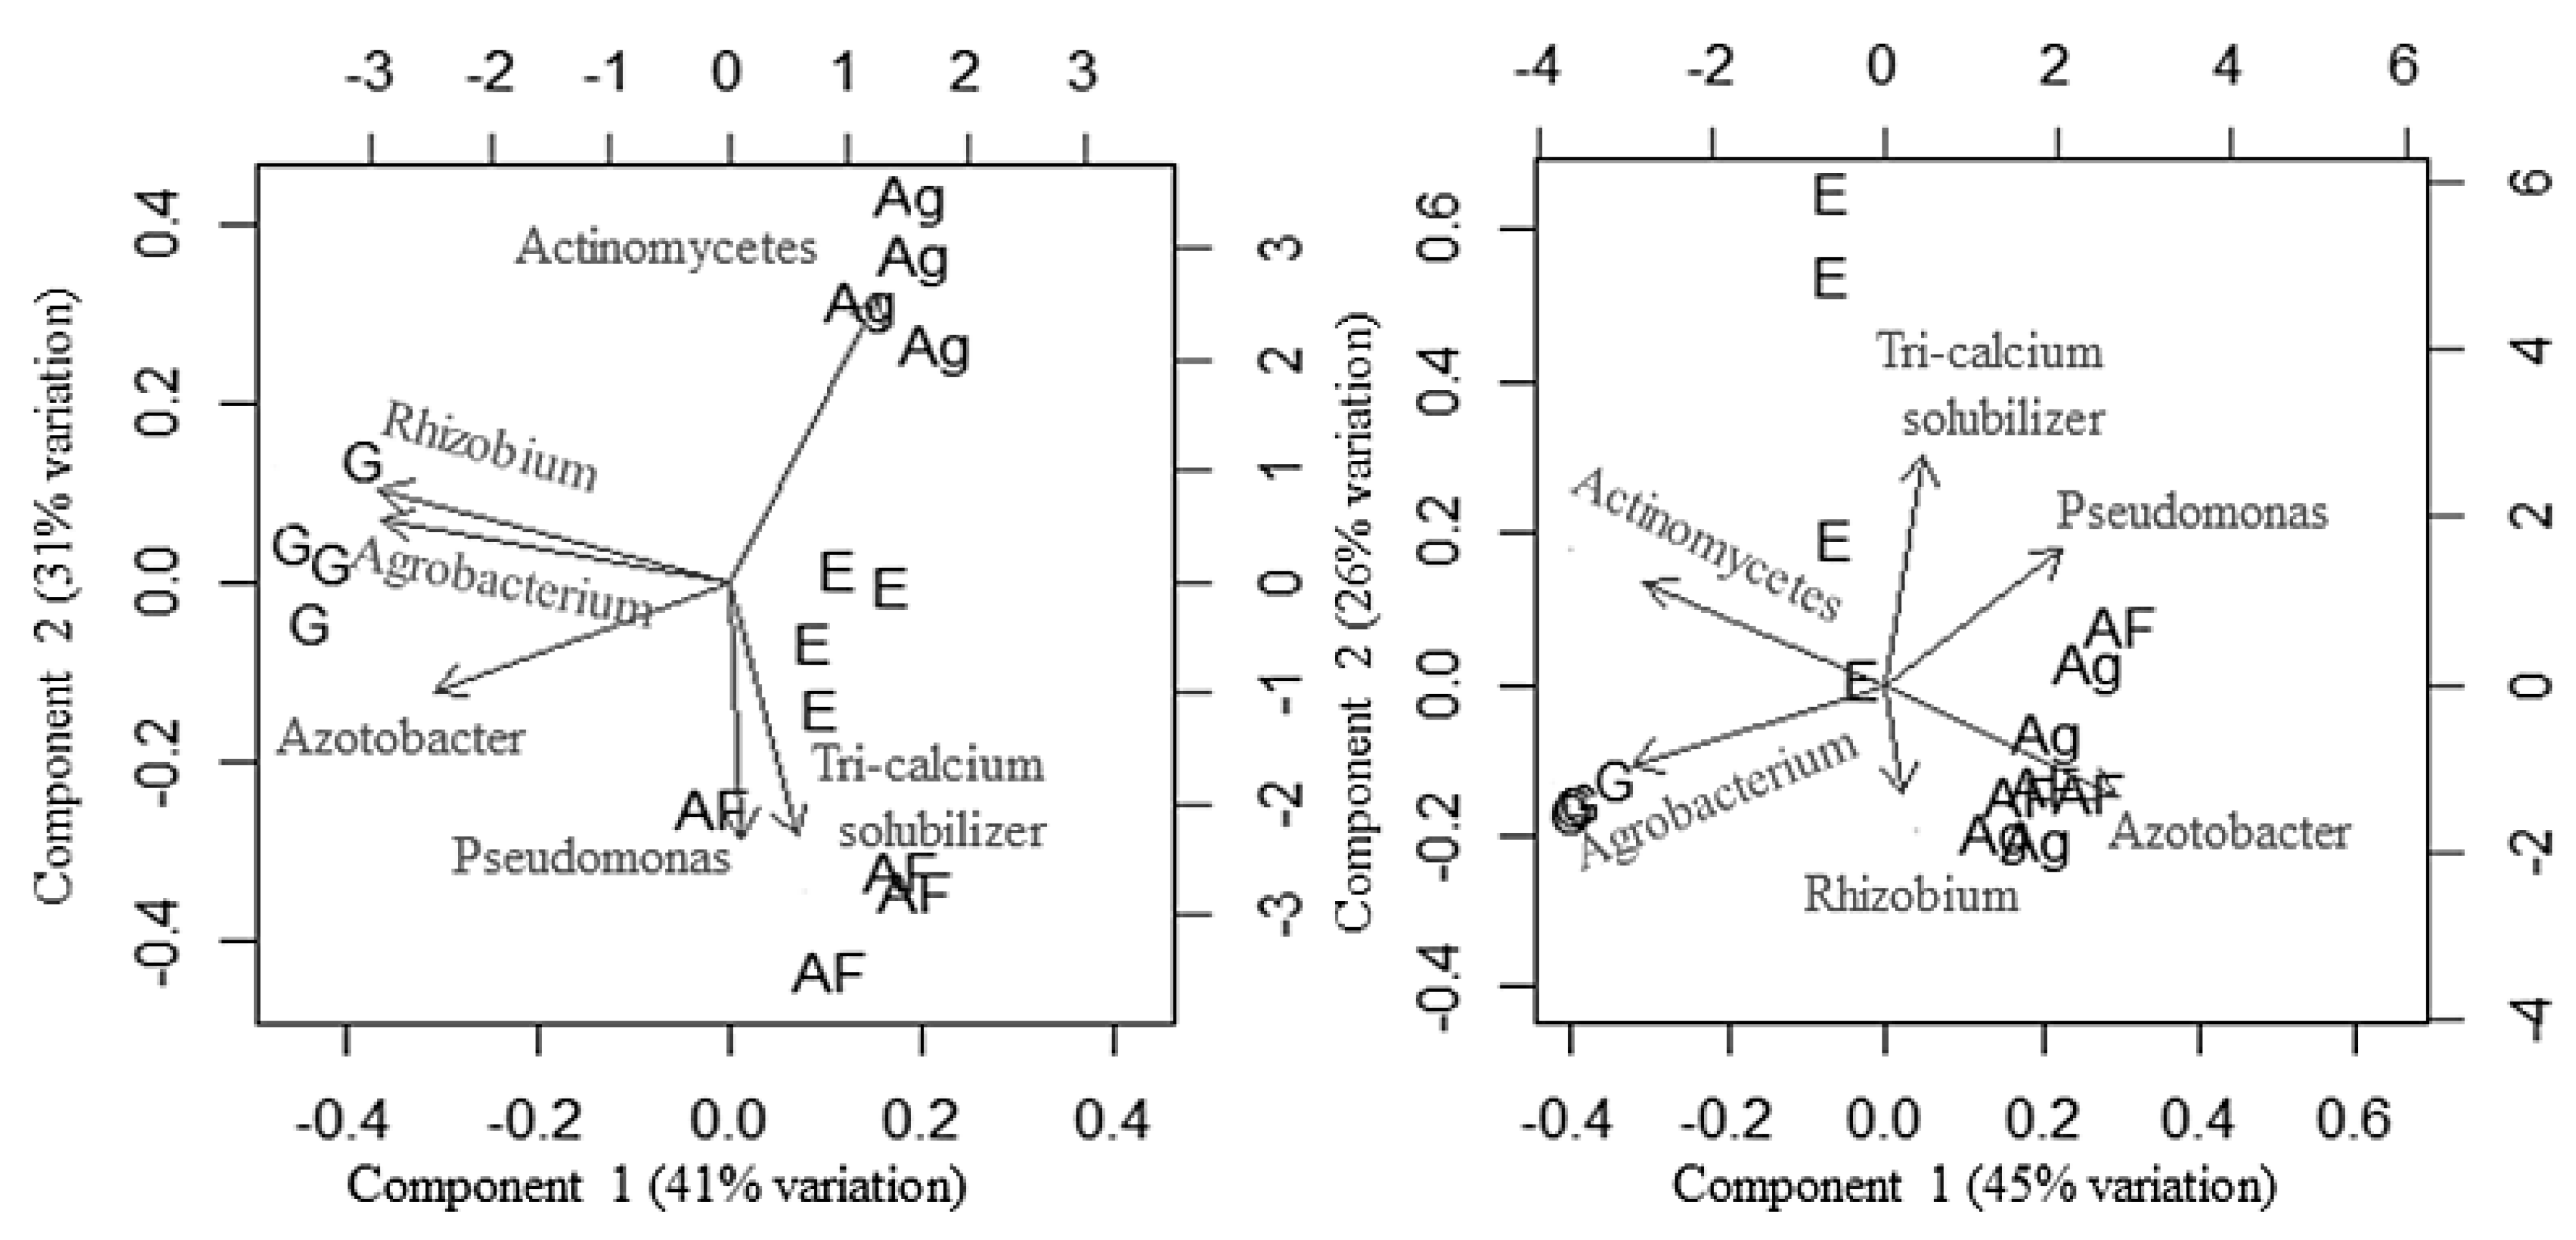
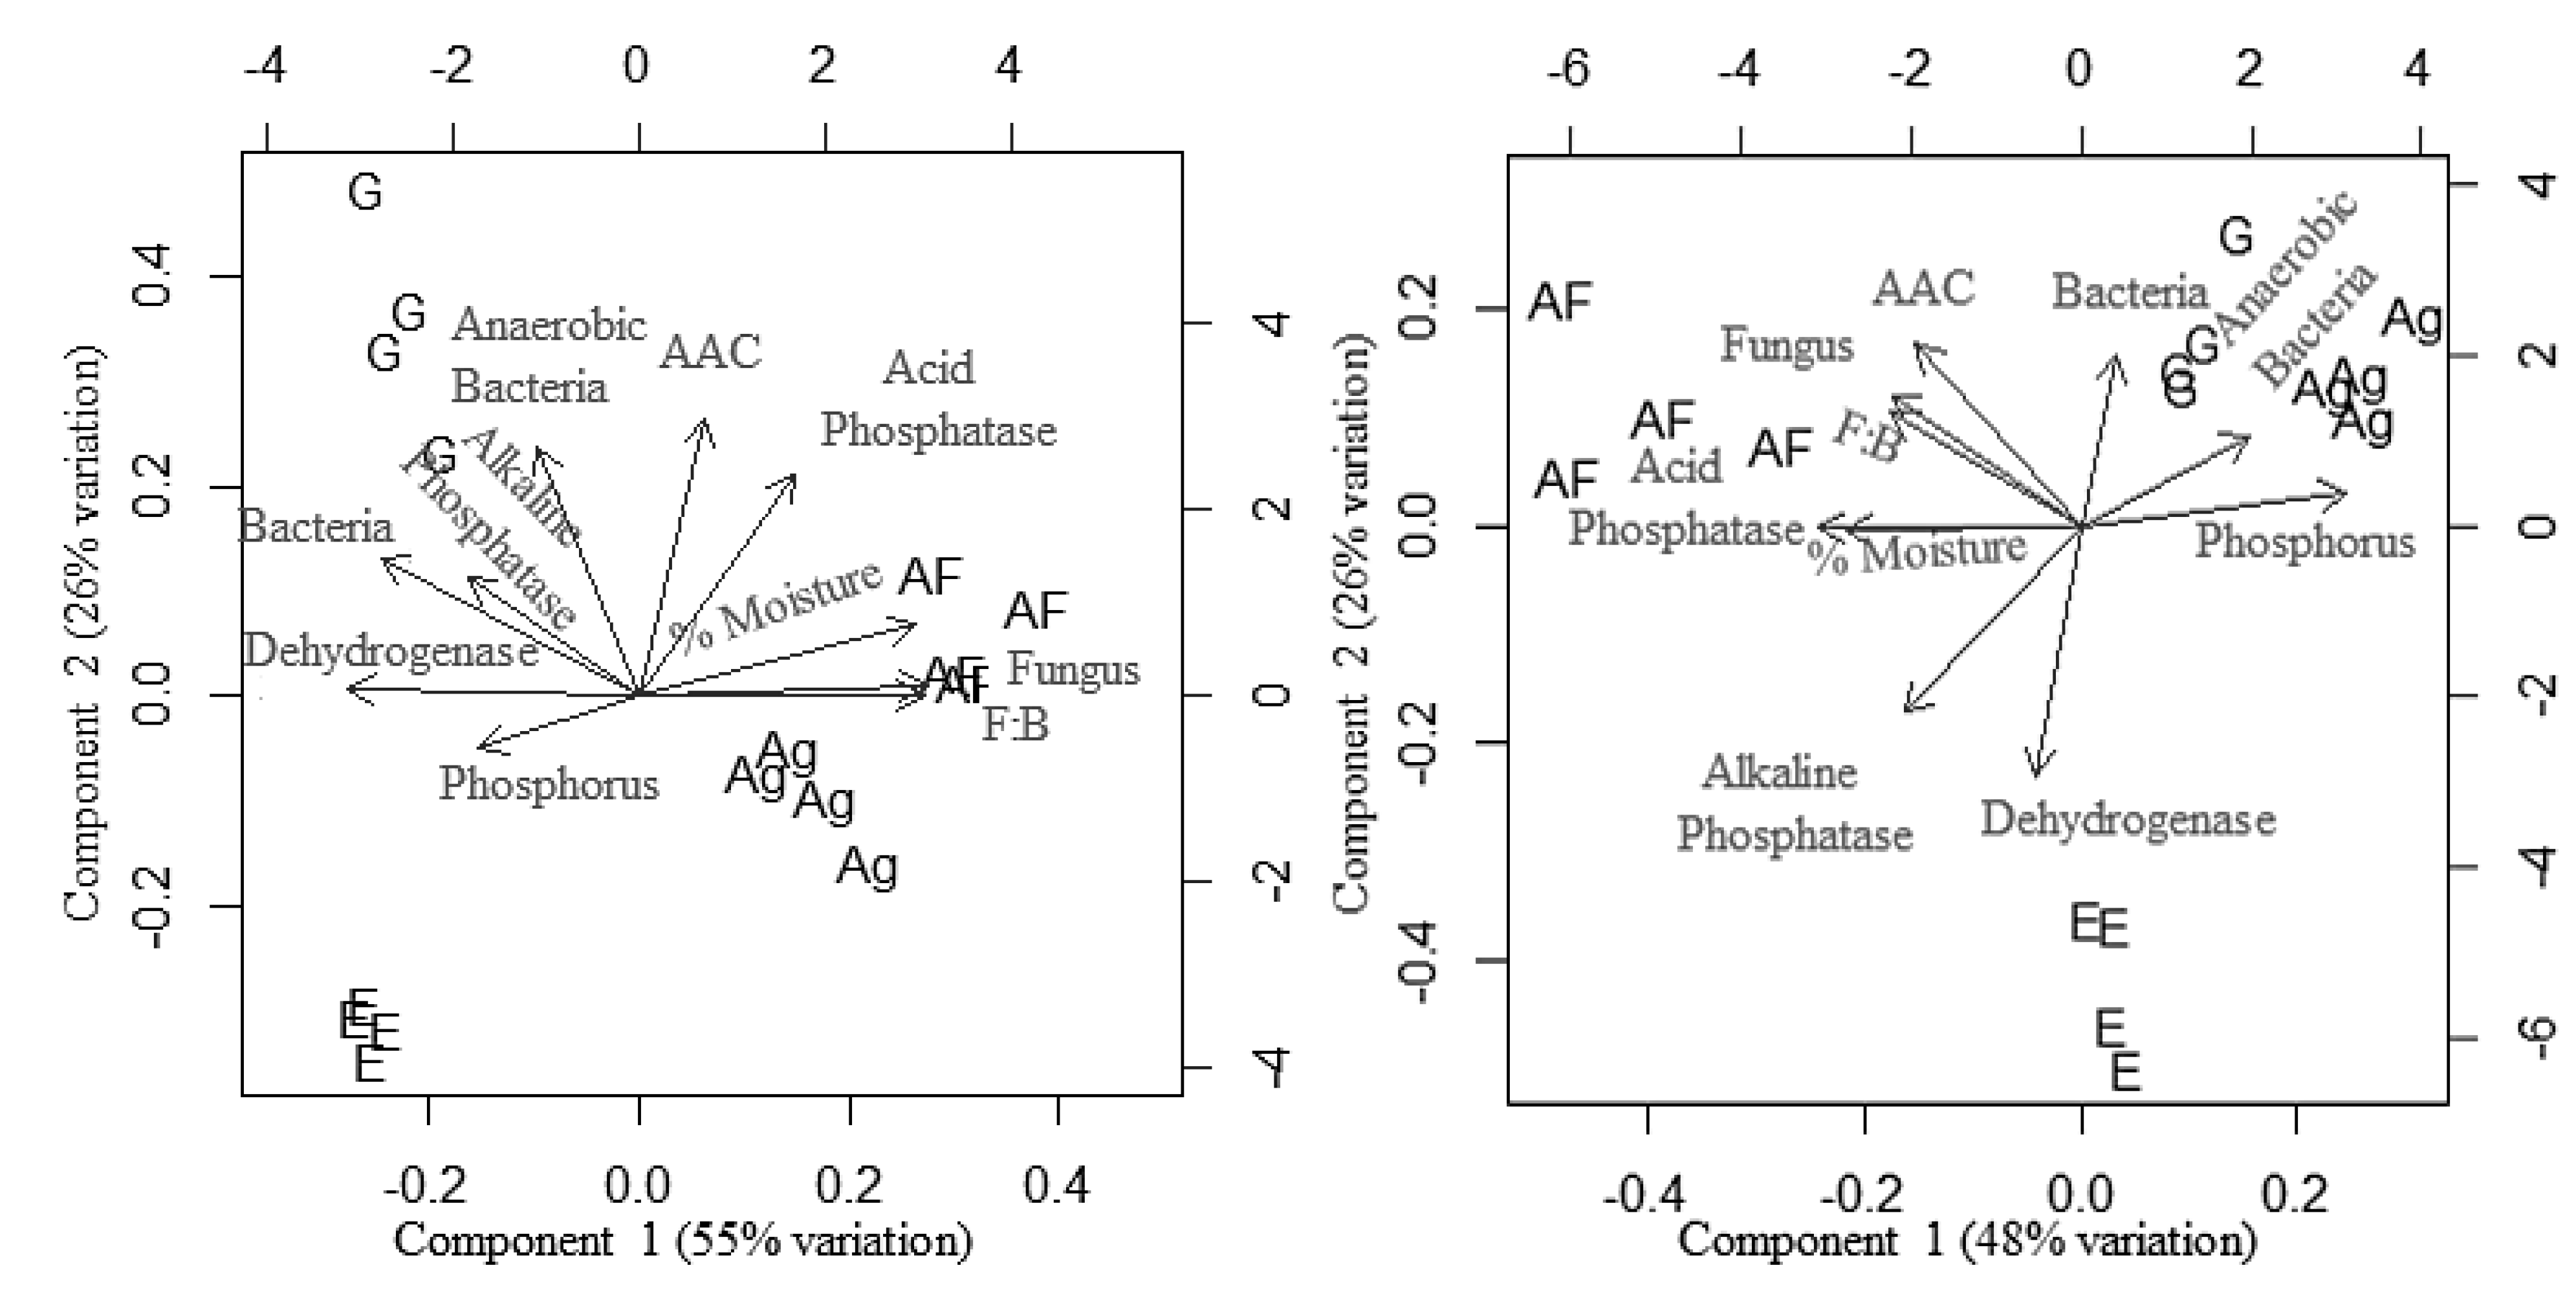
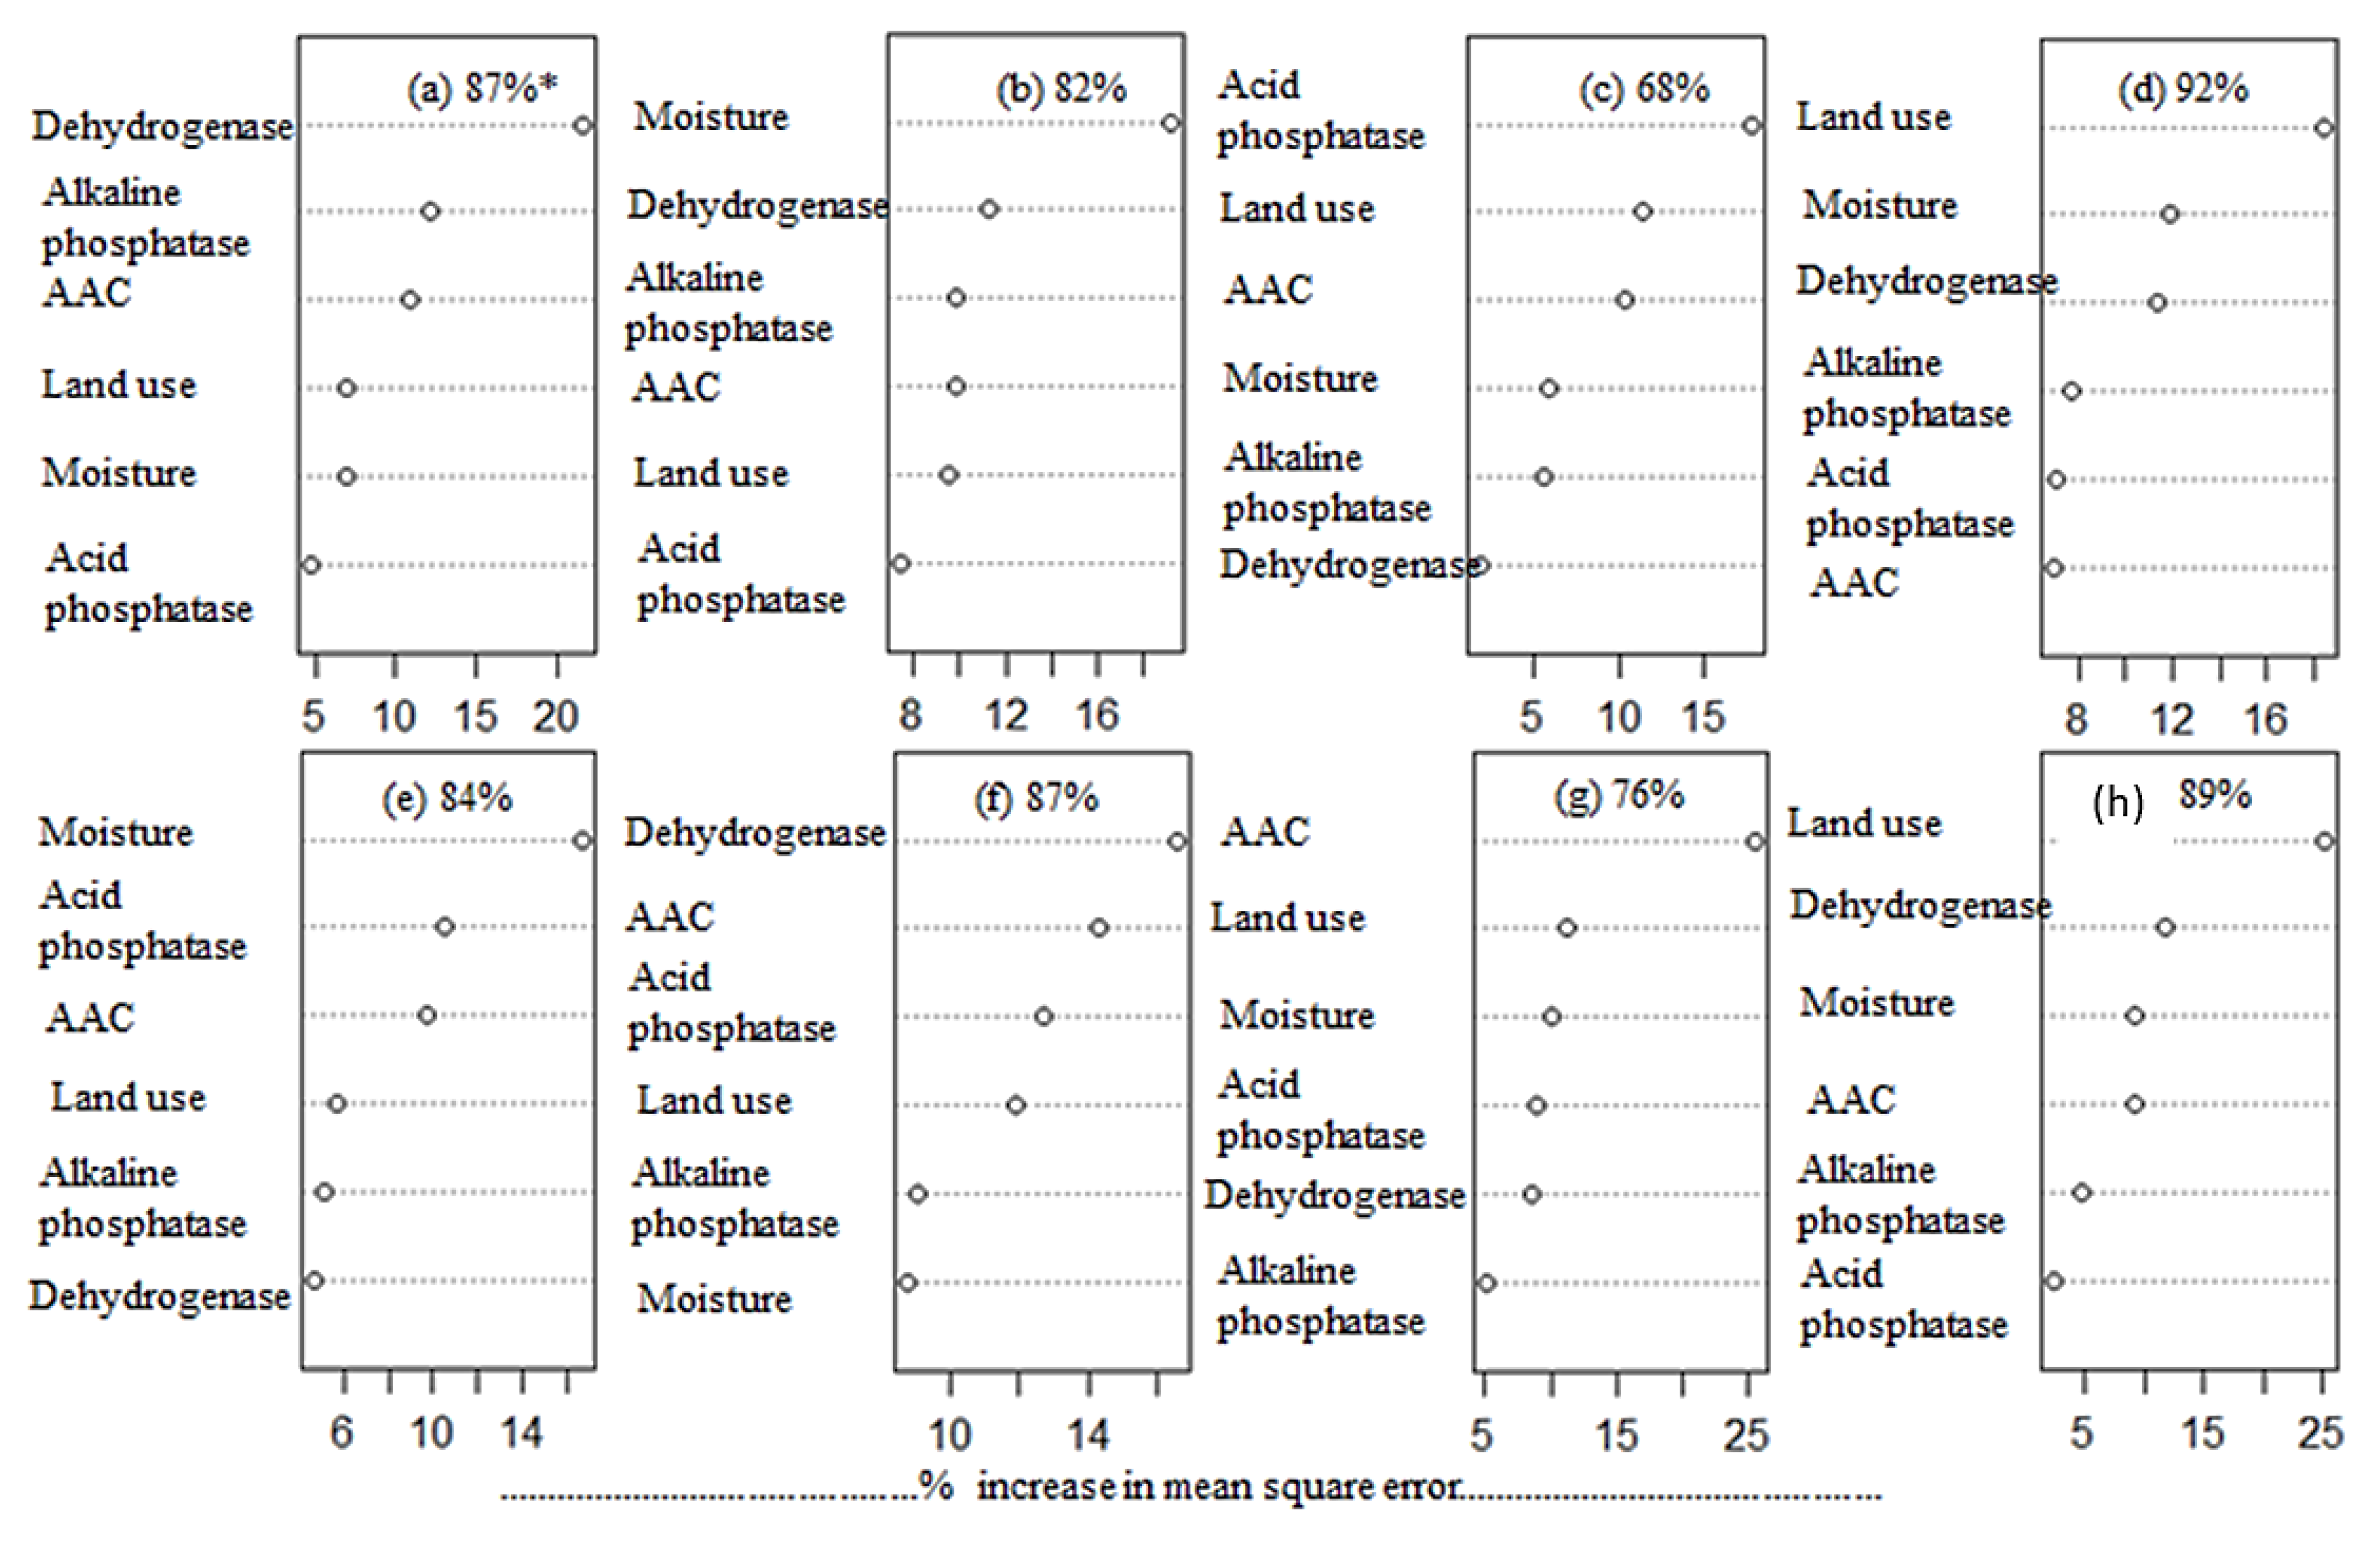
3.5. Effect of Land Use Systems and Soil Properties on Soil Microfloral Communities

Random forest analysis was carried out to understand the importance of land use and soil variables on soil microbial community (Figure 6). On average, 83% variability in the soil microbial population was explained by the random forest model. Land use was not the most important variable influencing overall viable bacterial and fungal population; however, it was an important variable that influenced anaerobic bacteria, Actinobacteria, Rhizobium, and Agrobacterium population. Consistent with the biplot, random forest also identified soil moisture as an important predictor of soil fungal population. The importance of aggregate-associated C for Rhizobium population indicates the significance of soil organic matter for symbiotic N-fixation.

4. Discussion

4.1. Soil Enzymatic Activity as an Indicator of Soil Health and Land Use System

The objective of this study was to evaluate potential soil health indicators with respect to land use and soil depth. Along with representing a site for enzymatic production, soil organic matter also acts as a substrate for enzymatic degradation and thus impacts the enzyme activities in soils. A significant positive correlation between SOC and dehydrogenase activity has been reported by other studies [36,37,38]. Dehydrogenases are intracellular enzymes which are closely related with respiratory activity and organic matter decomposition in soil. In our study, the grassland soil samples exhibited significantly higher dehydrogenase activity along with aggregate-associated C over other land use systems, indicating the predominant occurrence of oxidative microbial activity to exhibit the production of dehydrogenase enzymes (Figure 2 and Figure 5). The dehydrogenase activity was unexpectedly higher in the eroded as compared to the agroforestry and agricultural land use systems. This could probably be due to the deposition of eroded soil material from the fertile lands on the surface of eroded lands in the mixed watershed from where the samples were collected [9]. The enzymatic activity reported in our study supports the fact that variation in organic C content due to such depositions might influence the availability of C as substrates for microorganisms. On the other hand, the dehydrogenase enzymatic activity in eroded lands was not related to the aggregate-associated soil C. This suggested that this deposited C did not contribute to aggregate formation in eroded lands resulting in less water stable macro-aggregates in eroded lands (Table 1, Figure 2 and Figure 5). Lower dehydrogenase activity in the subsurface soil (15–30 cm) was probably due to poor nutrient and aeration status and reduced rhizodeposition in the lower depths. This decline in the enzymatic activity with depth might also be due to decrease in easily decomposable organic matter with depth as compared to the 0–15 cm soil depth [39].
The phosphatases are a broad group of enzymes whose activity is not only linked to the synthesis of microbial cells [40], but also to the mineralization of organic to inorganic P [41]. In soils, phosphatase enzymes have been recognized as an indicator of P availability [42]. The increase in activity of these enzymes might be due to higher levels of intracellular and/or extracellular enzymes, or derived from portions previously adsorbed on recalcitrant humic substances or soil matrices with high surface area to volume aspect ratio [43], which in parts might be reflected by the aggregate-associated C fraction. We observed that the increased activity of acid phosphatase under agroforestry land use system increased with high soil organic matter content and low available P [44]. Acid phosphatase secretion from plant roots helps the plant to enhance the solubilization and remobilization of unavailable phosphate [45]. Our results also support the fact that acidic soil pH conditions favor acid phosphatase activity in agroforestry system. Similar results were observed by [46] in forest soils under Eucalyptus marginata. Plant roots do not exhibit alkaline phosphatase activity and are usually negatively correlated with acid phosphatase activity [40], which was reflected in the agricultural land use system in our study. It is evident from our data that phosphatase activity decreased with soil depth and corresponded to SOC content and distribution of microorganisms in the soil profiles (0–15 and 15–30 cm) [47] (Table 1 and Table 2 and Figure 5).

4.2. Culturable Soil Microfloral Communities as Indicators of Soil Health and Land Use Change

The fungal:bacterial ratio has been widely used as a biological soil health indicator of land use system [48,49]. Higher fungal biomass is often associated with increased transformation and stabilization of the organic C in soil [50]. Due to greater C:N ratio of the fungal biomass and its contribution to soil aggregate formation, soils dominated by fungal communities decrease the turnover rate of C [48]. Agricultural soils in this study were poorly managed ecosystems subjected to tillage and chemical fertilization which tend to decreases the C:N ratio, thus favoring more bacterial growth [51]. A meta-analysis conducted by [2], from 165 agricultural soil samples varying in their management strategies, reported that microbial community responded well to the type of ground cover across the regions. When agricultural systems are diversified by introducing tree species (e.g., in agroforestry systems), a shift is observed in microbial community structure towards a fungal dominated community (Table 2) that can enhance accumulation and protection of soil C within the aggregates (Figure 5 and Table 1). Agroforestry systems that incorporate trees in the farming system have potential to improve soil fertility and protect soil organic C in the lower depths [52,53]. Higher SOC pool and greater soil aggregate stability under the agroforestry system than the conventional sole crop system in northwestern India were reported by [22]. In agroforestry land use, the litter is mostly returned to the soil and mainly comprises of the tree leaves, which on decomposition create an acidic environment favoring the growth of fungal spores. This effect on soil pH is also supported by greater association of acid phosphatase activity in the agroforestry soils (Figure 3 and Figure 5). Higher fungal population in forest lands than the degraded lands of Cherrapunjee was reported by [54]. Higher bacterial counts (0–15 cm) in our eroded lands as compared to agroforestry and agriculture land use might be due to absence of other major decomposing groups like fungus (Table 2 and Figure 4).
The Actinobacteria play a beneficial role in soil nutrient cycling [55]. In our study, the agricultural soils had experienced repetitive cycles of crop season and barren (no cover crop) conditions with minimal crop residue return. The higher Actinobacteria count in agricultural soils might be due to the fact that they can survive through spore formation even under relatively low moisture levels, conditions unfavorable to other bacteria [56] (Table 2, Figure 6). The lower count of Actinobacteria in the subsurface as compared to the surface is because of the fact that they are strictly aerobic microorganisms (obligate aerobes). The anaerobic micro-organisms (obligate or facultative) are mainly responsible for the nutrient cycling in soil ecosystems that have periods of high moisture accumulation or anaerobic micro-sites. The overall reduction in microbial population and diversity in eroded soils indicated deterioration of soil health, deterioration of microbial growth, and overall soil degradation process [57]. The higher tricalcium phosphate-solubilizing bacterial counts in the surface soils of agroforestry and eroded lands were associated with higher available P in soils sampled from these land uses, indicating that a higher count of tricalcium phosphate-solubilizing bacteria in the soil led to higher availability of P [58] (Figure 4). The higher P content in the surface soil from eroded lands could have been deposited in these soils along with P-adsorbed soil particles. However, the tricalcium phosphate-solubilizing bacterial counts did not serve as a good indicator of available P for other land uses. The eroded and agroforestry lands also had a higher tricalcium phosphate-solubilizing bacterial population in subsurface soils (15–30 cm), which is not correlated to low soil available P content for these soils. Fluorescent Pseudomonas is one of the prominent plant growth-promoting soil microflora and its higher population in agroforestry soils denotes a higher potential for such a land use to harbor plant growth and efficient nutrient cycling [59] (Figure 4). In the (0–15 cm) surface soil, the eroded soil samples exhibited higher average fluorescent Pseudomonas counts as compared to agriculture, agroforestry, and grassland soils. This might be due to the fact that they are versatile in nutritional requirements and have the potential to harbor special genes that enhance their capabilities to survive in degraded environments [60].
The Azotobacter are a free living heterotrophic population that exhibit atmospheric N fixation and are affected by factors like soil C and N content [61]. The greater SOC content in the agroforestry and grassland soils might have resulted in better growth of Azotobacter—heterotrophic free living diazotrophs. The lower Azotobacter population in the surface soil as compared to the subsurface soil could be due to lower subsurface oxygen content. The nitrogenase enzyme in Azotobacter is highly sensitive to the presence of oxygen. For surface soils, the increased microbial metabolism decreases the partial pressure of oxygen and thus provides anaerobic conditions for the nitrogenase enzyme to activate [62]. The rhizobia are known to be very sensitive to low pH and function best at near neutral pH. There was no substantial difference in the pH conditions among the four studied land uses except for the fact that agroforestry had an overall lower trend of soil pH. [63] reported that continuous cultivation for 27 years under maize–bean rotation led to a decrease in rhizobial population due to decrease in soil pH and SOC in treatments where chemical fertilization were applied. In contrast, they observed that integrated application of farm yard manure or organic residues along with chemical fertilizers enhanced the rhizobial population, which might be due to the pH buffering action of the organic amendments. The higher rhizobial population in grassland soils might be due to high aggregate-associated C in these soils.

5. Conclusions

This study reports the potential use of microbial communities and soil enzymes as indicators of soil health degradation in a watershed with four different land use systems (agricultural, agroforestry, grassland and eroded lands) located in the lower Himalayas in India. The aggregate-associated soil organic C served as a better indicator of the soil microfloral population dynamics as compared to the enzymatic activity in these different land use systems, especially the eroded lands which had deposited organic matter debris. The shifts in anaerobic bacteria (cellulose) and the agrobacterium were sensitive to the land use type. The aggregate-associated C fraction was closely related to the rhizobial counts irrespective of land use. In our study, agroforestry land use facilitated higher fungal:bacterial ratios and higher atmospheric N fixing bacterial groups, thereby accumulating more C and N in the soil. The agricultural land use system evaluated in this study employed extensive soil disturbance through tillage and lack of cover cropping, which might have resulted in soil health decline, unlike the agroforestry land use systems that demonstrated the capacity to augment the aggregate-associated C, thereby protecting the C from erosion by agents like air or water and improving soil health. Therefore, land use systems that facilitate organic residue incorporation through prolonged crop cover and reduced disturbance could prove to be a good management strategy to prevent land degradation and enhance soil fertility and productivity. Overall, our study demonstrates that biological soil health indicators serve as effective tools that are measures of ecosystem sustainability and biogeochemical nutrient cycling in different land use management systems.

Author Contributions

Conceptualization, A.B. and S.S.K.; methodology, A.B., D.S., H.S., S.K., S.S. and A.K.; formal analysis, A.B.; investigation, A.B. and S.S.K.; writing—original draft preparation, A.B.; writing—review and editing, A.B., D.S., S.S.K. and H.S.

Funding

This research received no external funding. Publication charges were paid by North Carolina A&T State University.

Acknowledgments

The authors would like to thank S. S. Bawa, Punjab Agricultural University, India for providing assistance during soil sampling and Tarik Mitran, Scientist, National Remote Sensing Center, Indian Space Research Organization, India for generating the location map of the experimental site.

Conflicts of Interest

The authors declare no conflicts of interest.

References

  1. Lal, R. Soil carbon dynamics in cropland and rangeland. Environ. Pollut. 2002, 116, 353–362. [Google Scholar] [CrossRef]
  2. Trivedi, P.; Delgado-Baquerizo, M.; Anderson, I.C.; Singh, B.K. Response of soil properties and microbial communities to agriculture: Implications for primary productivity and soil health indicators. Front. Plant Sci. 2016, 7, 990. [Google Scholar] [CrossRef] [PubMed]
  3. Doran, J.W.; Zeiss, M.R. Soil health and sustainability: Managing the biotic component of soil quality. Appl. Soil Ecol. 2000, 15, 3–11. [Google Scholar] [CrossRef]
  4. Doran, J.W.; Parkin, T.B. Defining and assessing soil quality. In Defining Soil Quality for a Sustainable Environment; Doran, J.W., Coleman, D.C., Bezdicek, D.F., Stewart, B.A., Eds.; American Society of Agronomy: Madison, WI, USA, 1994; pp. 3–21. [Google Scholar]
  5. Wall, D.H.; Virginia, R.A. Controls on soil biodiversity: Lessons from extreme environments. Appl. Soil Ecol. 1999, 13, 127–150. [Google Scholar] [CrossRef]
  6. Bhowmik, A.; Fortuna, A.M.; Cihacek, L.; Bary, A.; Cogger, C.G. Use of biological indicators of soil health to estimate reactive nitrogen dynamics in long-term organic vegetable and pasture systems. Soil Biol. Biochem. 2016, 103, 308–319. [Google Scholar] [CrossRef] [Green Version]
  7. Bhowmik, A.; Fortuna, A.M.; Cihacek, L.; Bary, A.; Carr, P.M.; Cogger, C.G. Potential carbon sequestration and nitrogen cycling in long term organic management systems. Renew. Agric. Food Syst. 2017, 32, 498–510. [Google Scholar] [CrossRef]
  8. Bhowmik, A.; Fortuna, A.M.; Cihacek, L.; Rahman, S.; Borhan, M.S.; Carr, P. Use of Laboratory Incubation Techniques to Estimate Green House Gas footprints from Conventional and No-Tillage Organic Agroecosystems. Soil Biol. Biochem. 2017, 112, 204–215. [Google Scholar] [CrossRef]
  9. Saha, D.; Kukal, S.S.; Sharma, S. Landuse impacts on SOC fractions and aggregate stability in typic ustochrepts of Northwest India. Plant Soil 2011, 339, 457–470. [Google Scholar] [CrossRef]
  10. Brevik, E.C.; Sauer, T.J. The past, present, and future of soils and human health studies. Soil 2015, 1, 35–46. [Google Scholar] [CrossRef] [Green Version]
  11. Nannipieri, P.; Grego, S.; Ceccanti, B. Ecological significance of the biological activity in soils. In Soil Biochemistry; Bollag, J.M., Stotzky, G., Eds.; Marcel Dekker, Inc.: New York, NY, USA, 1990; pp. 293–355. [Google Scholar]
  12. Guo, L.B.; Gifford, R.M. Soil carbon stocks and land use change: A meta-analysis. Glob. Chang. Biol. 2002, 8, 345–360. [Google Scholar] [CrossRef]
  13. Tabatabai, M.A. Soil enzymes. In Methods of Soil Analysis; Page, A.L., Ed.; American Society of Agronomy: Madison, WI, USA, 1994; pp. 775–834. [Google Scholar]
  14. Acosta-Martinez, V.; Zobeck, T.M.; Allen, V. Soil microbial, chemical and physical properties in continuous cotton and integrated crop-livestock systems. Soil Sci. Soc. Am. J. 2004, 68, 1875–1884. [Google Scholar] [CrossRef]
  15. Kandeler, E.; Kampichler, C.; Horak, O. Influence of heavy metals on the functional diversity of soil microbial communities. Biol. Fert. Soils 1996, 23, 299–306. [Google Scholar] [CrossRef]
  16. Bandick, A.K.; Dick, R.P. Field management effects on soil enzyme activities. Soil Biol. Biochem. 1999, 31, 1471–1479. [Google Scholar] [CrossRef]
  17. Trevors, J.T. Dehydrogenase activity in soil: A comparison between the INT and TTC assay. Soil Biol. Biochem. 1984, 16, 673–674. [Google Scholar] [CrossRef]
  18. Ndiaye, E.L.; Sandeno, J.M.; McGrath, D.; Dick, R.P. Integrative biological indicators for detecting change in soil quality. Am. J. Altern. Agric. 2000, 15, 26–36. [Google Scholar] [CrossRef]
  19. Moore, J.M.; Klose, S.; Tabatabai, M.A. Soil microbial biomass carbon and nitrogen as affected by cropping systems. Biol. Fert. Soils 2000, 31, 200–210. [Google Scholar] [CrossRef]
  20. Kukal, S.S.; Sur, H.S.; Gill, S.S. Factors responsible for soil erosion hazard in submontane Punjab. Soil Use Manag. 1991, 7, 38–44. [Google Scholar] [CrossRef]
  21. Sitaula, B.K.; Bajracharya, R.M.; Singh, B.R.; Solberg, B. Factors affecting organic carbon dynamics in soils of nepal/himalayan region-a review and analysis. Nutr. Cycl. Agroecosyst. 2004, 70, 215–229. [Google Scholar] [CrossRef]
  22. Gupta, N.; Kukal, S.S.; Bawa, S.S.; Dhaliwal, G.S. Soil organic carbon and aggregation under poplar based agroforestry system in relation to tree age and soil type. Agrofor. Syst. 2009, 76, 27–35. [Google Scholar] [CrossRef]
  23. De, M.; Saha, D.; Chakraborty, S. Soil structure and strength characteristics in relation to slope segments in a degraded Typic Ustochrepts of Northwest India. Soil. Horizons. 2014, 55, 1. [Google Scholar] [CrossRef]
  24. Saha, D.; Kukal, S.S. Soil structural stability and water retention characteristics under different land uses of degraded lower Himalayas of North-West India. Land Degrad. Dev. 2015, 26, 263–271. [Google Scholar] [CrossRef]
  25. Blake, G.R.; Hartge, K.H. Bulk density. In Methods of Soil Analysis, Part I; Klute, A., Ed.; ASA Monograph No. 9: Madison, WI, USA, 1986; pp. 363–376. [Google Scholar]
  26. Olsen, S.R.; Cole, C.V.; Frank, S.; Watanabe, F.S. Estimation of Available Phosphorus in Soils by Extraction with Sodium Bicarbonate; USDA: Washington, DC, USA, 1954; p. 18. [Google Scholar]
  27. Yoder, R.E. A direct method of aggregate size analysis of soils and a study of the physical nature of erosion losses. J. Am. Soc. Agron. 1936, 28, 337–351. [Google Scholar] [CrossRef]
  28. Kemper, W.D.; Rosenau, R.C. Aggregate stability and size distribution. In Methods of Soil Analysis, Part 1; Klute, A., Ed.; American Society of Agronomy: Madison, WI, USA, 1986; pp. 425–442. [Google Scholar]
  29. Youker, R.E.; McGuinness, J.L. A short method of obtaining mean weight diameter values of aggregate analyses of soils. Soil Sci. 1956, 83, 291–294. [Google Scholar] [CrossRef]
  30. Walkley, A.; Black, I.A. An examination of the Degtjareff method for determining soil organic matter and a proposed modification of the chromic acid titration method. Soil Sci. 1934, 37, 29–38. [Google Scholar] [CrossRef]
  31. Tabatabai, M.A. Soil enzymes. In Methods of Soil Analysis, Part 2: Chemical and Microbiological Properties; Page, A.L., Ed.; Soil Science Society of America: Madison, WI, USA, 1982; pp. 903–948. [Google Scholar]
  32. Tabatabai, M.A.; Bremner, J.M. Use of p-nitrophenyl phosphate for assay of soil phosphatase activity. Soil Biol. Biochem. 1969, 1, 301–307. [Google Scholar] [CrossRef]
  33. Alef, K.; Nannipieri, P. Methods in Applied Soil Microbiology and Biochemistry; Academic Press Ltd.: London, UK, 1998. [Google Scholar]
  34. Breiman, L. Random forests. Mach. Learn. 2001, 45, 5–32. [Google Scholar] [CrossRef]
  35. Liaw, A.; Wiener, M. Classification and regression by randomForest. R News 2002, 2, 18–22. [Google Scholar]
  36. Bastida, F.; Moreno, J.L.; Hernández, T.; García, C. Microbiological degradation index of soils in a semiarid climate. Soil Biol. Biochem. 2006, 38, 3463–3473. [Google Scholar] [CrossRef]
  37. Melero, S.; Vanderlinden, K.; Ruiz, J.C.; Madejon, E. Long-term effect on soil biochemical status of a vertisol under conservation tillage system in semi-arid Mediterranean conditions. Eur. J. Soil Biol. 2008, 44, 437–442. [Google Scholar] [CrossRef]
  38. Zhang, L.; Chen, W.; Burger, M.; Yang, L.; Gong, P.; Wu, Z. Changes in soil carbon and enzyme activity as a result of different long-term fertilization regimes in a greenhouse field. PLoS ONE 2015, 10, e0118371. [Google Scholar] [CrossRef]
  39. Six, J.; Conant, R.T.; Paul, E.A.; Paustian, K. Stabilization mechanisms of soil organic matter: Implications for C-saturation of soils. Plant Soil 2002, 241, 155–176. [Google Scholar] [CrossRef]
  40. Juma, N.G.; Tabatabai, M.A. Phosphatase activity in corn and soybean roots: Conditions for assay and effects of metals. Plant Soil 1988, 107, 39–47. [Google Scholar] [CrossRef]
  41. Yang, J.; Hu, C.C.; Hu, H.; Yu, R.D.; Xia, Z.; Ye, X.Z.; Zhu, J. QTL Network: Mapping and visualizing genetic architecture of complex traits in experimental populations. Bioinformatics 2008, 24, 721–723. [Google Scholar] [CrossRef] [PubMed]
  42. Speir, T.W.; Ross, D.J. Soil phosphatase and sulphatase. In Soil Enzymes; Burns, R.G., Ed.; Academic Press: London, UK, 2006; pp. 197–250. [Google Scholar]
  43. Kumar, A.; Rakshit, R.; Bhowmik, A.; Mandal, N.; Das, A.; Adhikary, S. Nanoparticle-Induced Changes in Resistance and Resilience of Sensitive Microbial Indicators towards Heat Stress in Soil. Sustainability 2019, 11, 862. [Google Scholar] [CrossRef]
  44. Li, D.; Zhu, H.; Liu, K.; Liu, X.; Leggewie, G.; Udvardi, M.; Wang, D. Purple acid phosphatases of Arabidopsis thaliana: Comparative analysis and differential regulation by phosphate deprivation. J. Biol. Chem. 2002, 277, 27772–27781. [Google Scholar] [CrossRef] [PubMed]
  45. Kai, M.; Takazumi, K.; Adachi, H.; Wasaki, J.; Shinano, T.; Osaki, M. Cloning and characterization of four phosphate transporter cDNAs in tobacco. Plant Sci. 2002, 163, 837–846. [Google Scholar] [CrossRef]
  46. Grierson, P.F.; Adams, M.A. Plant species affect acid phosphatase, ergosterol and microbial P in a Jarrah (Eucalyptus marginata n ex SM) forest in south-western Australia. Soil Biol. Biochem. 2000, 32, 1817–1827. [Google Scholar] [CrossRef]
  47. Arutyunyan, E.A.; Galstyan, A.S.H. Determination of the activity of alkaline and acid phosphatase in soils. Agrochimija 1975, 5, 128–133. [Google Scholar]
  48. Six, J.; Frey, S.D.; Thiet, R.K.; Batten, K.M. Bacterial and fungal contributions to carbon sequestration in agroecosystems. Soil Sci. Soc. Am. J. 2006, 70, 555–569. [Google Scholar] [CrossRef]
  49. Malik, A.A.; Chowdhury, S.; Schlager, V.; Oliver, A.; Puissant, J.; Vazquez, P.G.M.; Jehmilch, N.; Bergen, M.V.; Griffiths, R.I.; Gleixner, G. Soil fungal:bacterial rations are linked to altered carbon cycling. Front. Microbiol. 2016, 7, 1247. [Google Scholar] [CrossRef]
  50. Waring, B.G.; Averill, C.; Hawkes, C.V. Differences in fungal and bacterial physiology alter soil carbon and nitrogen cycling: Insights from meta-analysis and theoretical models. Ecol. Lett. 2013, 16, 887–894. [Google Scholar] [CrossRef] [PubMed]
  51. Sinsabaugh, R.L.; Manzoni, S.; Moorhead, D.L.; Richter, A. Carbon use efficiency of microbial communities: Stoichiometry, methodology and modelling. Ecol. Lett. 2013, 16, 930–939. [Google Scholar] [CrossRef] [PubMed]
  52. Albrecht, A.; Kandji, S.T. Carbon sequestration in tropical agroforestry systems. Agric. Ecosyst. Environ. 2003, 99, 15–27. [Google Scholar] [CrossRef]
  53. Montagnini, F.; Nair, P.K.R. Carbon sequestration: An underexploited environmental benefit of agroforestry systems. Agrofor. Syst. 2004, 61, 281–295. [Google Scholar]
  54. Joshi, S.R.; Saikia, P.; Koijam, K. Characterization of microbial indicators to assess the health of degraded soil in Cherrapunjee, India-highest rainfall area of the world. Int. J. Biotechnol. Biochem. 2009, 5, 379–391. [Google Scholar]
  55. Elliot, L.F.; Lynch, J.M. The international workshop on establishment of microbial inocula in soils: Cooperative research project on biological resource management of the Organization for Economic Cooperation and Development (OECD). Am. J. Altern. Agric. 1995, 10, 50–73. [Google Scholar] [CrossRef]
  56. Ghorbani-Nasrabadi, R.; Greiner, R.; Alikhani, H.; Hamedi, J.; Yakhchali, B. Distribution of Actinobacteria in different soil ecosystems and effect of media composition on extracellular phosphatase activity. J. Soil Sci. Plant Nutr. 2013, 13, 223–236. [Google Scholar]
  57. Moreno-De Las Heras, M. Development of soil physical structure and biological functionality in mining spoils affected by soil erosion in a Mediterranean-Continental environment. Geoderma 2009, 149, 249–256. [Google Scholar] [CrossRef]
  58. Richardson, A.E. Prospects for using soil microorganisms to improve the acquisition of phosphorus by plants. Funct. Plant Biol. 2001, 28, 897–906. [Google Scholar] [CrossRef]
  59. Köberl, M.; Dita, M.; Martinuz, A.; Staver, C.; Berg, G. Agroforestry leads to shifts within the gammaproteobacterial microbiome of banana plants cultivated in Central America. Front. Microbiol. 2015, 6, 91. [Google Scholar]
  60. Radhapriya, P.; Ramachandran, A.; Anandham, R.; Mahalingam, S. Pseudomonas aeruginosa RRALC3 enhances the biomass, nutrient and carbon contents of Pongami pinnata seedlings in degraded forest soil. PLoS ONE 2015, 10, e0139881. [Google Scholar] [CrossRef] [PubMed]
  61. Berthrong, S.T.; Yeager, C.M.; Gallegos-Graves, L.; Steven, B.; Eichorst, S.A.; Jackson, R.B.; Kuske, C.R. Nitrogen Fertilization Has a Stronger Effect on Soil Nitrogen-Fixing Bacterial Communities than Elevated Atmospheric CO2. Appl. Environ. Microbiol. 2014, 80, 3103–3112. [Google Scholar] [CrossRef] [PubMed]
  62. Oelze, J. Respiratory protection of nitrogenase in Azotobacter species: Is a widely held hypothesis unequivocally supported by experimental evidence? FEMS Micorbiol. Rev. 2000, 24, 321–333. [Google Scholar] [CrossRef] [PubMed]
  63. Kibunja, C.N.; Mwaura, F.B.; Mugendi, D.N. Long-term land management effects on soil properties and microbial populations in a maize-bean rotation at Kabete, Kenya. Afr. J. Agric. Res. 2010, 5, 108–113. [Google Scholar]
Figure 1. Location of the experimental site in northwestern India.
Sustainability 11 03908 g001
Figure 2. Dehydrogenase enzyme activity in surface (0–15 cm) denoted by dark gray bars and subsurface (15–30 cm) soils denoted by light gray bars in different land use systems. Data represents the mean of four replications for each land use with standard deviation shown by vertical bars. Least significant difference (LSD) at 5% level of significance by analysis of variance (ANOVA) using completely randomized design with LSD (p = 0.05) = 1.08 for surface and 1.11 for subsurface soils.
Sustainability 11 03908 g002
Figure 3. Alkaline phosphatase (denoted by dark gray bars) and acid phosphatase (denoted by light gray bars) enzyme activity in (a) surface (0–15 cm) and (b) subsurface soils in different land use systems. Data represents the mean of four replications for each land use with standard deviation shown by vertical bars. Least significant difference (LSD) at 5% level of significance by analysis of variance (ANOVA) using completely randomized design with LSD (p = 0.05) = 2.79 (0–15 cm); 1.28 (15–30 cm) for alkaline phosphatase and 1.27 (0–15 cm); 1.93 (15–30 cm) for acid phosphatase.
Sustainability 11 03908 g003
Figure 4. Biplots of principal components analysis showing loadings of bacterial groups on the two principal components; and scores on the two principal components for sampling points according to land use type (Ag: Agricultural; AF: Agroforestry; G: Grassland; E: Eroded) in the surface (0–15 cm, left panel) and subsurface (15–30 cm, right panel) soils.
Sustainability 11 03908 g004
Figure 5. Biplots of principal component analysis showing loadings of soil enzymes and associated variables on the two principal components; and scores on the two principal components for sampling points according to land use systems (Ag: Agricultural; AF: Agroforestry; G: Grassland; E: Eroded) in the surface (0–15 cm, left panel) and subsurface (15–30 cm, right panel) soil. Note F:B represents fungal:bacterial ratio.
Sustainability 11 03908 g005
Figure 6. Variable importance plot from random forest for predictor variables (a) bacteria, (b) fungus, (c) anaerobic bacteria, (d) Actinobacteria, (e) Pseudomonas, (f) Azotobacter, (g) Rhizobium, and (h) Agrobacterium. Higher values of percent increase in men square error indicates the variables that are important for respective microbial population. Note AAC represents aggregate-associated carbon.
Sustainability 11 03908 g006
Table 1. Basic physio-chemical properties of soils (0–15 and 15–30 cm) under different land use systems.
AgroforestryGrasslandAgricultureEroded
0–15 cm 15–30 cm 0–15 cm 15–30 cm 0–15 cm 15–30 cm 0–15 cm 15–30 cm
pH6.61 ± 0.016.90 ± 0.00 7.51 ± 0.007.61 ± 0.00 7.62 ± 0.017.59 ± 0.017.50 ± 0.027.60 ± 0.01
EC (dS/m)0.58 ± 0.030.56 ± 0.04 0.60 ± 0.010.56 ± 0.02 0.60 ± 0.020.58 ± 0.01 0.64 ± 0.000.60 ± 0.00
BD (g cc−1)1.51 ± 0.021.48 ± 0.011.43 ± 0.021.45 ± 0.011.45 ± 0.031.46 ± 0.011.30 ± 0.081.28 ± 0.06
AAC g kg−10.77 ± 0.040.84 ± 0.010.99 ± 0.030.45 ± 0.060.73 ± 0.050.58 ± 0.030.36 ± 0.010.25 ± 0.02
Textural classSLSLSLSLSLSLSLSL
FC %23.4 ± 1.223.8 ± 1.419.5 ± 2.123.5 ± 1.0910.8 ± 1.711.1 ± 2.117.5 ± 2.321.4 ± 2.0
PWP %4.60 ± 0.103.80 ± 0.104.00 ± 0.304.9 ± 0.11.60 ± 0.102.20 ± 0.202.90 ± 0.206.80 ± 0.10
NH4-N (kg/ha)11.3 ± 0.220.4 ± 0.512.6 ± 0.15.0 ± 0.710.1 ± 0.322.3 ± 1.210.4 ± 0.312.4 ± 0.9
NO3-N (kg/ha)10.1 ± 0.18.70 ± 1.1010.4 ± 0.24.8 ± 1.2 7.50 ± 0.209.90 ± 0.80 7.4 ± 0.312.1 ± 0.6
Available P (kg/ha)16.7 ± 0.414.5 ± 1.1 16.5 ± 0.522.1 ± 0.8 13.0 ± 0.922.7 ± 0.6 17.8 ± 1.220.3 ± 0.5
Macroaggregate > 2 mm (%)76.2 ± 1.283.4 ± 1.595.6 ± 3.452.4 ± 2.250.5 ± 4.237.8 ± 2.439.3 ± 9.927.5 ± 7.8
Microaggregates < 2 mm (%)23.6 ± 3.216.5 ± 0.94.40 ± 1.0047.6 ± 3.650.1 ± 11.262.0 ± 10.660.3 ± 11.771.8 ± 14.6
MWD (mm)3.97 ± 0.904.27 ± 1.104.80 ± 0.83.20 ± 0.42.85 ± 1.002.41 ± 0.502.37 ± 1.31.38 ± 0.80
EC represents electrical conductivity, BD represents bulk density, FC represents field capacity, PWP represents permanent wilting point, P represents phosphorus, AAC represents aggregate-associated organic carbon, MWD represents mean weight diameter; data represent mean ± standard error of three replications for different land use systems. SL represents sandy loam.
Table 2. Microbial viable cell counts (cfu g−1 soil) as affected by different land use systems and soil depth.
0–15 cm Soil Depth
Land UseBacteria (× 106)Fungus (× 103)Actinobacteria (× 104)Anaerobic (× 104)
Agroforestry5.0010.00.302.00
Grassland18.02.003.0010.6
Agriculture8.007.0070.003.90
Eroded12.02.000.600.80
  LSD (0.05)2.601.609.493.22
15–30 cm Soil Depth
Agroforestry3.001.000.100.90
Grassland3.001.001.201.90
Agriculture3.00-0.2020.6
Eroded2.00-1.401.40
  LSD (0.05)NS0.590.535.83
Data represents the mean of four replications for each land use. The LSD (p = 0.05) represents the least significant difference (LSD) at 5% level of significance by analysis of variance (ANOVA) using completely randomized design to analyze the significant differences of a particular microbial community within different land uses.
Table 3. Bacterial viable cell counts as affected by different land uses and soil depth.
0–15 cm Soil Depth
Land UseTri calcium Solubilizers (× 103)Fluorescent Pseudomonas (× 104)Azotobacter (× 104)Rhizobium (× 104)Agrobacterium (× 104)
Agroforestry10.7540.09.251.153.15
Grassland5.5013.511.512.332.8
Agriculture1.757.005.753.507.00
Eroded14.31.004.503.0514.0
LSD (0.05)5.755.002.333.292.38
15–30 cm Soil Depth
Agroforestry5.005.6031.510.23.10
Grassland0.180.234.235.2530.3
Agriculture0.883.7536.50.481.75
Eroded9.504.253.500.805.20
LSD (0.05)5.253.006.714.343.29
Data represents the mean of four replications for each land use. The LSD (p = 0.05) represents the least significant difference (LSD) at 5% level of significance by analysis of variance (ANOVA) using completely randomized design.

