1. Introduction
Among the various forms of aid from the European Structural and Investment Funds (ESIF) of the European Union (EU), several are aimed towards achieving economic development and maintaining the population of crisis villages mainly located in rural areas. One form of aid targeted towards rural development is applied under the LEADER (
Liaisons entre Actions de Développement de l’Économie Rural) Approach. This paper analyzes its implementation in two rural and border regions of southwest Europe (i.e., Extremadura of Spain and Alentejo of Portugal) during the last programming period (2007–2013). These are two areas with the lowest economic development in the EU having a GDP that is 75% below the European average [
1,
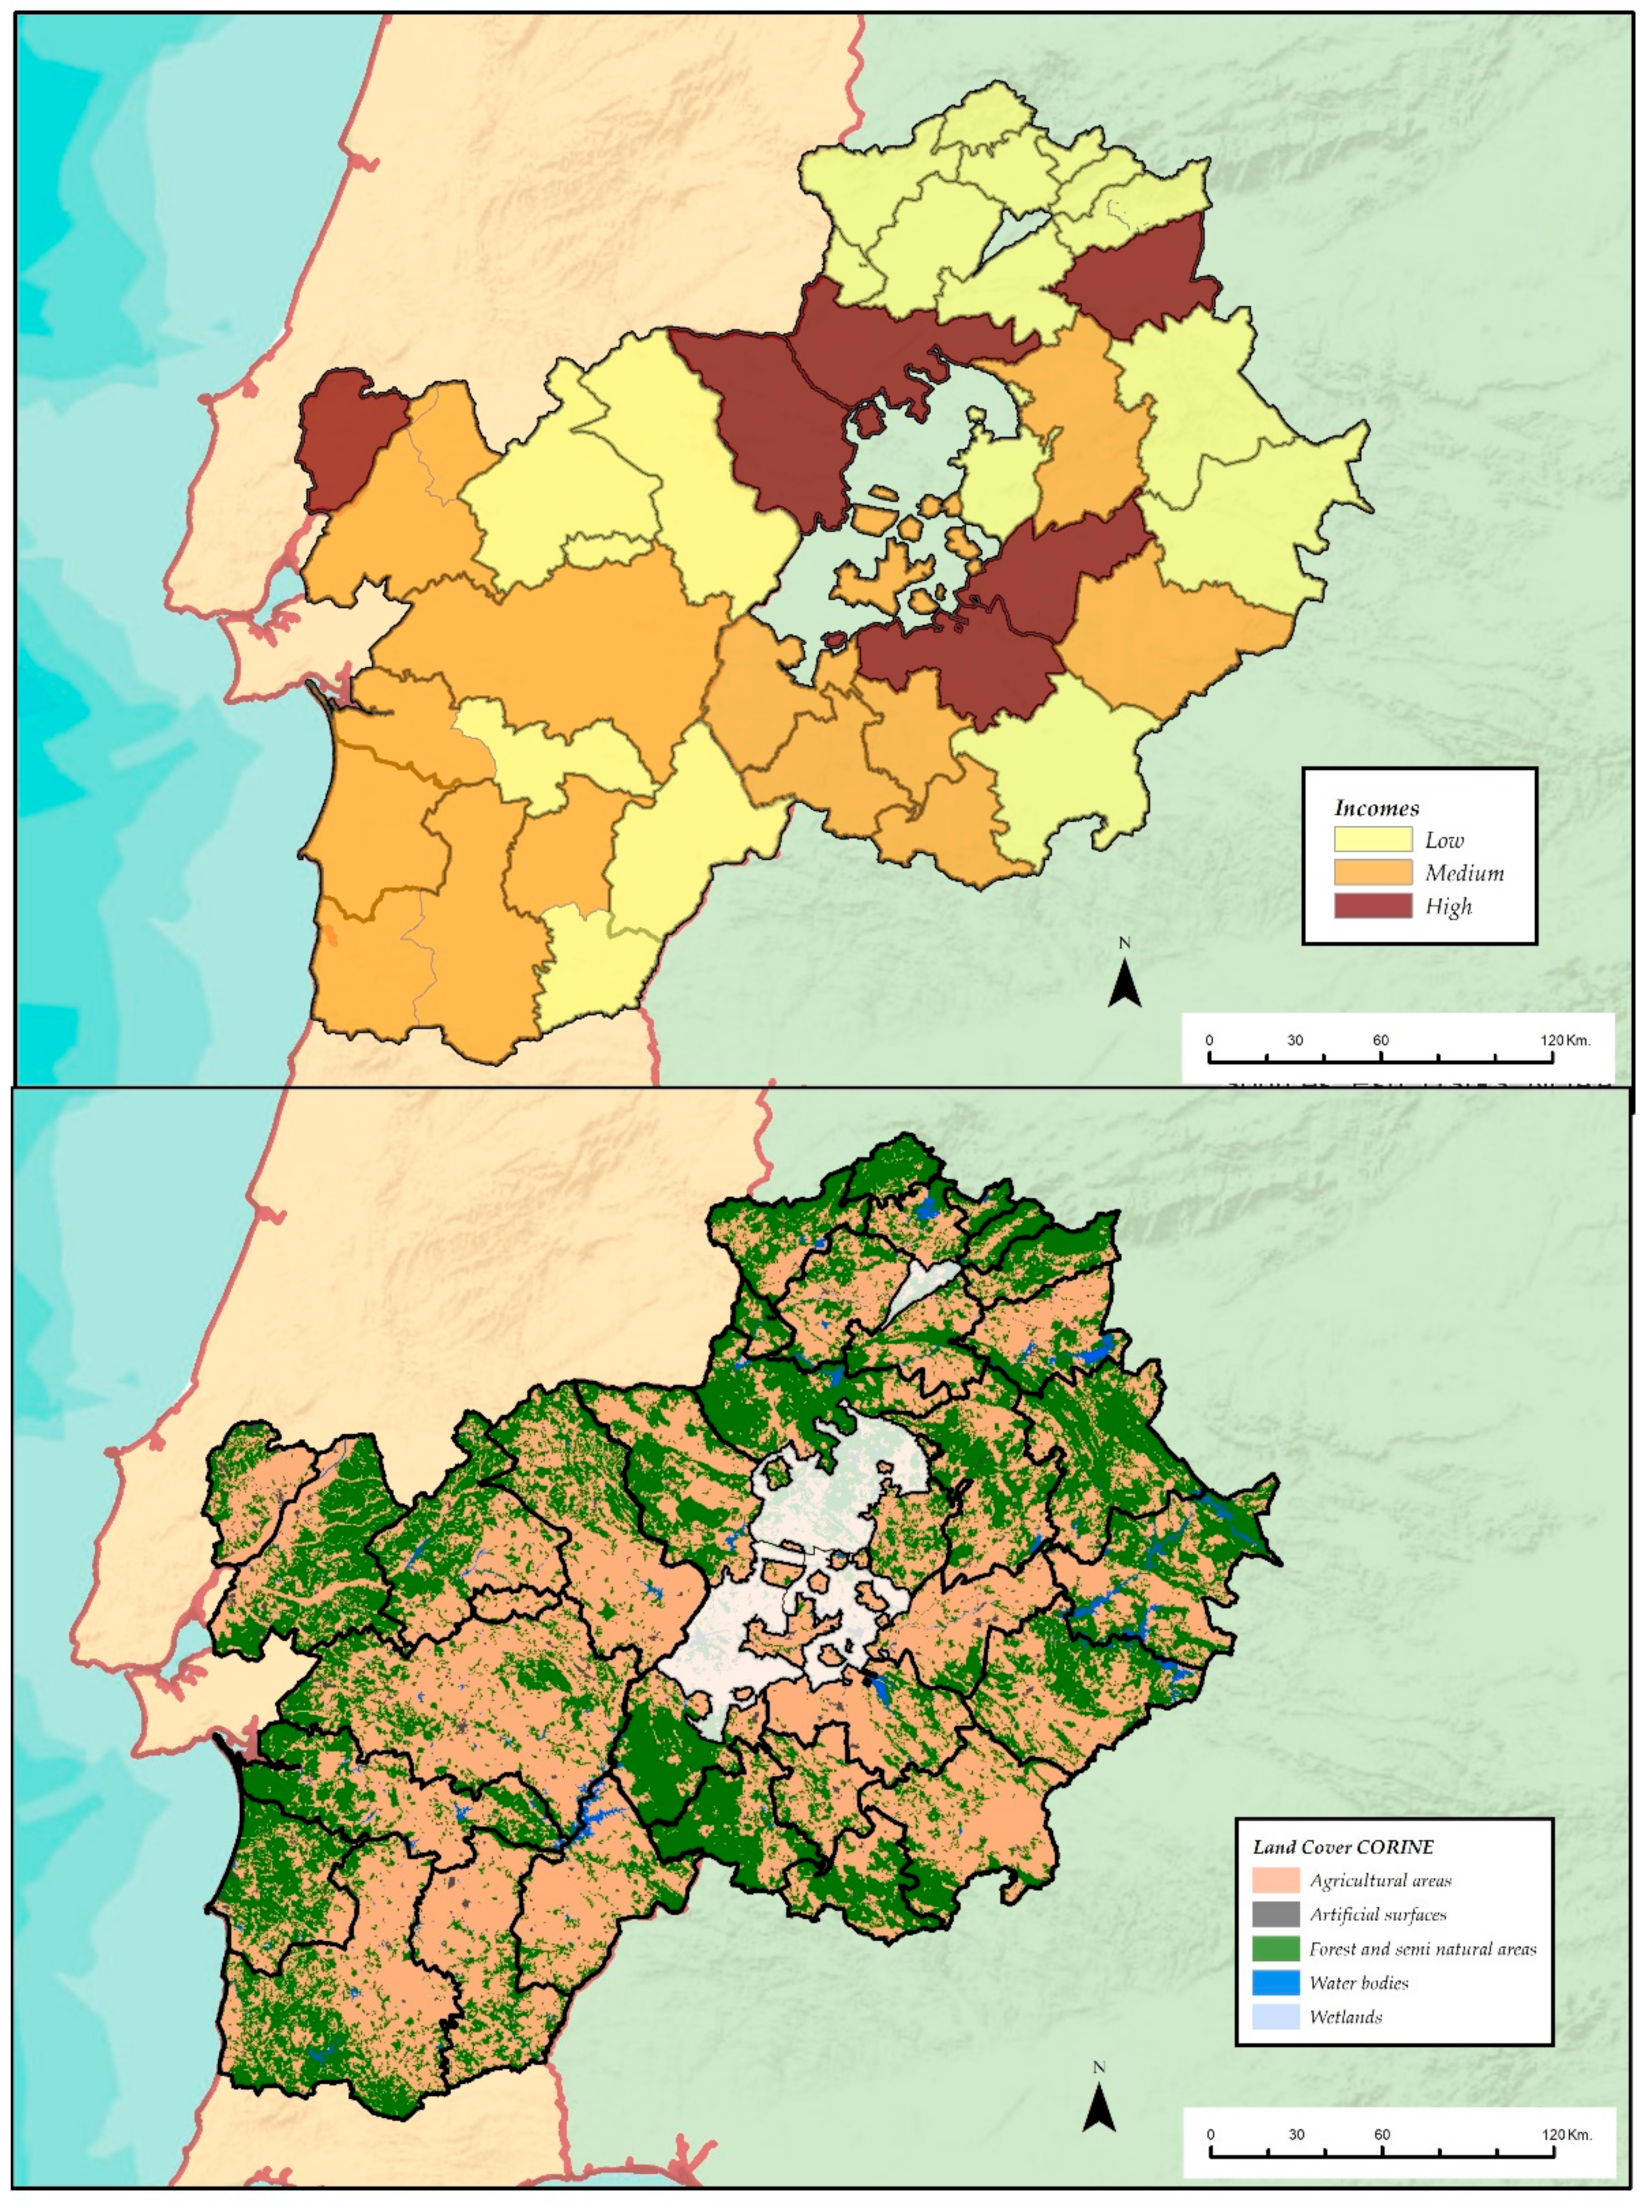
2]. They have mainly agricultural incomes, which generate a low productivity, and have industrial and service sectors, which are weak in terms of economic profitability and very dependent on public administration. In addition, they are experiencing significant population losses in recent decades due to a low birth rate and a high migration rate of young individuals who move to urban areas for greater employment opportunities.
Both regions have great natural wealth and consequently they have numerous protected areas within the Natura 2000 network and a common area of inland coast, such as the Alqueva reservoir [
3]. They have a great historical legacy (e.g., the border-bulwarked cities) that can be an opportunity for development if properly exploited and strategically enhanced.
The LEADER Approach is a means to promote the economic and demographic development of areas such as those analyzed in this paper. It is a European aid management model that receives funding from the EAFRD (European Agricultural Fund for Rural Development), national public administrations and various private agents. They have the main objective of promoting the diversification of non-agricultural activities and developing service micro-enterprises dedicated to tourism, the revaluation of heritage, agro-industry, and new technologies [
4]. This is realized through the co-financing of productive and non-productive projects among the different LEADER actors (European funds, national public administrations and private participation).
The LEADER Approach is a model of good practice for public and private initiatives [
5]. Its main purpose is to diversify production, increase competitiveness, and maximize human resources through increasing the power of local communities [
6] with the creation of Local Action Groups (LAGs). LAGs are associations formed by local councils, cooperatives, entrepreneur groups, associations, and local self-employed individuals. They implement the local development strategy of their territory [
7] by designing and executing the activities that it finances [
8]. Nowadays, there are 24 LAGs in Extremadura and 10 in Alentejo.
The LEADER Approach has been operating throughout the EU since the 1990s. It has obtained positive results in different French regions through the development of sustainable agriculture related to agritourism and rural tourism [
9,
10]. There are also cases in the Mediterranean basin [
11] where particular products are promoted, such as the olive groves or the vineyards in the Italian region of Emilia-Romana [
12] and the Portuguese regions of the Douro Valley [
13], as well as the cherry trees in Valle del Jerte of Extremadura [
14]. Additionally, the LEADER Approach has contributed to the development of the tourism sector through the creation of interesting hotel infrastructure in the Greek regions of Halkidiki [
15] and Crete [
16]. This was similarly done in areas of Spain such as in northwest Murcia [
17], in the Valencian Community [
18], and in Andalucía [
19,
20].
The benefits of the LEADER Approach in European rural areas are clear, particularly because it gives the population an opportunity to participate in the creation and implementation of development strategies. Several authors analyzed LEADER in various European regions, either by studying the results at a quantitative level (mainly through the number of projects executed [
21,
22,
23,
24]), or by qualitatively investigating the social aspect of the approach. For example, Mondéjar et al. [
25] stated that LEADER does not arise exclusively for the attainment of quantifiable economic or social objectives, but as a laboratory of ideas with which to experiment innovation and transfer results. In this sense, Navarro et al. [
26,
27] studied innovative projects in Lecce (Italy) and Granada (Spain) and examine the impact of local participation with LEADER Approach by means of surveys of LAG managers in two areas in Spain (Andalusia) and UK (Wales). Social capital derived from LEADER was measured by Wojewódzka-Wiewiórska et al. [
28]. In the case of Alentejo, one of the study regions of this paper, there are not many studies about the impact of LEADER Approach, but on Portugal’s rural development policy in general. For this reason, the works of Santos et al. [
29] and Neto et al. [
30] are significant, in which they analyzed the subsided firm’s survival and the impact of local networks of public policies such as LEADER for entrepreneurships and innovation.
However, LEADER receives little funding compared to other European policies such as the Common Agricultural Policy (CAP), thus it cannot change the regressive demographic behavior of rural regions such as Extremadura and Alentejo, taking into account that these are two of the regions with less economic development in the EU. Given this affirmation, the main objective of this paper is to look for correlations between the location of projects and investments of the LEADER Approach and demographic variables of Extremadura and Alentejo. Then, the purpose is to verify if there is positive discrimination in the distribution of investments and private participation because they are concentrated in the most demographically dynamic areas, as has been confirmed in other Spanish regions [
27,
31,
32].
To achieve the objective presented, GIS software is used as a tool to obtain appropriate cartographic outputs. In addition, the SPSS software is employed as a statistical analysis tool. The methodological approach of this research is limited to the Principal Component Analysis (PCA). With this method, the chosen variables as representative of Extremadura and Alentejo are weighted, in such a way that quantitative values are assigned to all the related factors, resulting in a composite qualification that can be used for comparison purposes [
33]. Despite the great success and the vast amount of applications that include the PCA as part of its operation, there are drawbacks in its use. The main disadvantage lies in the fact that each main component is a linear combination of all the original variables, which makes it very difficult to analyze the importance of each original variable in the new space [
34].
As a new contribution to the already existing studies, in this paper, a statistical analysis of the investments, number of projects and their relation with demographic context variables is carried out in two regions from different countries but with enormous geographical similarities. In addition, taking into account that each European region benefiting from rural development aid (2007–2013) has chosen the action measures with which to act on its territory of action, this paper presents a homogenization of them, which can be extrapolated to other European regions.
Hereafter, the materials and methods of this paper are presented, followed by
Section 3 in which the results obtained are shown. Then, the results are discussed in
Section 4. Finally,
Section 5 presents the conclusions.
2. Materials and Methods
2.1. Study Area
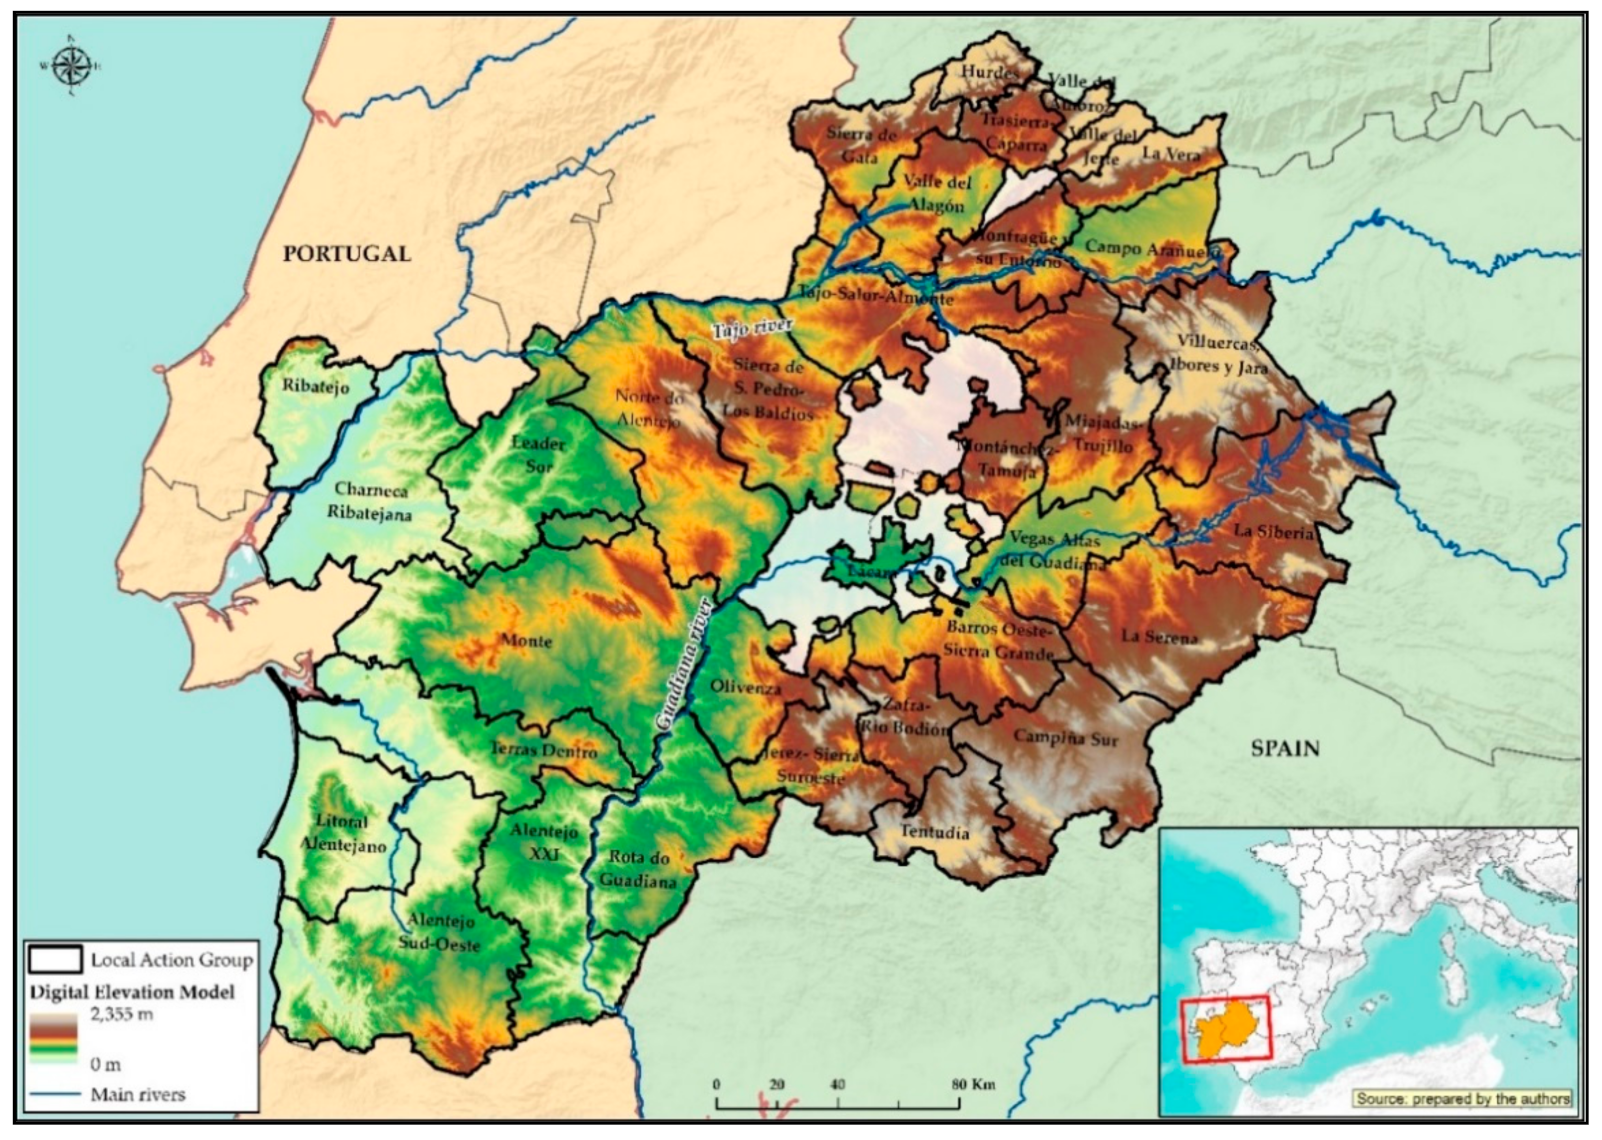
The study area of this paper (
Figure 1) is represented by two regions, Extremadura (SW Spain) and Alentejo (SC Portugal), both forming a border of 73,185 km
2 [
35]. Characteristic to both regions is the scarce territorial occupation and its distance to the main Spanish and Portuguese economic centers, with important socioeconomic deficiencies in relation to the rest of the Iberian Peninsula [
36]. Some authors, such us [
35,
37] consider that the scarce socio-economic development of the two regions is mainly due to the inadequate exploitation of their lands, the little productive transformation of their primary resources, the underdevelopment of infrastructures, the small population and the low demographic density. These last ones are accentuated by the rural exodus suffered from the 1950s to the end of the 1970s.
On the one hand, Extremadura is placed in the west of Spain with a surface area of 40,000 km
2, over 1 million inhabitants spread across 388 municipalities, a population density of 27 inhabitants/km
2 and most of the population concentrated in the major towns [
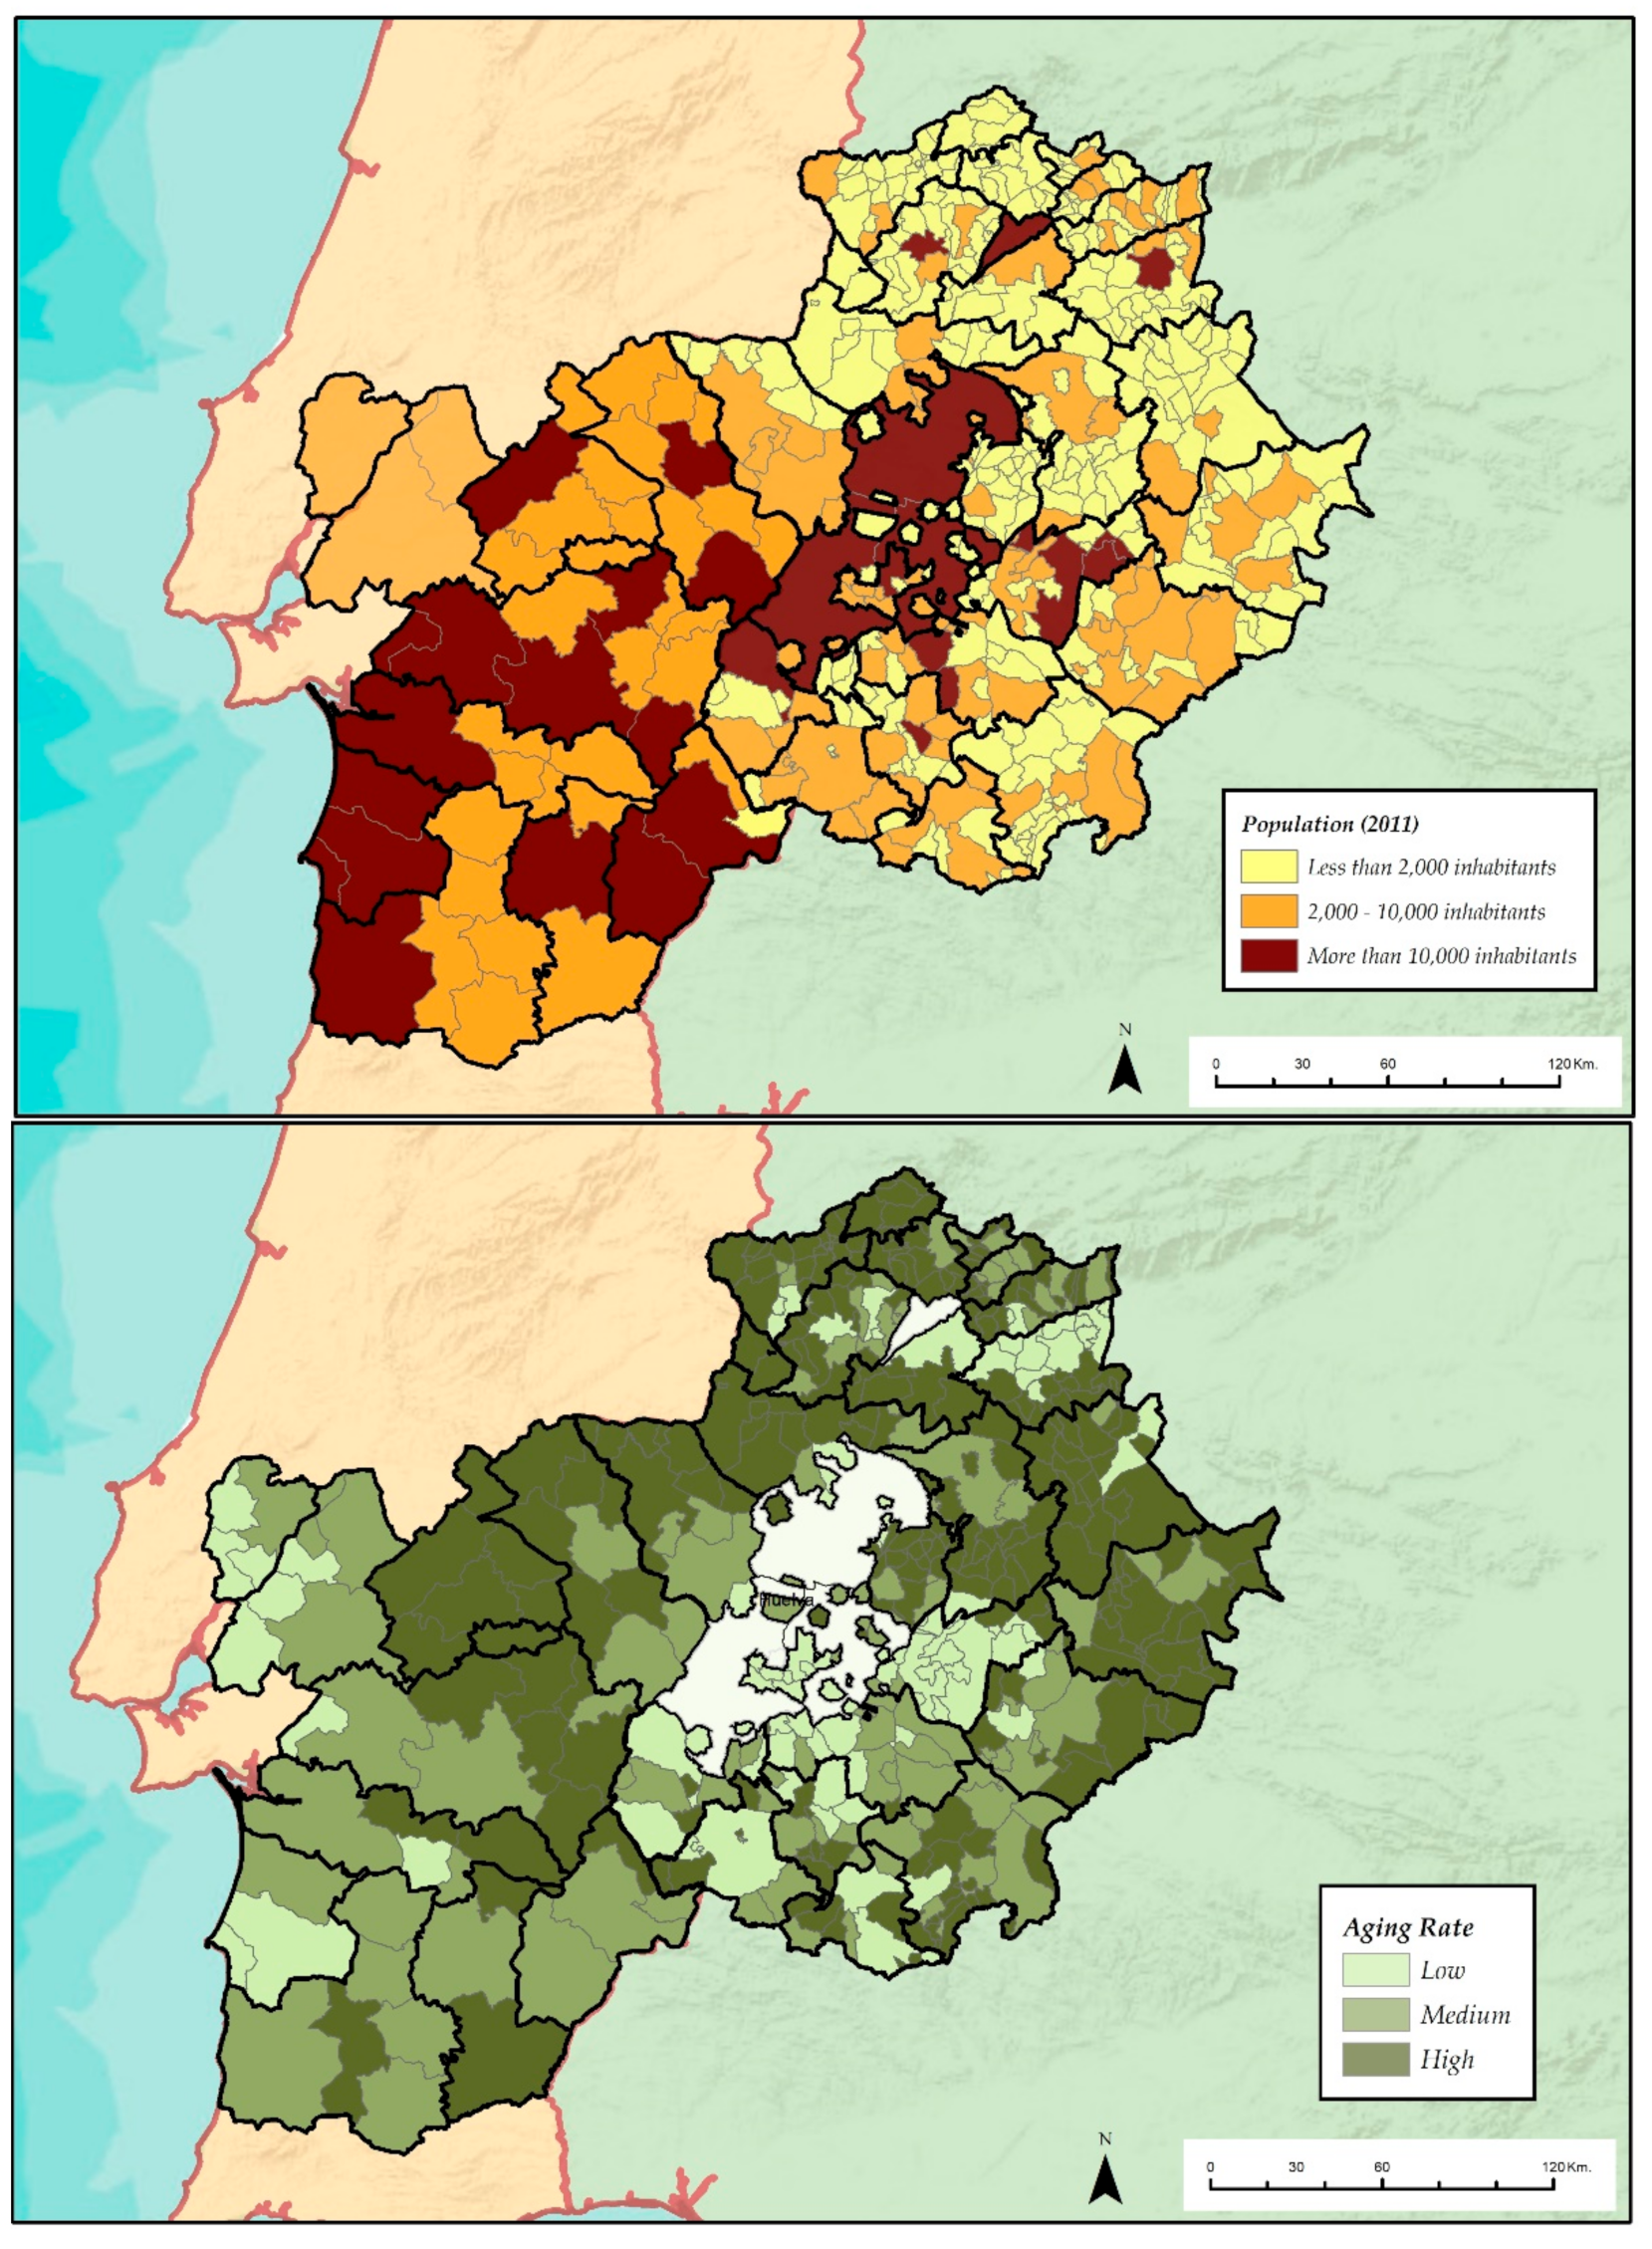
38]. Nevertheless, it is necessary to note that Extremadura has the two largest provinces of Spain, long distances between its ends and an intensive emigration process suffered in previous decades. This region has numerous territories with different territorial, demographic and economic characteristics (
Figure 2 and
Figure 3).
In the northern part (Sierra de Gata, Las Hurdes, Trasierra-Cáparra, Valle del Ambroz and Valle del Jerte), there are mountainous areas with a discrete population in small towns that usually do not exceed 1000 inhabitants. Their economic activity is based on smallholder and subsistence crops due to physical difficulties of the territory to be agriculturally exploited. Besides, another economic activity that they have promoted in the last decades is rural tourism thanks to the exploitation of rich natural and historical heritage.
Further to the south, there are the LAGs of Valle del Alagón, La Vera and Campo Arañuelo, which are situated in irrigated sedimentary basins with a small-established agroindustry. Then, there are the regions of Monfragüe, Sierra de San Pedro-Los Baldíos, Montánchez-Tamuja, Miajadas-Trujillo and Villuercas, Ibores and Jara. These are the territories with the lowest population densities that do not exceed 10 Inhabitants/km2 and with low economic development due to a low productive agriculture because their poor soils, except for some irrigated municipalities in the LAG of Miajadas-Trujillo.
Another of the most developed axes is located in the center of the region and is formed by
Vegas Altas del Guadiana and
Barros Oeste-Sierra Grande, where the most services and population (60% of the region) are concentrated. They are territories with irrigated areas and productive dry land of vine and olive tree, as well as located around the main routes of the region [
39]. In the east and southeast, there are very unpopulated and traditionally isolated areas where extensive cattle ranching and the exploitations of pastures and cereals are the main economic activity. These are
La Siberia,
La Serena and
Campiña Sur. Finally, the exploitation of pasturelands and the breeding of Iberian pigs characterize the southwest of Extremadura. Here,
Olivenza,
Jerez-Sierra Suroeste, Zafra-Río Bodión and
Tentudía are placed, which are traditional underdeveloped areas but with an incipient industrial activity that is generating dynamism in the last years.
On the other hand, the Portuguese region of Alentejo is located in the southwestern area of Portugal (
Figure 1) and has an area of 31,100 km
2, which is one third of the country’s surface and a population of 750,000 inhabitants according to the latest population census. This represents less than 7% of the national population in Portugal, resulting in a reduced population density (24 inhabitants/km
2) compared to the national average (114.5 inhabitants/km
2) and with the rest of the border regions with Spain. Although Alentejo, similar to Extremadura, is located in a strategic position with respect to the main peninsular economic activity centers (Madrid, Seville, Lisbon, Porto, etc.), the historical location of the border in its context has been a barrier to its development, economically, socially and culturally. Thus, it is a territory with a GDP below 75% of the European average (73.9%) [
40].
As in Extremadura, there are mountainous areas that contrast with wide plains and valleys that safeguard valuable river channels. These last areas are the most representative (Leader Sor, Charneca Ribatejana, Ribatejo, Alentejo Sudoeste, Terras Dentro and Alentejo XXI) with the lowest elevations in Litoral Alentejano. The mountainous areas, although with low altitude, are in the most northern area and east (Norte do Alentejo, Monte and Rota do Guadiana) and south of Alentejo Sud-Oeste.
Taking as a reference the limit of 10,000 inhabitants, 85% of the counties of Alentejo have a population below that limit, being Évora (Monte) the city with the largest population (56,000 inhabitants). In addition, in Alentejo, the population is concentrated in the most developed centers, such as Sines (Litoral Alentejano), Portalegre (Norte do Alentejo) and Vendas Novas and Borba, both in Monte.
The Alentejo coast (Litoral Alentejano, Ribatejo and Charneca Ribatejana) presents the best values in terms of demographic variables such as the mortality and birth rates, being, at the same time, the most accessible area to the main Portuguese demographic and socioeconomic development centers due to its proximity to Lisbon.
2.2. Cartographic Database
The municipal cartographies of Extremadura and Alentejo were joined for their combined analysis. The sources for these were the National Geographic Institute of Spain (National Cartographic Base 1:200,000) and the Portuguese Cartographic Institute, which used the open data from the Portuguese Geographic Service and the Official Administrative Charter of Portugal. Other layers with relevant information were used, such as the outline of the Spanish provinces and the Portuguese districts, the layers of rivers and reservoirs, the communication routes (i.e., roads and railways) and the contour lines to obtain the relief.
2.3. Alphanumeric Database
An alphanumeric database that collects characteristic variables of the territories of Alentejo and Extremadura, as well as LEADER in the 2007–2013 programming period was created.
On the one hand, projects and investments of LEADER were compiled at the LAG level according to different sub-measures of the EAFRD. The sub-measures were grouped into seven actions groups, following the methodology developed in previous papers about Extremadura by Nieto and Cárdenas [
8,
41]. The action groups are:
Action 1. Operating costs. This action groups projects dedicated to the acquisition of capacities and promotion towards the processing and application of a local strategy, as well as to the economic maintenance of the staffs of the LAGs.
Action 2. Training and Employment. This action is formed by projects to the training and formation for economic agents and enterprises.
Action 3. Tourism. This action subsidizes projects regarding the development of tourist activities.
Action 4. SMEs. This action groups projects concerning the diversification of new activities as the creation and development of micro-enterprises, handicraft and other services to improve the quality of life.
Action 5. Agrarian valorization. This action is formed by projects regarding the increase of competitiveness and the commercialization of the agricultural and forestry sector.
Action 6. Heritage. This action is dedicated to the development of basic services for the rural population and the conservation and valorization of natural and cultural heritage resources.
Action 7. Cooperation. This action groups projects about the implementation of cooperation projects and the creation of thematic networks.
Data on projects and investments were obtained from the rural development networks of both countries and regions (i.e.,
www.rederural.pt and
www.redex.es) and from regional governments. All information on individual projects was obtained at the local level but it was grouped according to the LAG involved. Difficulties were faced in managing the Portuguese data since the limits of some LAGs do not match with the limits of
concelhos (or municipalities). This means that there are LAGs formed by towns from different municipalities. This is true concerning five LAGs, namely
Norte do Alentejo,
Alentejo Sudoeste,
Monte,
Rota do Guadiana, and
Alentejo XXI.
In the statistical analysis, the non-productive measures (Actions 1, 2, 6 and 7) were not considered given that, in the case of Actions 2 and 7, they are not sufficiently representative due to their small volume of investment and number of projects. Action 1, being dedicated to the maintenance and the acquisition of capacities of the technical teams of the LAGs, and Action 6, dedicated to Heritage, were not included because they depend excessively on the investments of the councils. In short, the purpose of this paper is to analyze investments with the most private participation.
2.4. Statistical Analysis
PCA was used as a statistical process to study the correlations between LEADER investments and demographic variables in Alentejo and Extremadura regions.
Previous analyses were carried out with other context variables such as unemployment, irrigated crops, vineyards and olive groves and wealth indicators, but the results were not significant. Economic variables such as GDP/inhabit in the Spanish case and buying power in the Portuguese case were added to the database in a homogenized way but they provided very little explanation and thus were deleted. Furthermore, unemployment rate was also eliminated because it had very high values in all LAGs, thus it distorted the sample. The investments by measures calculated with respect to the total investments of the LAG were discarded in the analysis due to redundancy between them. Thus, it was decided to add the investments by population because they have a greater explanation factor. Finally, the agrarian variables, such as irrigated areas, vine and olive tree, did not add significance either. This is due to the territorial diversity of some LAGs, in which there are villages very dedicated to the exploitation of irrigated land and, at the same time, others that do not, as in the LAGs of Campo Arañuelo, Villuercas, Ibores and Jara and Miajadas-Trujillo.
PCA is a factorial analysis method that consists in carrying out a linear combination of the variables and extracting principal components that represent co-related variables groups. In this way, the first principal component is the combination that explains the highest variance, then, the second highest, and the following components explain progressively lesser proportions of the variance [
42]. In addition, it permits for the extraction of latent magnitudes of a set of variables and the shrinkage of the vector space, which is defined by an extensive set of original variables, to a minor number of factors independent of each other, which are ordered by explanatory power [
43,
44].
To inquire into the origins of this analysis, we must bear in mind the classic research by Krzanowski and Flury, who investigated the principal components common to several different populations, and Jolicoeur and Mosimann’s study on the size and shape of animals [
45]. In this sense, PCA is the most widespread and common method of extracting factors, as well as principal components, in the past decades in the field of social sciences and it is commonly chosen over other existing extraction methods due to its functionality.
Several variables representative of the demographic and rural development realities of Alentejo and Extremadura were introduced to know their cause–effect relationships. Nonetheless, to perform the PCA analysis, the variables had to be objective and neutral, thus all of them were relativized in rates or percentages. All necessary prospective analyses were carried out until reaching an initial matrix that was considered ideal. Thus, variables with a coefficient less than 0.3 were removed because they were not statistically descriptive in the set [
46].
The question posed prior to carrying out a factor analysis is whether the original variables selected are correlated among themselves, because, if they are not, there would not exist common factors and the application of this analysis would not be appropriate. This question can be tackled and solved by so-called contrasts, i.e., the measure of sampling adequacy developed by Kaiser, Meyer and Olkin (KMO) as well as Barlett’s sphericity test [
47]. The latter was chosen in this occasion due to its effectiveness and reliability. Barlett’s sphericity test evaluates the applicability of factor analysis of the variables studied. The model is significant (we accept the null hypothesis, H
0) when the factorial analysis can be applied. If the null hypothesis is correct, the eigen values equal 1, or its logarithm will be null, and thus the outcome of the statistical test will be zero. Contrarily, if Bartlett’s test yields high values for χ
2, or a low determinant, there will be variables with high correlations. In short, whether the statistical test yields high values (or a determinant close to zero) the null hypothesis with a certain level of significance is rejected. If the null hypothesis is accepted, the variables are not interrelated and the application of PCA should be reconsidered. In this case, the results of Barlett’s sphericity test show that the variables are closely interrelated.
The variables finally used in the PCA are those that provide the greatest significance and explanation to the whole (
Table 1).
3. Results
First, in PCA analysis, values known as communalities are obtained for each variable. The communality (
h2) expresses the proportion of the total variance of the variable
x that is shared with the remaining
p − 1 variables observed and extracted with
m factors, where
m is the number of factor retained. If
m is equal to the total number of variables, communality is equal to 1 [
48].
In
Table 2, it can be seen how practically all variables have values higher than 0.684, up to 0.954, which shows a high explanation of the whole. The variables that refer to the total funding and projects regarding the population provide the greatest explanation, as well as the investments in Action 4 (SMEs) and the mortality rate. These four variables have weights higher than 0.840.
Total investments and projects, in relation to the population, are defining variables of the different behaviors of LEADER management, in such a way that there will be wide differences between investments and projects depending on whether they are LAGs with greater or smaller volume of population. The mortality rate, because of the aging of the population, is a factor that also conditions the structures of rural spaces. In opposition, the population growth is not so defining since a demographic crisis has been experienced in the years analyzed, accentuated by the economic crisis of both regions.
The LEADER action that results with the greatest explanation factor is the one dedicated to SMEs, crafts and services (Action 4), followed by tourism (Action 3). Action 5, aimed at the valorization of agricultural production, is the one that provides the least explanation. Finally, private participation, in the period 2007–2013, is not as significant as in previous periods due to the economic crisis. In this way, the mobilization of productive private agents has been equally minor in both the most dynamic and less developed territories of Alentejo and Extremadura.
Secondly, principal components are reached with their total variance explained (
Table 3). Taking into account the percentage of the variance explained, the first three components are the most demonstrative of the model (72.26%). This percentage is not an excessively high value because of the heterogeneity of the territories of the LAGs of both regions with respect to their physical, demographic, social and economic characteristics. However, it is appropriate to clarify the analyzed sample.
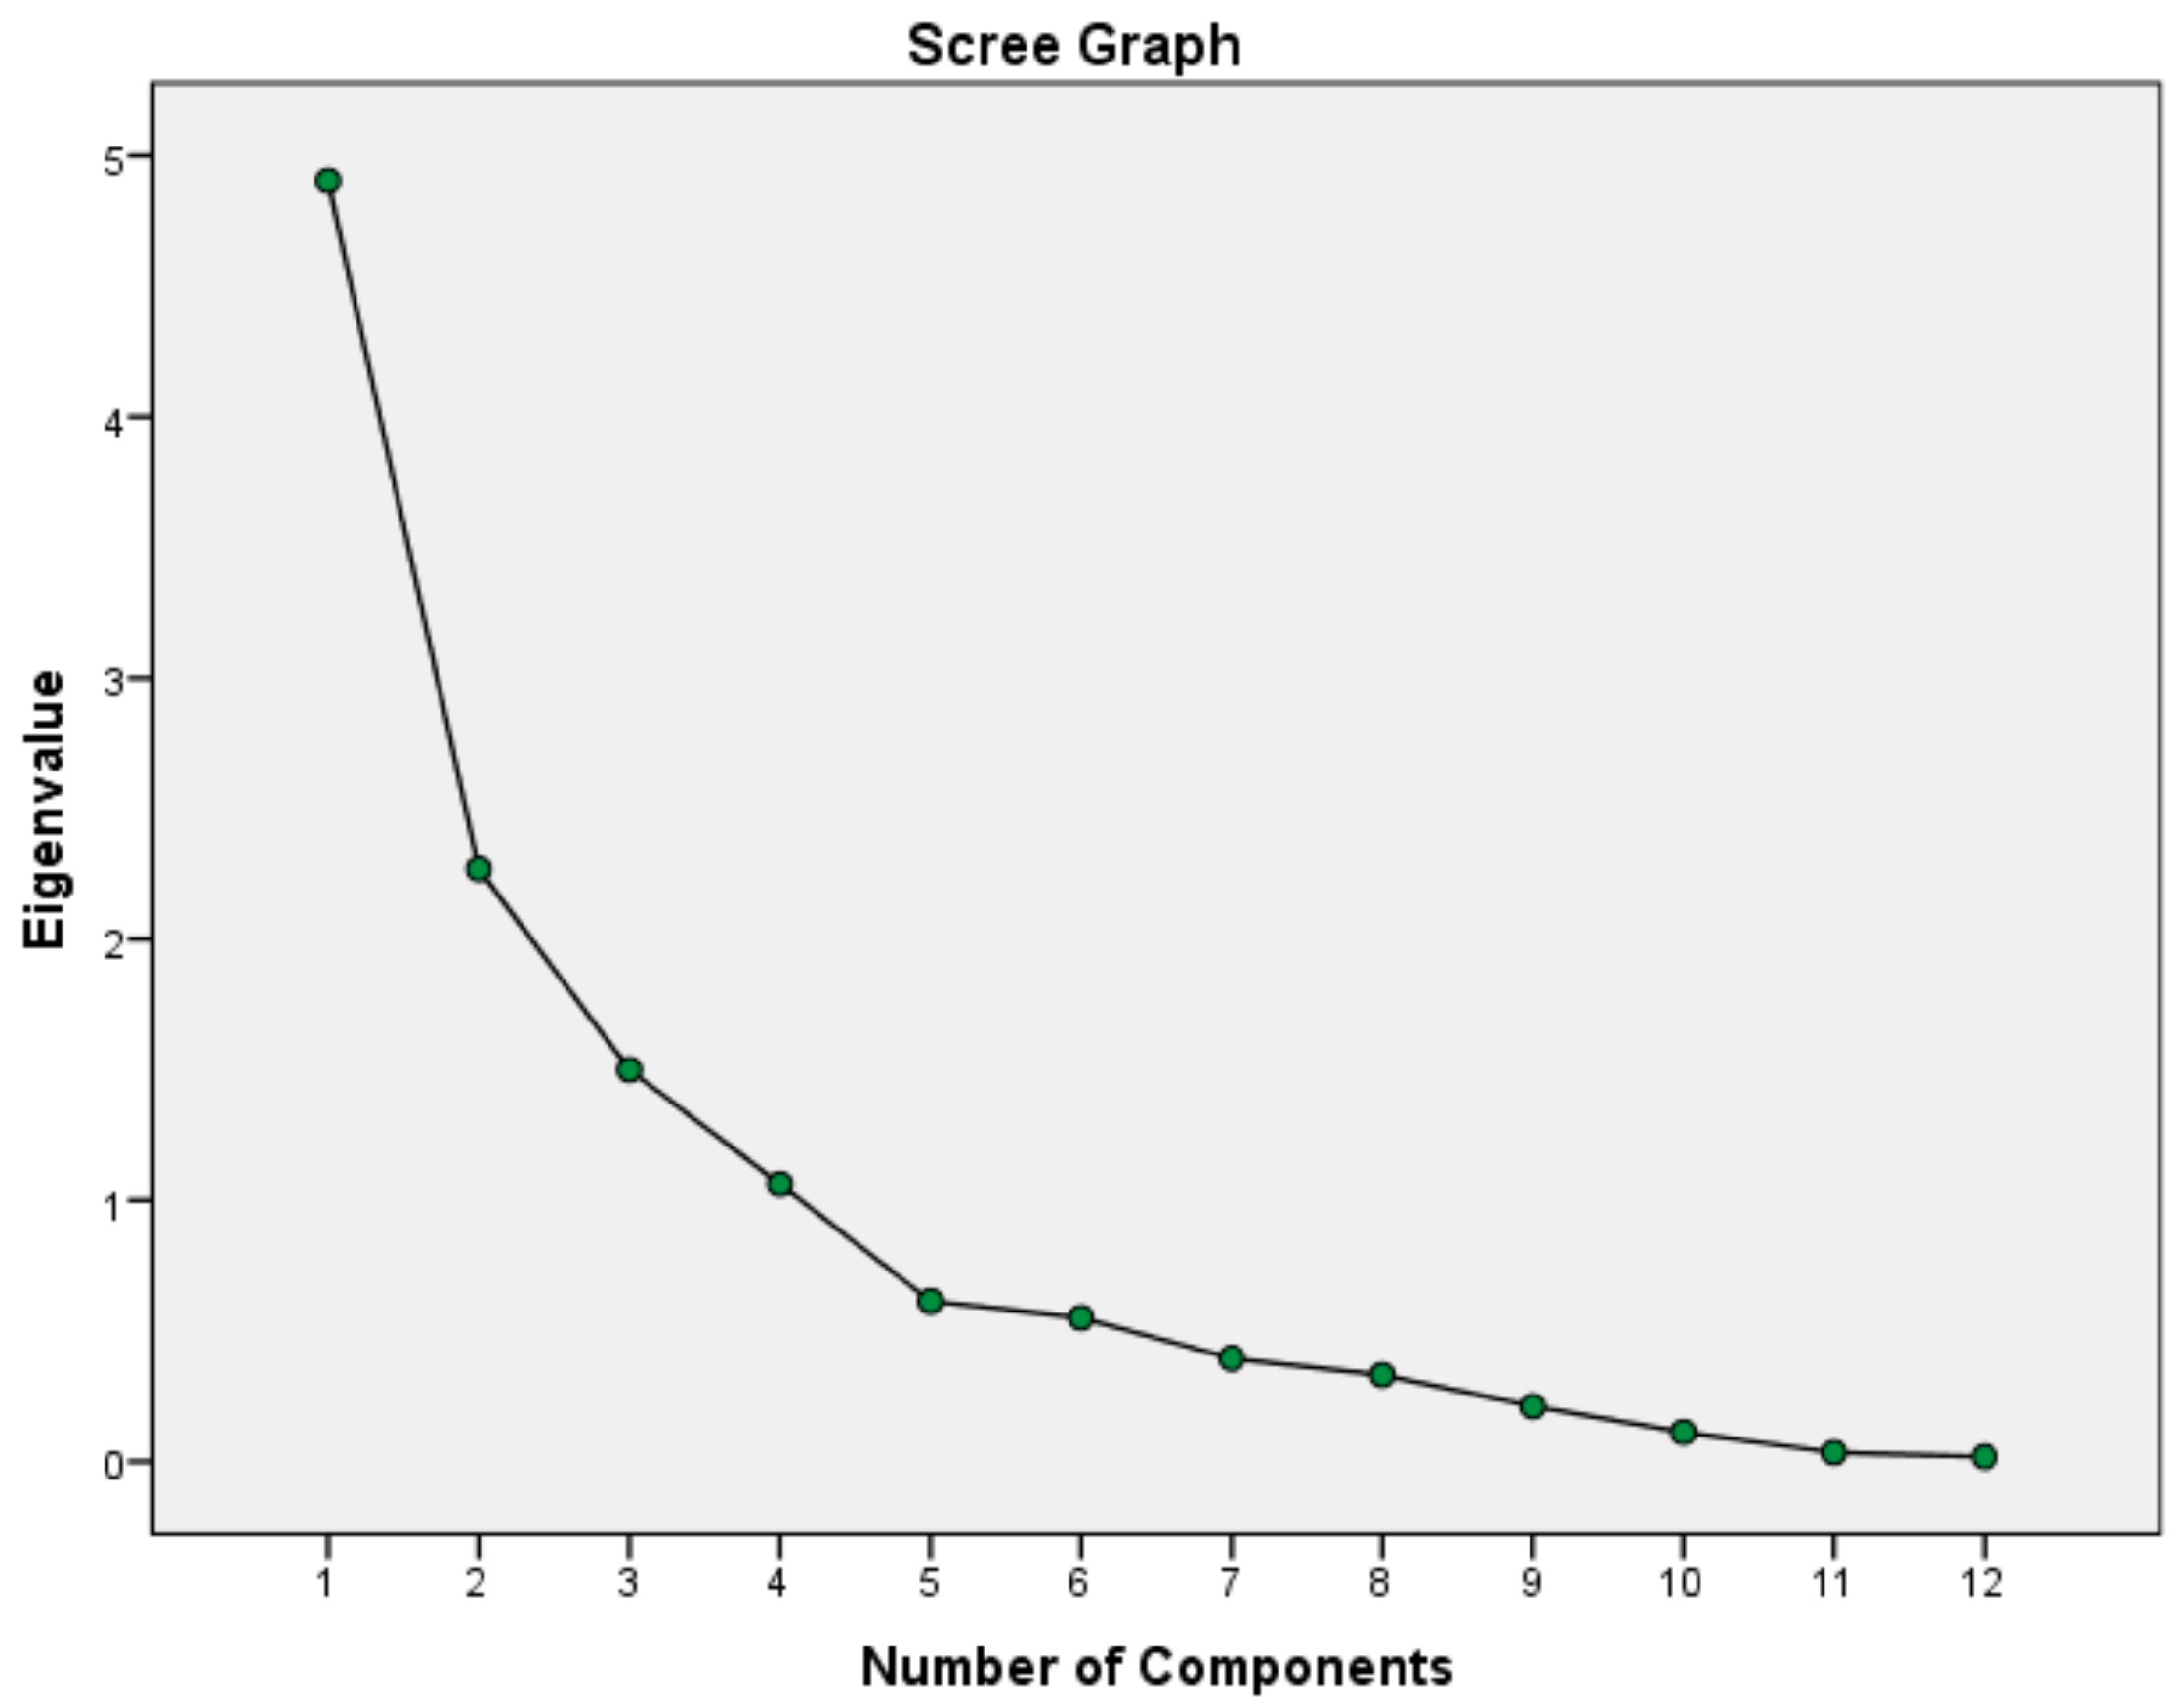
The high value of explanation of the first component must also be noted, which defines the different behaviors of LEADER with 40.87%. This is bolstered by the Scree graph (
Figure 4), in which the eigenvalues related to each component are represented [
46]. The turning point, at which the slope changes from being pronounced to a minimum, is taken as a signal of the number of components to be extracted (components whose eigenvalues are greater than 1). In this case, the slope starts to be subtler for Components 4 and 5, but a greater change is seen in the second one.
In
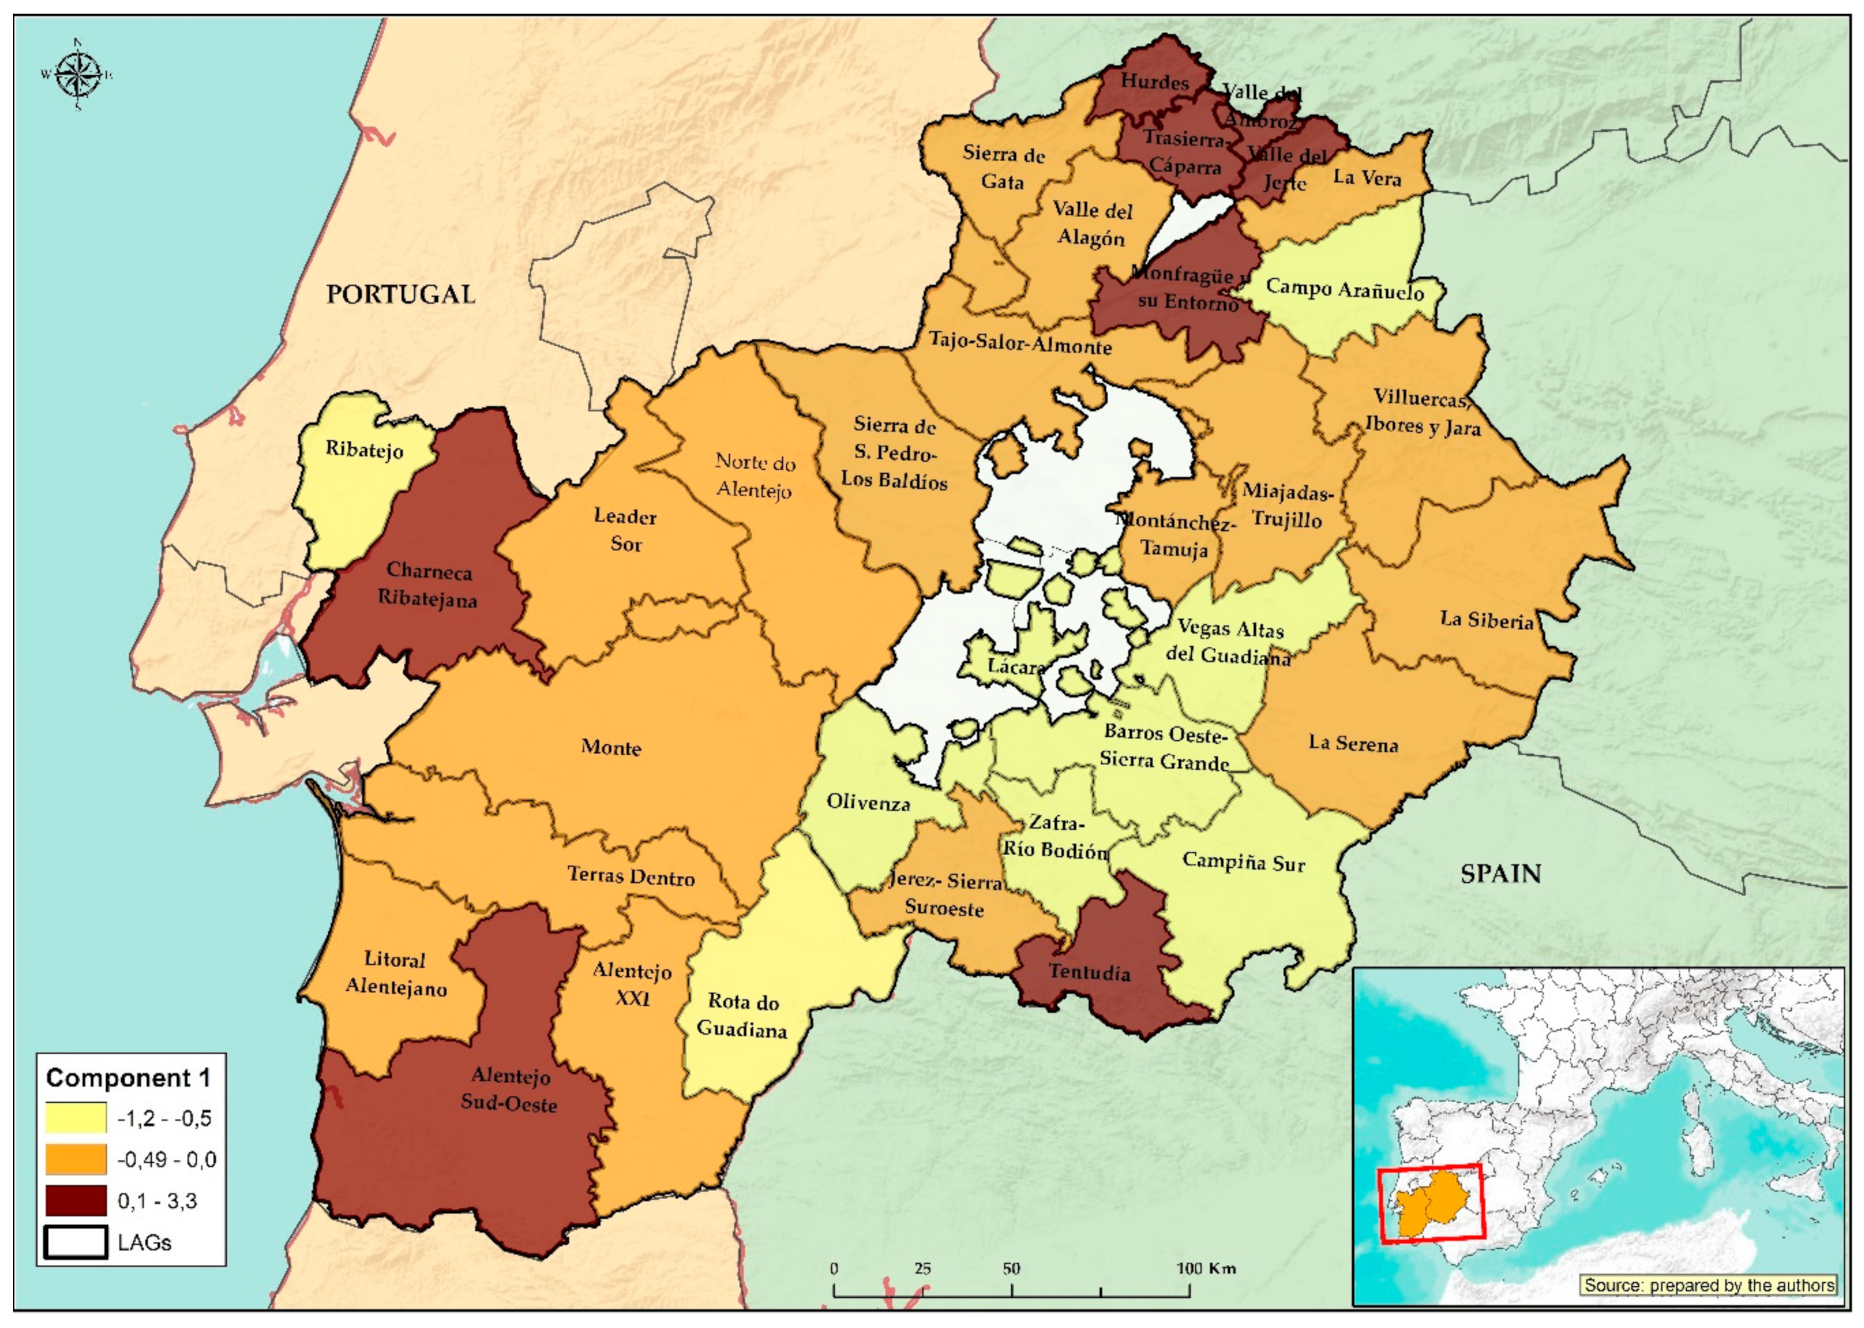
Table 4, the explaining factors of the variables in Component 1 are recorded and the LAGs of both territories are represented on a map with respect to it in
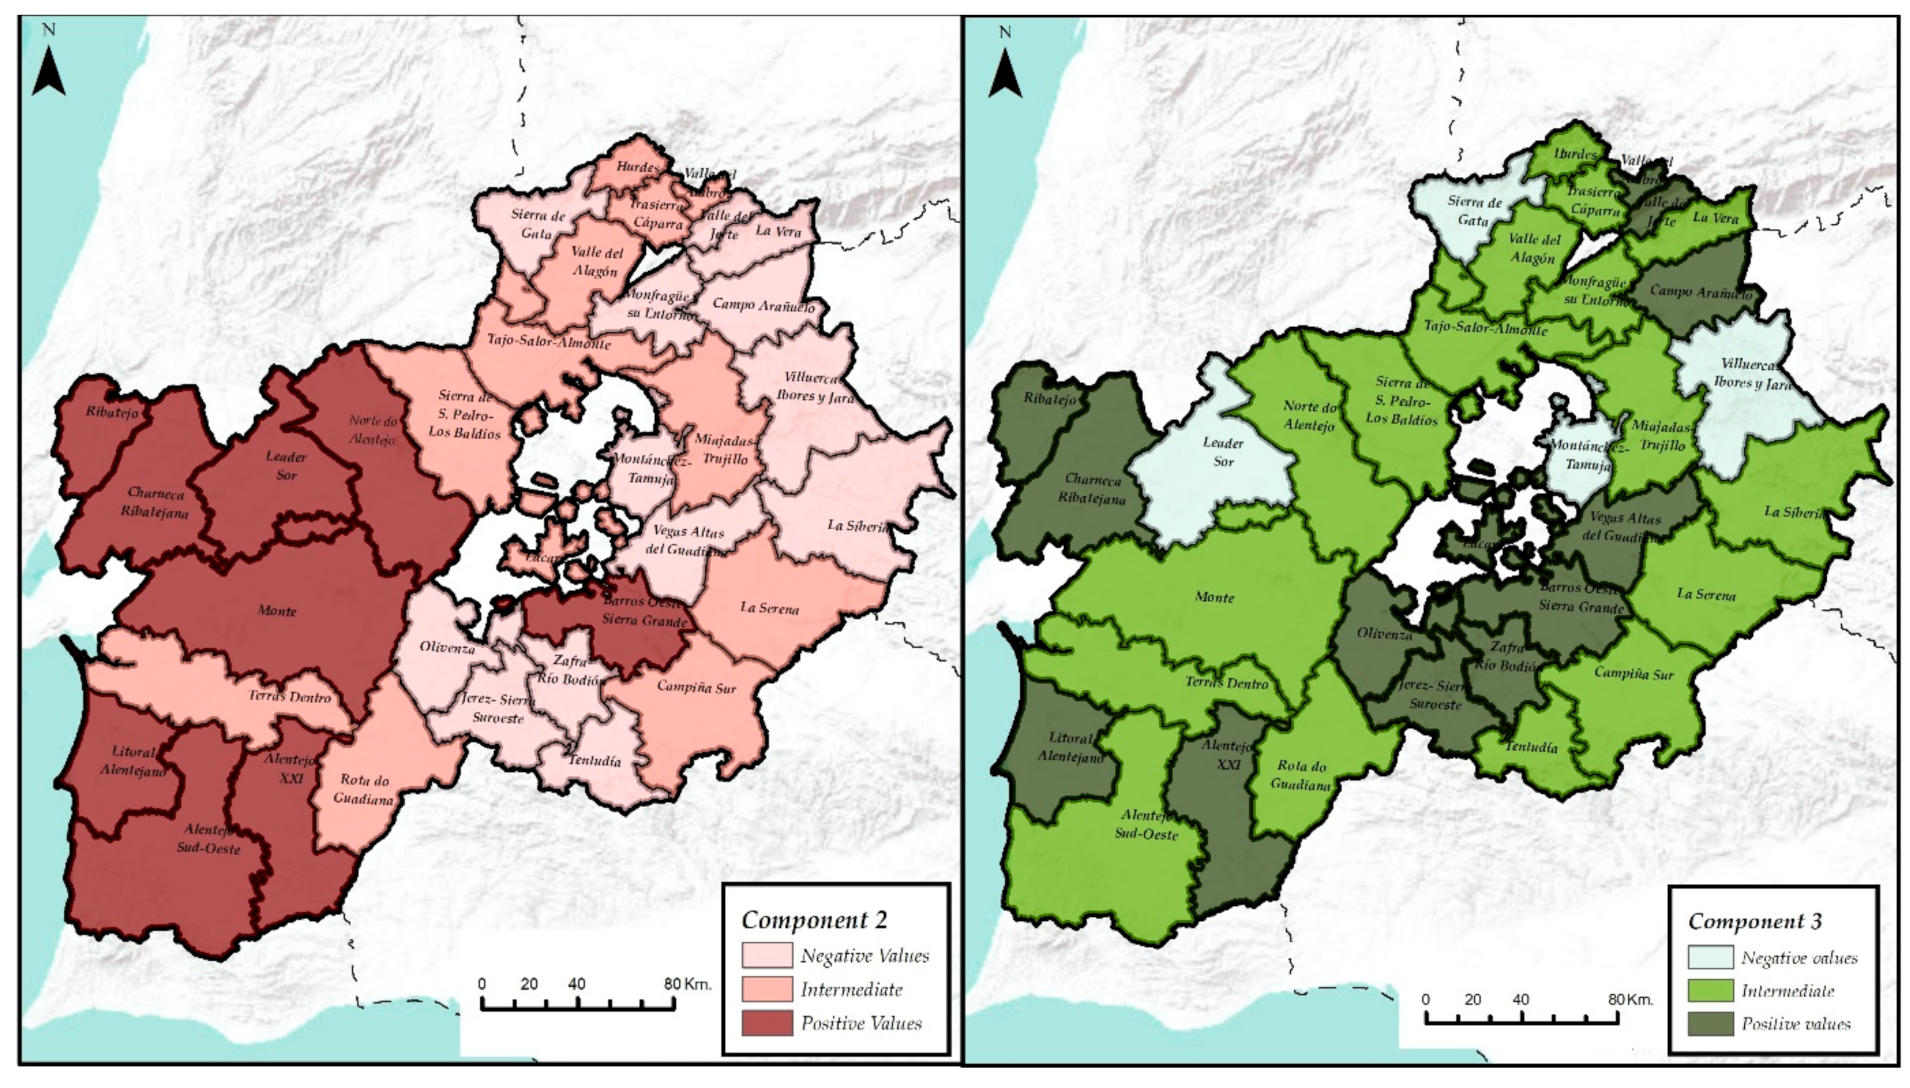
Figure 5. Then, Components 2 and 3 are symbolized “on the territory” to reinforce the results in
Figure 6.
Component 1 describes 40.87% of the sample and correlates most of the variables related to LEADER, particularly projects of the LAG and total investment, both per 1000 inhabitants. In the positive substructure of the first component, investments in productive actions by population appear, with Action 3 being the most defining (0.7), followed by Actions 4 and 5. The demographic variable that conditions these spaces is the mortality rate, although with a minor explanation factor due to the high aging rates of LAGs, especially those located in mountainous territories of northern Extremadura and in the interior of Alentejo. All these variables correlate to the LAGs of Hurdes, Valle del Ambroz, Trasierra-Cáparra, Valle del Jerte and Monfragüe y su entorno, in Extremadura, and Charneca and Al Sud-Esdime, in Alentejo.
Conversely, in the negative substructure of Component 1, the population (%) and birth rate variables appear with values higher than 0.75. They are followed by the variables referring to investments and projects with respect to the regional total investment, both with an explanation factor around 0.6 and, finally, population growth and private participation with values between 0.35 and 0.4. These variables correlate to the LAGs of Vegas Altas del Guadiana, Zafra-Río Bodión, Lácara, Campo Arañuelo, Villuercas, Ibores y Jara, and Barros Oeste- Sierra Grande, in Extremadura, and Rota do Guadiana and Ribadejo, in Alentejo.
There is a third intermediate group in Component 1 formed by LAGs located in border areas, both in the interior of Spain with Castilla-La Mancha and with Portugal, known as La Raya. These LAGs are Sierra de Gata, Sierra de San Pedro, La Vera, Tentudía or Villuercas, Ibores y Jara, La Siberia, La Serena and Campiña Sur, in Extremadura, and in Alentejo Litoral, Terras Dentro, Alentejo Sudoeste, Leader Sor and Alentejo XXI in the Portuguese region.
Finally, Components 2 and 3 correlate variables in such a way that they confirm the previous results. Component 2, in its positive substructure, correlates LAGs that show growth or stabilization of the population, greater private participation and investments in Action 4/1000 inhabitants. In the negative substructure, LAGs appear with low mortality rates. Then, Component 3 results with total investment/1000 inhabit, Action 3/1000 inhabit and Action 5/1000 inhabit in its positive substructure. In the negative substructure, Action 4 appears with less explanation factor, as well as private investment.
4. Discussion
Based on the results secured and exposed previously, there are LAGs that have the smallest amounts of population, most of them with some villages that do not reach 500 inhabitants and that are located in areas with subsistence agriculture. Due to this fact, they appear (in the positive substructure) with the greatest contributions of LEADER, in both projects and investments with respect to 1000 inhabitants, due to the low population they have (e.g., Hurdes with 6000 inhabitants, Valle del Ambroz with 7870, Trasierra-Cáparra with 9012 or Valle del Jerte with 11,123). Besides, they do not correlate with the variables of investments or projects with respect to the total of the regional investment of LEADER. These LAGs have focused their investments mainly on tourism, due to the existence of rich natural resources susceptible to be exploited through rural tourism, and the lack of a dynamic business network because they have a very old population. This is shown by the high mortality and aging rates.
The fact that fewer LAGs of Alentejo appear in the positive structure of Component 1 is significant. This is because the territorial application of LEADER has been different from the case of Extremadura. There are 10 LAGs in Alentejo and 24 in Extremadura for a very similar territory both in extension (40,000 km2 in Extremadura and 31,000 km2 in Alentejo) and in population (approximately 750,000 inhabitants in both regions). In the Portuguese territory, the design of LAGs with a greater volume of population and extension has been opted for, with an average of 75,000 inhabitants per LAG (30,000 inhabitants in Extremadura). Regarding investments, in Alentejo, an average of almost 20 million euros is managed by LAG, which is more than double that in Extremadura (9.3 million on average by LAG). However, if the population were considered, there would not be as many differences, with an average of 300 euros per inhabitant in the case of Extremadura and 260 euros in Alentejo. Therefore, in Component 1, only two LAGs of Alentejo appear (those that have managed high volumes of aid according to the population) and five of Extremadura. Thus, Component 1 shows the largest investments for the number of inhabitants. In the substructure of the first component, variables that indicate stabilization or demographic dynamism do not appear because the investments, although they are higher than the average, are not enough to generate such dynamism. The demographic initial situations of many LAGs of this substructure are very negative (a large part of them has less than 10,000 inhabitants) and private participation is still scarce although the effort of the technical teams is important.
Then, the LAGs that appear in the negative substructure of the first component locate on irrigated spaces or productive olive and vineyards lands, close to the main communication routes, in Extremadura and, in the Portuguese case, to Lisbon and the Algarve. In addition, they are the LAGs in which the largest county towns of both regions are located, such as Don Benito, Villanueva de la Serena, Almendralejo, Navalmoral de la Mata and Zafra, in Extremadura, and Mourao or Santarém, in Alentejo. These LAGs receive the largest investments with respect to the total of LEADER considering that they are the most populated areas. Thus, the important volume of population, the optimal spatial location and the competitive productive systems allow these territories to present positive demographic indicators such as the birth rate (defining variable of this negative substructure of Component 1).
Finally, as can be seen in the Results Section, there is an intermediate group formed by territories that have a diversity of conducts. First, there are aging territories whose LEADER investments are destined for rural tourism (because it is an alternative economic activity to combat the impossibility of developing competitive agricultural or industrial activities), as in the mountain areas of Extremadura, but with low negative correlations given that, investments per inhabitants are not as relevant. In the case of Alentejo, the investment in tourism relates to the Atlantic coast. Secondly, LAGs located in areas of the border between Extremadura and Portugal or peneplain on the border between Extremadura and Castilla-La Mancha. They present intermediate demographic variables (some of their villages are aged, but not as much as in the mountainous areas and some of them have more than 2000 inhabitants and do not show such a regressive demographic growth) and their investments are mainly destined for Action 4.
The correlations between variables of Components 2 and 3 are not significant because of the complex realities of the territories of each LAG, which explains the low values in their variances (18.9% and 12.5% respectively). Component 2 emphasizes almost exclusively the investment in Action 4 and in Component 3 the investment in Actions 3 and 5. In other words, these two components do not express a practically correlation between the demographic and economic variables of LEADER in the manner in which Component 1 does.
In this sense, based on the results obtained in Component 1, it can be stated that there is a concentration of investments and private participation in the most populated LAGs in Alentejo and Extremadura during the programming period 2007–2013. Furthermore, a large part of the subsidized projects has been managed with Action 4 (SMEs, crafts and services). This concentration appears correlated with demographic variables that express dynamism, such as the birth rate. However, investments through LEADER are still limited compared to other better-funded policies such as the CAP or the ERDF (dedicated to infrastructure improvement). Thus, LEADER is not able to modify the regressive demographic trends of the most ruralized spaces, even though above-average investments per population are implemented in them.
5. Conclusions
For more than 25 years, Alentejo and Extremadura, border areas of Portugal and Spain, respectively, have been beneficiaries of rural development aid under the LEADER Approach. During these years, through different programming periods and the design of diverse development strategies, the objective has always been the same: to diversify the economy of the most rural areas by separating it, as far as possible, from agriculture; generate greater economic development; and stop the processes of aging and depopulation. However, following the evolution of economic and demographic indicators of both Alentejo and Extremadura, they remain two of the least developed regions of the EU despite the long history of LEADER. In this way, and as a hypothesis presented in this paper, the demographic aspect, both in Alentejo and in Extremadura, is not benefiting from rural development aid due to the concentration of investments in more populated LAGs. The objective of this study was to confirm this affirmation through the statistical analysis of LEADER in both territories according to their demographic characteristics. For this, Principal Component Analysis was used.
Component 1 was obtained, which explains almost 41% of the sample and which serves as explanation factor of the relations between LEADER aid and the territories of Alentejo and Extremadura. The percentage can be considered low, but the geographical complexity of the study area must be considered. However, in future research, it is intended to improve the results through analysis at the municipal level. In this way, it can be affirmed that the most demographically regressive LAGs of both regions will not get the expected results through the LEADER Approach. This is due, mainly, to their starting regressive demographic situations.
The most dynamic LAGs (with the largest volume of population and previous business fabric, located in irrigated areas and on the Portuguese coast, fundamentally) are the ones that receive the largest investments in relation to the total regional investment, as well as private participation, sidelining the LAGs with more ruralized towns.
Comparing both regions, there are greater differences between LAGs in Extremadura than in Alentejo, given that in this Portuguese region there has been a commitment to the creation of fewer groups formed by a greater number of municipalities or concelhos, thus having more extension and more population. It is obvious, therefore, that the management of LEADER aid must be different than in Extremadura, since some territorial variables such as the old age index and population growth are also different. However, if the concelhos that form each LAG in Alentejo were analyzed more deeply, it could be identified that there are also demographic breaches and villages with less economic development as well as that the greater number of projects through LEADER and greater economic amounts are concentrated in the main county towns, as in the case of Extremadura. This is where further research is needed. The objective, in upcoming studies, will be to measure the social profitability (since social cohesion in rural areas is one of the greatest achievements of LEADER in the face of low economic impact) and to obtain deeper conclusions, through a local level. Furthermore, implementing the statistical analysis of this paper in other European regions will be a future study to look for similar results. All of this may help to clarify whether it is possible to achieve, through the EAFRD and its innovative LEADER Approach, the maintenance of the rural population in territories with low demographic density, such as Alentejo and Extremadura, slowing down the processes of aging and depopulation.


