Spillover Effects of Ports and Logistics Development on Economic Power: Evidence from the Chinese BTH Regions

1
College of Management and Economics, Tianjin University, Tianjin 300072, China
2
Economics and Management Department, Xinzhou Teachers University, Xinzhou 034000, China
*
Author to whom correspondence should be addressed.
Sustainability 2019, 11(16), 4316; https://0-doi-org.brum.beds.ac.uk/10.3390/su11164316
Submission received: 7 July 2019
/
Revised: 6 August 2019
/
Accepted: 6 August 2019
/
Published: 9 August 2019
Abstract
:Ports and logistics development strongly affect the development of regional economies. This paper chooses the Beijing–Tianjin–Hebei (BTH) regions as the study area, and aims to reveal the spillover effects of ports and the contribution of logistics development to the growth of regional economics based on the partial least squares (PLS) and ordinary least squares (OLS). We apply the panel data analysis for the period of 1996 to 2015 through an expanded Cobb–Douglas production function. Four models are established to analyze the influences of the different indicators on the economic development. The results show that the Tianjin Port has a considerably stronger influence on the BTH regions than the Hebei ports, and its spillover effects on the sub-regions are notably stronger. Furthermore, several indicators have a negative effect on one sub-region, while they have a positive effect on the other sub-regions. Finally, we make practical suggestions that will stimulate and coordinate regional economic development.
1. Introduction
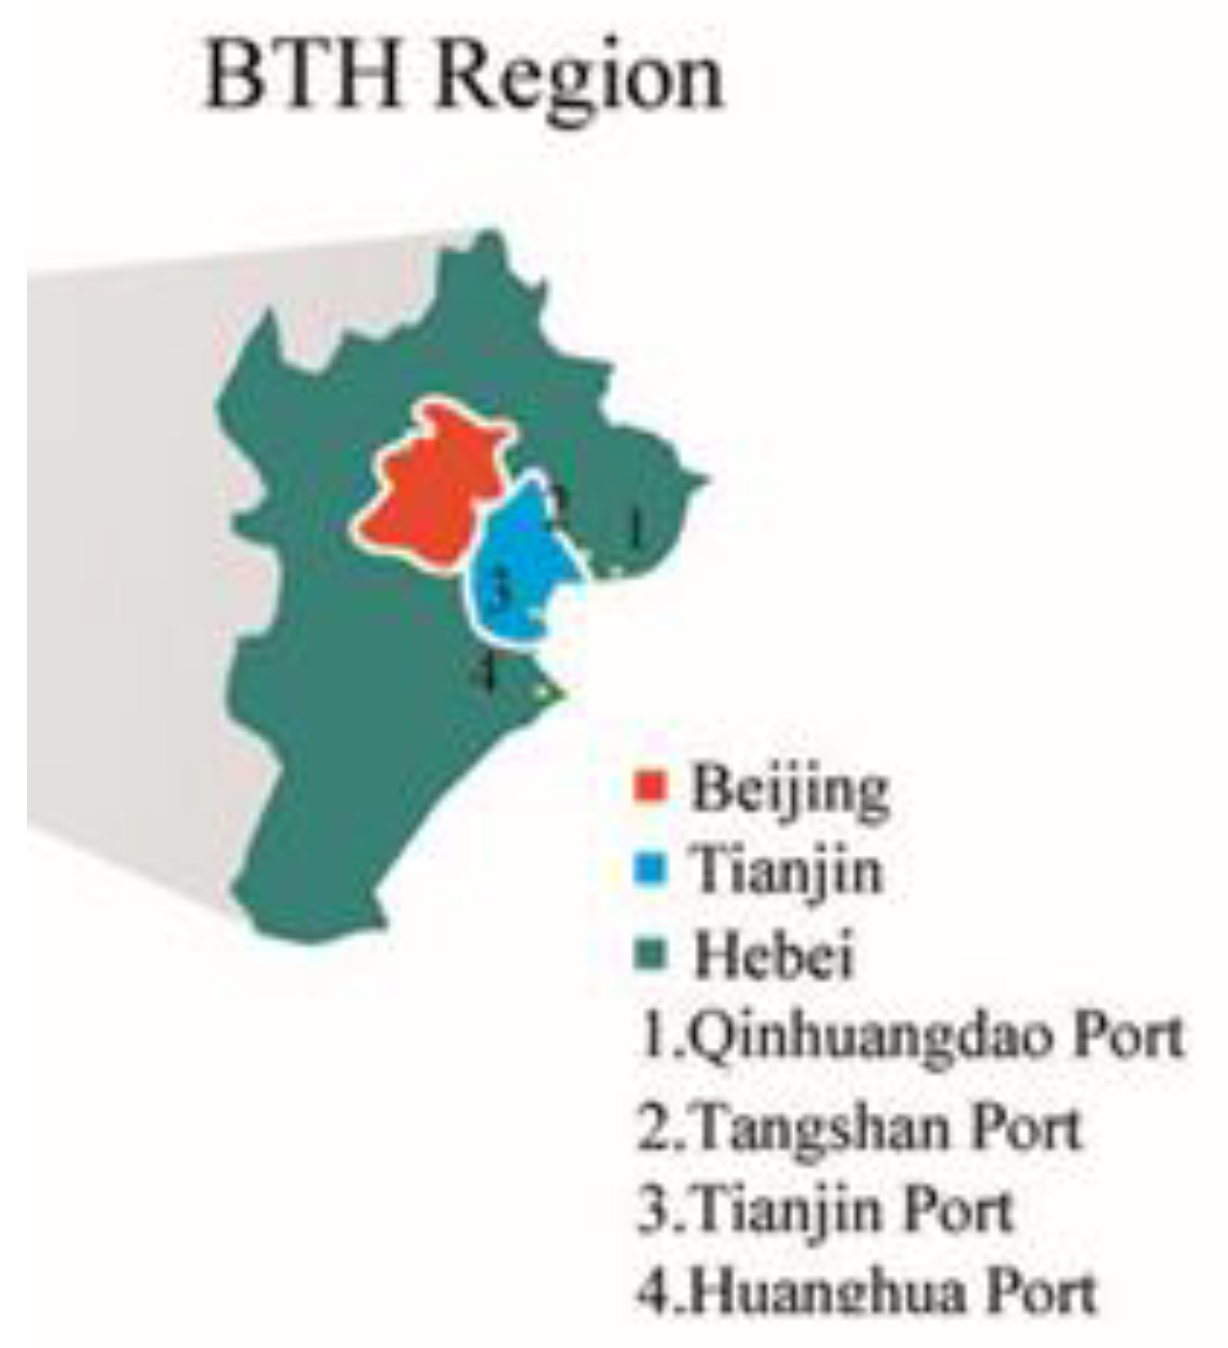
In China, there are three economic deltas: Yangtze River Delta (including Shanghai and the surrounding regions), Pearl River Delta (including Guangzhou, Shenzhen, and surrounding regions), and the BTH regions (including Beijing, Tianjin, and Hebei province); in these three regions, nearly 10% of China’s GDP was created in 2016. As an economic center of northern China, the BTH regions have recently played a significant role in economic development. In fact, the BTH regions possess nearly seven hundred kilometers of the coastline and four natural ice-free ports, Tianjin Port, Qinhuangdao Port, Tangshan Port, and Huanghua Port, which are shown in Figure 1. Thus, the BTH regions have rich coastal resources and extensive logistics activities. However, comparing the three sub-regions of the BTH regions, we can observe that the sub-regions are lagging greatly in the speed of economic development.
The sustainability and economic growth have been the hot topics of considerable academic researchers in the past few decades [1]. The sustainability covers three key dimensions such as environmental, economic, and social, which are applied to many fields, including ports and logistics [2,3,4]. In fact, the ports and logistic contribute significantly to the economy, but they also pose adverse effects on the environment [5,6]. As we know, tense competition exists between the ports in the BTH regions, because they are near one another and have the same sources of goods, such as bulk cargo and containers. Obviously, the competition leads to the waste of resources in BTH regions and causes poor sustainability. Therefore, it is necessary to study the impact of ports and logistics to the economy, and sustainable development in the BTH regions [7].
To promote the development of the BTH regions, the collaborative development planning of the BTH regions was published by the Chinese Central Government on 30 April 2015; it includes the coordination of the logistics system in the BTH regions (http://www.ndrc.gov.cn), where ports are the key indicator in regional logistics development. As a component of the national capital economic circle, the collaborative development of the Beijing–Tianjin–Hebei regions have garnered extensive attention from academia, politicians, and the public. Many researchers have verified that the development of the economy can promote the development of the Hargono logistics service [8]. Although the infrastructure investment of the logistics system has been increasing in the BTH regions, the integrated management of logistics activities, including the nodes and the routes, remain in development. Jiang and Prater [9] illustrated that undeveloped infrastructure and regional protectionism were the primary problems in the logistics distribution system, and these issues heavily restricted the development of the regional economy and the logistics integration in China.
As one of the three major industrial regions in China, the BTH regions contributed nearly 10% to China’s GDP in 2017. According to Lean et al. [8], the ratio of logistics cost to GDP (18%) is also approximately two times that of the United States in 2010. Moreover, there has been no empirical analysis at the micro (institutional data) level to analyze the impacts of ports on the economic power of the BTH regions in China. Therefore, it is worthwhile for us to further study the relationship between the regional economy and the logistics integration system in the BTH regions, specifically the sustainability of ports in the BTH regions.
In sum, the urban extents in the BTH regions had disproportionately highly concentrated logistics development and economic activities, while regional disparities continued to exist. Furthermore, Hebei is an important industrial province in the BTH regions. On 1 April 2017, the CPC (the Communist Party of China Central Committee) and the State Council announced that it would establish the Xiongan New Area (the counties of Xiongxian, Rongcheng and Anxin) in Hebei Province as the motivation to stimulate the coordinated development of the BTH regions. This area is an additional Special Economic Zone, after the Shenzhen Special Economic Zone and the Shanghai Pudong New Area. The Xiongan New Area is part of a major strategy to integrate the development of Beijing, Tianjin, and Hebei to establish a better economic structure and improved public services.
The logistics integration system may lead to regionally aligned green growth to realize sustainability ambitions [10]. In principle, economic growth from seaports may generate spillover effects in adjacent port provinces and occasionally across the adjacent areas [11]. For example, the technology and logistics in Beijing and Tianjin will spill over to the Xiongan New Area. The New Area will become a focus of investment in the BTH regions. As a new economic zone near Beijing and Tianjin, there should be a “world-class transport system”. Therefore, the development of ports and the logistics integration system is important for the BTH regions’ economy.
Although Tianjin Port has a long history, Hebei ports (including Qinhuangdao Port, Tangshan Port and Huanghua port) have recently developed very quickly. Tense competition exists between the ports in the BTH regions, because they are near one another and have the same sources of goods, such as bulk cargo and containers (Table 1). Obviously, the increasingly fierce competition between Tianjin Port and Hebei ports limits the economic development of the BTH regions. Following the publication of the collaborative development planning of the BTH regions, we need to explore how these ports and the logistics integration system will develop and which roles they will play in the process of realizing regional economic development.
Many scholars have noted that infrastructure investment and value-added activities in ports are all essential components in the logistics industry, and they determine the development of the regional economy [12]. For example, Guerrero et al. [13] indicated that the value-added activity of ports and the infrastructure investment in ports were two primary contributions to economic growth. Bottasso et al. [14] believed that a port has an irreplaceable role in economic development, and they analyzed the spillover effects of ports to the nearby regions. The basic functions of a port to the host region are generally regarded as the direct effects, while the impacts on neighbor regions are the indirect effects, denoted as the spillover effects [15,16]. Another study on China by Deng et al. [17] used structural equation modeling to unravel the different influences on regional economic growth related to port investments by distinguishing among port supply, port demand, and value added-activity in ports. The findings indicated that value-added activities in ports had a positive effect on the development of the regional economy. Therefore, it is necessary to unearth the potential functions of Tianjin Port and Hebei ports to further improve the economic development in the BTH regions.
Referring to the above fruitful results, this paper presents the influence analysis of Tianjin Port and Hebei ports on the economic development in the BTH regions and discusses the spillover effects of each other to the BTH regions. We will explore the following problems:
- (1)
- How much do these ports and the logistics development contribute to the economy power in the BTH regions?
- (2)
- Do Tianjin Port and Hebei ports have the same functions to the different sub-regions (such as Beijing, Tianjin, and Hebei province) in the BTH regions? How much do the ports’ spillover effects influence the neighboring sub-regions?
- (3)
- How do we distinguish the differentiated functions and services of Tianjin Port and Hebei ports? Additionally, how do we realize the collaborative development of all ports and logistics facilities in the BTH regions?
In our research, the factors in the logistics and port-related activities of the BTH regions are extracted, and we model an expanded Cobb–Douglas production function to describe the relationship of these factors and the regional economic development. Through collecting the statistical data in the 1996–2015 period in the BTH regions, the partial least squares (PLS) regression is applied to estimate the variable parameters, because serious collinearity exists in the ordinary least squares (OLS) regression. To study the spillover effects of Tianjin Port and Hebei ports individually, three sub-models are established. Furthermore, the spillover effects of Tianjin Port to the other two sub-regions and the spillover effects of Hebei ports to the two chartered cities (Beijing and Tianjin) are discussed. Research on spillover effect can increase the sustainable development of the BHT regions. In fact, there are few studies focusing on the interacting influences of spillover effects in the interior of the BTH regions.
The structure of this paper is as follows. The next section provides a review of the related literature. This review is followed by an analysis of the factors included in our model and the methodology in Section 3. Section 4 introduces the data analysis, the results of the model estimations, and the discussion of the relationship of ports and the regional economic growth in BTH regions. Furthermore, we explore the spillover effects between Tianjin Port and Hebei ports. The paper ends with conclusions and policy implications. We provide suggestions to guide the development and integration of the logistics system to increase the spillover effect in the BTH regions and the Xiongan New Area.
2. Literature Review
2.1. Logistics Industry and the Regional Economy
In recent decades, many studies have investigated the impact of logistics on the regional economic growth of China [18]. Modern logistics is widely regarded as a key factor and an accelerator in promoting economic growth [19]. Therefore, there are many results regarding the relationship of the logistics industry and regional economic development. For example, Liu et al. [20] analyzed the promoting role of modern logistics in the national economy. Lean et al. [8] demonstrated that the development of the economy in China promoted the improvement of logistics service and vice versa. Cheng and Peng [21] studied the relationship between the logistics industry and economic development in the Anhui province of China and obtained similar conclusions as Zhu et al. [18]. Lindsey [22] also noted that regional logistics and related activities influenced regional economic development. In addition, many recent studies analyze port logistics and relations to the regional economy. Lan et al. [23] analyzed the promoting role of metropolitan economy and logistics and evaluate the level of logistics and economic development in five province-level municipality cities of China from 2009 to 2013. They point out that with the progress of economic globalization and integration, logistics industry has become a new momentum driving the fast development of national and regional economy.
In the recent literature, the regional economy is increasingly viewed as influenced by the level of traffic infrastructure. Specifically, transport facilities and infrastructure were proved to be the reasons for the economic gap between 24 Chinese provinces [24]. Concerned with the infrastructure investment in the logistics industry, Alleman et al. [25] used southern Africa as the research object and found a strong positive relationship between economic development and infrastructure. Fleisher and Chen [26] concluded that coastal regions contained double the productivity of no-coastal regions owing to the differences in infrastructure investment based on the economic contribution of the infrastructure. Zhang et al. [27] illustrated that in the underdeveloped regions, transportation infrastructure was very important for regional economic growth. Li et al. [28] employed seven variables from transportation, post, and storage aspects of logistics to find the specific factors in the logistics sector that contributed to economic growth in China. The results showed that most variables have significantly positive impacts on economic growth. The Banister [29] study had an emphasis on a non-linear relationship between transport infrastructure provision and economic growth. Therefore, we also apply statistical models to describe the relationship between logistics development and the regional economy.
A positive impact of port investment on economic growth could be observed both in Korea and China. The results of these studies are a positive relationship between transport investment and economic growth, which is now commonly accepted [30]. Jiang [31] investigated the influence of seaport infrastructure investment on economic growth in China, by applying time series data. Song and Mi [19] discussed the functions of ports and an important role in China’s transportation and economic system, especially for the cities where ports are located at the hinterland they served. The results pointed out that there was a long-term one-way causal relationship between port investment and economic growth.
Another study on China by Song and Van [32] estimated the output elasticity of port infrastructure through a production function. The results indicated clear positive effects of port infrastructure investment in all regions. Akhavan [33] noted that the Creek dredging and newly constructed ports integrated with ancillary infrastructures have played an important role in boosting growth. Munim and Schramm [34] analyzed the impacts of port infrastructure and logistics performance on economic growth. The results reveal that it is vital for developing countries to continuously improve the quality of port infrastructure, as it contributes to better logistics performance, leading to higher economic growth.
A port’s development is highly related to its regional economy because port activities, such as transferring, loading and unloading, warehousing, processing, packaging, logistics services, and value-added activities, have multiplier effects on the local, regional, and national economy [19,35]. A port as an irreplaceable component of transit shipments in the logistics systems is usually considered a key point of regional economic development. The relationship between a port and its regional economy often combines the characteristics of “port and city interaction” and “prosper cities with ports” [36].
Theoretical models are employed to show that the presence of a port helps to reduce transportation costs, which motivates the rise of urban centers [37]. Most of the related literature uses the input–output (IO) approach to study the direct and indirect impacts of ports on the economy of the local region [38,39]. Yochum and Agarwal [40] analyze expenditures per employee of port-related industries to represent the impact of a port on the regional economy. Acciaro [41] examined the effects of ports on Sardinia. The researcher shows that ports play a vital role in creating employment for and stimulating the economy of the Sardinia region. Furthermore, Bryan [42] noted that port-related activity was a major factor in promoting the local economy. Guerrero et al. [13] showed that the value-added activities of ports and infrastructure investment in ports were the main contributions to economic growth. Deng et al. [16,17] used structural equation modeling to distinguish between port supply, port demand, and value added-activities in ports. For example, in China, the leading cities are nearly exclusively port cities that either host or are located near busy seaports.
In recent years, increasingly abundant research is based on regression analysis. Regression analysis enables us to investigate the subject matter with publicly available data. Bottasso et al. [15] investigate the association between port throughput and overall economic development of the port city, rather than employment. The researchers select a sample from Chinese port cities. Shan et al. [24] empirically investigate the economic impact of Chinese seaports on their host port cities. The researchers found that port cargo throughput has a positive effect on the economic growth of the host city. Ding et al. [43] research showed that the major economic factors in Shenzhen were highly correlated with the throughput of ports, which clearly showed that port logistics was closely related to regional economic growth. Sun and Yu [44] considered the relationship between Shanghai port logistics and regional economic growth. These results showed that the growth of port cargo throughput can significantly promoted economic growth.
2.2. Spillover Effects of Ports
In addition to the direct impact on the local area, the spillover effects of port development on surrounding areas have also aroused the interest of researchers. Earlier, Musso et al. [45] proposed a technique with two phases to estimate the employment impact of ports and examined how the effects of spillover impacted on the regional employment. The researchers’ conclusions suggested that the impact of ports on the surrounding regions was greater than that on their respective host cities in terms of the employment. Then, Bottasso et al. [15] studied the impact of port activities on local employment by analyzing a sample of approximately 560 regions located in ten West European countries, as observed over the 2000–2006 period. The researchers’ conclude that regional employment is positively correlated to port throughput. Fageda and Gonzalez-Aregall [46] used a spatial Durbin model (SDM), and they found that only ports were able to generate positive effect on industrial employment in Spain from 1995 to 2008. Oosterhaven et al. [47] developed a consistent framework and used bi-regional input–output data to discuss whether two ports and their host cities could mutually affect each other. Spillover effects were also affirmed by Cohen and Monaco [48]. The researchers used state-level data from the 48 contiguous states and built a manufacturing production and cost model with variables including state and local investment in ports and highway infrastructures. The researchers determined that impacting functions of the ports on the nearby regions existed. Bottasso et al. [15] used a spatial panel econometric framework and used OLS analysis to investigate 13 Western European countries. The researchers found that port throughput had a positive impact on regional GDP and that the influences on adjacent areas were greater. Furthermore, Park and Seo [49] also revealed the economic impact of seaports on regions in Korea. They found that cargo ports without enough throughput obstructed regional economic growth, whilst cargo ports contributed to regional economic growth only when they had enough throughput. Merk and Comtois [50] used the factor analysis method to offer a performance evaluation of the port in Hamburg. The researchers discovered the spillover effects of ports in Hamburg were very significant.
The previous studies illustrate the interrelationships between the port infrastructure investment, the logistics industry, and the spillover effects of ports. Based on the above fruitful results, this paper also focuses on the influences of ports and logistics development on the economic development and the spillover effects among three sub-regions of the BTH regions. Table 2 indicates the literature review of this paper.
3. Models and Methodology
3.1. Establishment of the Models
Coma and Douglas [53] proposed Cobb–Douglas function as a mathematical representation of the relationship between capital, labor, and output in 1928. It is the most widely used form of production function in economics. With the development of economy and society, many scholars have improved and developed the Cobb–Douglas production function to adapt to many real applications.
The Cobb–Douglas production function is the basis of the empirical analysis in modern economic growth. Some scholars chose this method in the field of finance, manufacturing industry, agricultural, etc. [54,55,56]. For example, it can be used for the prediction of enterprise benefit, the contribution rate of the inputs to the output, and the specifics of gross domestic product production, etc. [57,58].
Logistics is considered as a factor in the production process, which has a profound impact on economic growth. Most previous researches apply a Cobb–Douglas production function framework in estimating the impacts of transport investment and logistical infrastructure on economic growth [28,51,52]. Song and Van [34] use production function and panel data (1999–2010) to analyze the port infrastructure investment and regional economic growth. Li et al. [28] adopts production function and panel data (2003–2014) to analyze the impacts of logistics infrastructure on economic growth. Therefore, referring to the above references, the Cobb–Douglas production function is considered in this study to reflect the impacts of ports and logistics development on economic growth.
A Cobb–Douglas production function and panel data from National Bureau of Statistics of China (1996–2015) comprise the baseline for our analysis, meanwhile overcoming the well-known lack of data [59]. Referring to the literature, we proposed the following variables to establish our model. First, GDP is often used as an economic variable [60]. Per capita GDP (PCGDP) is presented as a dependent variable to quantify the integrative development levels of the regional economy in this paper [8]. Real investment in fixed assets (RINV) and distribution employment (DE) are hypothesized as the control variables in our analysis; these correspond to the capital and labor variables, respectively, in the production function [21]. To discuss the influences of the ports on the economic growth of the BTH regions, the total throughput of ports (Port) as an important variable is considered to investigate the direct and indirect effects of ports (spillover effect) on the regions. For example, Bottasso et al. [15] prove that this indicator was applicative and appropriate to research regional development. Moreover, average traffic infrastructure density (TID), which is the ratio equal the length of the routes per square kilometer, including the total length of roads, railways, and inland waterways, is used to represent the regional infrastructure level. This representation is employed because Song and Van [32] note that this indicator was representative and authoritative on behalf of a regional level of infrastructure facilities. In addition, the urbanization level (U) is usually known as a current development level of the regional economy and is deemed to reflect the port’s contribution to cities [37,61].
While patent number (Patent), which is the number of patents granted annually, represents the regional technology level, Bottasso et al. [15] trust that this indicator could reflect the impact of the technology level on the logistics industry and regional economic development. Furthermore, to emphasize the impacts of the real output of the transportation, warehousing, and communications industries on the logistics industry, the increment of gross domestic product of transportation (TranspGDP) was utilized as an indicator in this paper; this is also chosen by Lean [8], and this variable represents the level of transportation development in regions. The details of all variables are listed in Table 3.
According to the Cobb–Douglas production function, we obtained the empirical model as follows:
To estimate the parameters in the model, we converted Formula (1) into the logarithmic form (2):
where β is the estimated error term.
Furthermore, to gauge the spillover effects of ports in the BTH regions, we divided the variable Port into two variables, Tianjin Port and Hebei ports as and , respectively, where represents all total throughput from Hebei ports. Then, Model (2) can be transformed into the following form (3):
In the following analysis, we utilized four models according to the statistical data from the different regions. In other words, we used the aggregate statistical data from the BTH regions (Model 1), the respective sub-regional statistical data from Beijing (Model 2), Tianjin (Model 3), and Hebei provinces (Model 4). In this instance, i and t represent the indices of the different models and the years, respectively.
3.2. PLS Regression Method
To estimate the parameters in the above Formula (3), the OLS model is usually applied in the literature [32]. However, when serious collinearity exists among the variables in the model, we must adopt the partial least squares (PLS) regression method, particularly in studies that contain many variables but few observation samples [61]. Differentiating from OLS regression, PLS regression is derived from multiple regressions, principal component analysis and canonical correlation analysis [49] Based on screening technology and information synthesis, the PLS regression method is a process that extracts explanative components as its regression variables.
According to Geladi and Kowalski [62], the primary idea of the PLS regression method is to assume that there is a pair of independent and dependent variables (X, Y). First, we extracted the latent variables t1 from X and u1 from Y, respectively; here, t1 and u1 will provide as much variation information as possible regarding X and Y. At the same time, the variables will realize the maximum degree of correlation. Next, based on Y, t1 and X, t1, a regression equation is established. If the accuracy degree of the model can be achieved, the extracted algorithm terminates; if not, we continued to extract a new component from the residual information and rebuild the regression model. The procedures are continually repeated until we can achieve satisfactory accuracy of the regression model.
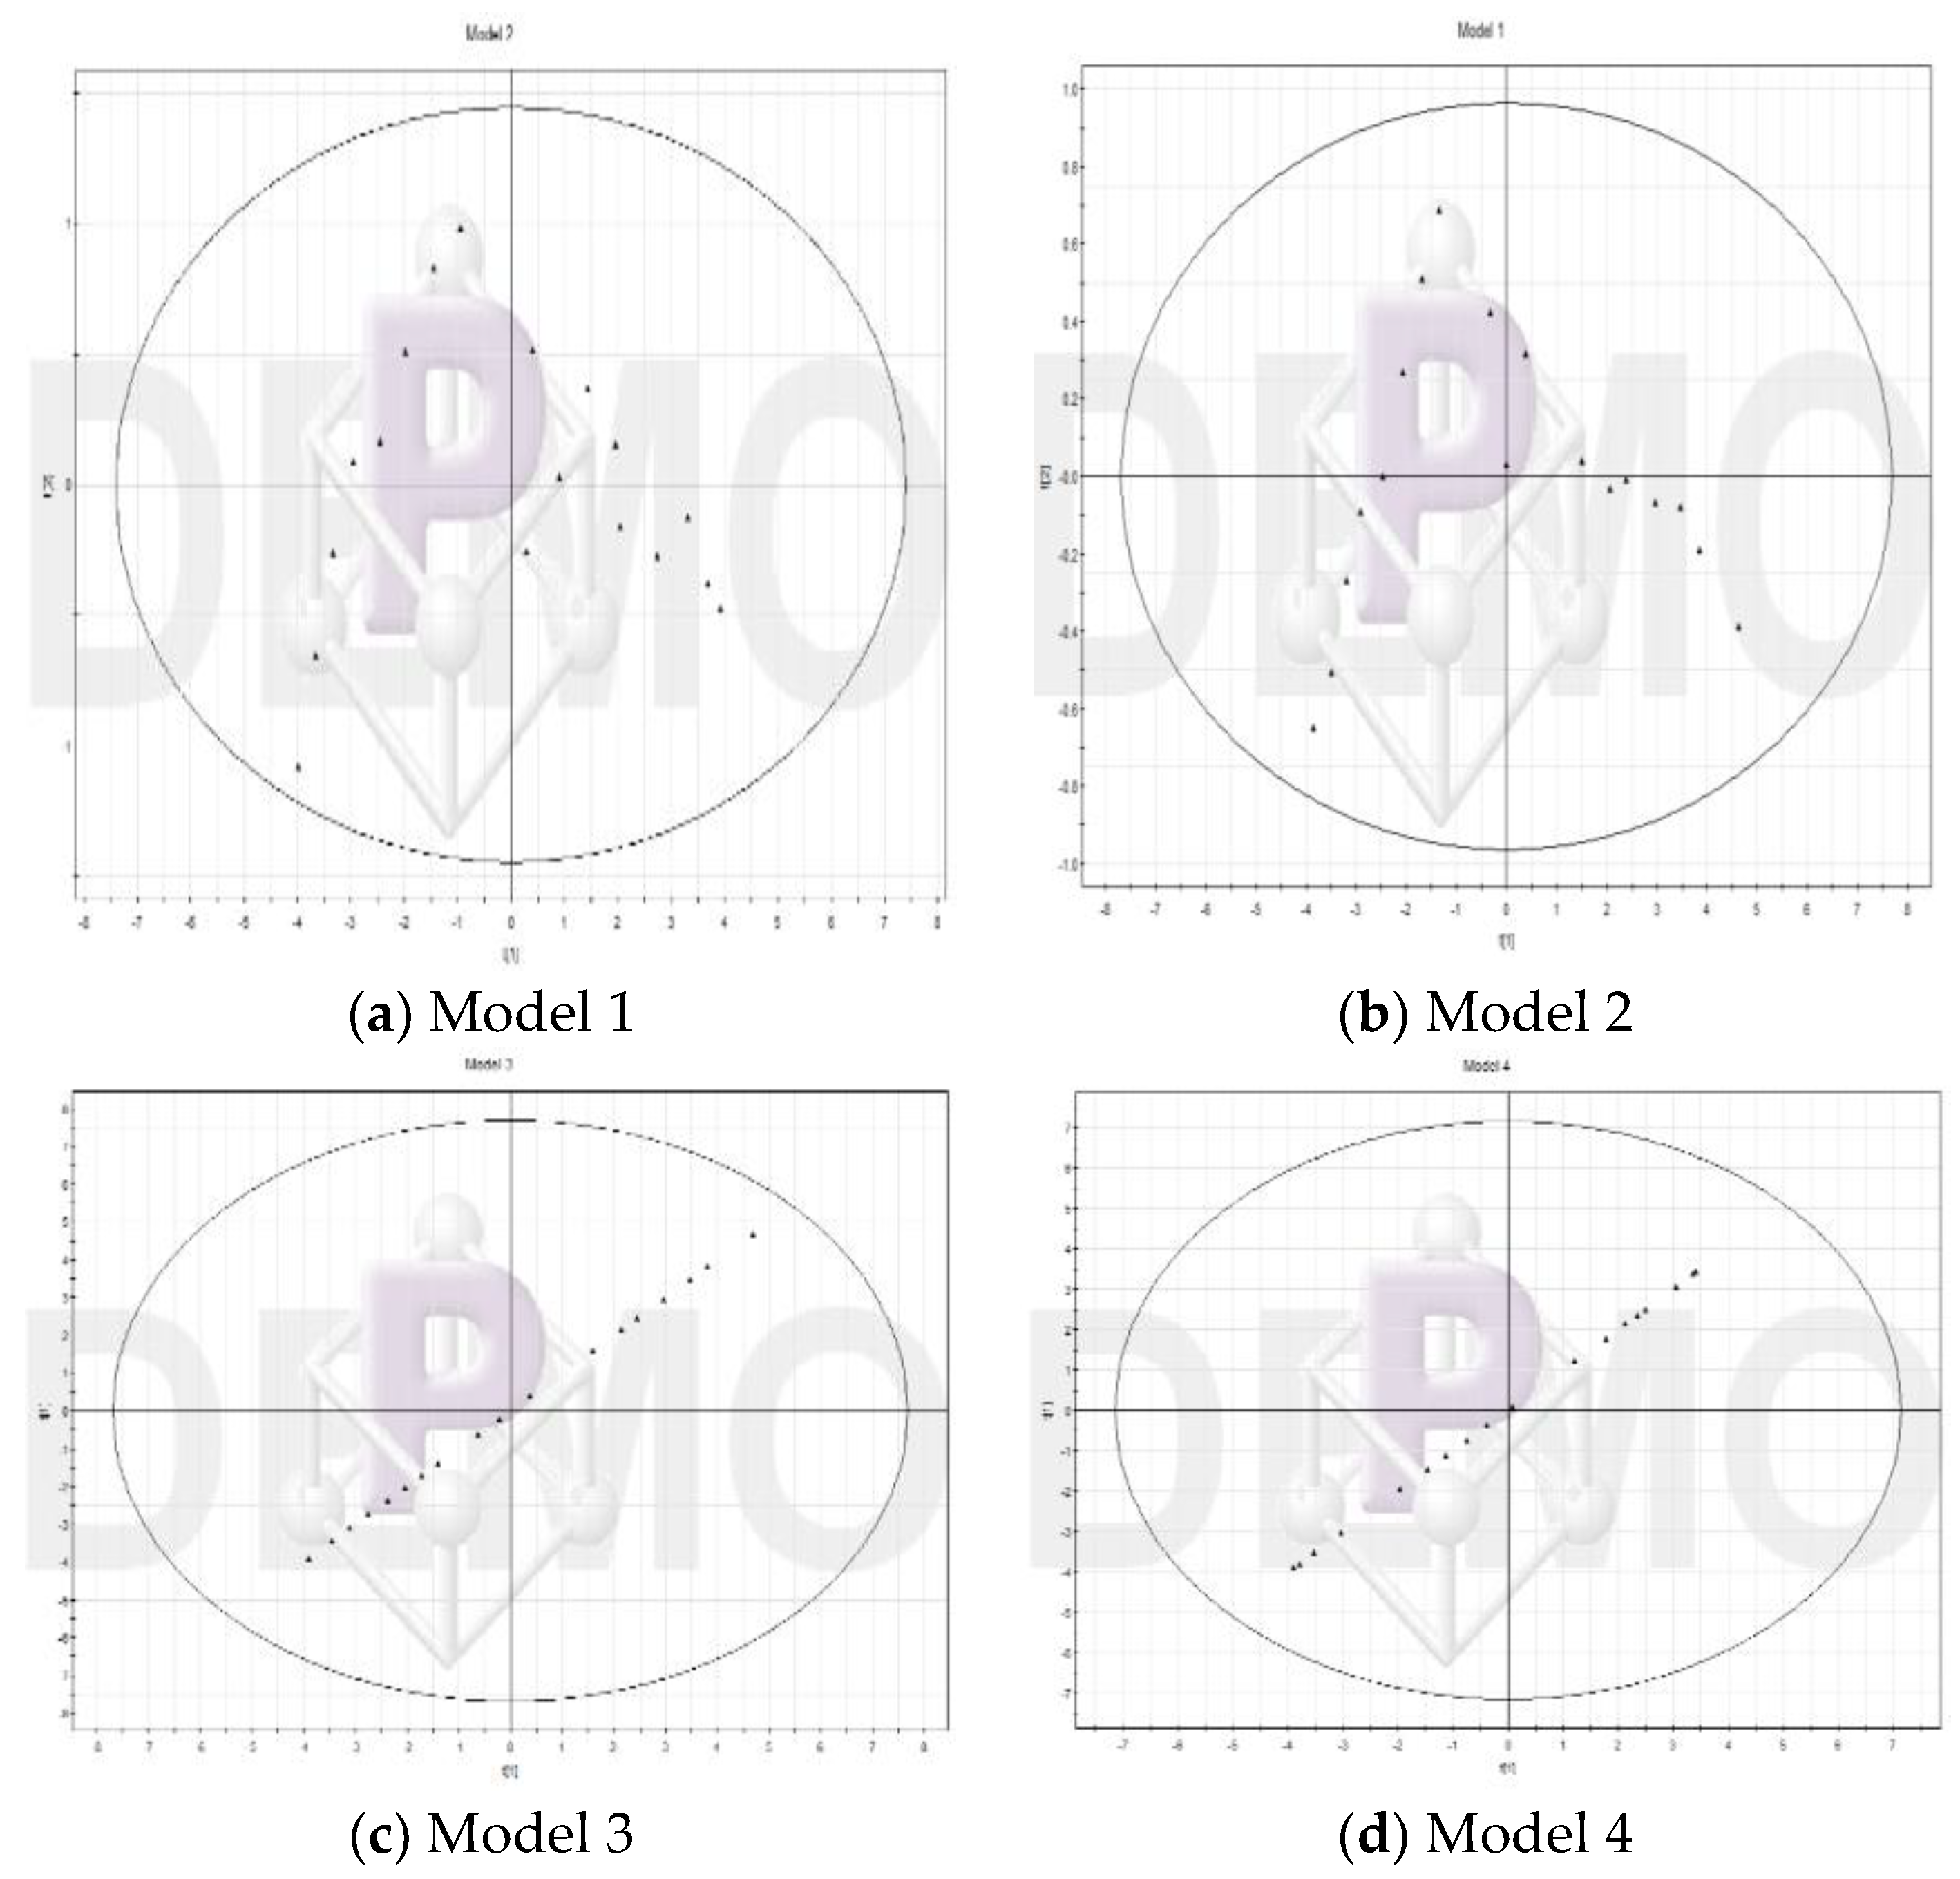
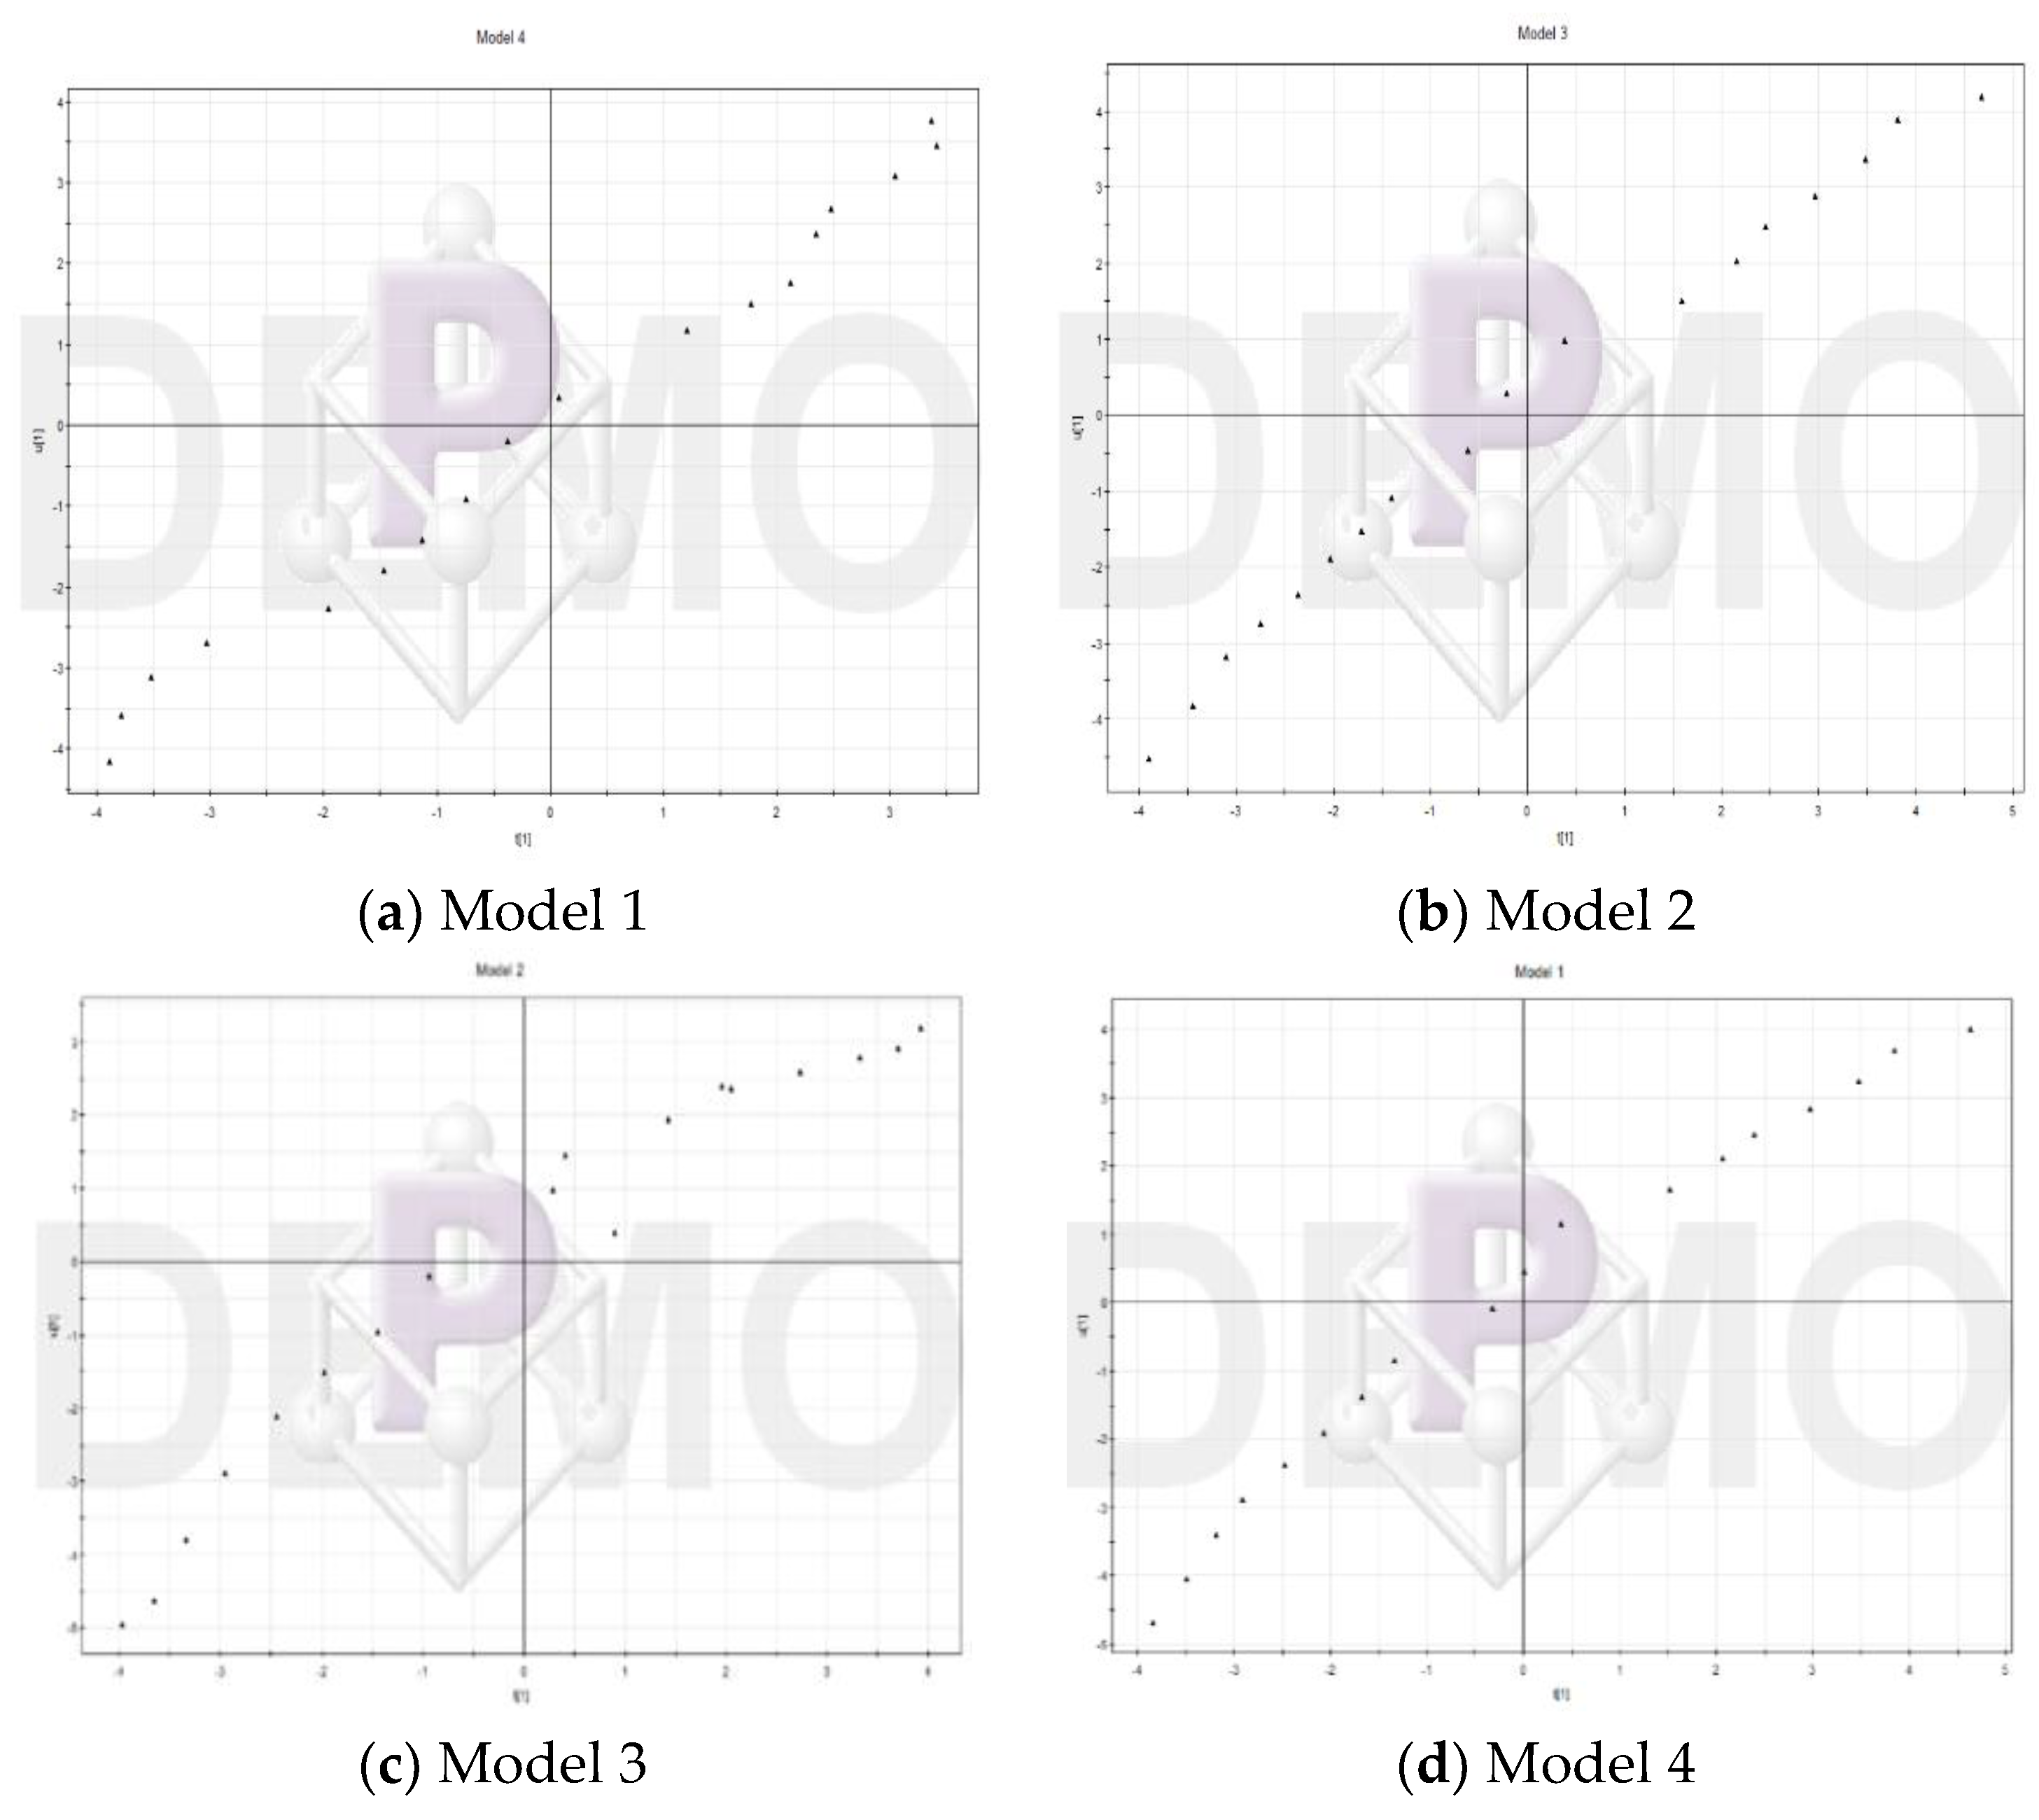
Generally, the applicability of the PLS regression can be explained by the t1/t2 oval plot and the t1/u1 scatter plot, where two latent variables t1 and t2 are extracted from X variables and the latent variable u1 from Y variables. Sample data are appropriate and acceptable when t1/t2 are evenly scattered in an oval with no homogeneous points distributing outside the oval. Similarly, when the t1/u1 relationship from the sample data is nearly linear, we could conclude that the PLS regression method is suitable to solve this problem.
Another indicator is VIP (variable importance in projection) in the PLS regression method; this gauges the importance of the independent variables X in explaining the dependent variables Y. The VIP expression is provided as follows:
where VIPj means the VIP value of a variable xj; when , it means that this variable xj has strong explanatory ability for the independent variables Y. The number of X is represented by p, and . In this instance, ; this represents the accumulative explanatory power of t1, …, tm for the independent variable Y. In the constitution of component th, Wh is used to reflect the marginal contributions of xj, and , , for any .
4. Results
All the data used in our models were derived from the China Statistical Yearbooks (China Bureau of Statistics 2015), the Beijing Statistical Yearbook (Beijing Bureau of Statistics 2015), the Tianjin Statistical Yearbook (Tianjin Bureau of Statistics 2015), and the Hebei Economic Yearbook (Hebei Bureau of Statistics 2015) for the 1996–2015 period in constant 1995 prices. According to Formula (3), we developed four models to analyze the relationship of ports and regional economic growth. Model 1 was built by using the aggregate statistical data from all the BTH regions, and the influences of Tianjin Port and Hebei ports on the BTH regions were discussed. Furthermore, to explore the spillover effects between Tianjin Port and Hebei ports, Model 2, Model 3, and Model 4, respectively, were estimated with respect to the statistical data from every sub-region, that is Beijing, Tianjin, and Hebei provinces. We used SPSS software to perform the OLS regression and SIMCA-P to perform the PLS regression.
First, the OLS regression method was performed to estimate the parameters of the four models, which were showed in Table 4. Through estimating the parameters using the OLS regression method, we showed in Table 4 that the tolerance values of most variables are less than 0.1; thus, the regression model might contain a serious collinearity problem. Moreover, Table 5 provided the test results of the OLS regression method, and we could observe that both the R-squares and the adjusted R-squares tend to 1; at the same time, the F(the value of the F test) was large, while Sig. (significance level) was very small. Considering the above tolerance values of all parameters, a serious multicollinearity likely existed among the different variables in the OLS regression results. Through the values of significance and the Durbin–Watson test, it was demonstrated that the four models are significant and contain no autocorrelation. To solve the collinearity problem in our OLS regression, the PLS regression method would be adopted to eliminate the collinearity of the models.
Based on the PLS regression method, the above four models are established for all the BTH regions: Beijing, Tianjin, and Hebei. The oval plot and the scatter plot were conducted to examine the applicability of the PLS method; the results were shown in Figure 2a–d. We could observe that all points of the four models are located in the oval; therefore, the sample data were acceptable in our study. Furthermore, Figure 3a–d provide the relationships of the sample data; we also fouled that a linear relationship exists between them. Thus, the PLS regression method can be applied in our paper.
Table 6 provided the results of the PLS regression method. In this method, a factor called VIF (variance inflation factor) was introduced to measure the multicollinearity of the four models. Generally, when the VIF value of each variable is higher than 10, serious multicollinearity exists in the regression models. Obviously, in Table 6, the VIF values of lnRINV, lnDE, lnPorTJ, lnPortHB, lnTID, lnU, lnPatent, and lnTranspGDP in the four models are all less than 1.2; therefore, these indicate that the multicollinearity among variables can be eliminated by applying the PLS regression method.
Furthermore, according to the PLS theory, and are defined as the corresponding explanatory abilities of the principal components that are extracted from the , variables to the original and variables. Another cross-validation indicator, , is usually adopted to gauge the marginal contribution of the extracted components to the precision of the models. From Table 6, the values of all indices , and of the four models are all higher than 0.8. These values indicate that the PLS regression models are excellent and contain perfect regression effects.
5. Discussion
Table 6 provides the results of the variables in the four models. In Model 1, we regard the entire BTH regions as a whole region to estimate the parameters of the model using the accumulated sample data of the three sub-regions. However, in Model 2, Model 3, and Model 4, we perform a detailed analysis in each region, including Beijing, Tianjin, and Hebei provinces, according to their corresponding sub-regional sample data.
Apparently, in these four models, the VIP values of RINV, PorTJ, PortHB, and TranspGDP, are all greater than 1.0. These results show that these variables make significant contributions to interpreting the increase of PCGDP in all of the BTH regions and each sub-region of Beijing, Tianjin, and Hebei provinces. In fact, two independent variables, TranspGDP and RINV, are related to the infrastructure investment; that is, TranspGDP and RINV as economy factors have long-term effects in promoting regional economic development. This finding has been demonstrated by many researchers [8,25,26]. Regarding the functions of ports, we find that the spillover effects of the ports also greatly promote the development of the economy in all of the BTH regions and in every interior of the BTH sub-regions. By comparing the related variables in the four models, PortTJ plays a significant role, with elastic coefficients 0.2619, 0.1977, 0.1506, and 0.1297, respectively, while the coefficients of PortHB are 0.0901, 0.0827, 0.1488, and 0.1288, respectively; all of these are less than those of PortTJ. These results demonstrate that the spillover effect and the direct effect of the ports are all important to the economic development of the BTH regions. The port factor could not be ignored when the government intends to promote the economy in the BTH regions.
Specifically, comparing the elastic coefficients of Tianjin Port (0.2619) and Hebei ports (0.0901) in Model 1, we can observe that Tianjin Port contributes much more to all of the BTH regions than do the Hebei ports. In other words, every 1% increase in the total throughput of Tianjin Port and Hebei ports will lead to 0.2619% and 0.0901% growth in Per capita GDP, respectively. This rule is also suitable for Beijing in Model 2. In contrast, the spillover effect of only contributes 0.08% per 1% increase in the economic growth of Beijing; furthermore, the (0.198) performance is the second important factor except for the control variable RINV. However, in Tianjin and Hebei Province, the indicator simply has a greater influence coefficient value than For example, in Model 3, , as a direct effect, plays a significant role in the economic development of the port host city (Tianjin) with a coefficient value of 0.1506; however, as a spillover r effect is second, significant with a coefficient value of 0.1488. Similarly, the spillover effects of and to one another is obvious in Model 4. In brief, we obtain the conclusions that the development of ports has greatly boosted the economic growth of the BTH regions. This view is the same as certain results in the previous empirical studies [16,34]. Furthermore, the spillover effects of ports in Tianjin and Hebei provinces greatly impact on the regional coordination development. Thus, it is necessary for us to create a mechanism among these ports to construct cooperative effectiveness to promote the regional economy. Specifically, Tianjin Port needs to contribute more in the collaborative development planning of the BTH regions than do the Hebei ports.
From Table 6, we also find that, in Model 1, Model 2, and Model 4, compared with the infrastructure investment and the total port throughput, the other independent variables, such as TID, U, and Patent, have minimal impacts on the regional economy. However, in Model 3, the VIP values of seven variables among the total eight variables are greater than 1.0. That is, most of these variables have distinct contributions to the economic growth of Tianjin. Specifically, the VIP values of Patent (1.7030) and TranspGDP (1.7032) are the highest two items. The variables indicate that the technology innovation and the increment of gross domestic product of transportation will significantly stimulate the development of the economy in Tianjin, which is consistent with the result of Bottasso et al. [15], who provided a similar conclusion in European regions.
Furthermore, in Model 1, Model 2, and Model 3, the elastic coefficient of DE is −0.0293, −0.0626, and −0.0591, respectively; they are all negative. Therefore, from the perspective of all of the BTH regions, the number of persons employed in the logistics and distribution sector is sufficient, while in Beijing and Tianjin these numbers have been an obstacle to improving the development of the regional economy. Because the infrastructure in Beijing and Tianjin is relatively developed, they may require more employees with much more advanced technological abilities and other knowledge-intensive capabilities, rather than labor-intensive capabilities. Therefore, the labor factor will be controlled in these regions. However, in Hebei province, the elastic coefficient of DE is positive (0.1264), which shows that the development of the infrastructure is behind the other cities. Therefore, more labor-intensive requirements exist in Hebei province.
In addition, traffic convenience is a necessary condition of the regional economic development. However, in Model 1, the elastic coefficients of TID (the length of the route of per square kilometer) is 0.0239; this shows that TID does not play a significant role in the economic development of all of the BTH regions as we expected. This case is also true in Model 2, Model 3, and Model 4. That is, TID also has a minimal impact on PCGDP in every sub-region. The reason may be that we consider two independent variables (RINV and TranspGDP) regarding the investment in the infrastructure, and we have proved that these two variables have much greater contributions to PCGDP in every region. However, in China, infrastructure investment has generally been used in the structure of all kinds of routes in recent years. Therefore, the functions of the two investment variables may counteract the effect of TID in the PLS regression.
Similarly, the urbanization level has simply a slightly higher impact on the regional economic growth compared with TID, except Beijing. In fact, in all of the BTH regions, the urbanization level in Beijing has risen to 86.30% in 2015 from 76.06% in 1996, and Beijing has been the most crowded, most heavily trafficked metropolitan in the world. Thus, according to the published collaborative development planning of the BTH regions (http://www.ndrc.gov.cn), many enterprises and governments will move out of Beijing to enable the urbanization level in Beijing to slow. However, the urbanization levels in Tianjin and Hebei provinces need be enhanced; in particular, a higher demand in Tianjin exists because the VIP value of U is greater than 1.0. As per the above discussion, when we consider the contribution of the patent technology to the regional economy, the elastic coefficient (0.1468) in Model 3 is the largest among the four models, and VIP = 1.7030. In other words, the adoption of high and new technologies in Tianjin has also had key functions in regional development in recent years and will continue to play a part in the economic growth of Tianjin; this result conforms to the findings of Lindsey et al. [22] and Bottasso et al. [15], respectively.
6. Conclusions and Policy Implications
Utilizing the statistics data from 1996 to 2015, this paper chooses several factors in the logistics and port-related activities of the BTH regions as the indicators, and models the expanded Cobb–Douglas production function. Through the parameter estimation of PLS, we research the relationship between the BTH regions logistics system and the BTH regional economic development and explore the spillover effects of ports to the host city and the neighboring regions. Through statistical analysis, we find that the ports contribute greatly to the economic development of the BTH regions. Specifically, Tianjin Port has much more influence on the BTH regions than do the Hebei ports, and its spillover effects on the sub-regions (such as Beijing and Hebei) are considerably stronger. Therefore, we can conclude that transportation, warehousing, logistics services, value-added, and other integrated cooperation in Tianjin Port exists to radiate out to the BTH regions, while Hebei ports need to develop their own special logistics functions to realize high efficiency in the logistics system. Based on the results of our models, we propose practical suggestions regarding how to promote economic development through investing in logistics and port-related indicators.
In this paper, the main innovations and policy implications are as follows:
- (1)
- The indicators include real investment in fixed assets (RINV) and traffic infrastructure density (TID). The investment has been great, and the investment achievement plays an essential role for economic development in all the BTH regions and in each sub-region. In addition, the planned investment in the Xiongan New Area will further provide impetus to the overall economic development. In particular, the role of TID is highly limited; it has been excessive in Beijing. Therefore, the shift from Beijing to Xiongan New Area, a new economic zone near Beijing, should have a “world-class transport system” that is green and smart. However, Tianjin also needs to develop a better traffic system to realize comprehensive coverage. Smooth and easy transit between Xiongan and the metropolises, such as Beijing and Tianjin, are necessary, and this is also essential to attract high-level talent from those cities to the new area.
- (2)
- Through research, we find that ports play an irreplaceable role in the economic development of the BTH regions. Among the four ports in the BTH regions (Tianjin 1, Hebei 3), Tianjin Port has a stronger influence; that is, there is a larger coefficient value in Tianjin than in all the other three ports in Hebei, and stronger interactive spillover effects exist between them. Because these ports are located nearby, reasonable harmonization between these ports should be undertaken to coordinate the development of the BTH regions. That is, these ports need to differently determine their own operation scopes. We can conclude that a synthetic collaboration of the logistics system in Tianjin Port exists to radiate out to the BTH regions, while Hebei ports need to develop their own special logistics functions to realize high efficiency in the logistics system. From the perspective of the whole BTH regions, the direct effect and the spillover effects of ports have stronger power in influencing the regional economy than the other indicators have. At the same time, the role of the port is also stronger in every single sub-region, such as Tianjin and Hebei, which also means that coordination of the sub-regional development continues to be required, and the role of the ports is highly important. We believe the establishment, construction and development of the Xiongan New Area will likely provide a continuing boost to port fundamentals.
- (3)
- There are too many logistics-related employees in BTH regions, and the supply exceeds the demand. However, similar states with unbalanced development in Beijing and Tianjin exist. In particular, the new area is established, and Hebei province continues to have a huge requirement for related professionals and human resources.
- (4)
- From the perspective of technological development, the technical reserve in all the BTH regions is second to last, which means technology patents make minimal contributions to the development of the economy. This situation is similar in Beijing and Hebei provinces but is different in Tianjin. The efficiency value of patents in Tianjin is the relatively largest, which suggests that the development of Tianjin’s economic development relies heavily on technology innovation. Therefore, the implementation of technological innovation remains the main driver of economic growth in Tianjin in the future; innovation will be the fundamental driver in building and developing the Xiongan New Area. The achievement of integrated and coordinated development in the BTH regions will be created through innovation and will attract innovative talent and teams to help build it, and, at the same time, will promote the sustainable development of the local economy.
- (5)
- The urbanization level of the BTH regions has played a positive role in all the BTH sub-regions but is different in each sub-region. For example, the urbanization level is an important type of catalyst in Tianjin and Hebei, while it is of limited use in Beijing. In fact, the urbanization level has caused “urban ills” in Beijing. This situation has formed resistance to its development. To realize coordinated development in the BTH regions, it is necessary to transfer certain functions of the industry or the government in Beijing to Tianjin and Hebei provinces. For example, some educational, medical, and public service functions, some financial service functions, the regional professional market, and other parts of the service industry, etc. Establishing the Xiongan New Area is “a very important integral part” of measures to transfer non-capital functions out of Beijing.
Furthermore, this paper can be extended by a few aspects in the future. We simply considered the spillover effect in the BTH regions without considering the spillover effect to this region from outside regions, such as Dalian Port and Qingdao Port in China. Thus, further research can be conducted regarding the BTH regions. Conversely, we can also compare several regions, such as the Pearl, the Yangtze River Delta, and the BTH regions.
Author Contributions
Conceptualization, F.H.; methodology, D.W.; investigation, D.W.; resources, F.H.; data curation, D.W.; writing—original draft preparation, F.H. and D.W.; writing—review and editing, B.L. and F.H.; visualization, B.L.; project administration, B.L.
Funding
This work was supported by the Xinzhou Teachers University in China (Grant No. 2018KY28).
Conflicts of Interest
The authors declare no conflicts of interest.
References
- Vitor, W.B.; Rosley, A.; Osvaldo, L.G.; Walter, L. Sustainable practices in logistics systems: An overview of companies in Brazil. Sustainability 2019, 11, 4140–4152. [Google Scholar]
- Asgari, N.; Hassani, A.; Jones, D.; Nguye, H.H. Sustainability ranking of the UK major ports: Methodology and case study. Transp. Res. Part E Logist. Transp. Rev. 2015, 78, 19–39. [Google Scholar] [CrossRef] [Green Version]
- Persdotter Isaksson, M.; Hulthén, H.; Forslund, H. Environmentally sustainable logistics performance management process integration between buyers and 3PLs. Sustainability 2019, 11, 3061. [Google Scholar] [CrossRef]
- Lu, M.; Xie, R.; Chen, P.; Zou, Y.; Tang, J. Green Transportation and logistics performance: An improved composite index. Sustainability 2019, 11, 2976. [Google Scholar] [CrossRef]
- Hossain, T.; Adams, M.; Walker, T.R. Sustainability initiatives in Canadian ports. Mar. Policy 2019, 106, 10351. [Google Scholar] [CrossRef]
- Walker, T.R.; Adebambo, O.; Feijoo, M.C.; Elhaimer, E.; Hossain, T.; Edwards, S.J.; Morrison, C.E.; Romo, J.; Sharma, N.; Taylor, S.; et al. Environmental effects of marine transportation. In World Seas: An Environmental Evaluation; Academic Press: Cambridge, MA, USA, 2019; pp. 505–530. [Google Scholar]
- Lee, P.T.W.; Kwon, O.K.; Ruan, X. Sustainability challenges in maritime transport and logistics industry and its way ahead. Sustainability 2019, 11, 1331. [Google Scholar] [CrossRef]
- Lean, H.H.; Huang, W.; Hong, J. Logistics and economic development: Experience from China. Transp. Policy 2014, 32, 96–104. [Google Scholar] [CrossRef]
- Jiang, B.; Prater, E. Distribution and logistics development in China: The revolution has begun. Int. J. Phys. Distrib. Logist. Manag. 2002, 32, 783–798. [Google Scholar] [CrossRef]
- Chen, C.; Lam, J.S.L. Sustainability and interactivity between cities and ports: A two-stage data envelopment analysis (DEA) approach. Marit. Policy Manag. 2018, 45, 944–961. [Google Scholar] [CrossRef]
- Shan, J.; Yu, M.; Lee, C.Y. An empirical investigation of the seaport’s economic impact: Evidence from major ports in China. Transp. Res. Part E Logist. Transp. Rev. 2014, 69, 41–53. [Google Scholar] [CrossRef]
- Tsekeris, T.; Tsekeris, C. Demand forecasting in transport: Overview and modeling advances. Econ. Res.-Ekon. Istraž. 2011, 24, 82–94. [Google Scholar] [CrossRef]
- Guerrero, J.I.; Selva, L.M.; Medina, R.P. Economic impact of Western Mediterranean leisure ports. Int. J. Transp. Econ. 2008, 35, 251–272. [Google Scholar]
- Bottasso, A.; Conti, M.; Ferrari, C.; Merk, O.; Tei, A. The impact of port throughput on local employment: Evidence from a panel of European regions. Transp. Policy 2013, 27, 32–38. [Google Scholar] [CrossRef]
- Bottasso, A.; Conti, M.; Ferrari, C.; Tei, A. Ports and regional development: A spatial analysis on a panel of European regions. Transp. Res. Part A Policy Pract. 2014, 65, 44–55. [Google Scholar] [CrossRef]
- Deng, P.; Lu, S.; Xiao, H. Evaluation of the relevance measure between ports and regional economy using structural equation modeling. Transp. Policy 2013, 27, 123–133. [Google Scholar] [CrossRef]
- Deng, T.; Shao, S.; Yang, L.; Zhang, X. Has the transport-led economic growth effect reached a peak in China? A panel threshold regression approach. Transportation 2014, 41, 567–587. [Google Scholar] [CrossRef]
- Zhu, H.W.; Wang, H.Y.; Zhu, Y.M. The research of relationship between economy development and logistics development based on statistical analysis. In Proceedings of the 14th International Conference on Management Science and Engineering, Harbin, China, 20–22 August 2007; pp. 1372–1377. [Google Scholar]
- Song, L.; Mi, J. Port infrastructure and regional economic growth in China: A granger causality analysis. Marit. Policy Manag. 2016, 43, 456–468. [Google Scholar] [CrossRef]
- Liu, W.; Li, W.; Huang, W. Analysis of the dynamic relation between logistics development and GDP growth in China. In Proceedings of the IEEE International Conference on Service Operations and Logistics, and Informatics (SOLI 2006), Shanghai, China, 21–23 June 2006; pp. 153–157. [Google Scholar]
- Cheng, S.P.; Peng, Q.Y. Empirical analysis on the effects of Anhui logistics industry on economic growth. Commun. Stand. Issue 2006, 150, 186–189. [Google Scholar]
- Lindsey, C.; Mahmassani, H.S.; Mullarkey, M.; Nash, T.; Rothberg, S. Regional logistics hubs, freight activity and industrial space demand: Econometric analysis. Res. Transp. Bus. Manag. 2014, 11, 98–104. [Google Scholar] [CrossRef]
- Lan, S.; Yang, C.; Huang, G.Q. Data analysis for metropolitan economic and logistics development. Adv. Eng. Inform. 2017, 32, 66–76. [Google Scholar] [CrossRef]
- Demurger, S. Infrastructure development and economic growth: An explanation for regional disparities in China? J. Comp. Econ. 2001, 29, 95–117. [Google Scholar] [CrossRef]
- Alleman, J.; Hunt, C.; Michaels, D.; Mueller, M.; Rappoport, P.; Taylor, L. Telecommunications and economic development: Empirical evidence from Southern Africa. In Proceedings of the 10th Biennial International Telecommunications Society Meeting, Sydney, Australia, 3–6 July 1994; p. 7. [Google Scholar]
- Fleisher, B.M.; Chen, J. The coast-noncoast income gap, productivity and regional economic policy in China. J. Comp. Econ. 1997, 25, 220–236. [Google Scholar] [CrossRef]
- Zhang, Q.; Wu, Y.; Wang, L. Implications of increased regional economic complexity. In Transforming Economic Growth and China’s Industrial Upgrading; Springer: Singapore, 2018; pp. 153–178. [Google Scholar]
- Li, K.X.; Jin, M.; Qi, G.; Shi, W.; Ng, A.K. Logistics as a driving force for development under the belt and road initiative–the Chinese model for developing countries. Transp. Rev. 2018, 38, 457–478. [Google Scholar] [CrossRef]
- Banister, D. Transport and economic development: Reviewing the evidence. Transp. Rev. 2012, 32, 1–2. [Google Scholar] [CrossRef]
- Berechman, J.; Ozmen, D.; Ozbay, K. Empirical analysis of transportation investment and economic development at state, county and municipality levels. Transportation 2006, 33, 537–551. [Google Scholar] [CrossRef]
- Jiang, N. Seaport Investment and Economic Development in China; Dalian Marine University Press: Dalian, China, 2010. [Google Scholar]
- Song, L.; Van Geenhuizen, M. Port infrastructure investment and regional economic growth in China: Panel evidence in port regions and provinces. Transp. Policy 2014, 36, 173–183. [Google Scholar] [CrossRef]
- Akhavan, M. Development dynamics of port-cities interface in the Arab Middle Eastern world-The case of Dubai global hub port-city. Cities 2017, 60, 343–352. [Google Scholar] [CrossRef]
- Munim, Z.H.; Schramm, H.J. The impacts of port infrastructure and logistics performance on economic growth: The mediating role of seaborne trade. J. Shipp. Trade 2018, 3, 1. [Google Scholar] [CrossRef]
- Dai, Q.; Yang, J.; Li, D. Modeling a three-mode hybrid port-hinterland freight intermodal distribution network with environmental consideration: The case of the Yangtze river economic belt in China. Sustainability 2018, 10, 3081. [Google Scholar] [CrossRef]
- Danielis, R.; Gregori, T. An input-output-based methodology to estimate the economic role of a port: The case of the port system of the Friuli Venezia Giulia Region, Italy. Marit. Econ. Logist. 2013, 15, 222–255. [Google Scholar] [CrossRef] [Green Version]
- Fujita, M.; Krugman, P.R.; Venables, A.J. The Spatial Economy: Cities, Regions, and International Trade; MIT Press: Cambridge, MA, USA, 2001. [Google Scholar]
- Castro-Villaverde, J.; Coto-Millán, P. Port economic impact: Methodologies and application to the port of Santander. Int. J. Transp. Econ. 1998, 2, 159–179. [Google Scholar]
- Davis, H.C. Regional port impact studies: A critique and suggested methodology. Transp. J. 1983, 23, 61–71. [Google Scholar]
- Yochum, G.R.; Agarwal, V.B. Economic impact of a port on a regional economy: Note. Growth Chang. 1981, 8, 74–87. [Google Scholar] [CrossRef]
- Acciaro, M. The role of ports in the development of Mediterranean islands: The case of Sardinia. Int. J. Transp. Econ. 2008, 35, 295–324. [Google Scholar]
- Bryan, J.; Munday, M.; Pickernell, D.; Roberts, A. Assessing the economic significance of port activity: Evidence from ABP operations in industrial South Wales. Marit. Policy Manag. 2006, 33, 371–386. [Google Scholar] [CrossRef]
- Ding, H.C.; Lian, M.R.; Chen, X.Y.; Liu, J.M.; Zhong, Z.C.; Zhang, Y.F.; Zhou, M.Y. Research on the correlation of port logistics and regional economic growth base on gray relational analysis method. Concurr. Comput. Pract. Exp. 2019, 31, 4744. [Google Scholar] [CrossRef]
- Sun, J.; Yu, S. Research on relationship between port logistics and economic growth based on VAR: A case of Shanghai. Am. J. Ind. Bus. Manag. 2019, 9, 1557–1567. [Google Scholar] [CrossRef]
- Musso, E.; Benacchio, M.; Ferrari, C. Ports and employment in port cities. Int. J. Marit. Econ. 2000, 2, 283–311. [Google Scholar] [CrossRef]
- Fageda, X.; Gonzalez-Aregall, M. Do all transport modes impact on industrial employment? Empirical evidence from the Spanish regions. Transp. Policy 2017, 55, 70–78. [Google Scholar] [CrossRef]
- Oosterhaven, J.; Eding, G.J.; Stelder, D. Clusters, linkages and interregional spillovers: Methodology and policy implications for the two Dutch main ports and the rural north. Reg. Stud. 2001, 35, 809–822. [Google Scholar] [CrossRef]
- Cohen, J.; Monaco, K. Ports and highways infrastructure: An analysis of intra- and interstate spillovers. Int. Reg. Sci. Rev. 2008, 31, 257–274. [Google Scholar] [CrossRef]
- Park, J.S.; Seo, Y.J. The impact of seaports on the regional economies in South Korea: Panel evidence from the augmented Solow model. Transp. Res. Part E Logist. Transp. Rev. 2016, 85, 107–119. [Google Scholar] [CrossRef]
- Merk, O.; Comtois, C. Competitiveness of Port-Cities: The Case of Marseille-Fos-France; OECD Regional Development Working Papers; OECD iLibrary: Paris, France, 2012. [Google Scholar]
- Deng, X.; Huang, J.; Rozelle, S.; Zhang, J.; Li, Z. Impact of urbanization on cultivated land changes in China. Land Use Policy 2015, 45, 1–7. [Google Scholar] [CrossRef]
- Yu, N.; De Jong, M.; Storm, S.; Mi, J. Spatial spillover effects of transport infrastructure: Evidence from Chinese regions. J. Transp. Geogr. 2013, 28, 56–66. [Google Scholar] [CrossRef]
- Coma, C.W.; Douglas, P.H. A theory of production. Am. Econ. Rev. 1928, 18, 139–165. [Google Scholar]
- Skufina, T.; Baranov, S.; Samarina, V.; Shatalova, T. Production functions in identifying the specifics of producing gross regional product of Russian Federation. Mediterr. J. Soc. Sci. 2015, 6, 265. [Google Scholar] [CrossRef]
- Rahim, A.; Hastuti, D.R.D.; Firmansyah, W.S.; Syam, A. The applied of Cobb–Douglas production function with determinants estimation of small-scale fishermen’s catches production. Int. J. Oceans Oceanogr. 2019, 13, 81–95. [Google Scholar]
- Hossain, M.; Majumder, A.K.; Basak, T. An application of non-linear Cobb–Douglas production function to selected manufacturing industries in Bangladesh. Open J. Stat. 2012, 2, 460–468. [Google Scholar] [CrossRef]
- Mehrjerdi, M.Z.; Mark, T. Estimating the Productivity of Wheat Production: An Implication of Stochastic Frontier Production Function Model; No. 2015-2018-306; AgEcon Search: Twin Cities, USA, 2018. [Google Scholar]
- Khan, A.; Mehmood, B.; Sair, S.A. Is Pakistan’s banking sector production function Cobb–Douglas? Estimates of the elasticity of substitution. Sci. Int. 2015, 27, 2775–2778. [Google Scholar]
- Tavasszy, L.; de Jong, G. Data availability and model form. In Modelling Freight Transport; Elsevier: Amsterdam, The Netherlands, 2014; pp. 229–244. [Google Scholar]
- Nuzzolo, A.; Crisalli, U.; Comi, A. An aggregate transport demand model for import and export flow simulation. Transport 2015, 30, 43–54. [Google Scholar] [CrossRef]
- Jia, J.; Deng, H.; Duan, J.; Zhao, J. Analysis of the major drivers of the ecological footprint using the STIRPAT model and the PLS method—A case study in Henan Province, China. Ecol. Econ. 2009, 68, 2818–2824. [Google Scholar] [CrossRef]
- Geladi, P.; Kowalski, B.R. An example of 2-block predictive partial least-squares regression with simulated data. Anal. Chim. Acta 1986, 185, 19–32. [Google Scholar] [CrossRef]
Figure 1.
The Beijing–Tianjin–Hebei (BTH) regions in our paper.

Figure 2.
(a–d) t1/t2 oval plot.

Figure 3.
(a–d) t1/t2 scatter plot.


Table 1.
Port differences in BTH regions.
| Designed Throughput (104 Tons) | Goods | Logistics Channel | |
|---|---|---|---|
| TJP | 21,399 | Containers, Coal, Ore, Crude oil, Large equipment, Liquefied natural gas | Roads |
| QHDP | 23,699 | Coal, Groceries, Oil products, Containers | Roads, Railways |
| TSP | 42,217 | Coal, Steel, Ceramics, Ore, Cement, Container | Roads, Railways |
| HHP | 15,060 | Coal, Container, Ore, Steel, Grain | Roads, Railways |
Source: China Port Statistical Yearbook (2012–2018). TJP (Tianjin Port), QHDP (Qinhuangdao Port), TSP (Tangshan Port), HHP (Huanghua Port).
Table 2.
Literature review of this paper.
| RE | SE | IE | ET | CI | PT | TL | UL | TG | |
|---|---|---|---|---|---|---|---|---|---|
| Lean et al. [8] | √ | √ | √ | √ | √ | ||||
| Zhu et al. [18] | √ | √ | √ | ||||||
| Deng et al. [16] | √ | √ | √ | ||||||
| Park and Seo [49] | √ | √ | √ | ||||||
| Deng et al. [51] | √ | √ | |||||||
| Yu et al. [52] | √ | √ | √ | √ | |||||
| Bottasso et al. [15] | √ | √ | √ | √ | |||||
| Li et al. [28] | √ | √ | √ | √ | √ | ||||
| Song and Mi [21] | √ | √ | √ | ||||||
| This paper | √ | √ | √ | √ | √ | √ | √ | √ | √ |
Notes: RE (regional economy), SP (spillover effects), IE (infrastructure), ET (employment), CI (capital investment), PT (port throughput), TL (technology level), UL (urbanization level), TG (transportation GDP).
Table 3.
Definition of the variables.
| Variables | Definition | Unit | Mean | Min | Max | S. D |
|---|---|---|---|---|---|---|
| RINV | Real investment in assets in constant 1995 prices | 104 yuan | 6292.96 | 1977.776 | 14,619.85 | 4163.036 |
| DE | Number of persons employed in the distribution sector | 104 units | 199.627 | 160.353 | 264.617 | 324.936 |
| Port | Port cargo throughput | 104 ton | 51,010.94 | 14,602 | 123,931 | 37,479.05 |
| TID | The length of the route of per square kilometer | km/km2 | 0.599 | 0.337 | 0.958 | 0.249 |
| U | The proportion of urban population to total population | % | 35.992 | 28.179 | 51.73 | 6.624 |
| Patent | Patents granted annually | unit | 24,057 | 5720 | 85,608 | 22,897.55 |
| TranspGDP | Transportation GDP added value | 104 yuan | 1138.68 | 369.58 | 2051.778 | 520.136 |
Table 4.
Results of OLS regression model.
| Model 1 | Model 2 | Model 3 | Model 4 | |||||
|---|---|---|---|---|---|---|---|---|
| Variables | COEFF. | TOL. | COEFF. | TOL. | COEFF. | TOL. | COEFF. | TOL. |
| (Constant) | 1.059 | 4.558 | −1.181 | 0.002 | −0.415 | |||
| ln RINV | 0.261 | 0.005 | 0.062 | 0.066 | 0.054 | 0.008 | 0.18 | 0.007 |
| ln DE | 0.127 | 0.025 | 0.093 | 0.021 | 0.261 | 0.067 | 0.07 | 0.013 |
| lnPorTJ | 0.443 | 0.004 | −0.119 | 0.217 | 0.351 | 0.003 | −0.013 | 0.052 |
| lnPortHB | −0.179 | 0.003 | −0.093 | 0.137 | 0.311 | 0.056 | 1.017 | 0.015 |
| lnTID | 0.002 | 0.038 | 0.275 | 0.058 | −0.077 | 0.056 | −0.056 | 0.022 |
| lnU | 0.174 | 0.044 | 0.555 | 0.012 | 0.031 | 0.35 | 0.011 | 0.006 |
| lnPatent | −0.028 | 0.014 | 0.698 | 0.004 | 0.401 | 0.017 | 0.436 | 0.002 |
| lnTranspGDP | 0.225 | 0.021 | −0.623 | 0.003 | −0.028 | 0.002 | −0.152 | 0.003 |
Notes: OLS represents the ordinary least squares; COEFF. is the abbreviation of coefficient. TOL refers to tolerance.
Table 5.
Test results of the OLS regression model.
| Model 1 | Model 2 | Model 3 | Model 4 | |
|---|---|---|---|---|
| R2 | 0.998 | 0.997 | 0.998 | 0.999 |
| adjust R2 | 0.996 | 0.994 | 0.996 | 0.999 |
| F | 593.605 | 383.681 | 488.536 | 1501.282 |
| Sig. | 0 | 0 | 0 | 0 |
| Durbin–Watson | 1.485 | 1.604 | 1.588 | 2.215 |
Notes: F represents the value of the F test; Sig. stands for the significance level.
Table 6.
Coefficients and VIP of PLS.
| Model 1 | Model 2 | Model 3 | Model 4 | |||||
|---|---|---|---|---|---|---|---|---|
| Variables | COEFF. | VIP | COEFF. | VIP | COEFF. | VIP | COEFF. | VIP |
| (Constant) | 18.9419 | 22.7777 | 18.5403 | 18.9766 | ||||
| ln RINV | 0.1431 | 1.0116 | 0.2479 | 1.0708 | 0.1393 | 1.0183 | 0.1289 | 1.0146 |
| lnDE | −0.0293 | 0.9794 | −0.0626 | 0.9445 | −0.0591 | 0.4317 | 0.1264 | 0.9947 |
| lnPorTJ | 0.2619 | 1.0255 | 0.1977 | 1.0488 | 0.1506 | 1.1007 | 0.1297 | 1.0211 |
| lnPortHB | 0.0901 | 1.0022 | 0.0827 | 1.0085 | 0.1488 | 1.088 | 0.1288 | 1.0134 |
| lnTID | 0.0239 | 0.9726 | 0.1167 | 0.9842 | 0.1377 | 1.0064 | 0.1229 | 0.9674 |
| lnU | 0.1096 | 0.989 | 0.0555 | 0.9016 | 0.1412 | 1.0323 | 0.1258 | 0.9903 |
| lnPatent | 0.0228 | 0.986 | 0.019 | 0.9864 | 0.1468 | 1.703 | 0.1248 | 0.9823 |
| lnTranspGDP | 0.3924 | 1.032 | 0.3797 | 1.044 | 0.1468 | 1.7032 | 0.129 | 1.0149 |
| R2X | 0.974 | 0.927 | 0.956 | 0.827 | ||||
| R2Y | 0.995 | 0.98 | 0.988 | 0.989 | ||||
| Q2 | 0.991 | 0.965 | 0.986 | 0.985 | ||||
| R2 | 0.995 | 0.98 | 0.988 | 0.985 | ||||
Notes: VIP represents the variable importance in projection.
© 2019 by the authors. Licensee MDPI, Basel, Switzerland. This article is an open access article distributed under the terms and conditions of the Creative Commons Attribution (CC BY) license (http://creativecommons.org/licenses/by/4.0/).
Share and Cite
MDPI and ACS Style
Han, F.; Wang, D.; Li, B. Spillover Effects of Ports and Logistics Development on Economic Power: Evidence from the Chinese BTH Regions. Sustainability 2019, 11, 4316. https://0-doi-org.brum.beds.ac.uk/10.3390/su11164316
AMA Style
Han F, Wang D, Li B. Spillover Effects of Ports and Logistics Development on Economic Power: Evidence from the Chinese BTH Regions. Sustainability. 2019; 11(16):4316. https://0-doi-org.brum.beds.ac.uk/10.3390/su11164316
Chicago/Turabian StyleHan, Feiyan, Daming Wang, and Bo Li. 2019. "Spillover Effects of Ports and Logistics Development on Economic Power: Evidence from the Chinese BTH Regions" Sustainability 11, no. 16: 4316. https://0-doi-org.brum.beds.ac.uk/10.3390/su11164316
Note that from the first issue of 2016, this journal uses article numbers instead of page numbers. See further details here.