AI-Based Physical and Virtual Platform with 5-Layered Architecture for Sustainable Smart Energy City Development


School of Electrical and Electronics Engineering, Chung-Ang University, Seoul 06974, Korea
*
Author to whom correspondence should be addressed.
Sustainability 2019, 11(16), 4479; https://0-doi-org.brum.beds.ac.uk/10.3390/su11164479
Submission received: 19 June 2019
/
Revised: 5 August 2019
/
Accepted: 7 August 2019
/
Published: 19 August 2019
(This article belongs to the Special Issue Modelling Smart and Sustainable Cities as Complex Systems)
Abstract
:To build sustainable smart energy cities (SECs) around the world, many countries are now combining customized services and businesses within their energy infrastructure and urban environments. Such changes could then promote the development of platforms that ultimately provide benefits for citizens such as convenience, safety, and cost savings. Currently, the development of technologies for SECs focuses on independent products and unit technology. However, this is problematic, as it may not be possible to develop sustainable cities if there is a lack of connectivity between various elements within the SEC. To solve such problems, this paper presents an AI-based physical and virtual platform using a 5-layer architecture to develop a sustainable smart energy city (SSEC). The architecture employs both a top-down and bottom-up approach and the links between each energy element in the SSEC can readily be analyzed. The economic analysis based on return on investment (ROI) is carried out by comparing the economic benefits before and after the application of this system. Deploying the proposed platform will enable the speedy development and application of new services for SSECs and will provide SSECs with measures to ensure sustainable development, such as rapid urban development, and cost reductions.
1. Introduction
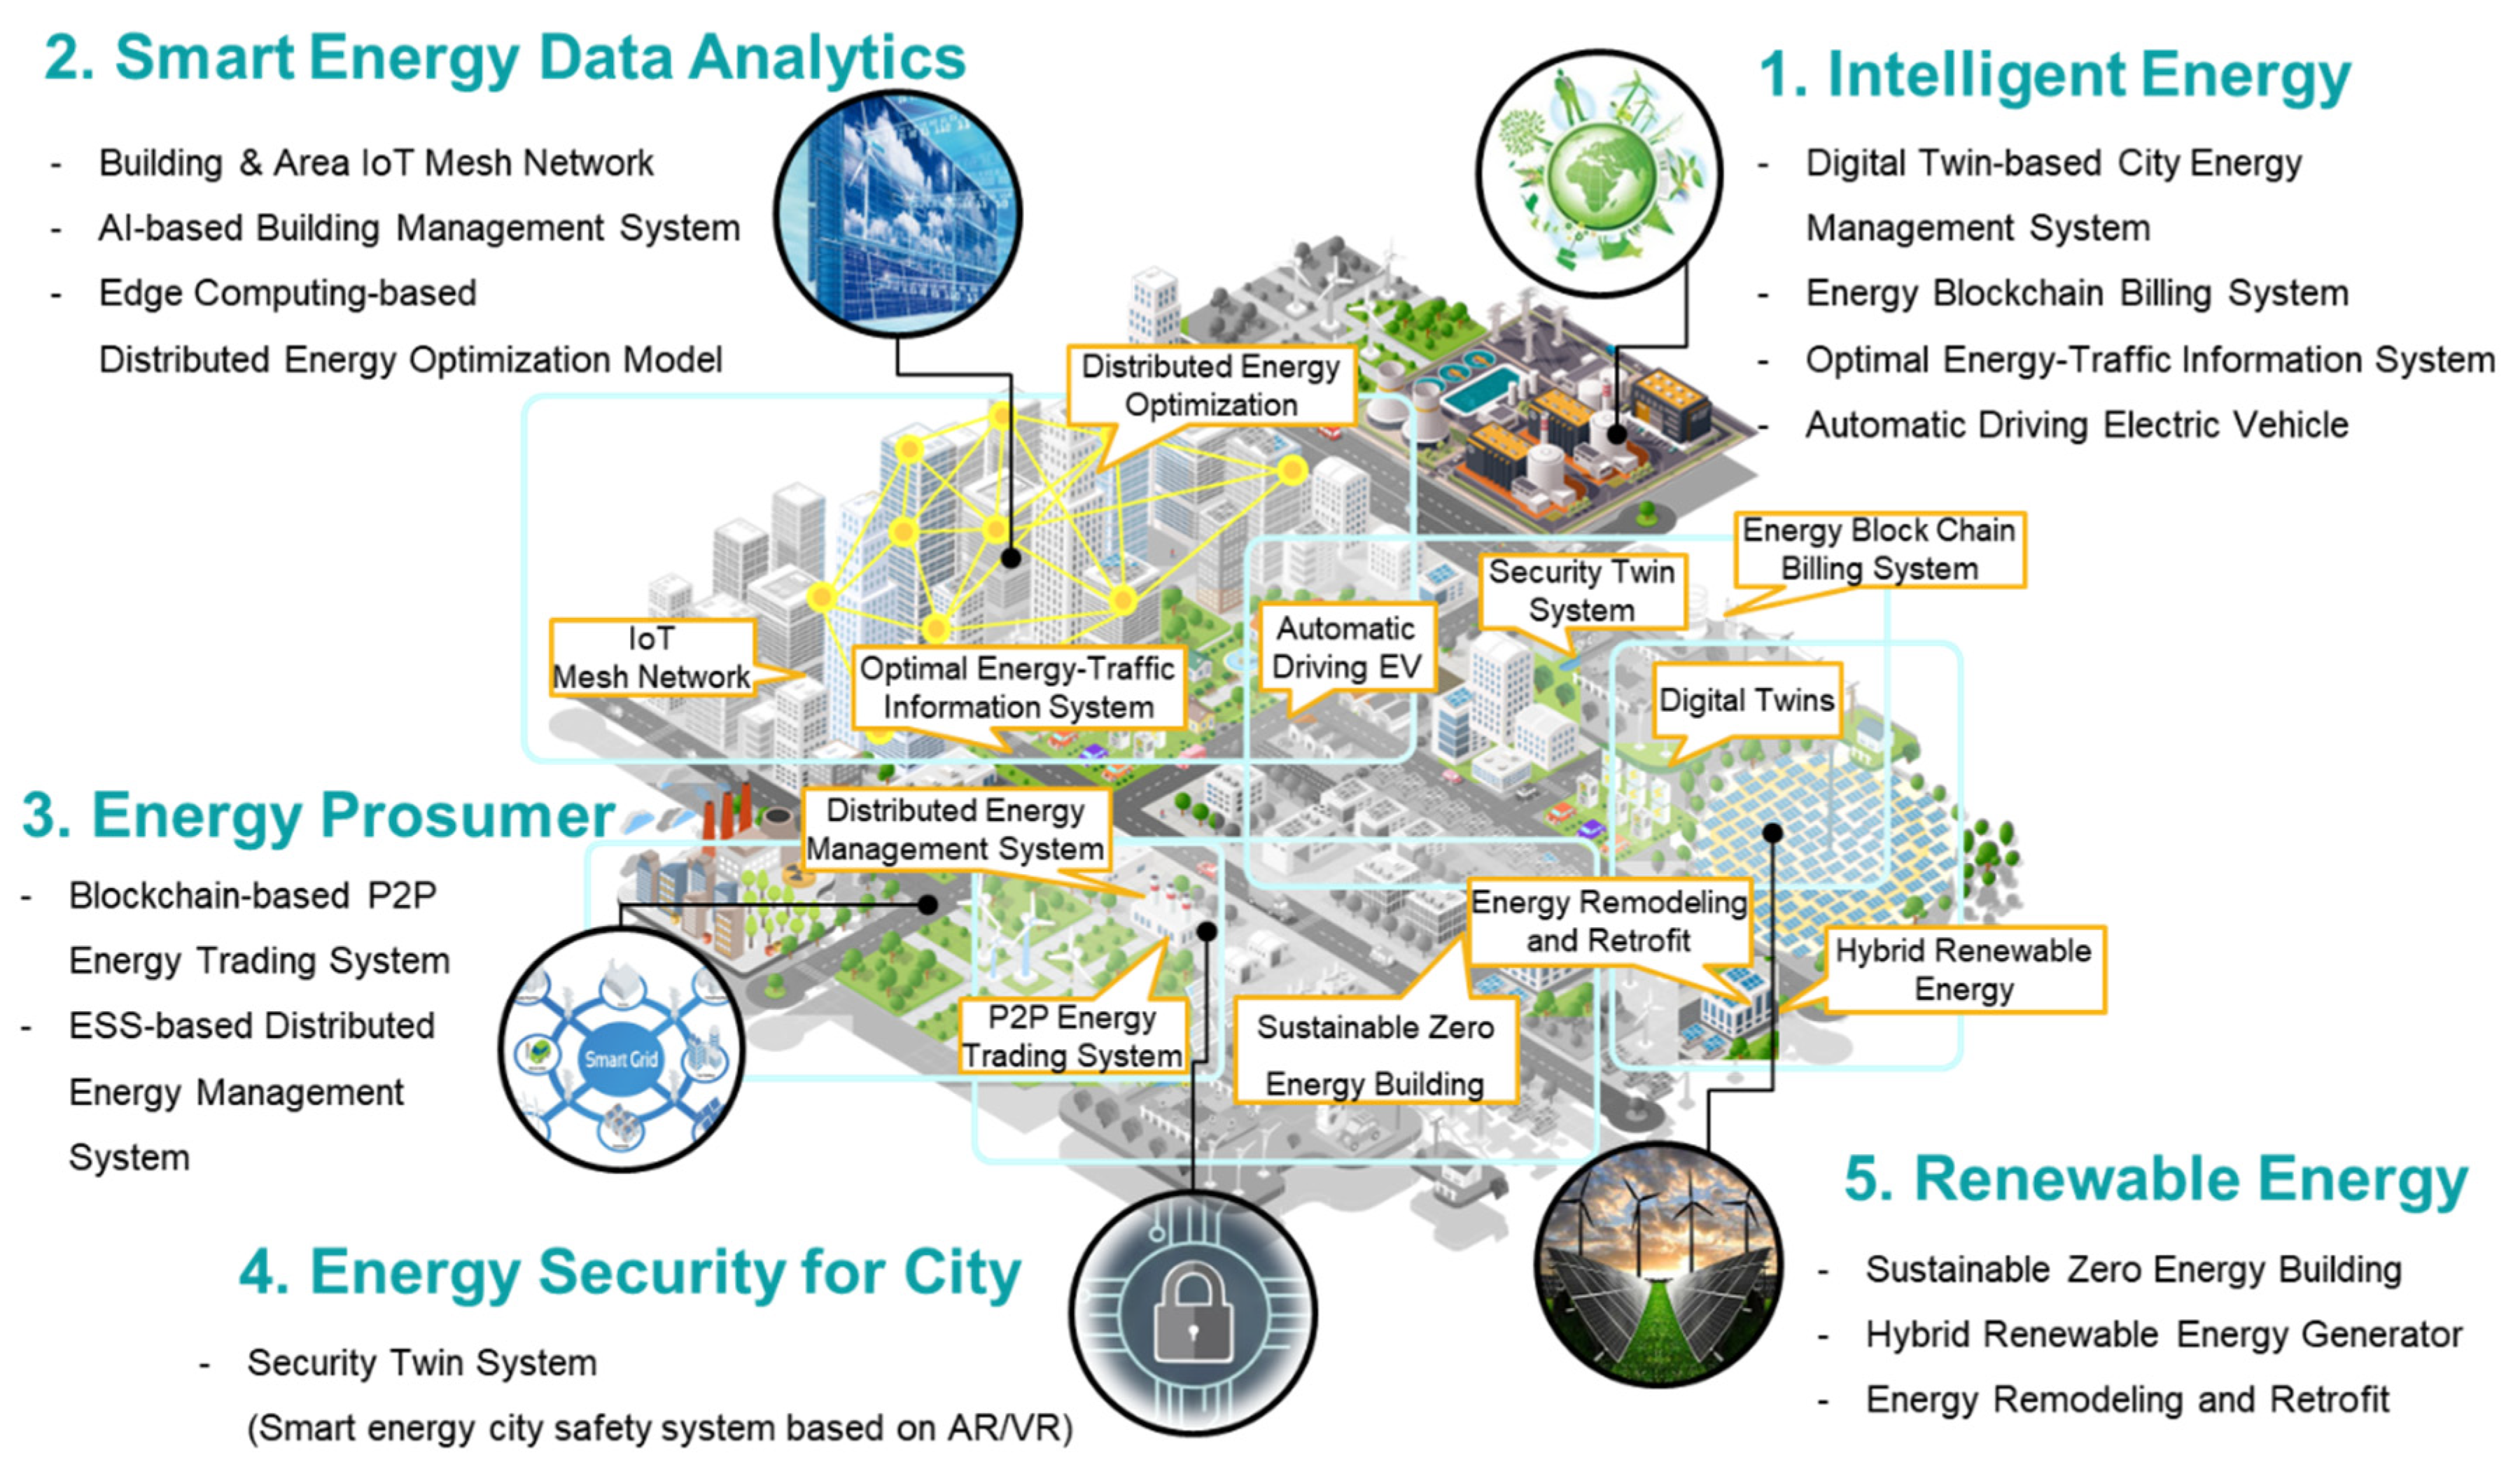
The smart city (SC) concept has gained substantial attention over the last few years, as it applies advances in the Internet of Things (IoT) technology to enhance the quality and efficiency of services and resources. SC is an urban area that uses different types of sensors to collect electronic data and supply information that is then used to manage assets and resources efficiently. Such data include those relating to citizens, devices, and assets, and they are processed and analyzed to enable monitoring and management of traffic and transportation systems, power plants, water supply networks, waste management, law enforcement agencies, information systems, schools, libraries, hospitals, and other community services [1]. A city that optimizes its energy use with an emphasis on energy management, and thus saves energy efficiently, is called a smart energy city (SEC) [2,3,4]. Figure 1 shows the concept of a future SEC, and it refers to the five components required for its implementation: smart energy, smart energy data analytics, energy prosumer, energy security, and renewable energy. The future construction of sustainable SECs (SSECs) will employ the efficient management and trade of energy through the links between these energy elements.
1.1. Description of a Sustainable Smart Energy City (SSEC)
The sustainable smart energy city (SSEC) concept presented in this paper is platform-driven and provides convenience, safety, and cost savings to its citizens by combining customized services and businesses into various environments within the existing urban energy infrastructure [5]. Sustainability in this context implies that it can be maintained, that is it is capable of sustaining being sustained of, relating to, or being a method of harvesting or using a resource, such that it is not depleted or permanently damaged, and relating to a lifestyle involving the use of sustainable methods [6]. This can be considered in two ways. The first is the energy saving aspect. Sustainability in a SEC combines intelligent elements of the energy sector, such as smart grids, micro grids, smart homes/buildings/factories, smart street lights, and smart farms [7]. The second aspect of sustainability is the social and economic factors, that is the SEC platform includes sustainable development with respect to social and economic aspects [8]. Here, platform means building an infrastructure for the efficient development of technology within the city [9]. Basically, this involves building a SEC within the energy infrastructure of the city to solve social and economic problems by establishing an infrastructure for continuous development [10]. This will enable a secure and happy life, and a fast and cost-effective city using smart infrastructure. In this paper, we aim to build a SEC platform in a quick and cost-effective manner using the SEC platform. As cities have diverse social and cultural environments, pre-analysis is required to implement an SSEC. Sustainable development of an SEC require intelligent and systematic application of technologies and an analysis of each of the city’s components using a composite top-down and bottom-up platform. In general, sustainability in the energy industry means the efficient use of energy, but it also refers to the development and application of energy technologies to enable the efficient operation of the platform [11].
1.2. Current Problems Relating to Development of SECs
The current technologies being developed for SECs focus on independent products and unit technology, making it difficult to develop SSECs due to poor connectivity between city elements. Alexandr Krylovskiy et al. [12] revealed that despite standardization efforts and widespread adoption of web standards and cloud computing technologies, IoT based large-scale SC platforms remain challenging, in practice. They suggested that dynamically changing the IoT environment requires scalability and evolution of these systems over time, and the adoption of new technologies and requirements. In particular, the absence of standardization when securing connectivity between unit technologies in the IoT-based energy industry creates hurdles in connecting products and services between businesses. Such a phenomenon is an impediment in the creation of SSECs [13]. Komninos et al. [14] provided an explanation for the low impact of various individual applications of smart cities and discussed ways of improving their effectiveness by overall SC ontologies. Moreover, they showed the relationships of ontology and discussed its role in improving the effectiveness of SC applications, combining expert and user-driven ontological designs with the integration and arrangement of applications over platforms and larger city entities. Thus, they recognized the problems of SC connectivity and proposed an efficient way based on ontology to solve them.
1.3. Proposed SSEC
Currently, established standards pertaining to energy fields for the development of SECs are lacking despite numerous efforts. Furthermore, current technological developments address only unit elements of energy technology, and lack a synergistic approach (taking into account all unit elements of energy) for the development of a SEC. The SSEC involves several technologies, including smart energy, smart meters, smart home/building/factory, smart grids, and electric cars. In order to truly realize the concept of a SEC, these elements need to be linked intelligently. This paper suggests that these connections must be considered and developed prior to the development of individual elemental technologies. This would lead to a more feasible, rapid, and cost-effective development of SECs. Following questions are the motivation behind this study.
- Problems: The components of a SEC are not linked to other technologies because current technology development focuses on unit elements of energy technology. This is because no standardized SECs have been established yet in energy fields.
- Solutions: For effective functioning of a SEC, smart system elements should function as stand-alone entities, as well as be compatible with other elements. The connections between all individual elemental technologies must be considered and developed prior to the development of the technology itself. This would lead to more feasible, rapid, and cost-effective development of SECs in future. Therefore, this study proposes a 5-layer architecture for analyzing the connectivity of technology elements before building a SEC.
This paper presents a 5-layer-based physical and virtual SEC platform to solve current issues associated with SSEC development. Based on a composite top-down and bottom-up platform, the deployment of SSECs can be achieved. The paper attempts to configure the complexities of a SC through the SEC platform, by answering the following questions:
- How do the energy elements that constitute the SECs link together to form an organic platform technically, economically, and socially?
- How can energy elements be organically linked to implement AI-based smart energy cities for intelligent energy efficiency management?
- Is it possible to build smart energy cities quickly and cost-effectively by organically-linking the SEC platform?
This paper presents an analysis of the linkages between energy elements in a city based on the AI-based 5-layer SEC architecture and presents an SSEC that is based on physical and virtual platforms. Through this method, a structured SSEC infrastructure can be quickly developed to enable mass-customization [11] of urban services based on platforms. By implementing this platform-driven infrastructure, cost-effective solutions can be made. The cost savings related to the deployment of SSEC are analyzed using a ROI (return on investment) method and presented within this paper. This paper presents the architecture and platform for the SEC that has not been established yet rather than providing a solution for any stand-alone system. Moreover, the economic analysis of the proposed architecture based on ROI was carried out and conclusions were drawn, that is a comparison of the economic benefits before and after the application of this system (reduction of smart system construction cost, energy saving by smart system, growth rate of AI-based energy saving, economic gain by applying vehicle to grid/electrical vehicle (V2G/EV), and system performance degradation) was undertaken. With this proposed architecture, the following benefits were obtained:
- Connectivity: Overall system connectivity can be strengthened by classifying the characters of energy element technologies in urban areas.
- Promptness: A SSEC can be built that responds quickly by establishing a cyclical structure based on a composite top-down and bottom-up platform.
- Manufacturing process and cost-effectiveness: Efficient SSECs can be built by mass-customization based manufacturing process based on a composite top-down and bottom-up platform.
- Guidelines for pre-analyzing obstacles and risk management: This platform provides guidance for pre-analyzing obstacles and managing risks when applying services [15].
The remainder of this paper is presented as follows: Section 2 presents related works and investigates past papers and theories related to the architecture proposed; Section 3 presents the proposed SSEC structure; Section 4 presents specific scenario-based linked models and analyses; Section 5 extracts the elements necessary to implement a SSEC from a cost-effective perspective; and Section 6 summarizes the paper.
2. Related Works
2.1. Sustainable Smart Energy City (SSEC)
Efficient energy management methods have been previously researched with the aim of building SSECs. Such methods have usually aimed to establish an energy management plan and have involved the following steps. An energy consumption model is constructed by analyzing information relating to members involved in the SC, and the energy management plan is constructed based on an energy consumption model [16]. After organizing the energy management plan, the infrastructure required to operate it is constructed and built around the IoT to enable implementation of the plan [17]. The IoT-focused infrastructure transforms smart cities into SSECs, and the main role is to analyze energy data generated through the IoT and implement efficient energy management simulations [18]. Zaheer Allam et al. [19] tried to determine economically how SC technologies and approaches could be used to fit into the old urban fabric; moreover, they tried to restore and regenerate it rather than redevelop it into a modernist architecture. However, as no efficient platform currently exists for the utilization of the IoT infrastructure, the benefits of the proposed SSECs have not yet been realized. In addition, although energy-oriented platforms have been proposed, they have been insufficient, and do not present the economic benefits of reducing infrastructure cost for sustainable development by our proposed architecture [7].
2.2. Artificial Intelligence (AI)
Artificial Intelligence (AI) research is defined as the study of “intelligent agents” and of any device that perceives its environment and takes actions that maximize its chance of successfully achieving its goals [20]. Kaplan and Haenlein define AI as “a system’s ability to correctly interpret external data, to learn from such data, and to use those learnings to achieve specific goals and tasks through flexible adaptation” [21]. Shahzad Khan et al. [22] presented AI-based smart city (SC) concepts by applying edge computing nodes and IoT sensors to optimize the benefits from microgrids in residential areas, neighborhoods, campuses, enterprises, and community levels. Zaheer Allam [23,24] showed an AI-based theoretical model in order to achieve increasing complexities in smart cities. This paper proposes smart design technology and a methodology for use in realizing a sustainable city based on AI. In this paper, AI is closely related to the cyclic structure of the proposed architecture (top-down, bottom-up approach). As can be seen from Section 3.2. and 3.6. the cyclical structure starts with the initial hardware platform and ends with a virtual layer in building SEC. As this is an ongoing process, the recursive structure will not be finished on a piece-by-line basis but will continue to progress and the data will continue to accumulate. When the monthly, quarterly, yearly, and 10-yearly empirical data are accumulated, the service is upgraded. A more detailed description is shown in Section 3.4.
2.3. Layering Architecture
Studies have been conducted to build the infrastructure for SSECs, and although several forms of architecture have been suggested, most have similar network structures as follows: the main layer of the structure is the service layer required for the SSEC, the application layer relates to service provision, the IoT layer involves service performance, and the final network layer provides communication between all layers [10,18,25]. Additional layers can then be provided to enable a data analysis of data relating to the IoT, or to consider laws and cultures within cities [26]. However, such architecture focuses on network technologies and energy efficiency platforms and does not consider the economics of scalability and sustainability that could be achieved by platforms in SEC. With an expansion in the domain size of SEC, the proposed paper can provide management efficiency for infrastructure construction and operation based on the proposed platform.
2.4. Physical and Virtual Platform
Building an infrastructure for an SSEC that is scalable requires one that is domain-centric and physical and one that is digital and virtual that can interact in real time. These infrastructures should not be separate from each other and act independently, and they should be utilized as a platform. However, previous research has focused on either physical or virtual platforms, and only data generated from physical platforms has been collected and analyzed [27]. In addition, the results obtained from virtual platforms have not been implemented on the physical platform because existing SSEC virtual platforms are not linked to the physical platform [28,29,30,31].
2.5. Digital Twin
The link between a physical platform that manages the IoT of the SSEC and a virtual platform and which can derive services that are valid for the SSEC is known as the SSEC digital twin. Currently, SSEC digital twin research is at the level of modeling city infrastructure and managing it within a virtual space via virtual reality (VR) equipment [32]. Although this is a step towards implementing a virtual platform, a link with the physical platform has not yet been made. However, the link between the physical and virtual platforms can be implemented using current technology if the hardware performance and network speed are improved.
2.6. Mass-Customization
Mass-customization is a marketing method that provides a highly competitive ability when customizing and mass producing goods [33]. In this study, mass-customization is used from an engineering perspective in IoT design as an economic concept that considers a large consumer group with individual needs. In this respect, it relates to a mass production method that meets various needs to the greatest extent possible by identifying and categorizing common consumer requirements [34]. It is an economic concept used to reduce production costs by minimizing marginal costs through the customization of various and specific parts of the sensors and mass-producing common parts of the sensors to satisfy various IoT services. A method has been presented for producing cost-effective IoT devices [11], which addresses the grand scale of the IoT paradigm through the above economic concept. The mass-customization methodology is very important to build a cost-effective SEC. Mass-customization is a marketing term, which means that mass production is combined with customization to build various smart systems within the SEC, making it more cost effective. This cost-effectiveness is presented and verified in Section 5 of this paper. Many kinds of mass-customization-based papers have been presented; however, they consider the energy saving and convenience aspects. This paper suggests an architecture to enhance the overall infrastructure construction and operation efficiency in the city.
There are many articles related to SSEC, artificial intelligence, layering architecture, physical and virtual platform, digital twin, and mass-customization. However, it was hard to find a paper that considered all of these factors. This paper applies the energy infrastructure of the city based on a 5-layer based platform to build a sustainable city by increasing the economic/social/technical efficiency of construction and operation, as well as improving the overall energy efficiency and network infrastructure performance. Moreover, this paper examines the effects and benefits of economic (smart system energy saving), social (smart system construction cost reduction), technical (AI-based energy saving increase rate, economic efficiency through V2G/EV application, Gain) aspects by ROI, and calculates the payback period. Table 1 shows the summary of related works and analysis of novelty between each paper.
3. Proposed Architecture for Sustainable Smart Energy City (SSEC)
3.1. 5-Layer Based SEC Physical Platform Architecture
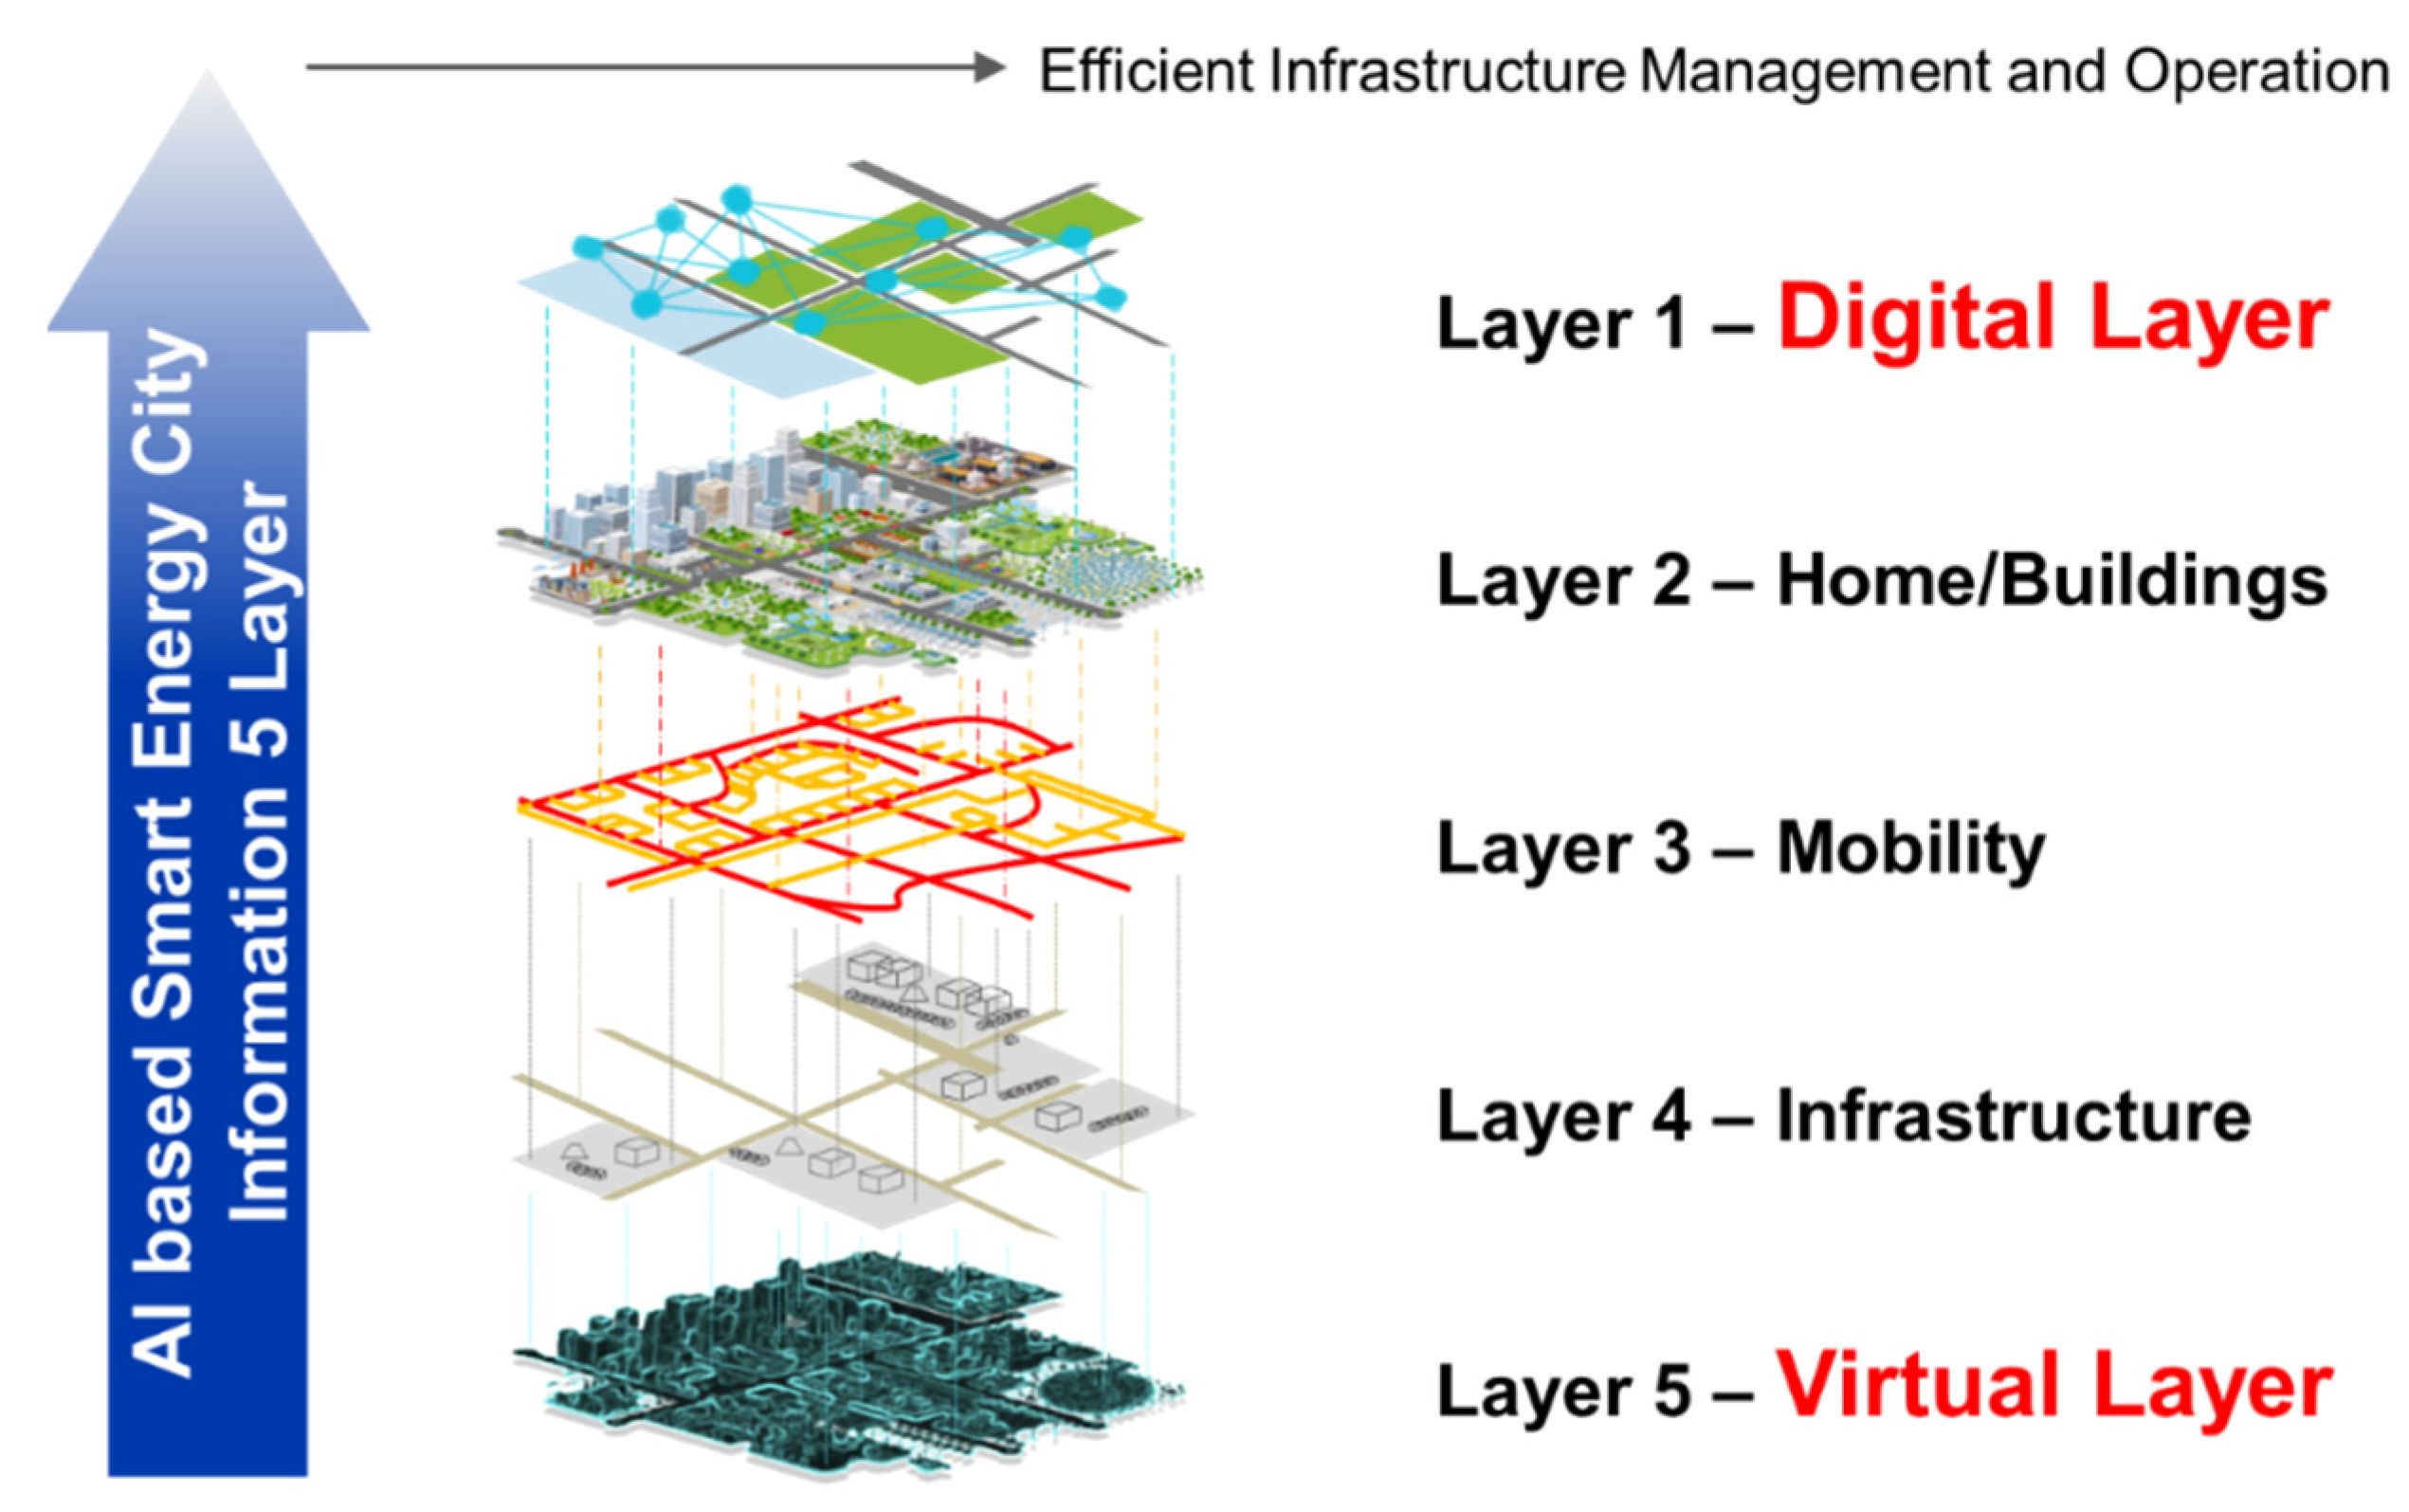
Figure 2 shows the architecture of a 5-layer based SSEC and also shows the physical platform part of the architecture. In this respect, the digital layer represents Layer 1 in Figure 2, the physical layer represents Layers 2–4; and the virtual layer represents Layer 5. The layering structure starts with Layer 4, as the infrastructure layer is the most basic energy infrastructure of the city: it contains the energy smart grid, network infrastructure (4G, 5G, etc.) and IoT devices (sensors, actuators, etc.). Layer 3 represents the mobility layer, which represents the moving elements (such as electric vehicles, unmanned vehicles, and public transport). In this paper, smart phones are also included in this layer. Layer 2 represents home and buildings. Most of the elements that make up a city are buildings, and energy (including cooling and heating energy [35,36,37]) is mainly consumed in buildings; therefore, a lot of energy can be saved by analyzing only the energy element of buildings. These elements include smart homes, smart buildings, and smart factories. Layer 1 represents the digital layer, which is a virtual cloud that stores data collected from the physical layer (Layers 2–4). Layer 5 provides information for optimizing sensors in the physical layer and actuators. The five layers can be summarized as follows.
- Layer 1: Digital layer: data-based collection–transmission and analysis technology;
- Layer 2: Home and buildings layer: smart homes, buildings, and factories;
- Layer 3: Mobility layer: electric vehicles and smart mobility;
- Layer 4: Infrastructure layer: sensors, actuators, network infrastructure, and energy grid;
- Layer 5: Virtual Layer: energy optimization technology through simulation based on augmented reality/virtual reality (AR/VR) and digital twin technology.
3.2. 5-Layer Based SSEC Physical/Virtual Platform Architecture
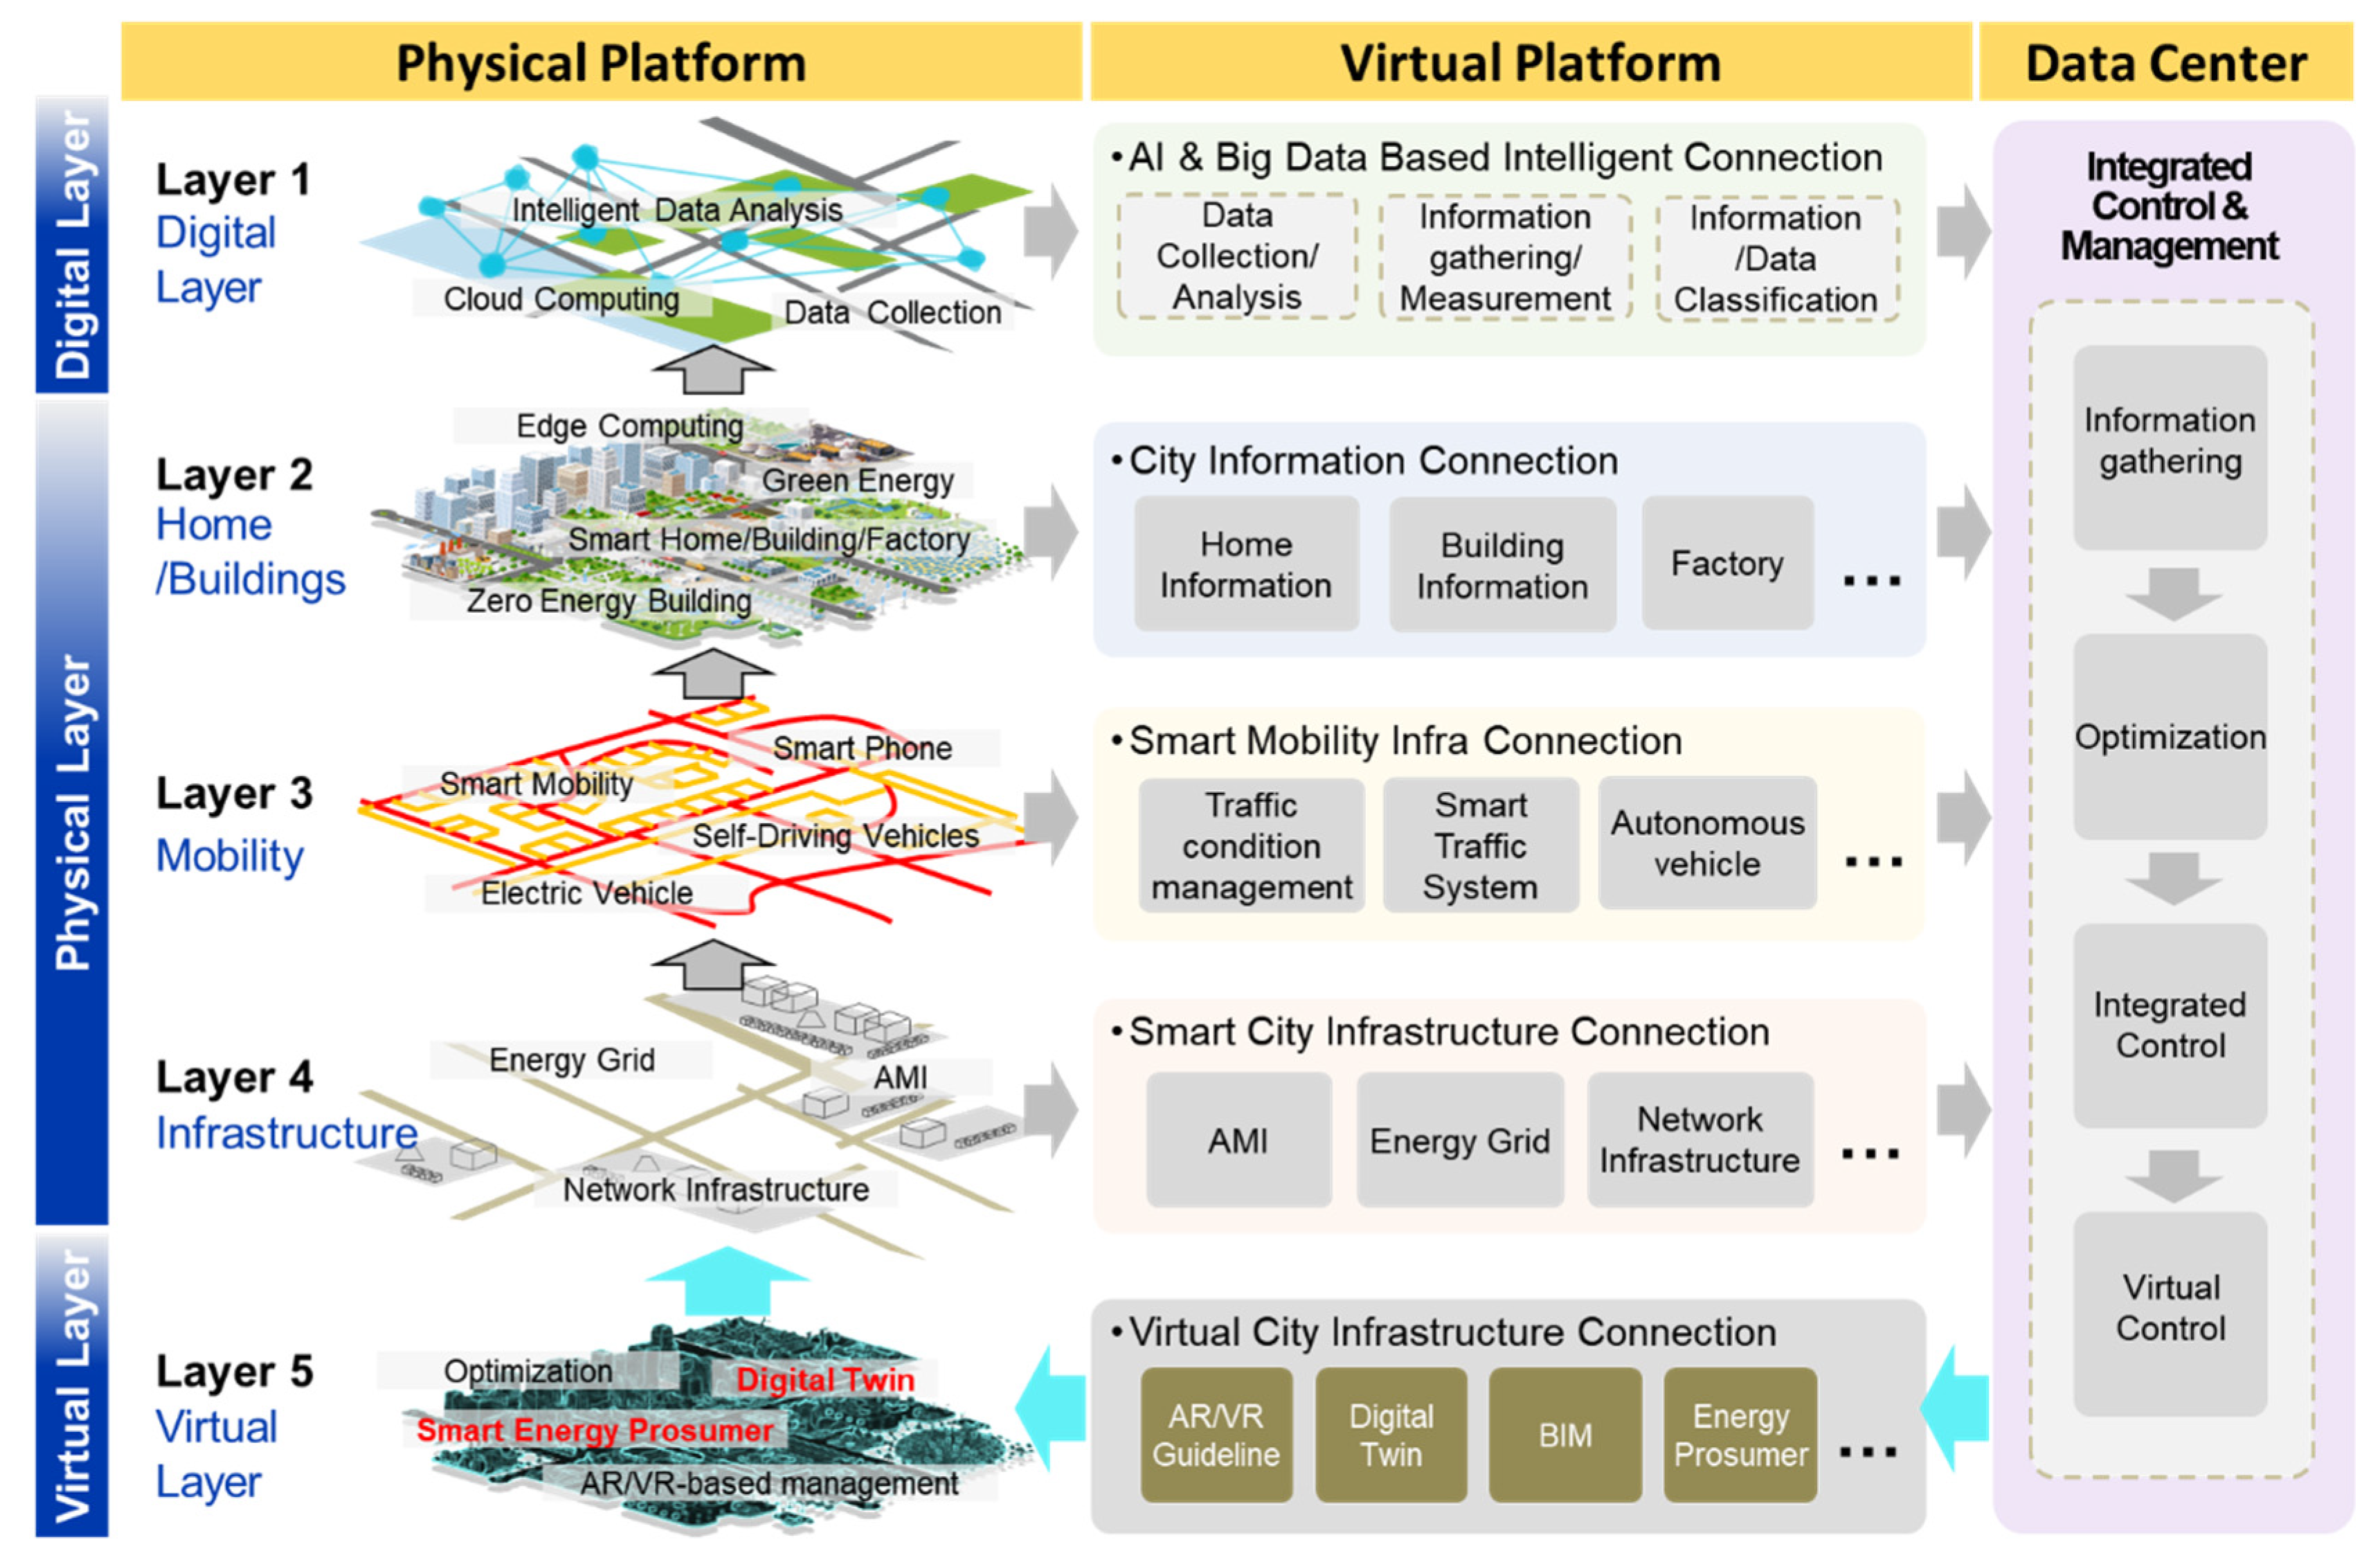
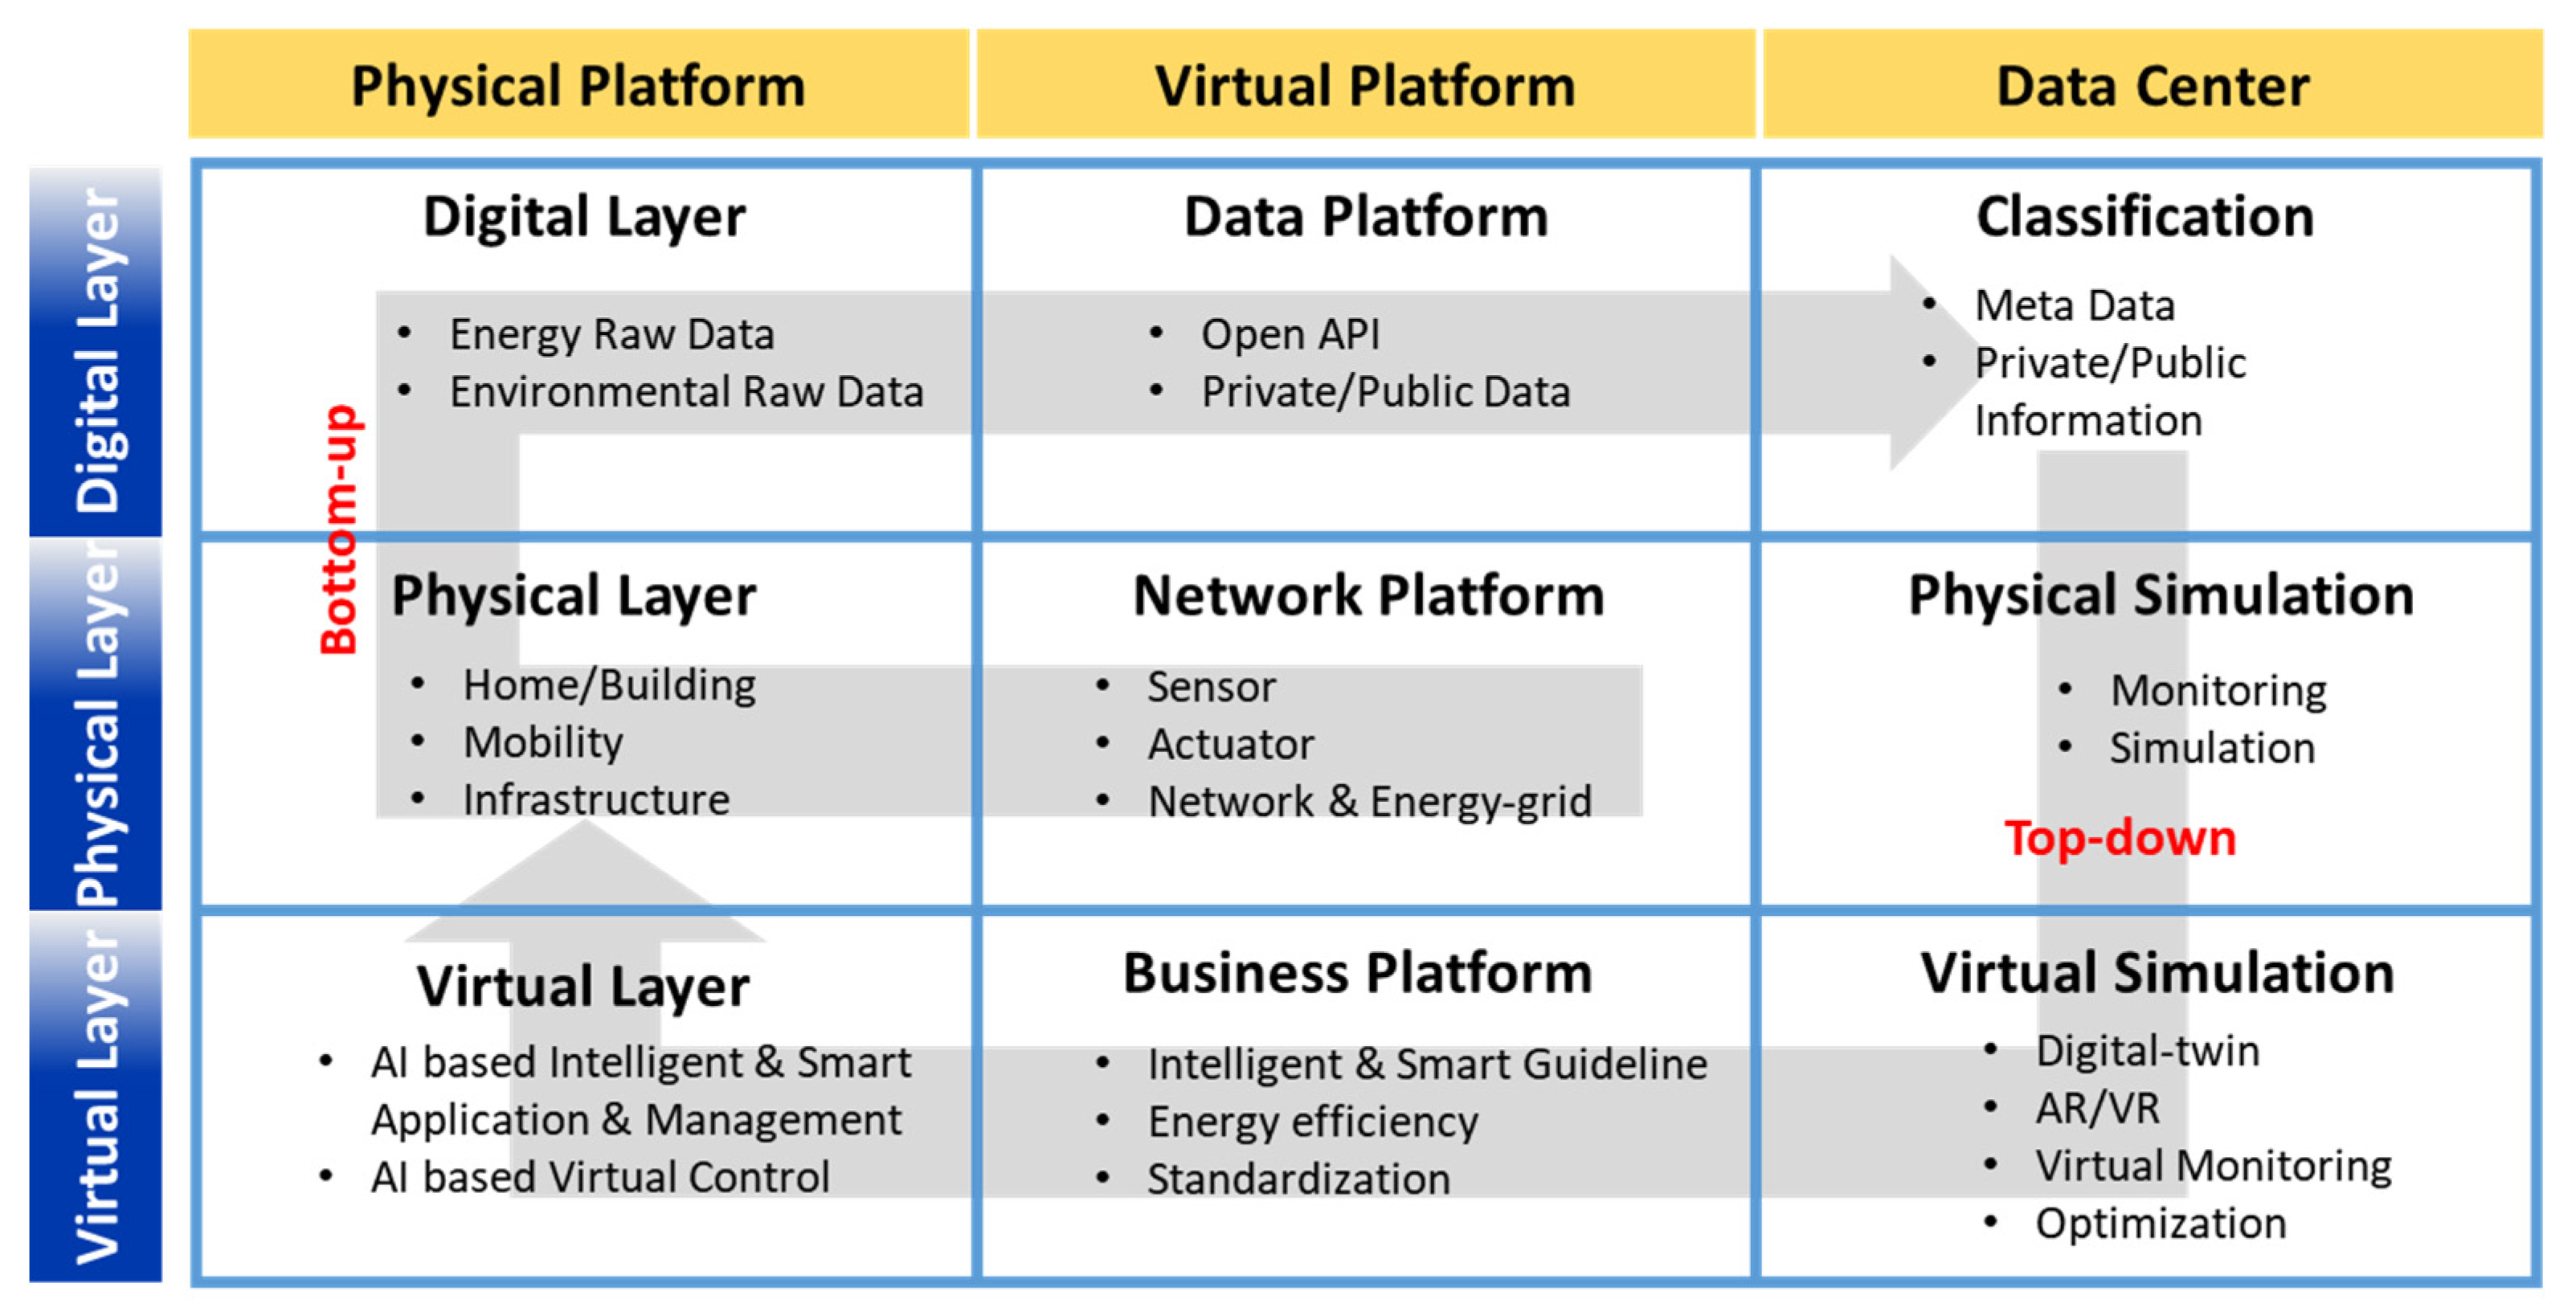
This subsection shows the proposed SSEC architecture, as presented in Figure 3 and Figure 4, which consists of a total of nine blocks that are designed to show the effective linkage between each of the parts (Figure 4). The architecture is divided into three rows and three columns: each row is grouped by functional aspects relating to the SSEC and each column is grouped by structural aspects of the SSEC. The first row represents the virtual layer, the second represents the physical layer, and the third represents the digital layer. Each row is divided into a digital layer and a virtual layer, the physical layer is centrally placed between them. The first column represents the physical platform, the second column represents the virtual platform, and the third column represents the data center. Each column is divided into a physical platform and data center on the left and right sides of the virtual platform. The IoT devices installed in the SEC collect IoT-based energy data in the physical area (physical platform–physical layer) and the collected energy data are transmitted in a digital layer (physical platform–digital layer) initiated from the hardware platform (virtual platform–physical layer). The transmitted data are transferred to the classification area (data center–digital layer) through the software platform (virtual platform–digital layer). Through processing the collected data, the first simulation can be obtained in the physical simulation area (data center–physical layer), and the virtual simulation can be obtained in the virtual simulation area (data center–virtual layer). Physical and virtual associated data are collected through physical–virtual simulations and deduced from the service–business platform area (platform–virtual layer); they are then transferred to the physical–virtual layer (architecture–physical layer) to provide guidance and information for AI-based intelligent energy control. The following shows the cyclic structure of the platform relating to each area and associated details:
Procedure: Network platform → Physical layer → Digital layer → Data platform → Classification → Physical simulation → Virtual simulation → Business platform → Virtual layer
3.2.1. Physical Platform (5-layers)
- Digital layer: A virtual cloud that stores data collected from the physical layer.
- Physical layer: The actual physical space of the SEC. Sensor networks are installed in the physical space to collect energy data (home/buildings, mobility, and infrastructure).
- Virtual layer: Provides business guidelines and an optimization model from the business platform to AI-based optimization of physical layer sensors and actuators
3.2.2. Virtual Platform
- Data platform: Manages data clouds stored in the digital layer.
- Network platform: Sensor and actuator network platform to be installed in the physical layer.
- Business platform: Provides business guidelines and an optimization model to managers and users through virtual simulation.
3.2.3. Data Center
- Classification: Receives data from the software platform and processes it as metadata through classification.
- Physical simulation: Visualizes physical modeling and simulation based on processed metadata.
- Virtual simulation: Digital-twin and augmented reality (AR)/VR-based virtual monitoring for optimization.
A 5-layer based SSEC architecture is proposed, and the following section relates to the virtual platform (Figure 3 shows the 5-layer architecture based on the physical/virtual platform). The virtual platform of a city does not represent real energy elements, but it represents invisible elements that are the virtual infrastructure of the sustainable city. If the smart system is applied to the city based on the platform, it can be provided with the connectivity, promptness, and efficiency referred to in Section 1. In other words, to build smart elements in a city, it is necessary to build them in a connected, fast, and cost-effective manner based on the virtual platform. Therefore, it is important to use a mass-customization based system manufacturing methodology [11], and in this paper, we present the ROI to determine the cost effective construction of a SSEC system in Korea based on this platform.
Figure 4 shows the relationship between the platform and the data center within a 5-layer-based city through the cyclic structure of this platform. The data center is responsible for visualizing the simulation of energy elements within the city, and it provides information for managers and users to enable energy optimization in the city. Importantly, this cyclic structure allows for AI-based optimization control. Continuous data acquisition, analysis, and optimization based on data collected from the control tower and historical data enable future optimization and optimal control of the system.
3.3. System Overview
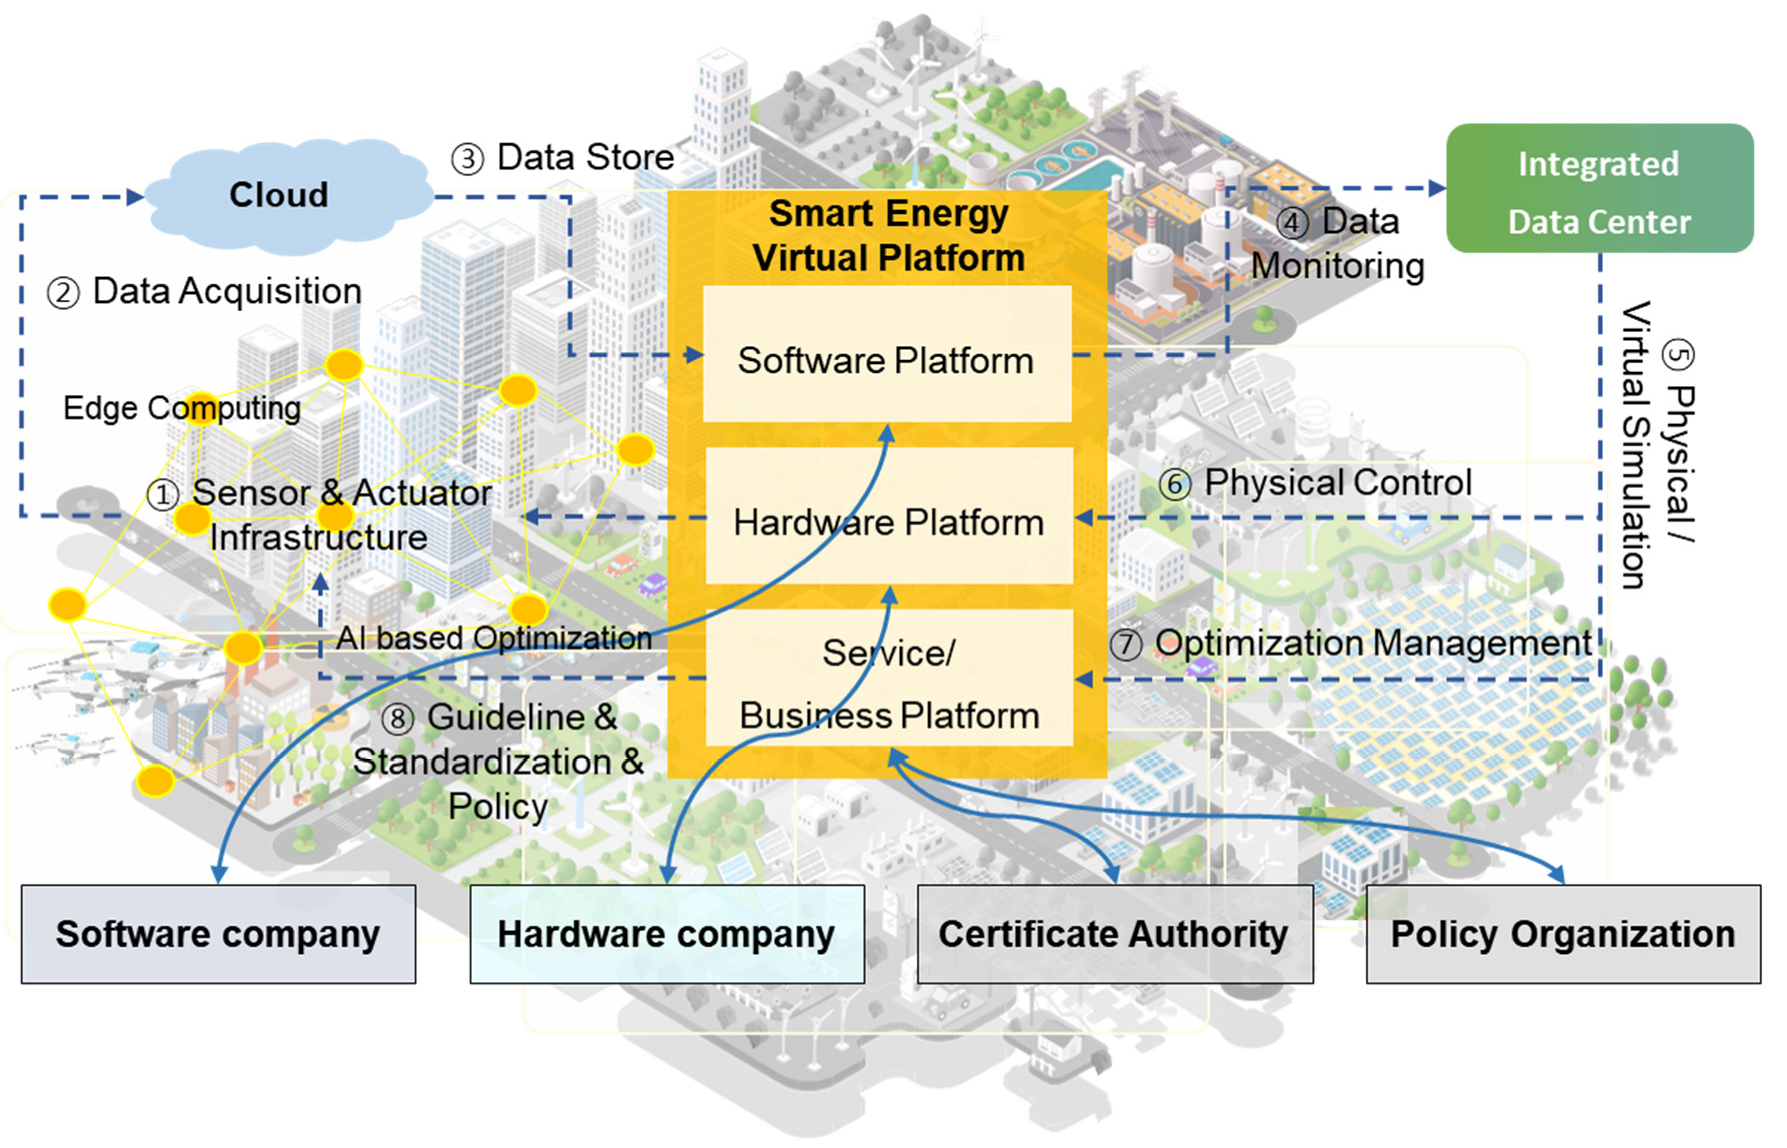
Figure 5 shows a schematic diagram of the overall proposed system as follows:
- ①
- The hardware company manufactures IoT-based sensors and actuators and implements the system in the city.
- ②
- IoT-based sensors collect data based on edge computing through the implemented system and transmit them to the cloud.
- ③
- The cloud stores the data and sends it to the data center for monitoring.
- ④
- The data center processes and monitors the data.
- ⑤
- The data center conducts a physical simulation to visually confirm the processed data, and also conducts a virtual simulation to enable intelligent optimization.
- ⑥
- This provides a model for ensuring physical control through physical simulations.
- ⑦
- This provides an optimization model through virtual simulations.
- ⑧
- By providing an optimization model, the service/business guidelines for optimal system installation in the city can be provided to managers and users, and operators and users cyclically perform energy system AI-based optimal management.
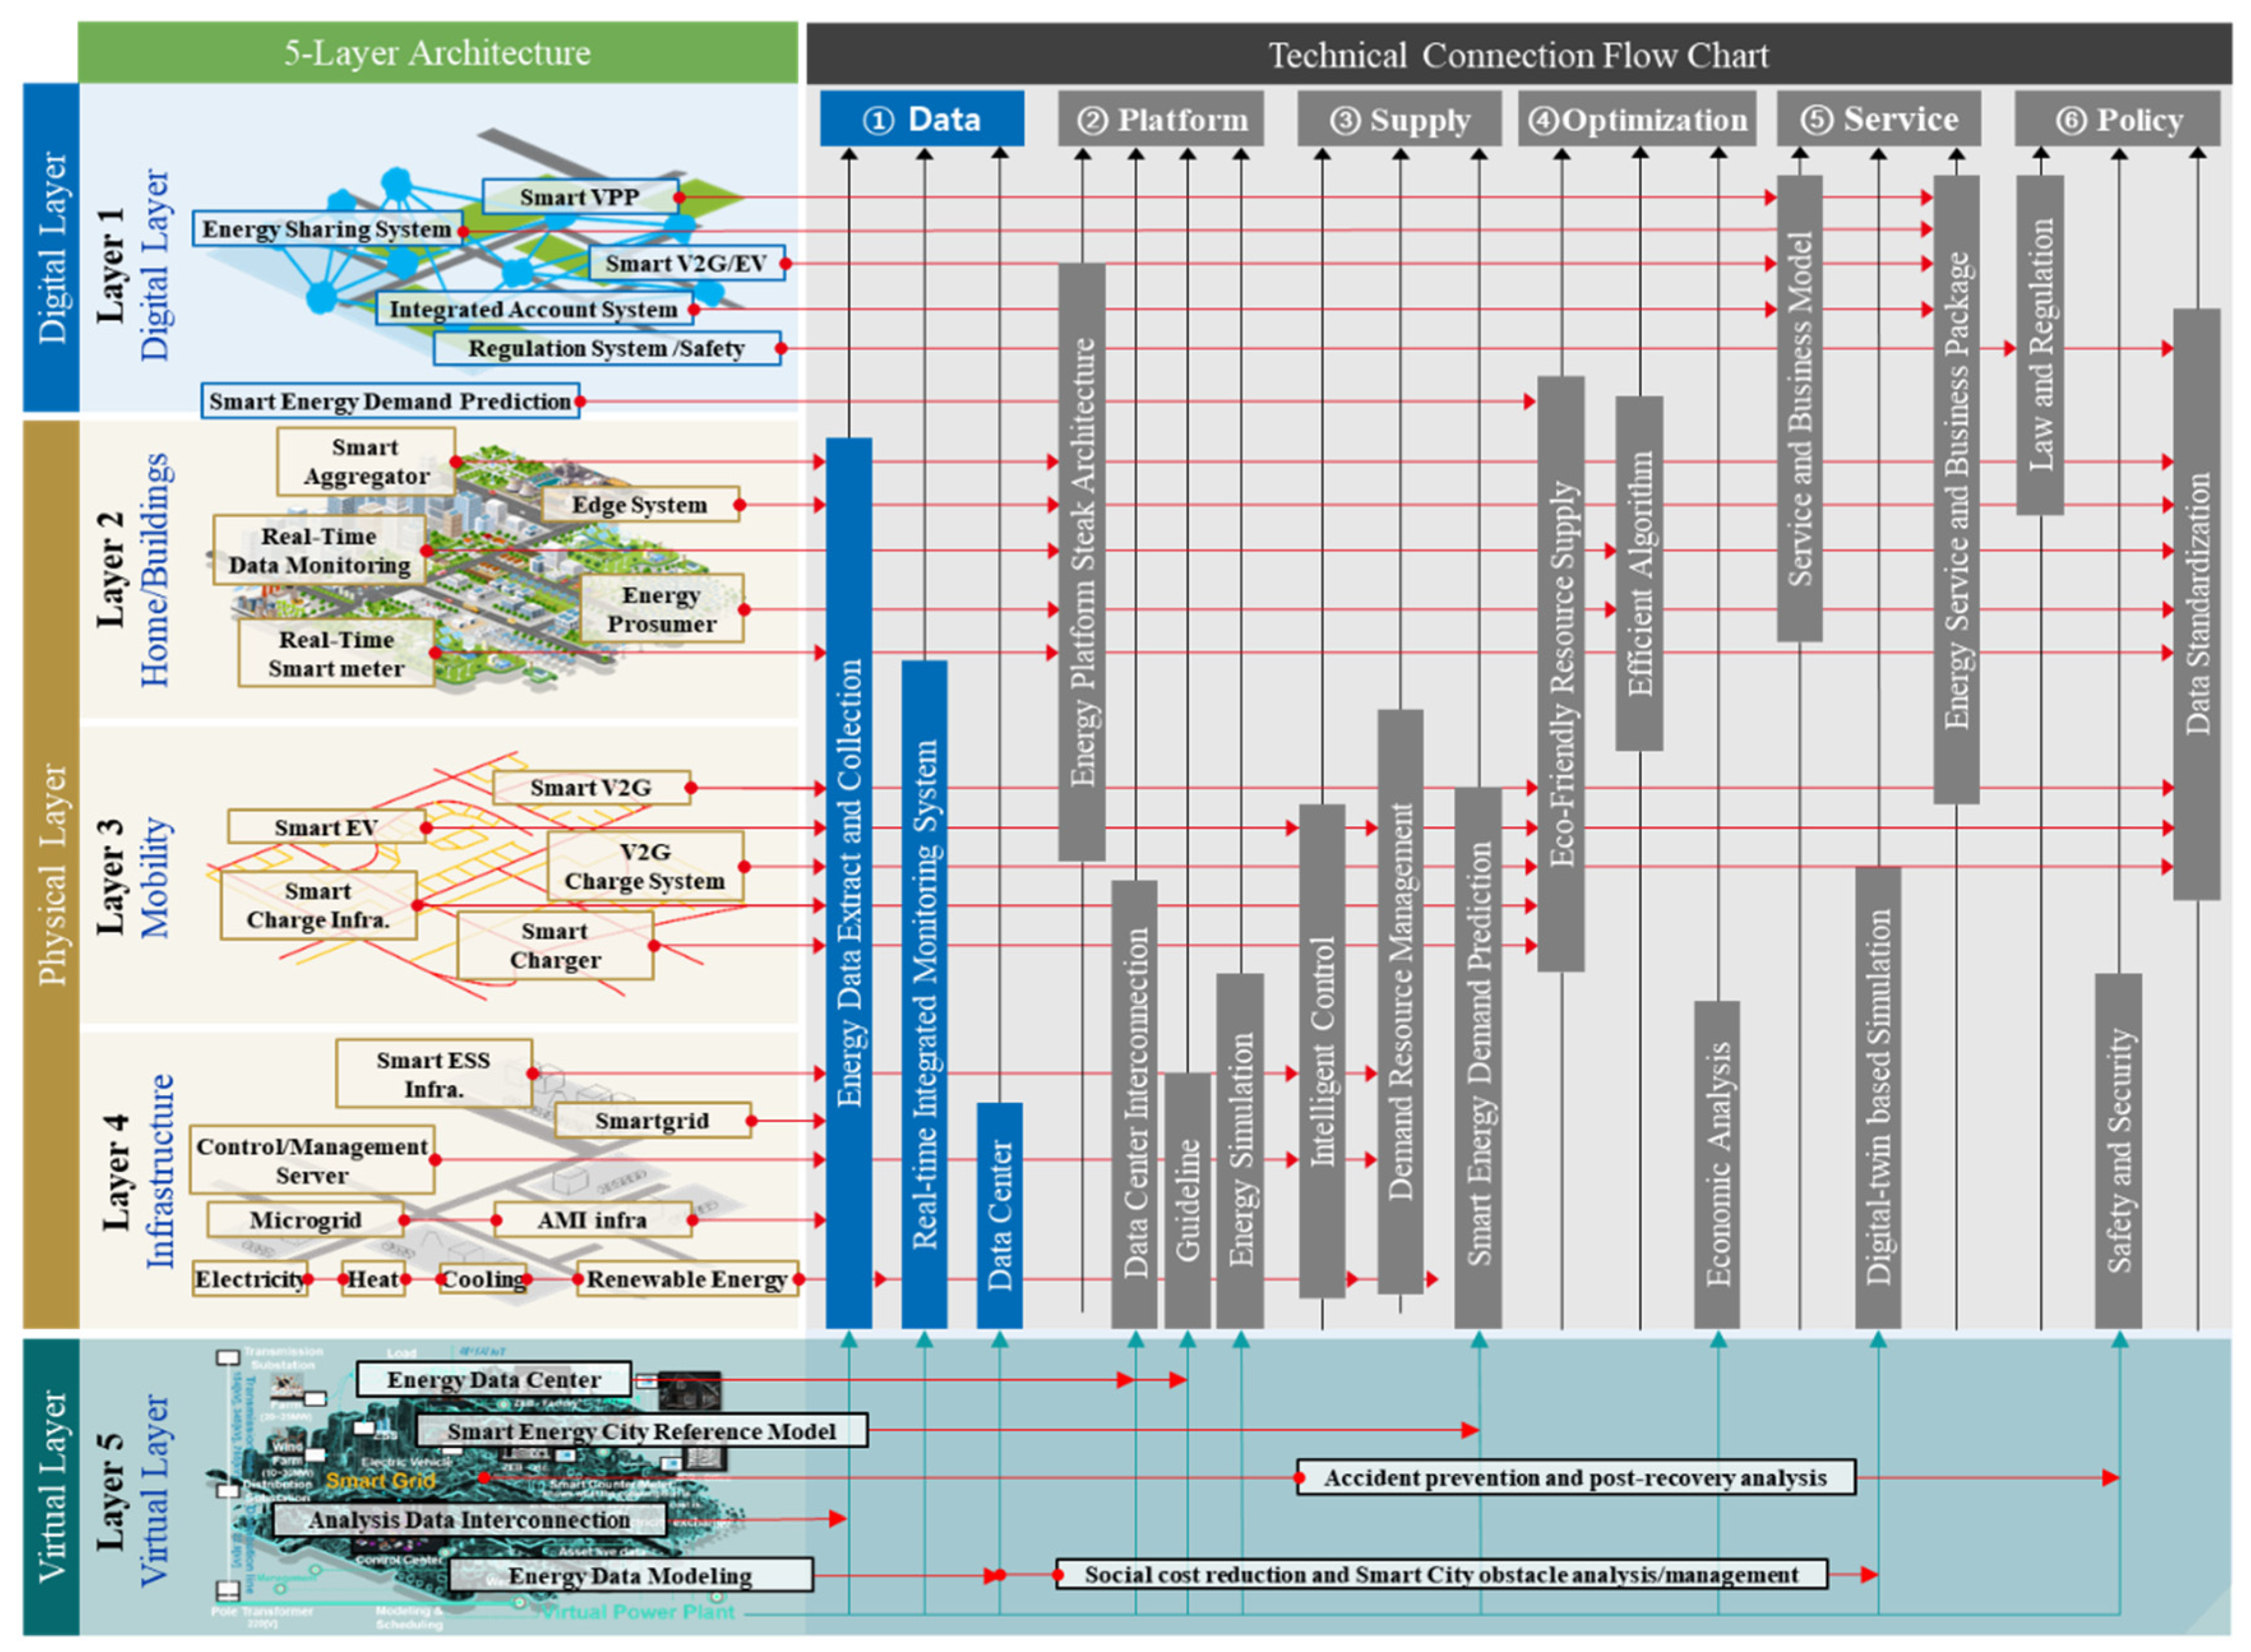
3.4. 5-Layer Architecture Connection Flow Chart for AI-Based Management and Optimization
Figure 6 shows the 5-layer architecture connection flow chart for AI-based management and optimization. The elements of each row and column are linked by arrows. Moreover, the five layers are categorized into six categories, as shown in Figure 6. Each of the detailed elements of the five layers are linked to the six categories by arrows to perform their respective functions. The six categories are ① Data, ② Platform, ③ Supply, ④ Optimization, ⑤ Service, and ⑥ Policy, which match each element in the architecture of Figure 7 as follows:
- ①
- Data → SEC data collection
- ②
- Platform→ SEC platform
- ③
- Supply→ Eco-friendly energy supply
- ④
- Optimization: → Smart energy demand prediction and management
- ⑤
- Service → Smart energy service/business
- ⑥
- Policy → System improvement and dissemination by SEC platform
In “① Data”, data center is constructed to perform energy data extraction and collection of the integrated physical environment and real-time monitoring function. In “② Platform”, data entered into the platform are connected through the energy platform Steak architecture, and energy simulation and guideline are performed. An eco-friendly energy supply is provided in “③ Supply” and intelligent control is performed through demand resource management. In “④ Optimization”, smart energy demand prediction is performed to optimize energy demand and supply. In “⑤ Service”, smart energy service/business models are created to build a package to facilitate the supply and expansion of future SEC models. In “⑥ Policy”, system improvement and dissemination are performed using the SEC platform through law and regulation and data standardization. By this structure AI-based management and optimization becomes possible, and details are presented in Section 3.5 and Section 3.6. Figure 7 shows a fully connected architecture.
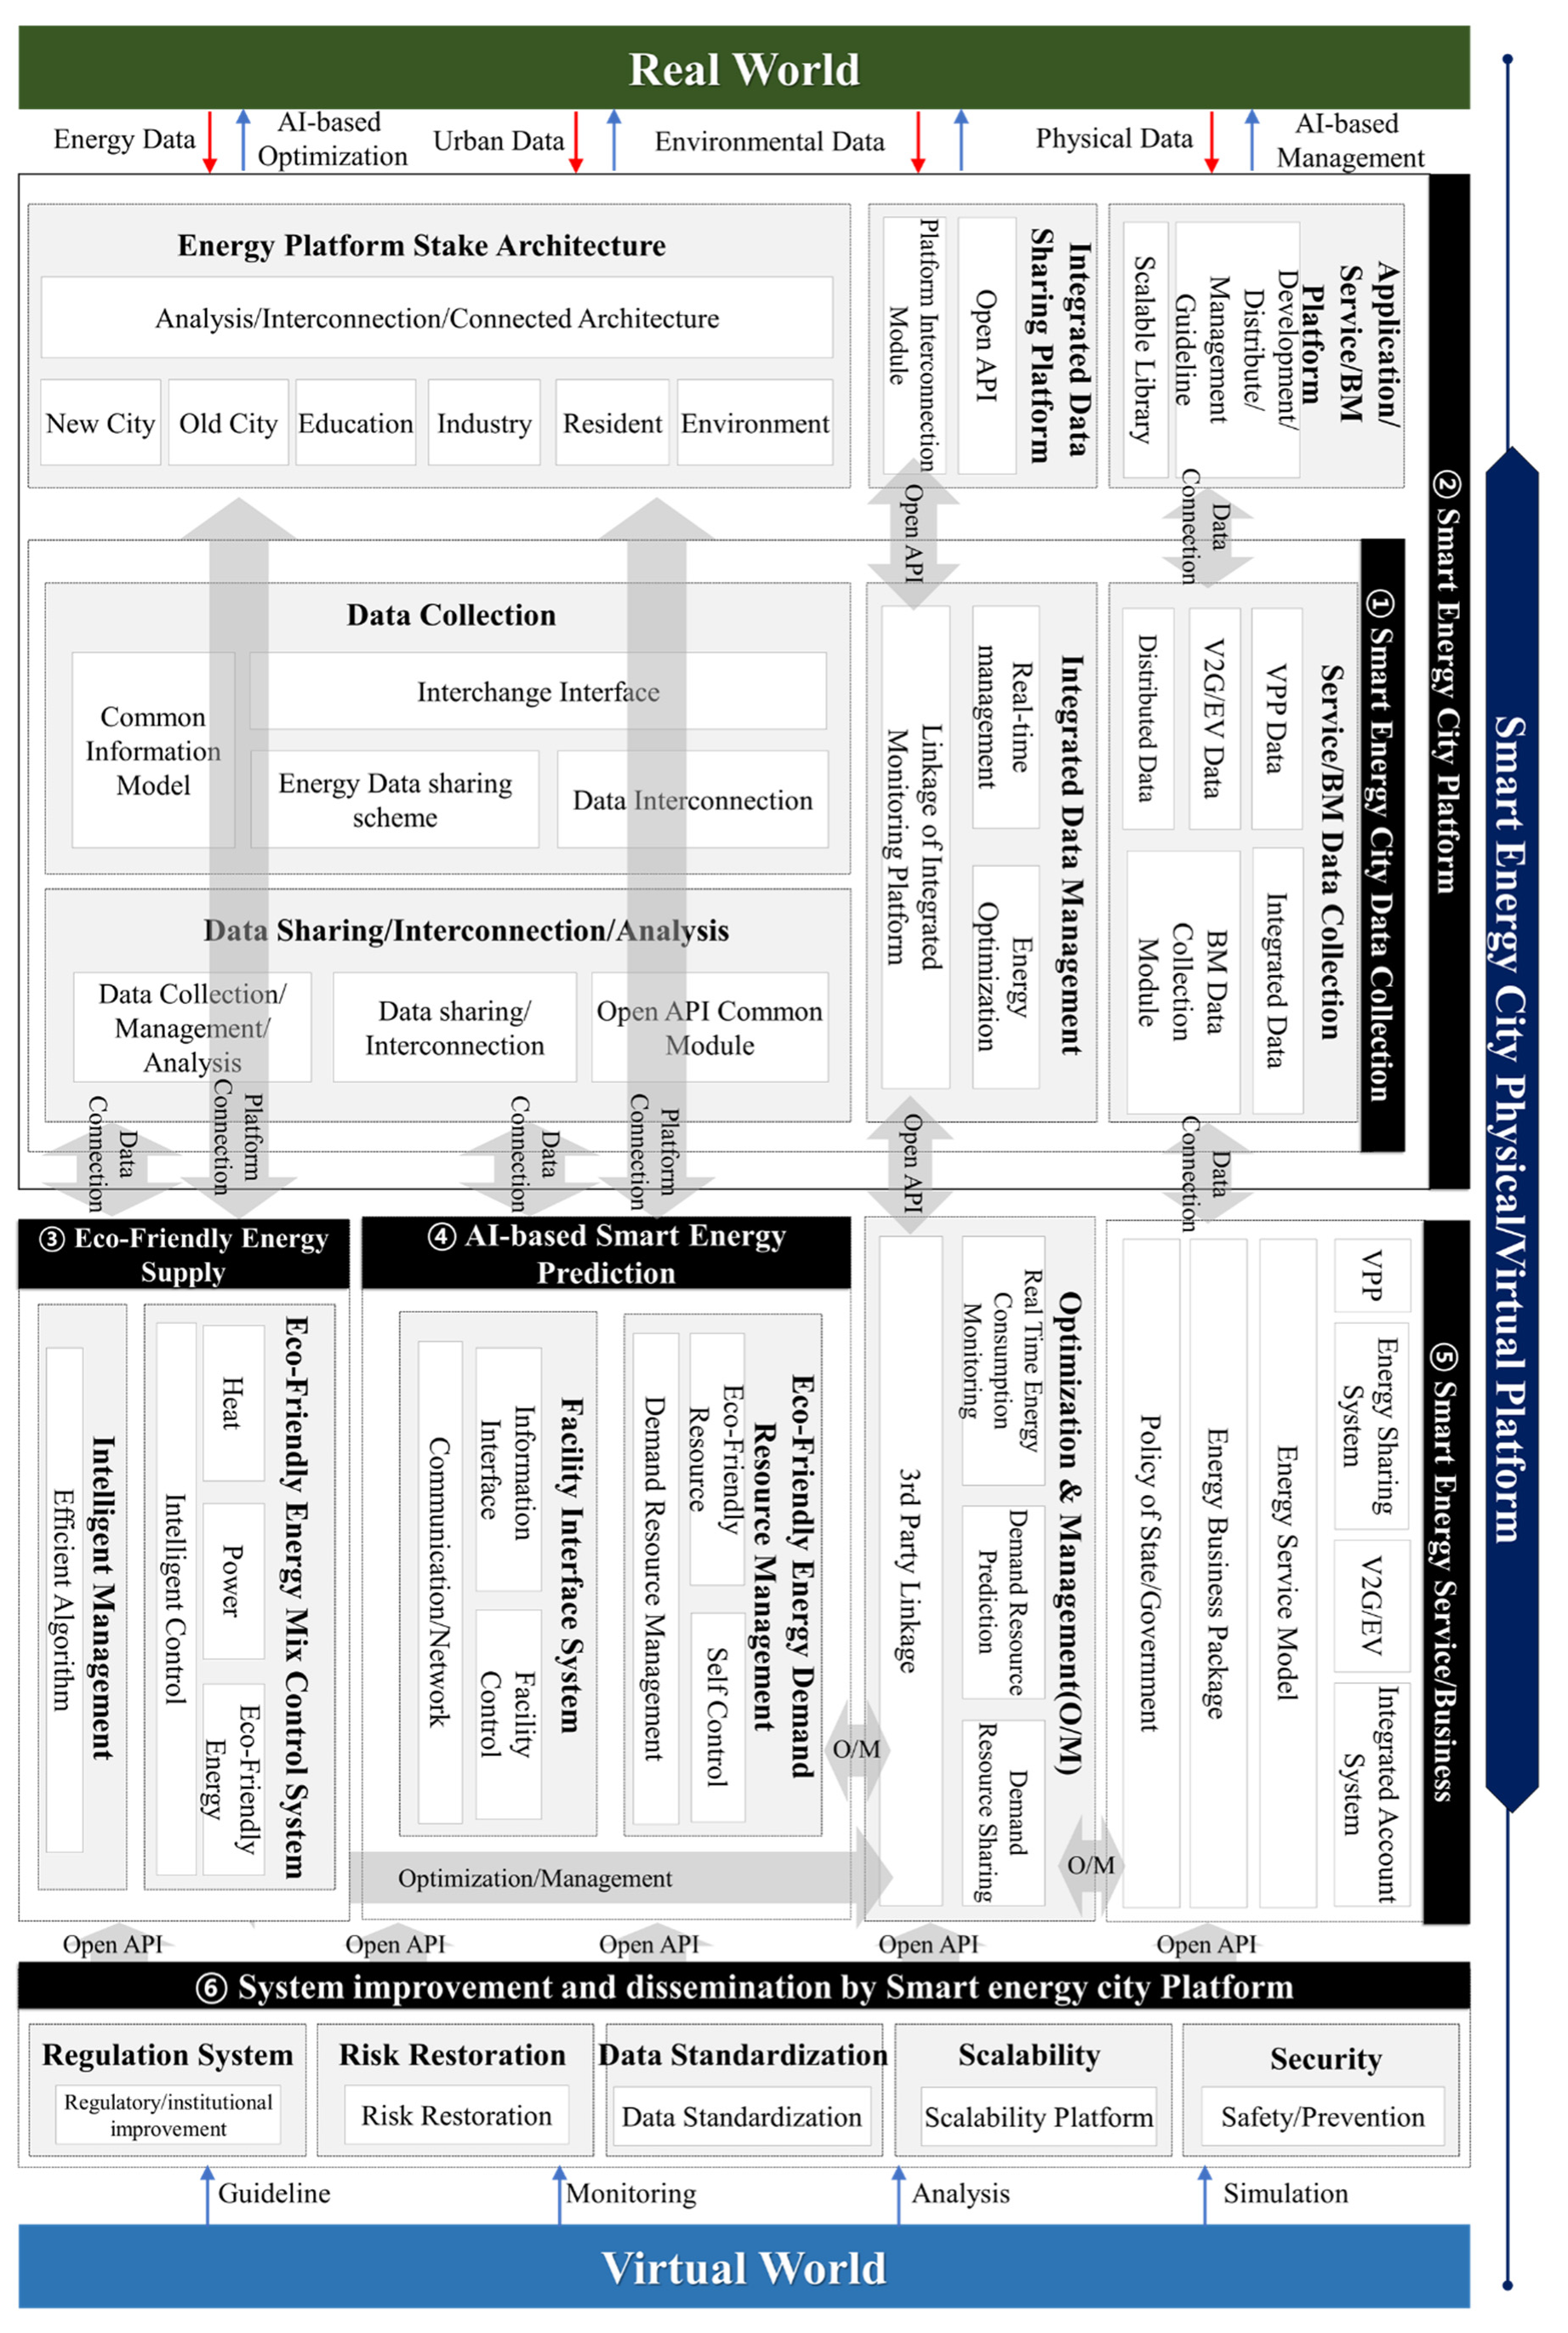
3.5. SEC Physical/Virtual Platform Architecture
Figure 7 shows the SEC physical/virtual platform architecture, which consists of six categories. It collects IoT-based data, processes the data, and supplies eco-friendly energy through intelligent algorithms based on the collected data, thereby leading to the creation of a service and business model. Each of these performance modules are demonstrated in Figure 7.
3.6. What Is the Artificial Intelligence (AI)-Based Optimal Management in SSEC?
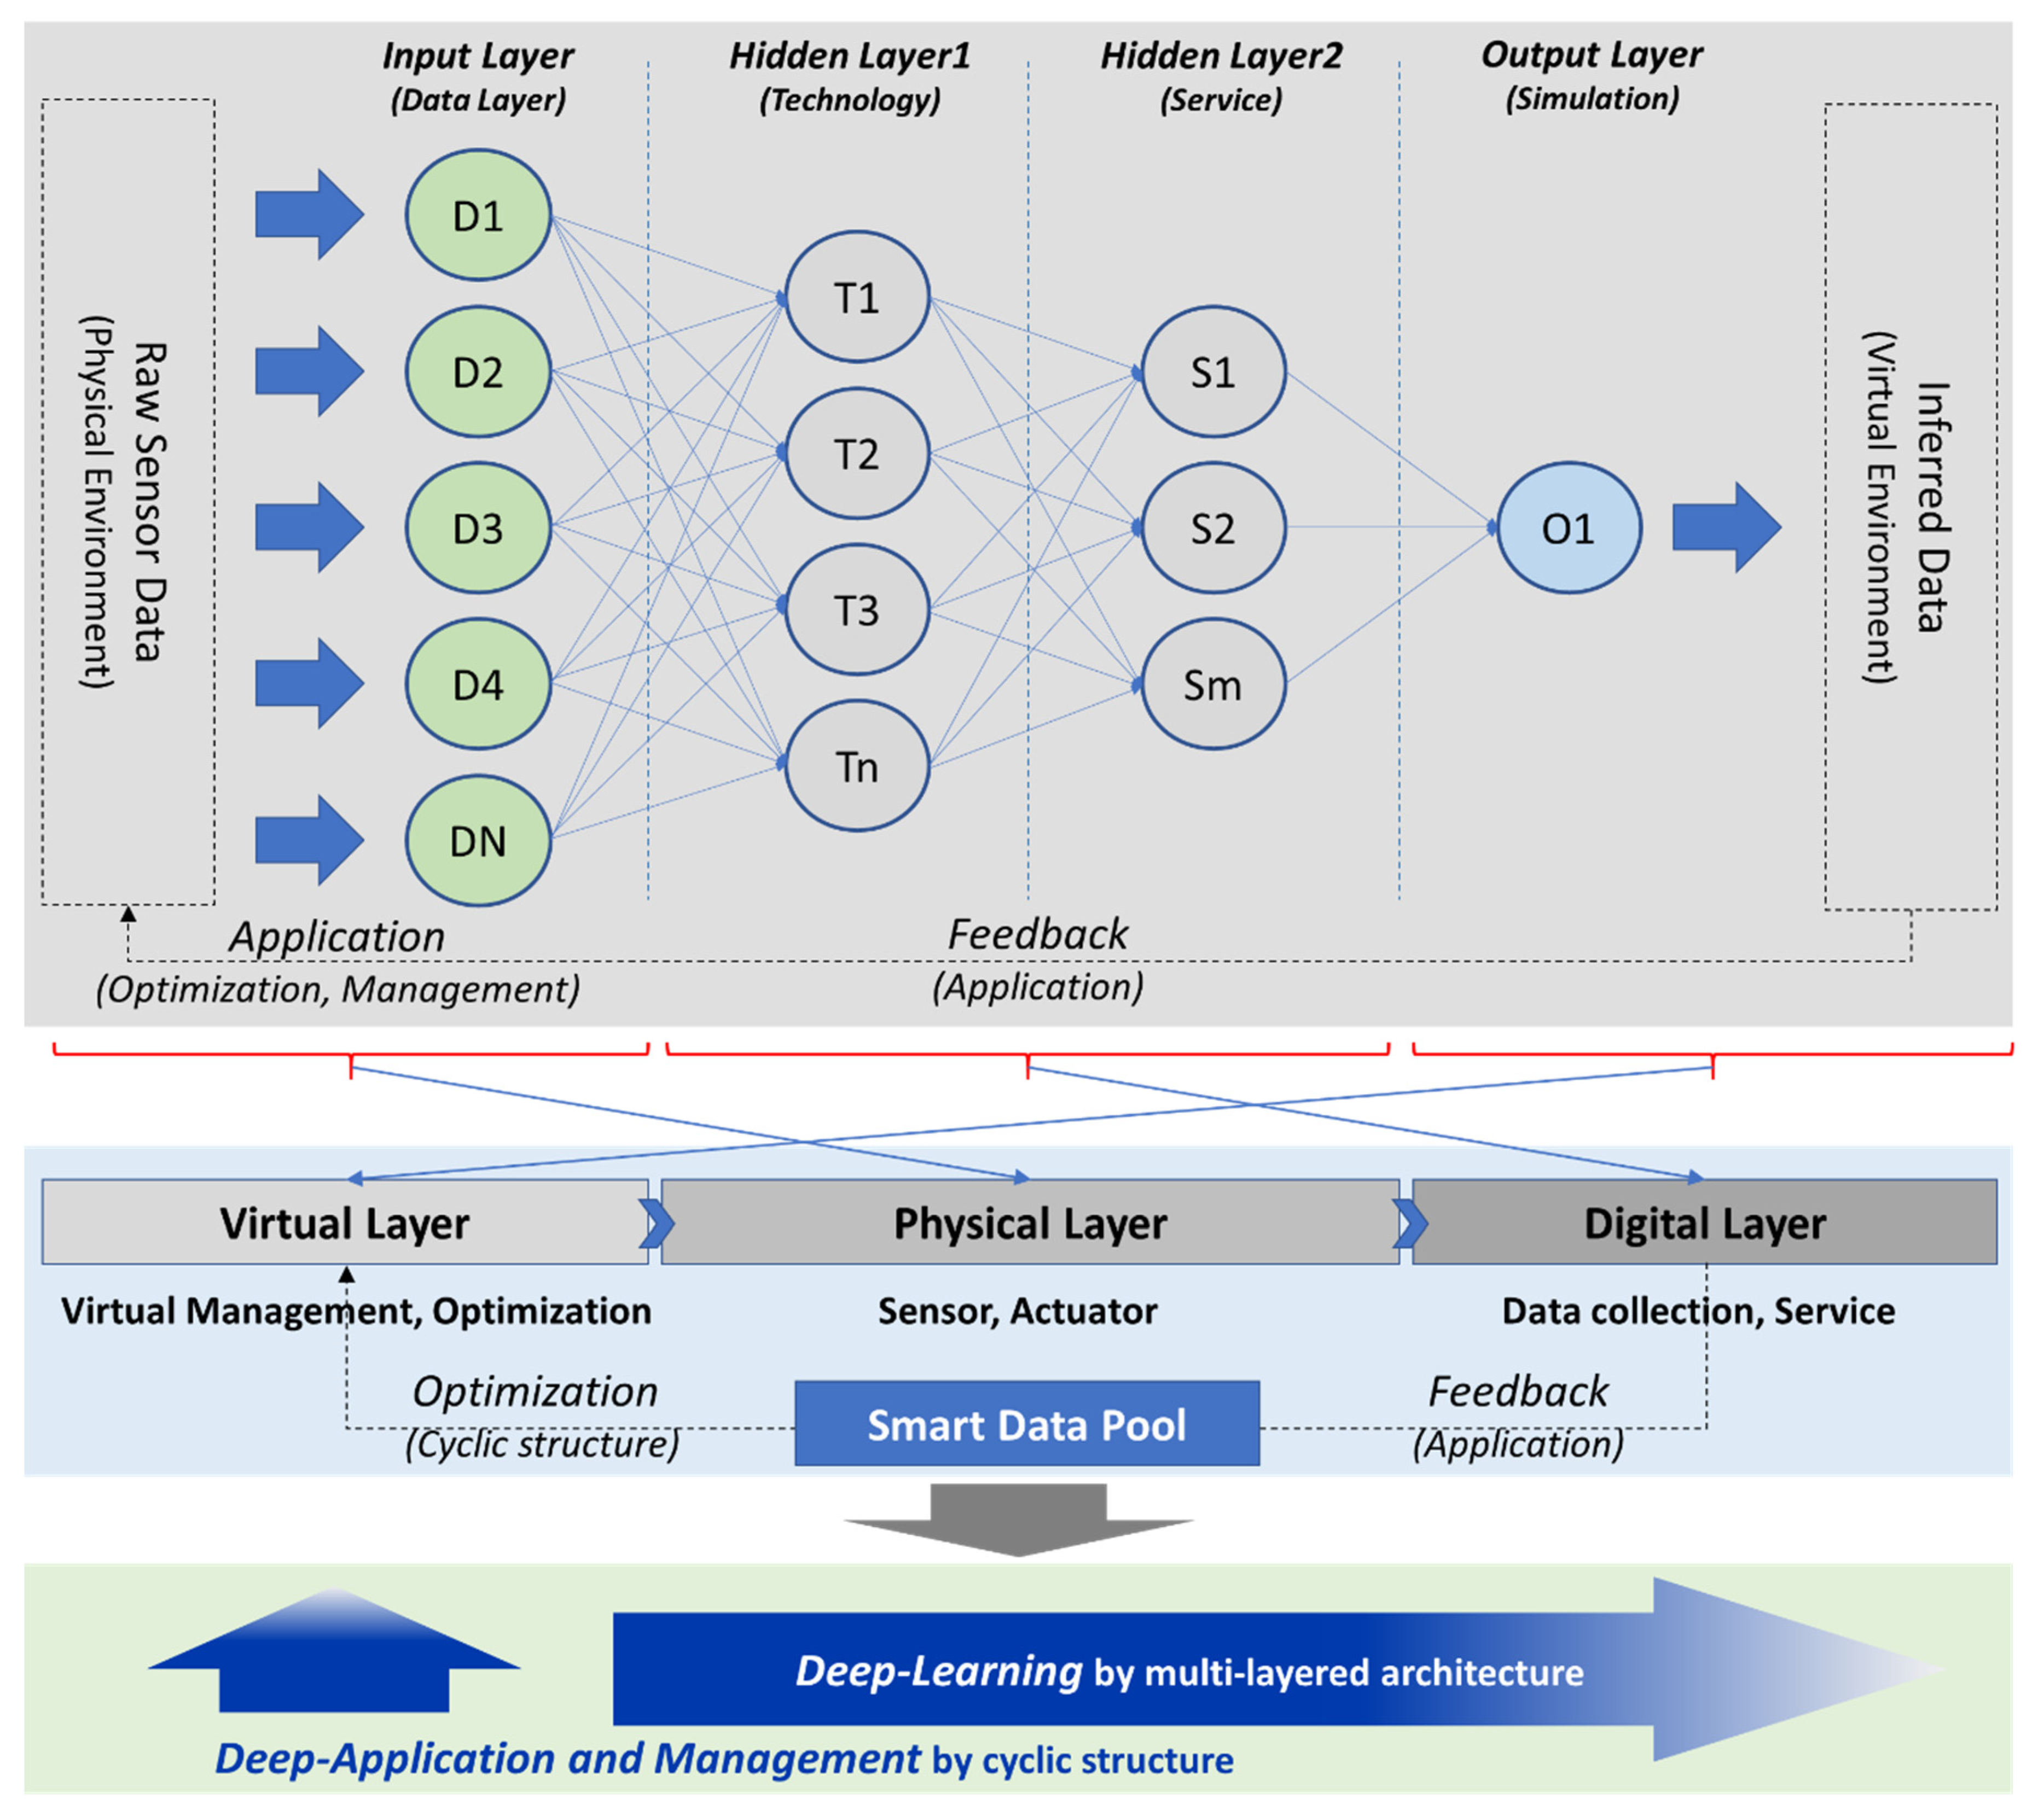
Ref. [41] spoke the key elements that make a city smart are Livability, Workability, Sustainability and Learnability. They add Learnability, the equitable access to quality learning opportunities across a coordinated ecosystem from birth through careers. Career means the empirical data accumulated over a long period of time. Empirical data refers to long-term data for more than a year obtained from smart energy activities in the city. The cyclic structure of this proposed architecture enables the empirical accumulation of such data and is stored in the data pool presented in Section 4.1 below. This will be an important guideline and factor for future energy optimization in urban areas. Moreover, Zaheer Allam [23] showed an AI-based theoretical model for achieving increased complexity in smart cities. Furthermore, he showed the geometry of a multi-layer artificial neural network (ANN). Fukumizu [42] mentioned that ANNs are multi-layered; in addition to the output and input layers, they also have connections between layers in their neighborhood that are linked by weighted connections, representing the effectiveness of synaptic connections in biological neurons. In this paper, AI-based SEC architecture is configured considering this method.
Figure 8 shows the AI-based optimal management in SSEC. The upper half of Figure 8 shows the basic neural network structure. A neural network basically consists of an input layer and an output layer. It is expressed through a close linkage with the hidden middle-layer, and through each weight, which expresses complex and difficult problems. The input layer represents a total of five input sensors that collect data from the SEC. Hidden layer 1 represents the technology in SEC, and consists of four technologies. Hidden layer 2 represents the services that make up SEC, and is composed of three services in total. The inference data for performing the optimization simulation is formed by weighting and linking each of the components, and a guideline for the optimal demand/supply of energy is performed. This is represented by three blocks in the middle of the figure. The virtual layer is located in the front and performs virtual management and optimization functions. This affects the physical layer in conjunction with the output layer. The physical layer receives the inferred data supplied from the output layer to make the actuator perform an AI-based intelligent role. This structure is called the cyclic structure of SEC. Cyclic structure management is performed by deep-learning by multi-layered architecture and deep-application and management by cyclic structure (deep-optimization).
4. Scenarios
4.1. Physical/Virtual Connection Scenarios
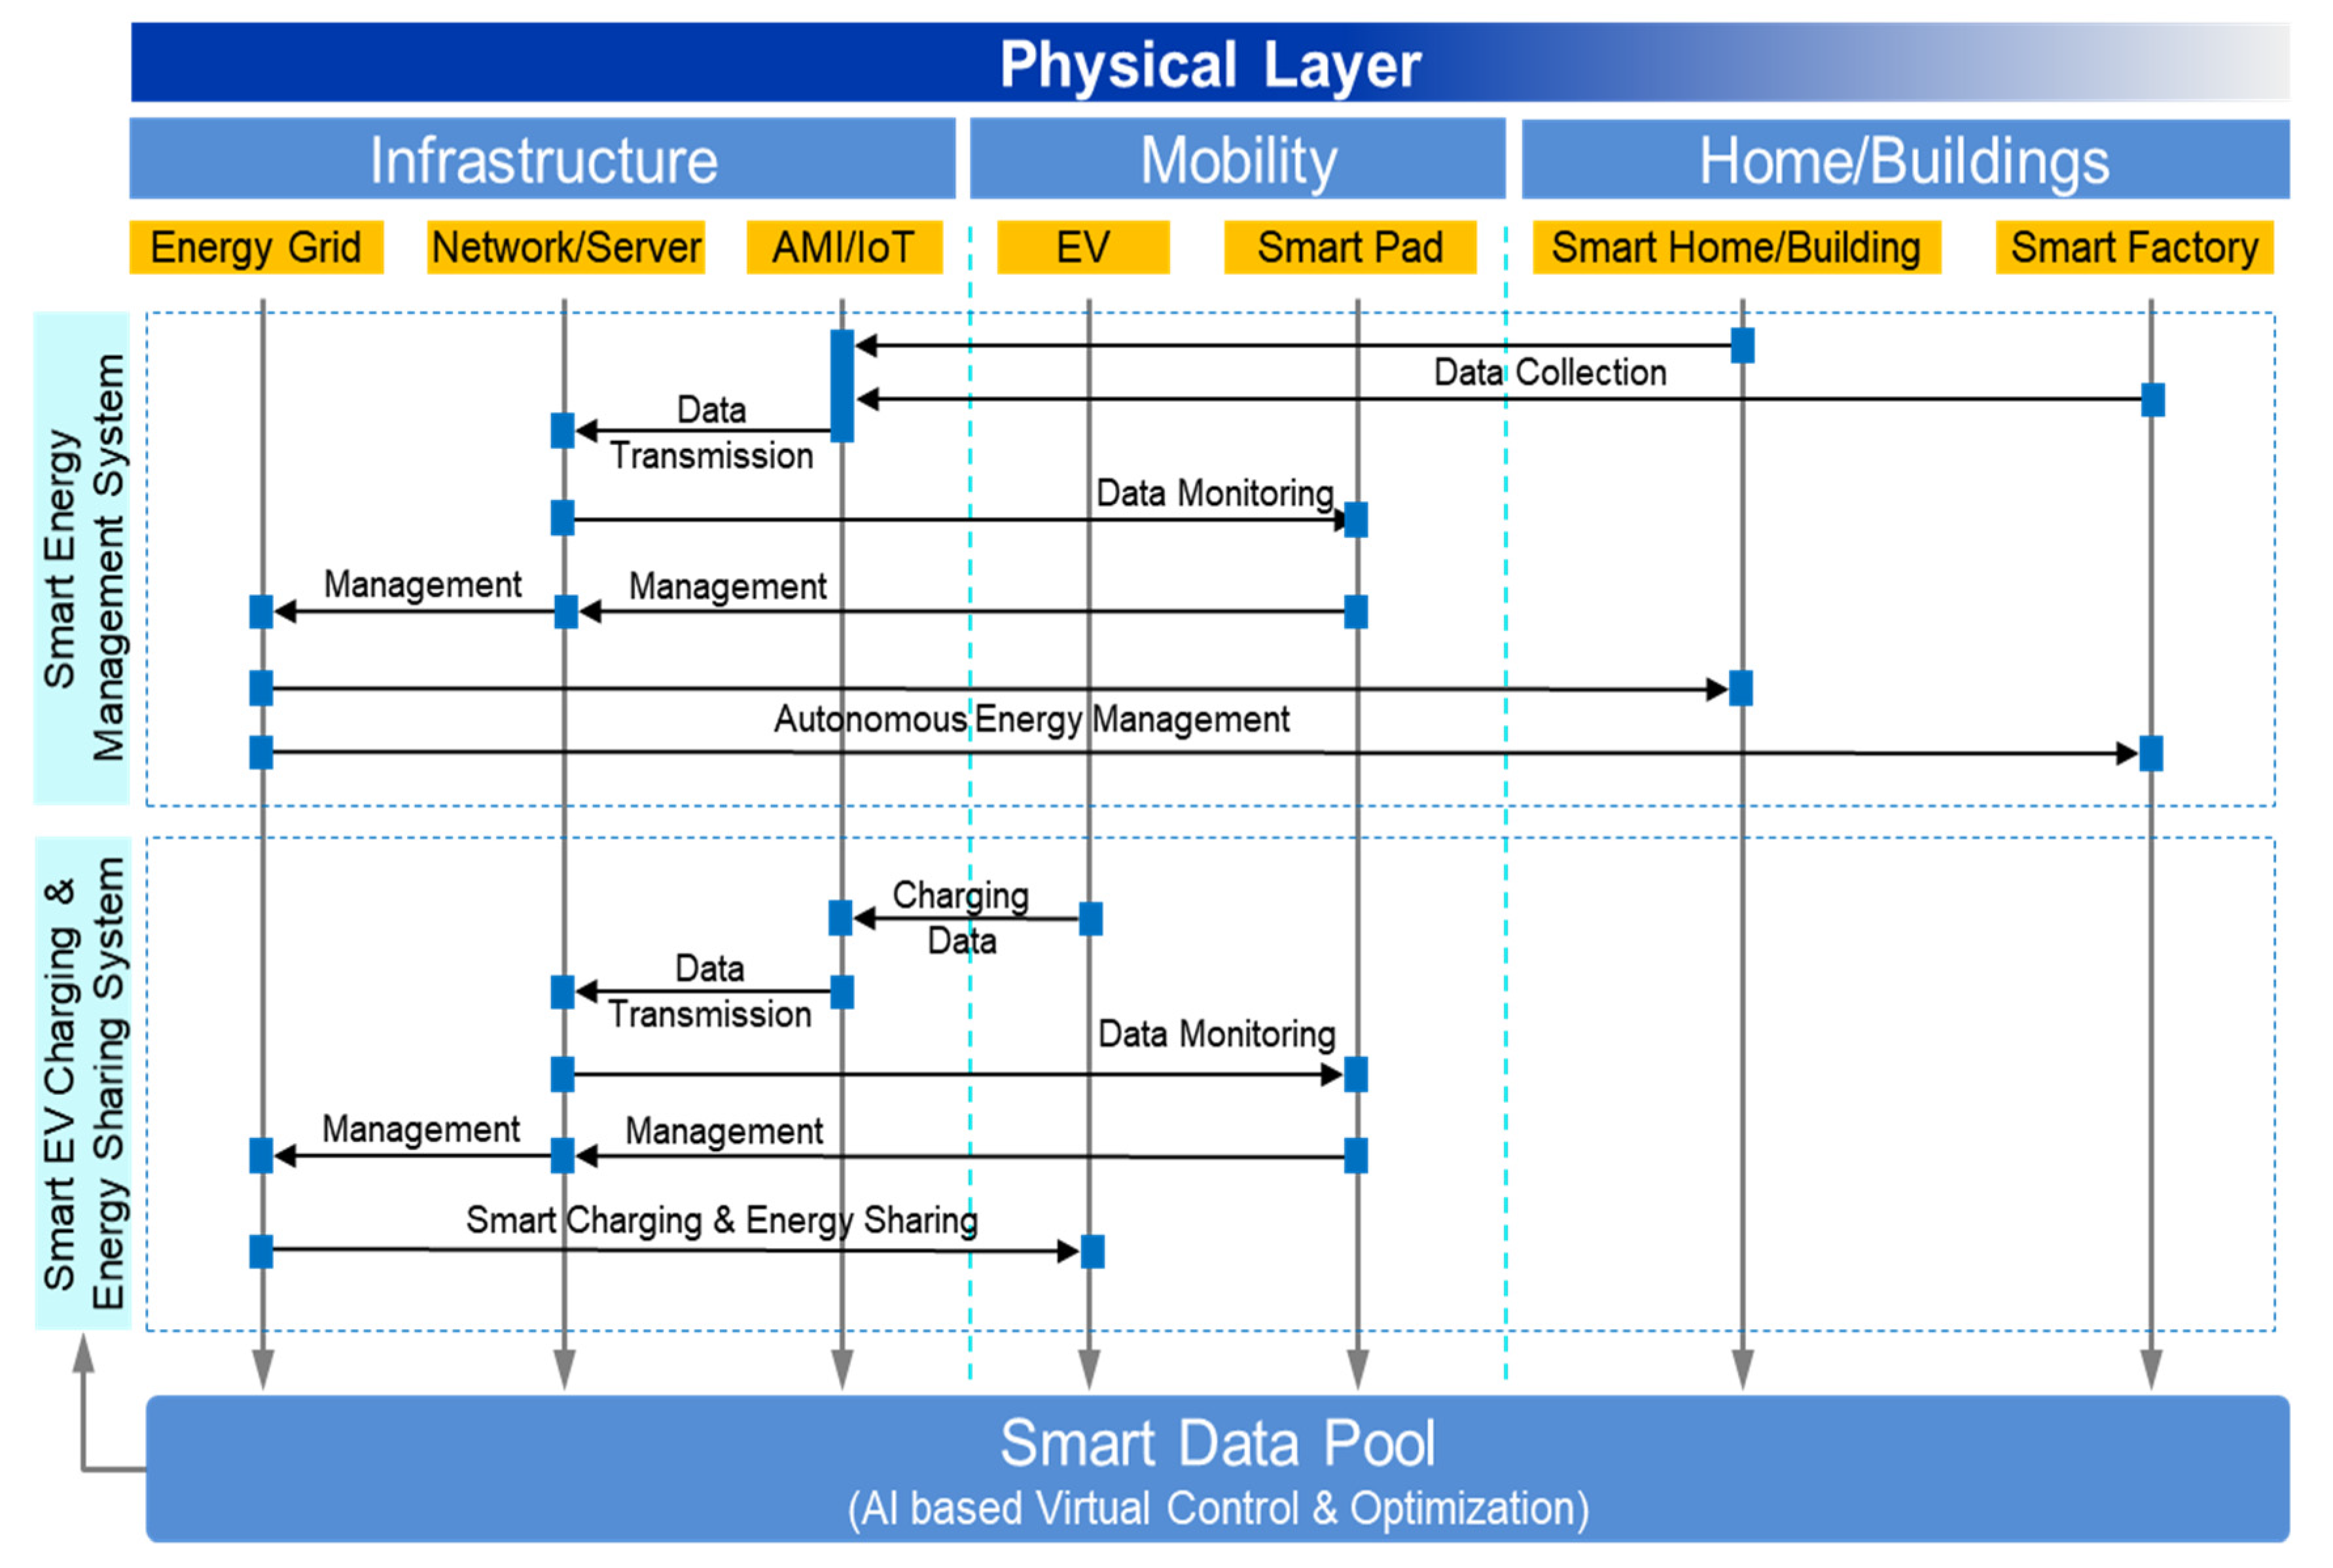
Section 4.1 presents physical/virtual layer scenarios. There are three layers interconnecting the main parameters of the physical layer: the infrastructure layer, mobility layer, and home/building layer. The main components of the infrastructure layer are the energy grid, network, and advanced metering infrastructure (AMI)/IoT; the main components of the mobility layer are EVs (electrical vehicles) and smart pads; and the main components of the home/building layer are smart homes/buildings and factories. Figure 9 includes two scenarios: the first is a smart energy management system that includes all the parameters of the infrastructure layer, mobility layer, and home/building layer. AMI/IoT collect the home/building data through the IoT network infrastructure, and these data can be monitored by a smart pad that controls the home/building for optimal energy management. The modified data are then stored in a smart data pool. The other scenario represents the smart EV charging and energy sharing system. This scenario represents an exchange of optimal energy information through information about electric energy charging of electric vehicles. With this scenario, all data are also stored in the smart data pool. A data pool is a set of data stored over a long period of time. Based on these empirical data, it will be performed refined AI-based optimization over long periods of various data in cities.
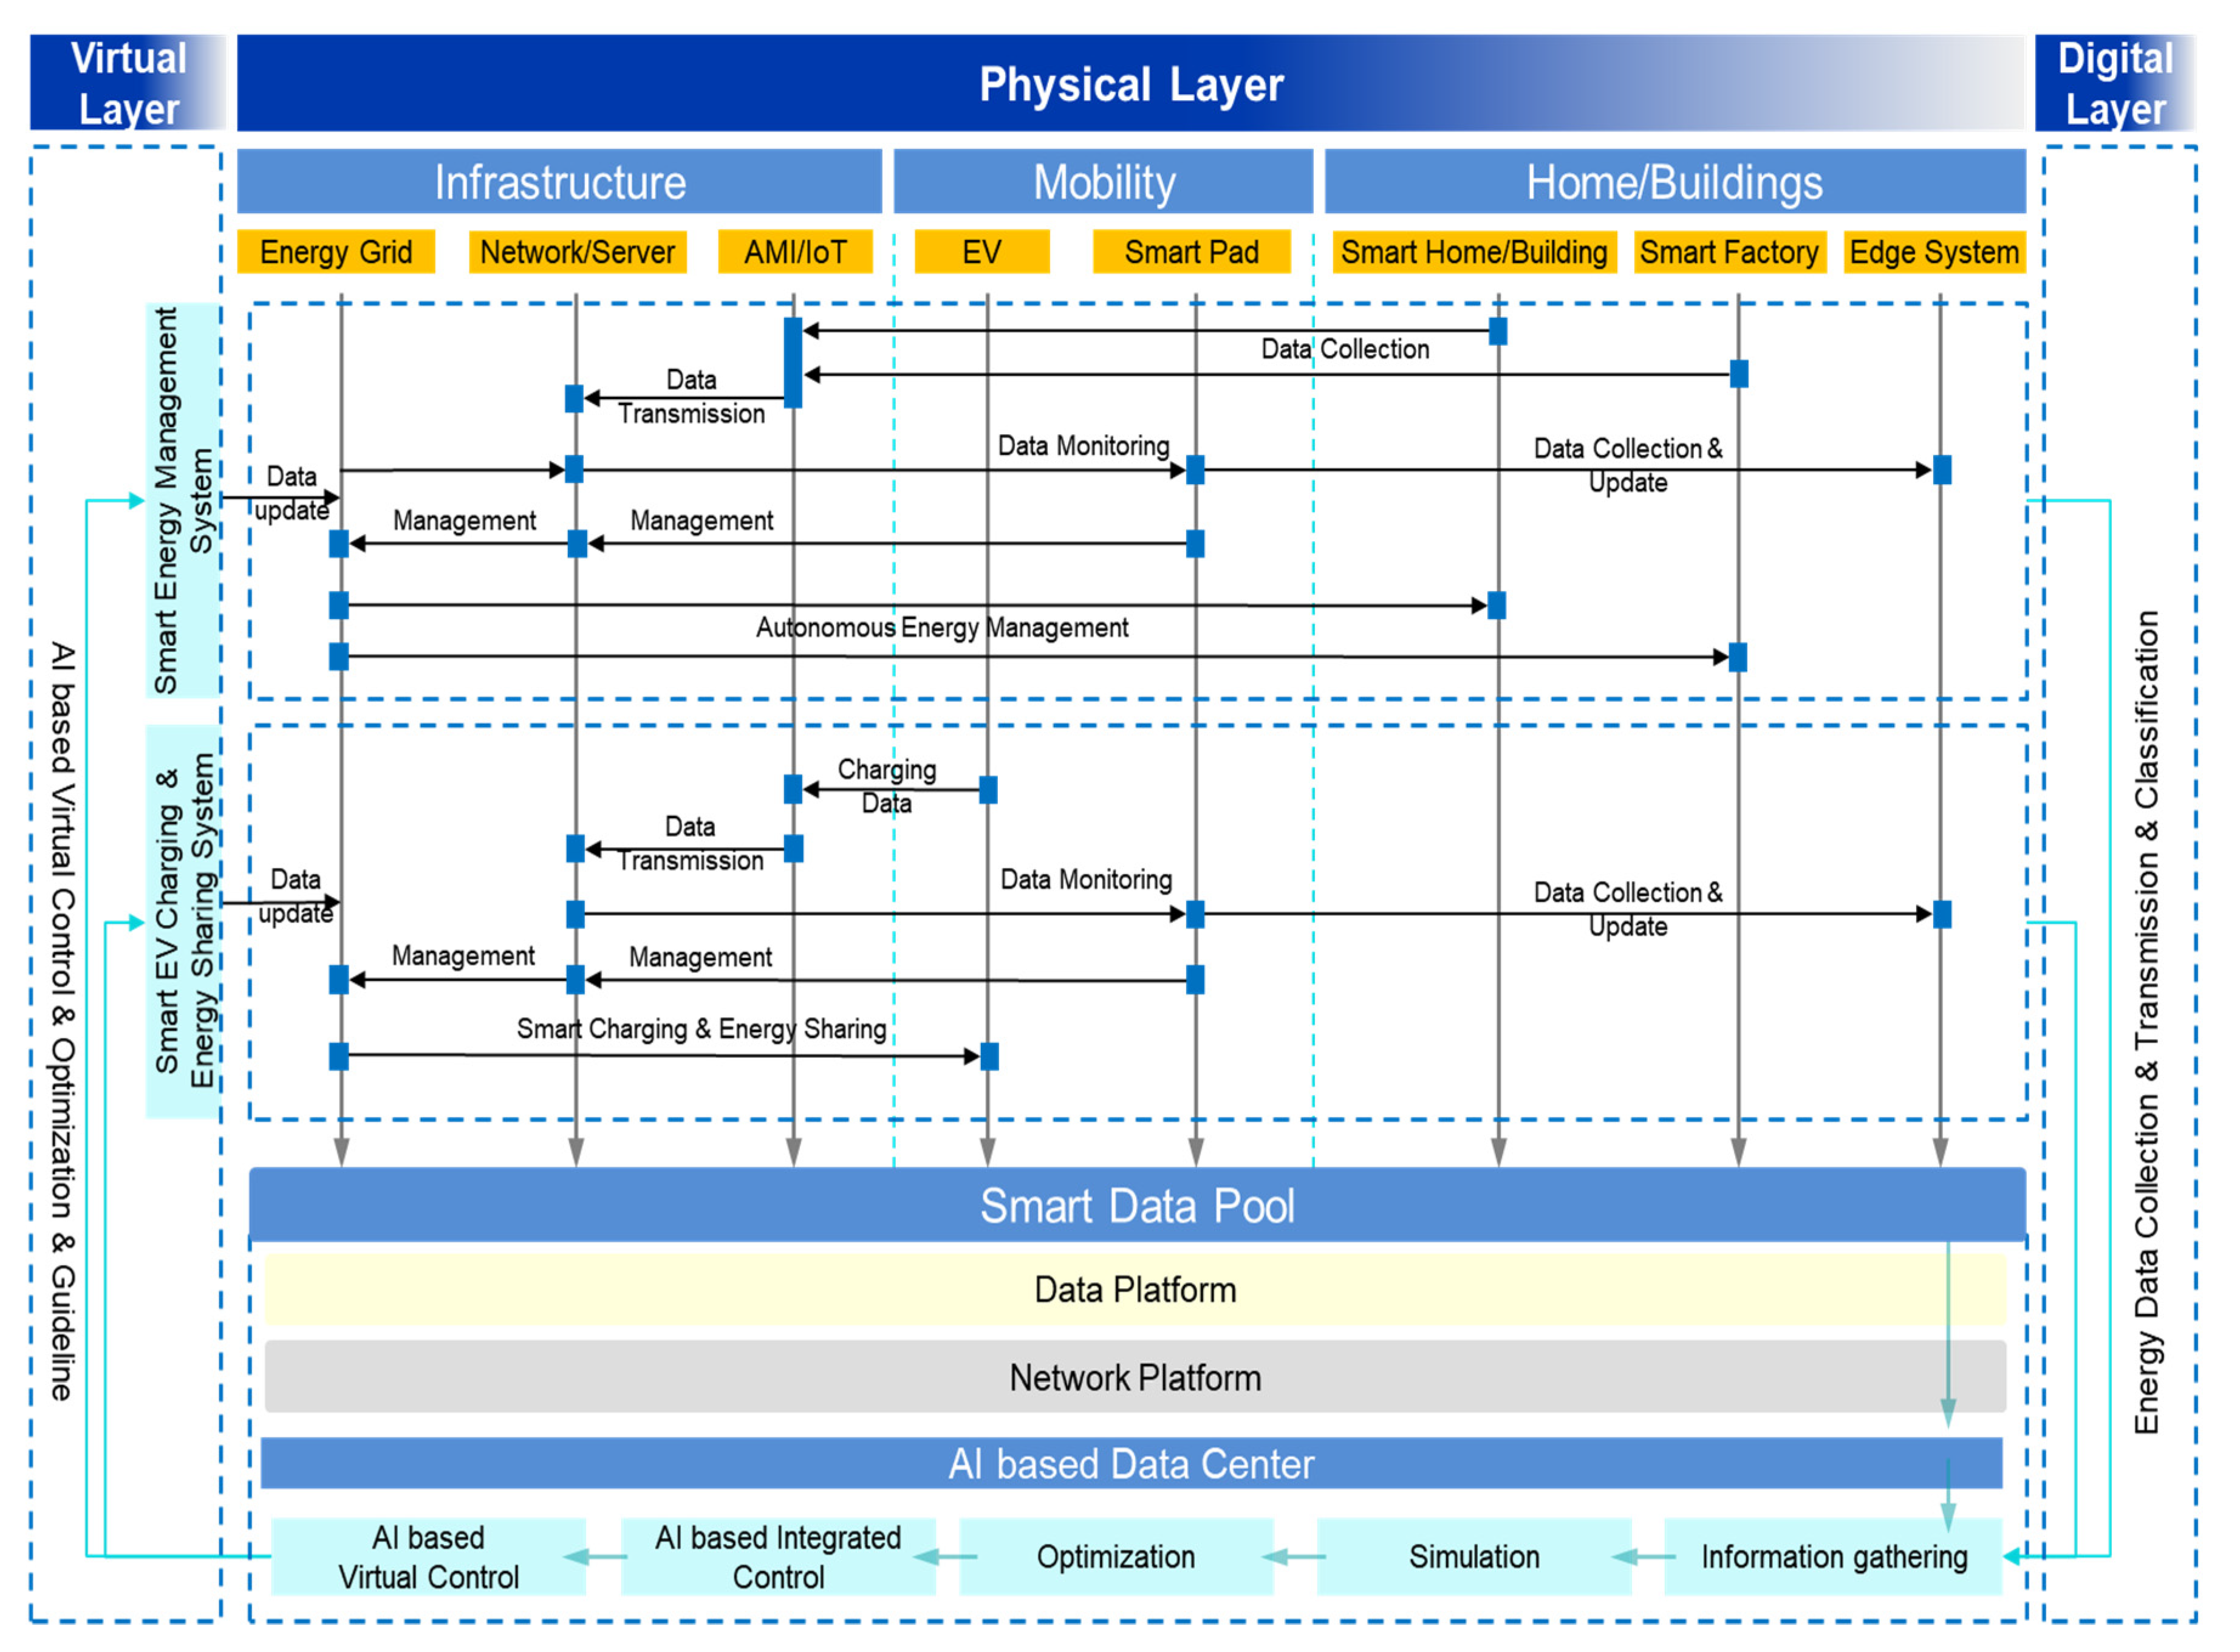
Figure 10 presents the total connection scenarios involving the use of all platforms presented in the paper and shows how the two scenarios are applied to the entire platform. The hardware platform is the initial starting point that is applied to cities to build the smart energy management system and smart electric vehicle (EV) charging and energy-sharing system. All data collected through the hardware platform are collected from the network infrastructure, and guidelines are provided for optimal control through monitoring and simulation of these data. The used data are simultaneously collected in a data center through a software platform, and AI-based virtual control and optimization control are then performed based on the collected data. Through such a data recursive structure, systematic collection and analysis of all data in the city are upgraded to determine the point where optimal management can be applied. This paper calls this entire concept an AI-based SSEC.
4.2. Scenarios
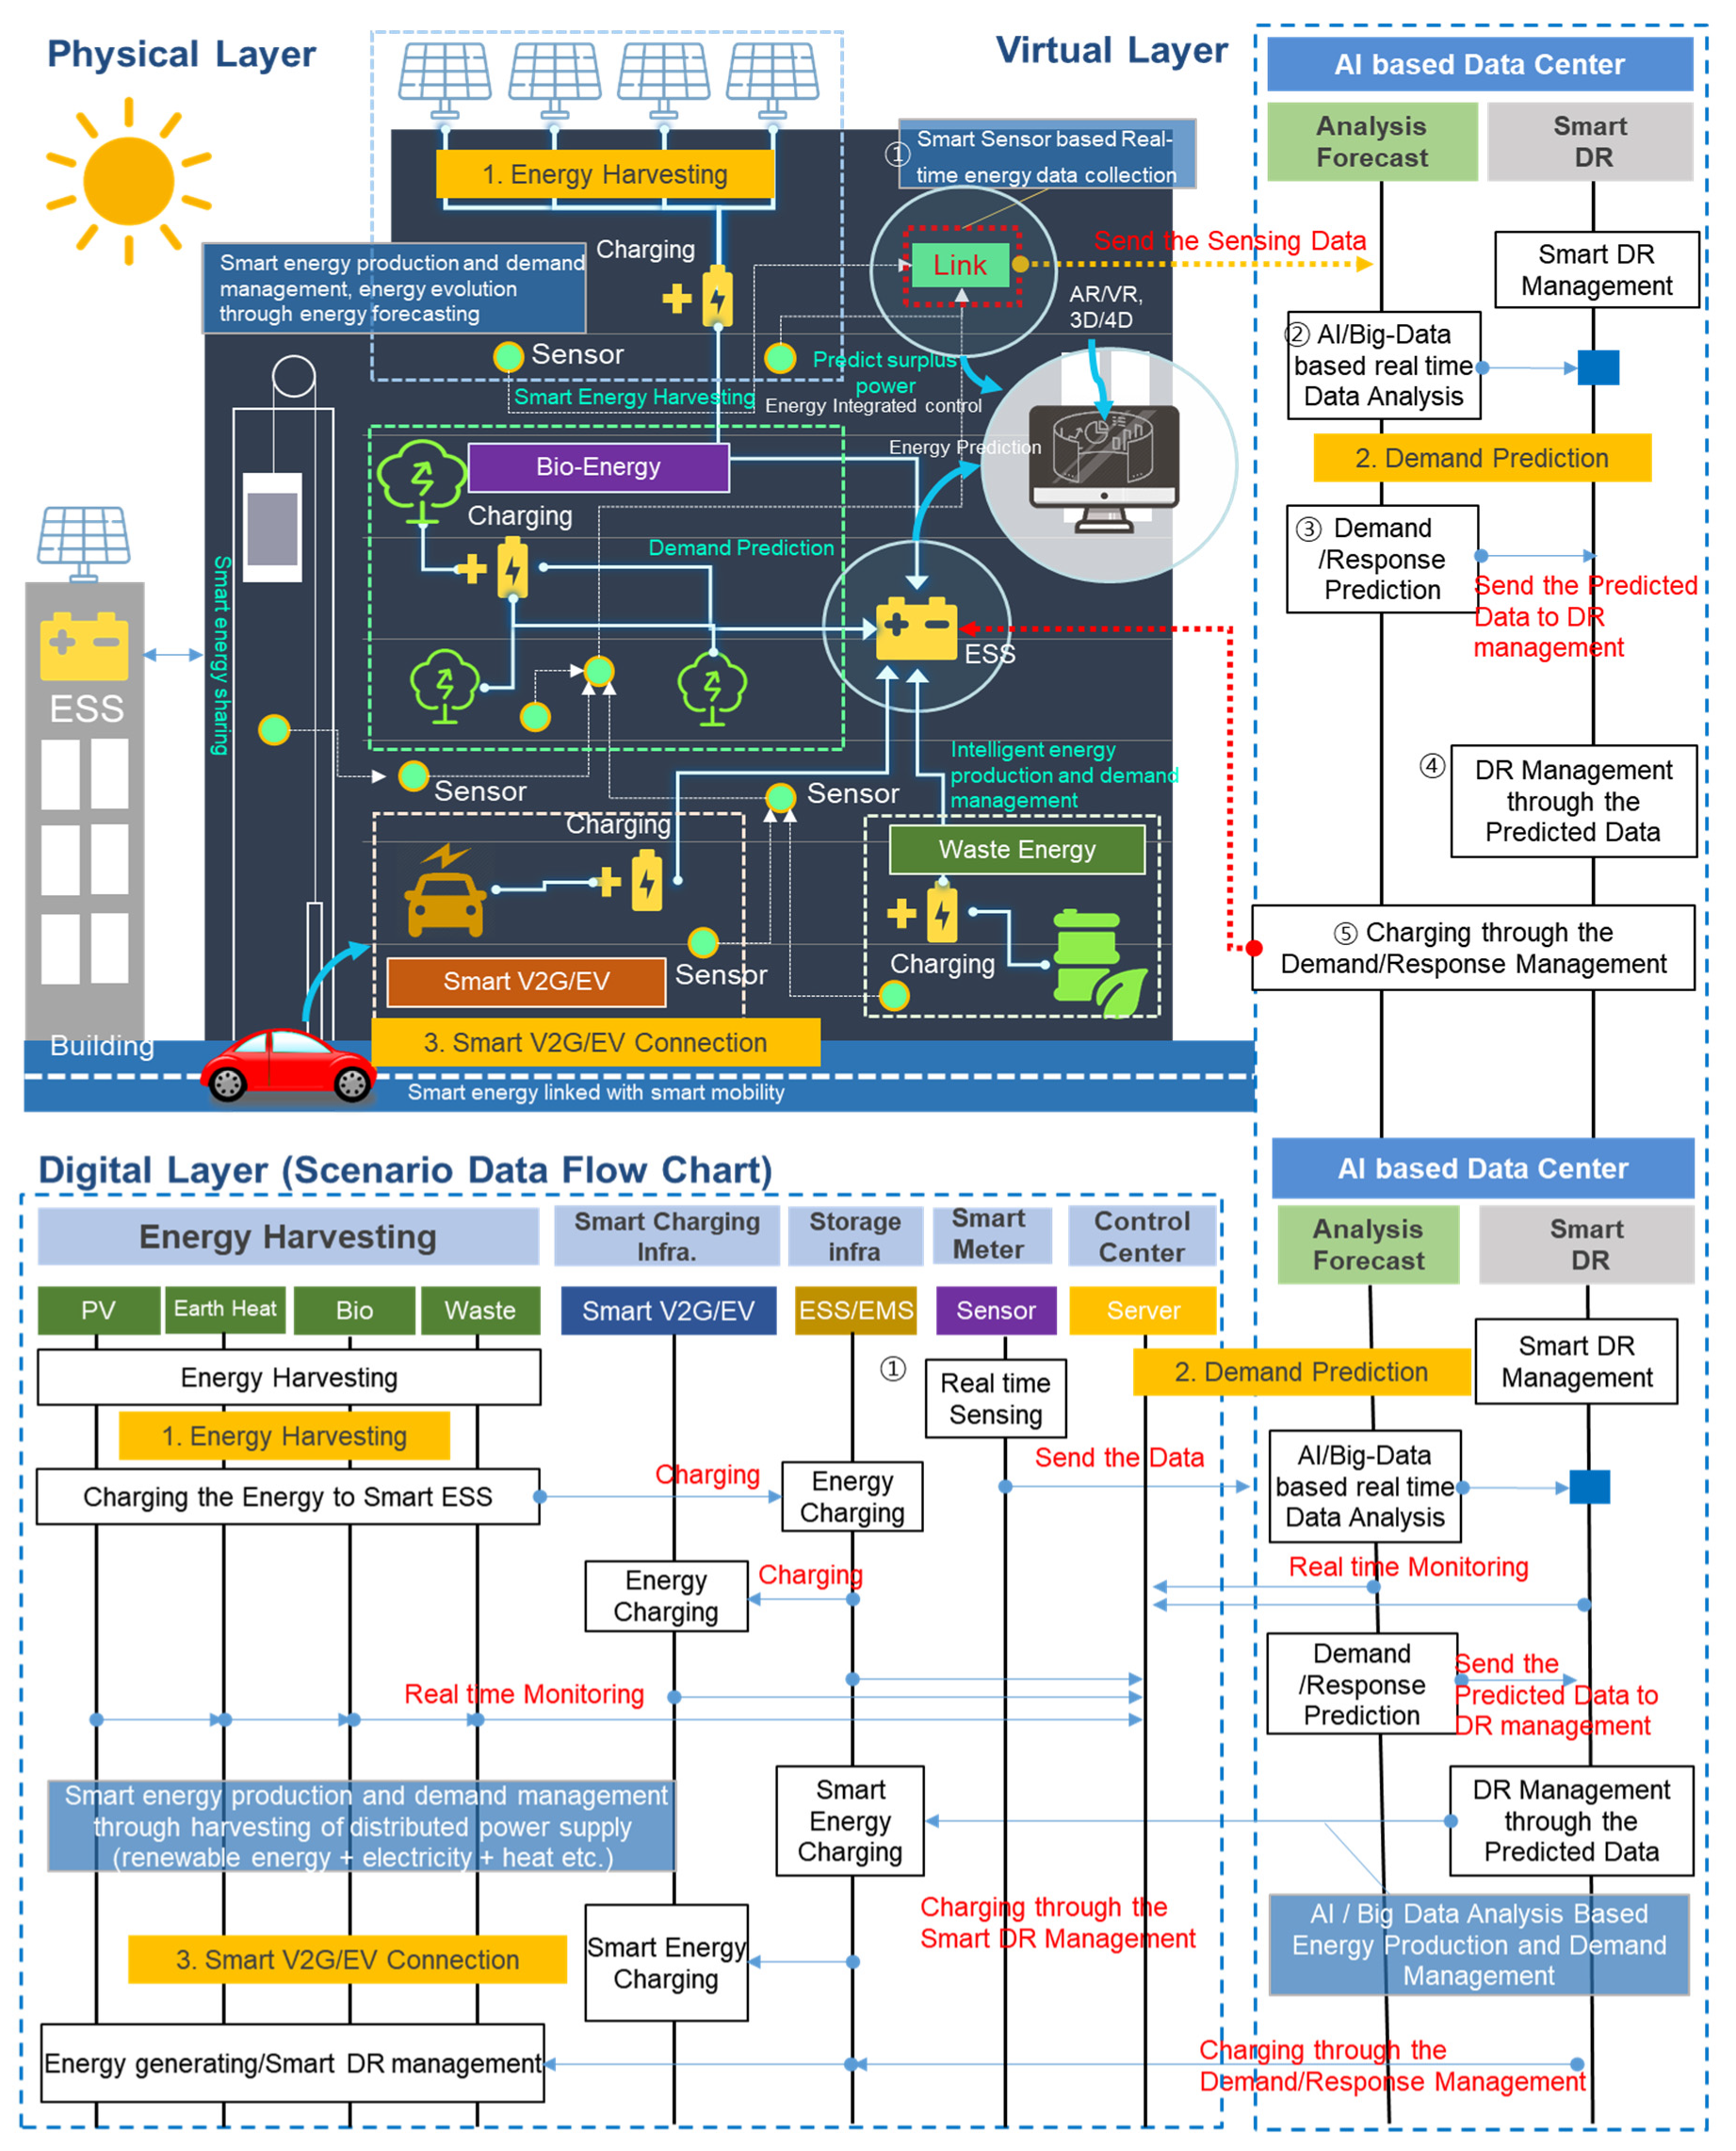
4.2.1. Scenario 1: Smart Clean Zero Energy City platform
Figure 11 shows a scenario for the Smart Clean Zero Energy City. The ESS receives energy from the renewable energy system installed in the building and transmits energy data from the sensor to the data platform. Supply and demand management is achieved through intelligent demand and supply forecasting from the energy data, which varies depending on the environment. This demand management enables intelligent energy storage and consumption through a connection with the Smart V2G/EV.
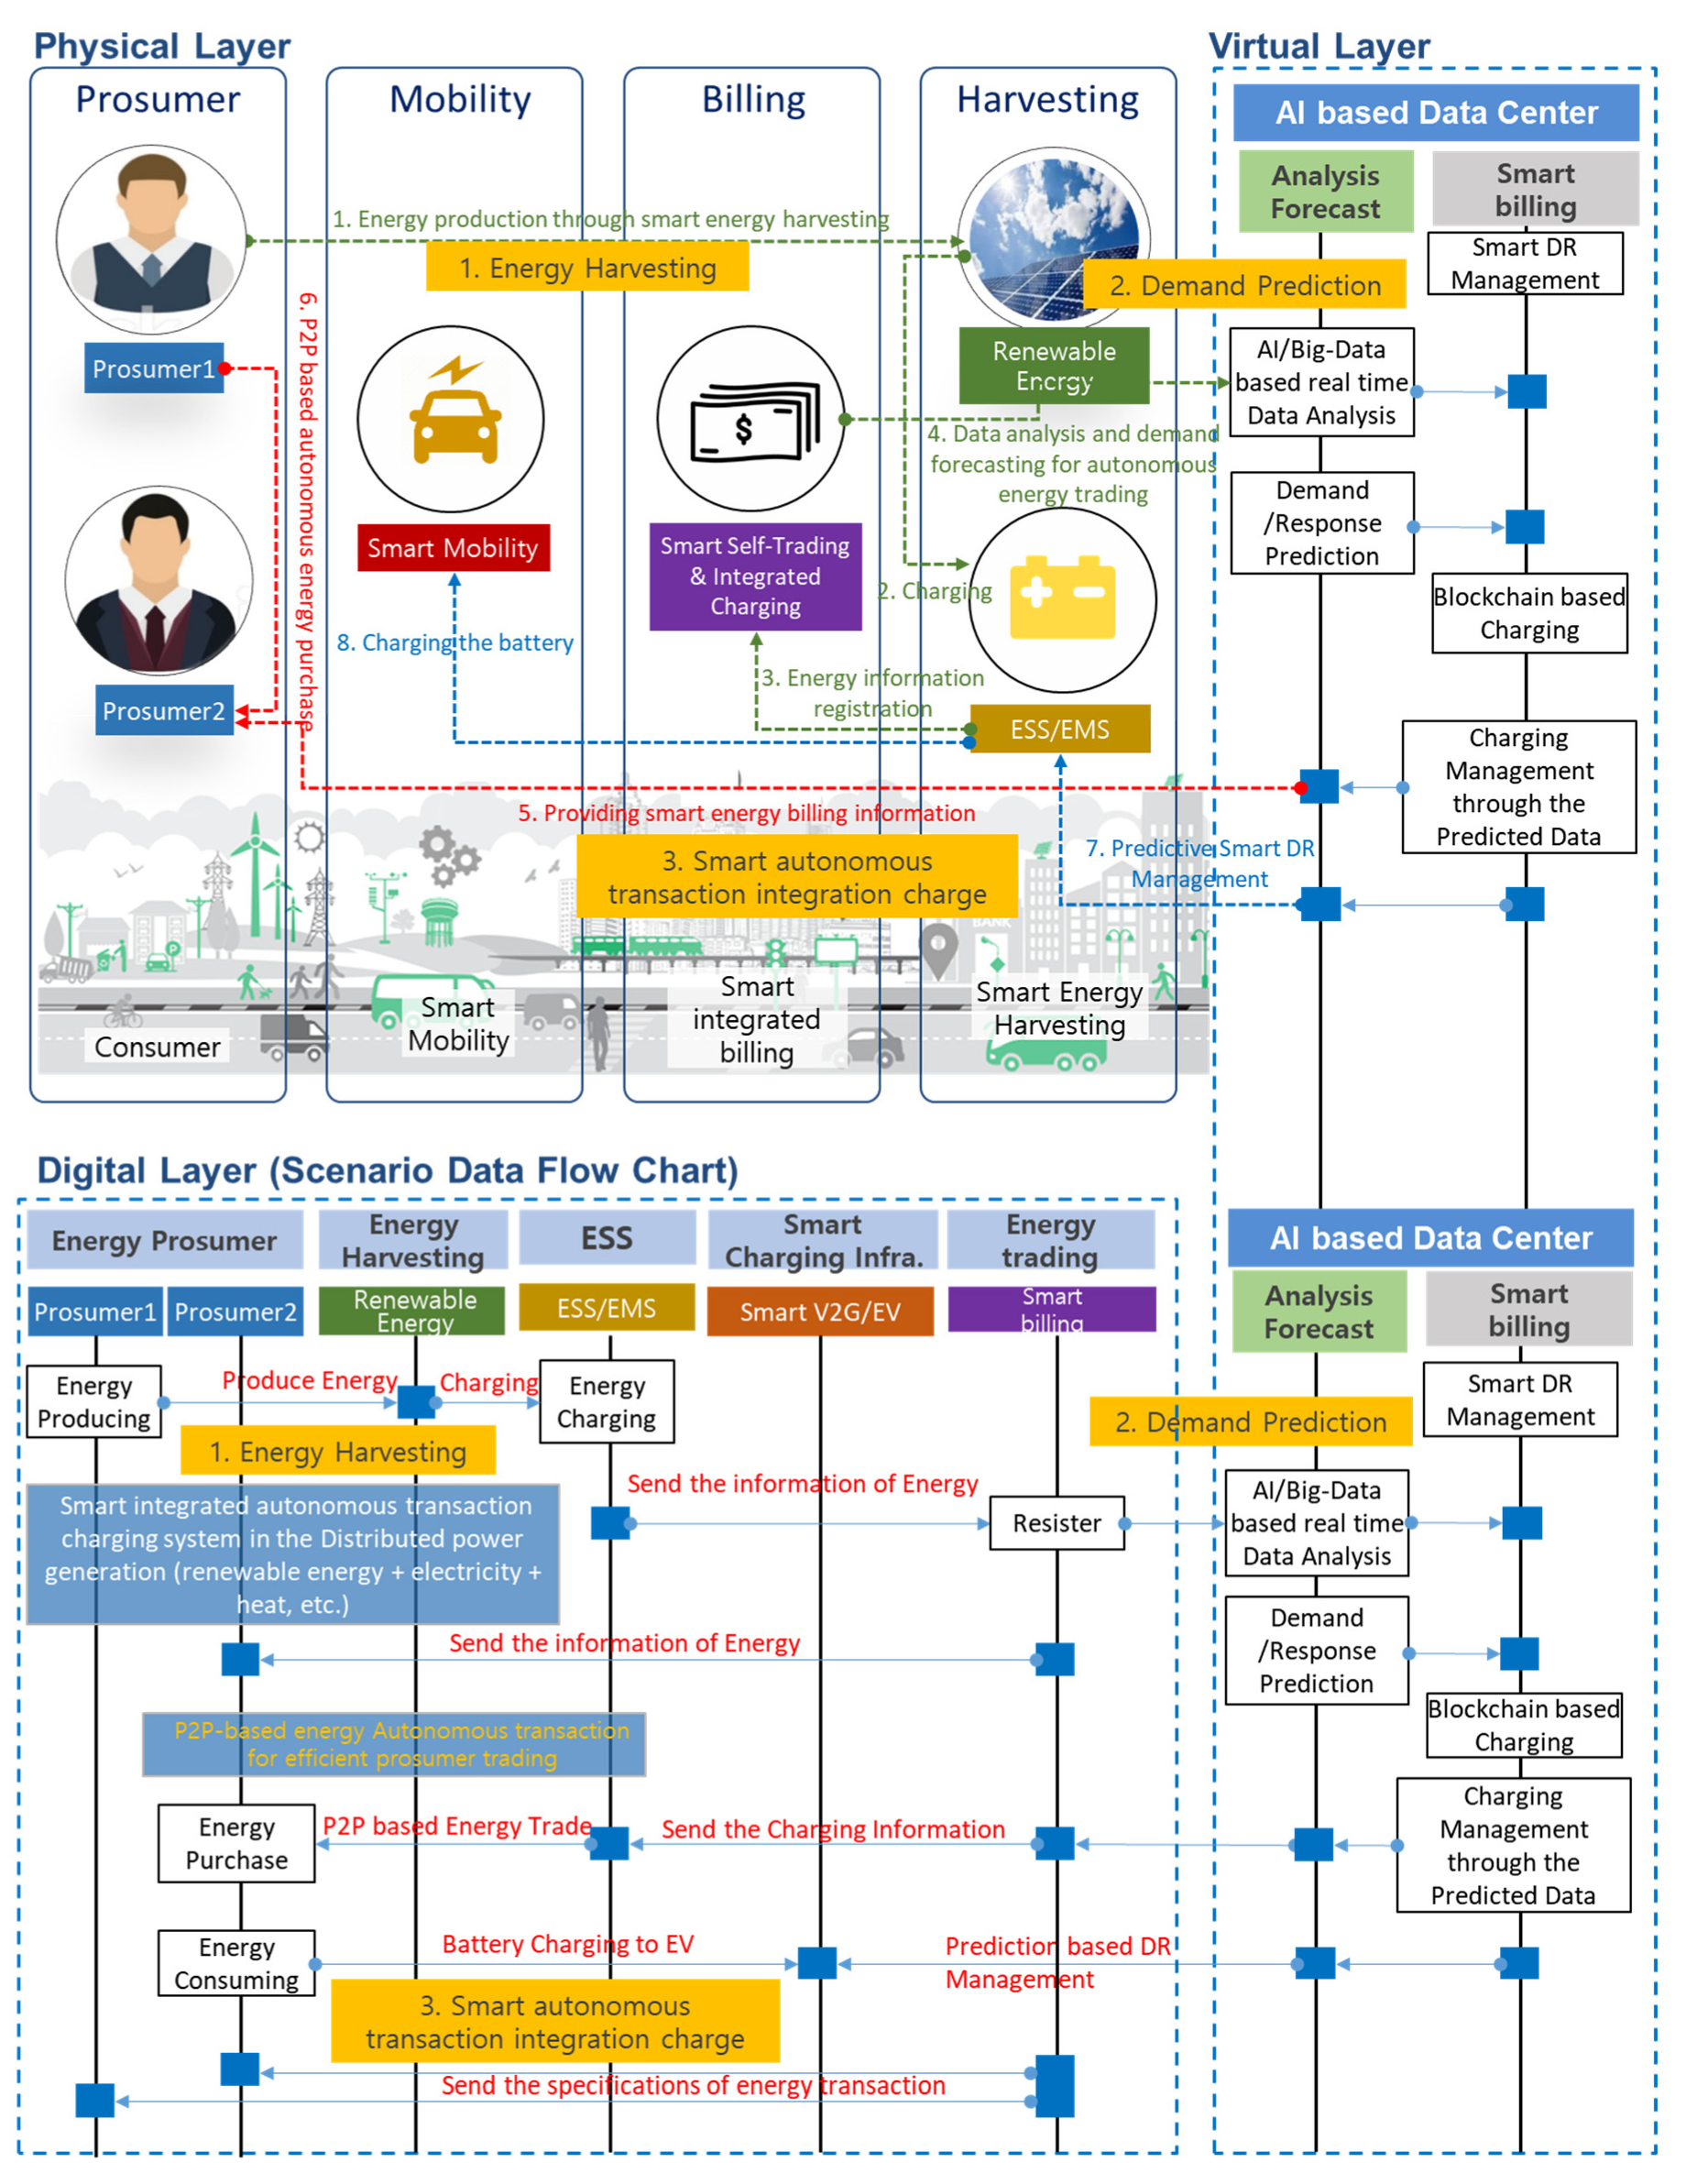
4.2.2. Scenario 2: Collaborative Smart Energy Prosumer Platform
Figure 12 shows an energy trading system scenario for efficient prosumer trading between distributed power energy trading. This scenario enables the implementation of intelligent prosumer transactions between distributed power energy trading through the establishment of an energy trading system. The specific service flow is shown in the table below.
| Service Scenario #1 Scenario details |
Smart Clean Zero Energy City
|
| Service Scenario #2 Scenario details |
Collaborative smart energy prosumer platform
|
5. Results (Economic Analysis)
The following presents cost-effective aspects relating to the construction of a smart energy system in Korea based on this proposed SEC platform architecture. It shows the ROI when applying a building energy management system (BEMS) and V2G/EV to the whole of Korea shown in Section 4.2 Scenario 1. This analysis is based on the assumption that the most basic unit of the SEC is a building and V2G/EV. To provide a measure of the cost efficiency of this architecture, we present the ROI for a smart energy system that is applied to all buildings within the Republic of Korea. In this paper, cost-effective aspects of mass-customization-based manufacturing methods are also considered, and we thus present a ROI based on mass-customization-based installation costs of IoT-based smart systems installed in all the buildings within a SEC. Section 5.1 presents an economic analysis for application of the proposed architecture.
5.1. Research Method
In this paper, the economic analysis of the proposed architecture based on ROI is carried out by comparing the economic benefits before and after the application of this system (reduction of smart system construction cost, energy saving by smart system, growth rate of AI-based energy saving, economic gain by applying V2G/EV, and system performance degradation). All data are calculated based on the proposed platform and are estimated based on reliable data through the current status of the Republic of Korea.
5.2. Economic Analysis
5.2.1. Method of Economic Analysis
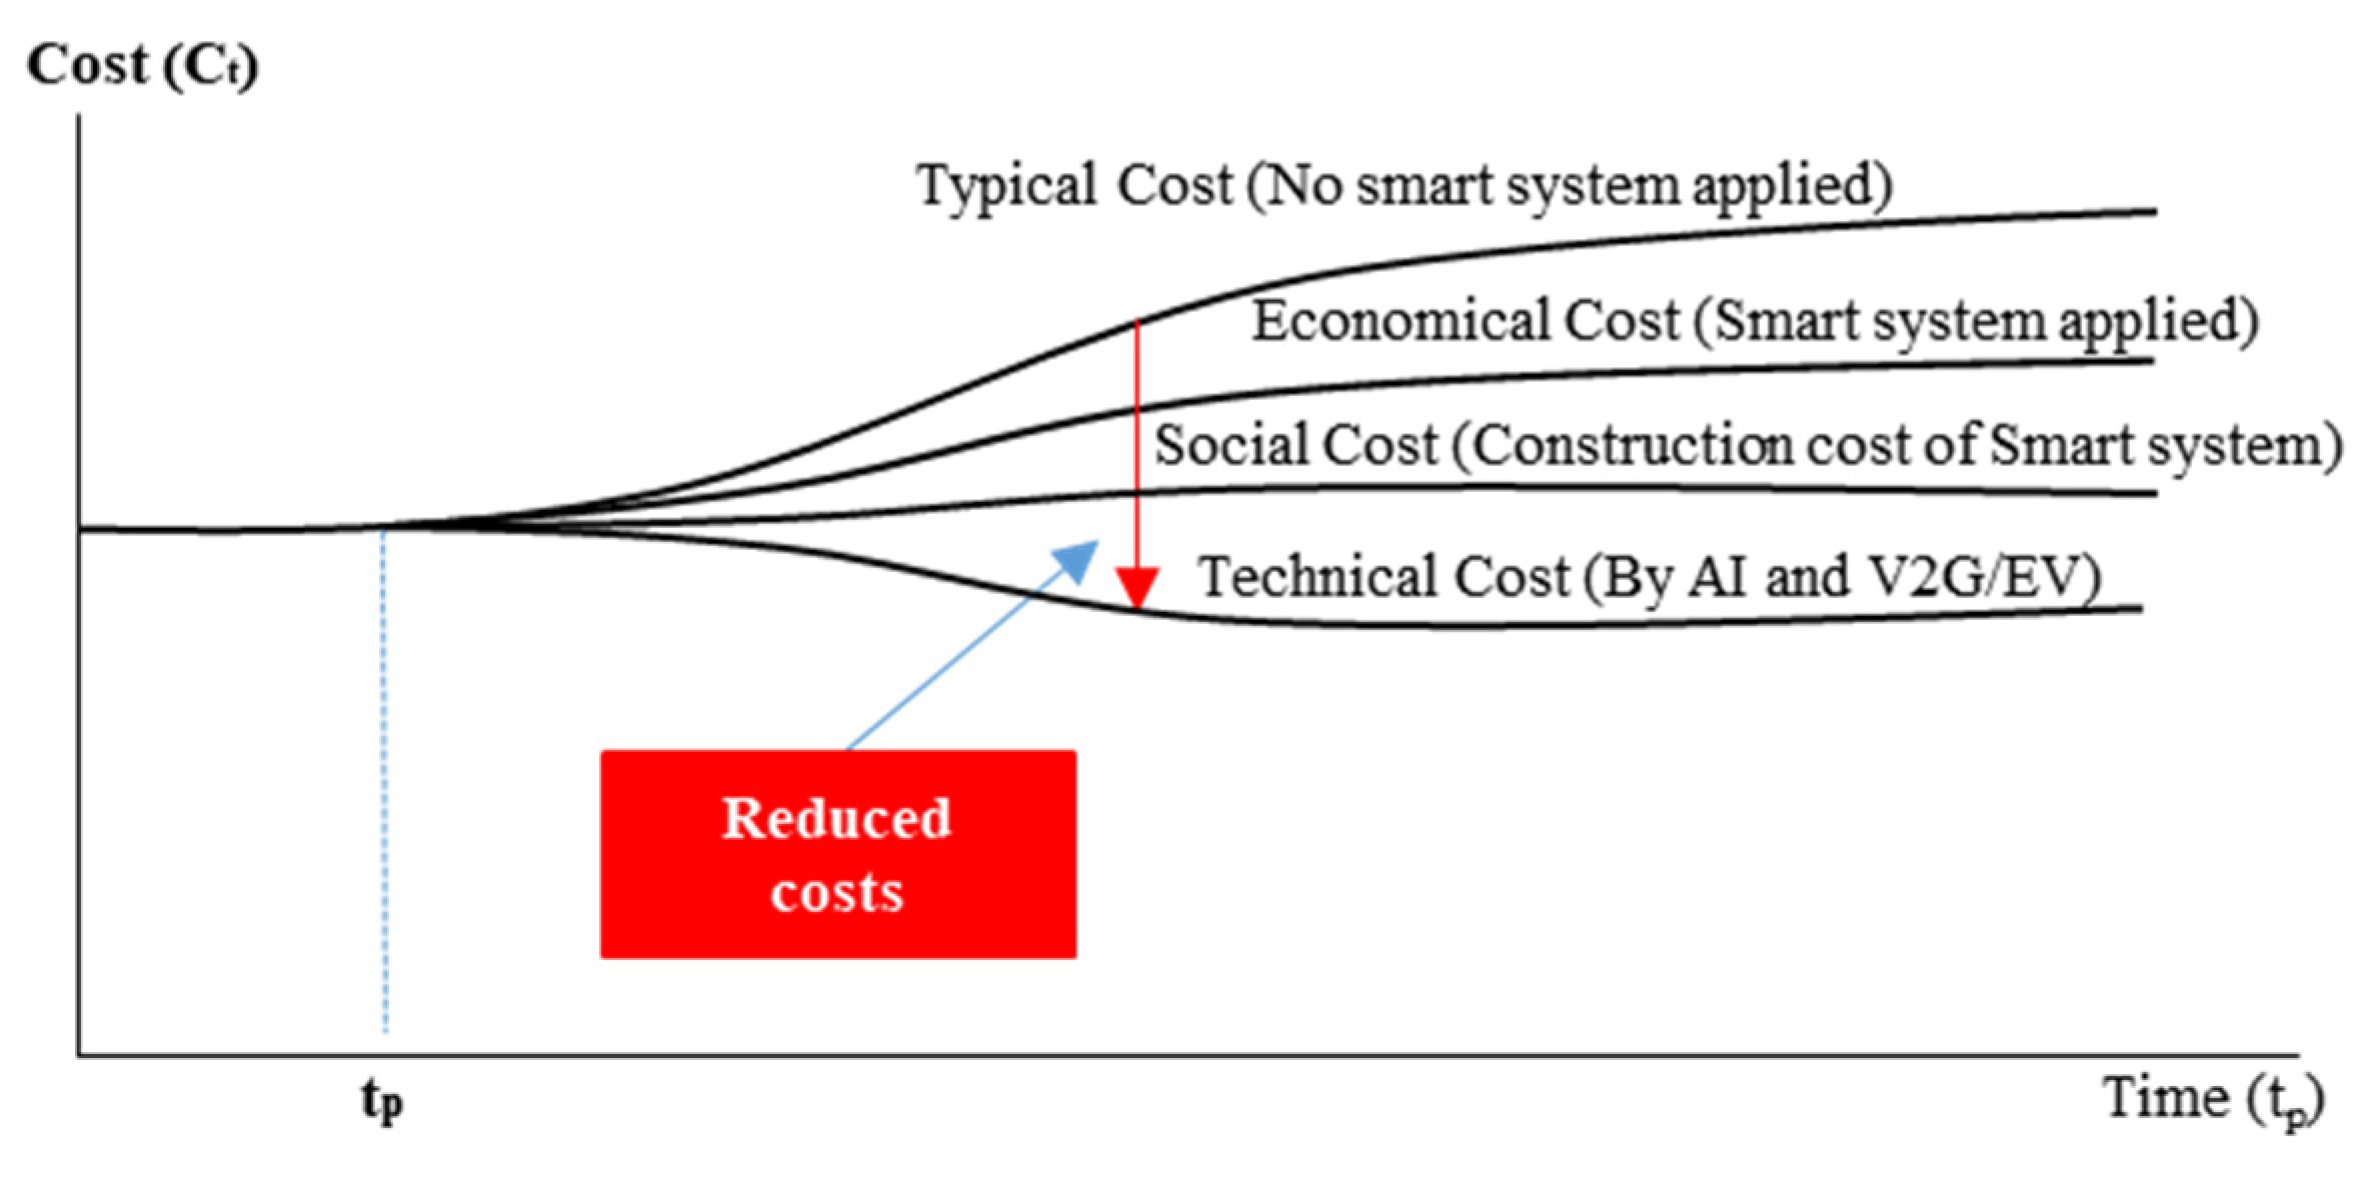
- Economic analysis was conducted by measuring and comparing the costs and benefits of applying a smart system (Figure 13).
- The benefits include reduced social costs, which are mitigated through energy savings.
- It can thus be said that there is a difference between the value generated when the smart system is not applied and the energy saving value when the system is applied.
5.2.2. Economic Analysis Process
Following shows economic analysis process. Economic analysis for a smart system for SEC involved the following steps:
- (1)
- Total installation cost during the installation of smart building system in Korea was estimated. This further involved:
- Analysis on the status of buildings in Korea: Estimation of the total area of domestic buildings;
- Estimation of total installation cost when installing smart building system in Korea;
- Additionally, estimation of installation cost when installing V2G/EV.
- (2)
- Economic benefit cost when installing smart building system
- Estimation of reduction rate of total energy use cost by smart building system.
- (3)
- Economic benefits when applying the proposed architecture
- Estimation of reduction cost of total smart system installation [11];
- Estimation of reduction cost of total energy use by AI and V2G/EV.
- (4)
- Return on Investment (ROI) was calculated as;
- ROI [43] = (smart system installation cost (SSIC) − expected cost saving through proposed architecture (ECSP))/total expected saving cost through system installation (T − ESCS).
5.3. Economic Analysis of Applying Smart Building System in SECs
5.3.1. Total Installation Cost When Installing Smart Building System in Korea
Analysis on the Status of Buildings in Korea: Estimation of the Total Area of Domestic Buildings
Table 2 presents statistics relating to the types of buildings in Korea [44]. There are 7,126,526 buildings nationwide occupying an area of 3,641,993 thousand square meters (1000 ), according to statistics on building types in Korea [45]. Depending upon their uses, the buildings are classified as residential (64.72%), commercial (17.50%), industrial (4.34%), educational/social (2.69%), and others (10.75%). This paper focuses on residential and commercial buildings. The application area can be calculated based on the application specific weight.
Average Cost of Smart Building System (Module)
Smart building system comprises of an IoT sensor system and a user mobile device. The IoT sensor system consists of sensors for temperature, humidity, motion, smoke detection; beacon, communication, power, and control modules; a battery, an external case, and other materials. Mobile devices include the users’ mobile smartphones such as Android or iPhone; server development for service operation and application of these phones is required. The estimated hardware price of one IoT sensor system is summarized in Table 3. Additional application and server development costs of mobile smart phones is excepted, as it is not directly related to the number of buildings and area.
Total Installation Cost of Installing Smart Building System in Korea
Based on the purpose/function of the building, the range (area) in which one IoT sensor system operates and provides service can be estimated as Table 4. Based on the above estimated service area, the number of IoT sensor systems required to be installed can be calculated based on the area of the building and its purpose, as applied at the country level as Table 5.
The average area per building in Korea is approximately 511 m2. When applied to individual building categories, the average size of residential, commercial, industrial, and educational buildings is 26, 17, 9, and 17, respectively. The others requires an average of 13 installations, and the number of IoT sensor system installations required by the product of the average value and the number of buildings is as Table 6.
Estimation of the required number of IoT system installations can be calculated by multiplying the estimated unit price of the system by the average required number of devices, derived from the above two estimation methods. This paper focuses on residential and commercial buildings the final costs were calculated to be 17.86 (trillion KRW).
5.3.2. Economic Benefits of Installation of Smart Building System
Table 7 shows the electricity consumption and usage for the month of October 2018 in Korea [46]. The total cost of electricity used in Korea for this month is 3.8 (trillion KRW)). At this time, the cost of electricity used in the building was calculated as 1.5 (trillion KRW) considering 41% of the total cost according to the US DOE 2011. It is assumed that on an average, approximately 11% cost reduction can be obtained via the smart building system [47,48,49]; assuming that it is the best cost-saving option in Korea, the total savings can amount up to 19 (trillion KRW) in a year.
5.3.3. Economic Benefits when Applying the Proposed Architecture
As shown in Section 1.3, the benefits of applying the proposed architecture can be observed in terms of as cost-effectiveness due to mass-customization-based installation. The benefit of applying the proposed architecture to mass-customization-based installation of the smart system is that system installation cost can be reduced by 15.9% [11].
5.4. Result
5.4.1. Return on Investment (ROI)
Economics analysis is used to calculate the difference between economic losses that would be incurred if the system was not applied, and the economic gains that would be perceived if the system was applied. Table 8 summarizes the average values calculated, based on general system costs.
Table 8 presents an economic analysis of applying the smart building system to domestic buildings. It is expected to cost approximately 17.86 (trillion KRW) to install this system to all buildings in Korea. The expected economic losses from not installing the smart system in domestic buildings are calculated as being 2.09 (trillion KRW). This is based on the assumption that the energy saving potential would be 11% [47,48,49] of the total energy consumption of the building: the annual electricity reduction tariff would thus be 2.09 (trillion KRW) [46] if the system were applied, and the total investment return period would be 8.52 years. Additional installation costs would be expected to decrease 15.9% [11] when installing by proposed architecture, a mass-customization-based system, and the payback period can be calculated as 7.16 years. As be showed in Section 5.2.1, the payback period (ROI) for the smart system installation can be calculated as follows:
- (1)
- Typical payback period when applying system to domestic buildings (ROI-S)
- ROI-S = = 17.86/2.09 = 8.52 (year)
- (2)
- Payback period when applying the proposed system architecture (ROI-P)
- ROI-P = = (17.86 − 2.83)/2.09 = 7.16 (year)
(ECSP = 2.83; 15.9% more economic gain through mass-customization-based manufacturing)
5.4.2. Simulation Result
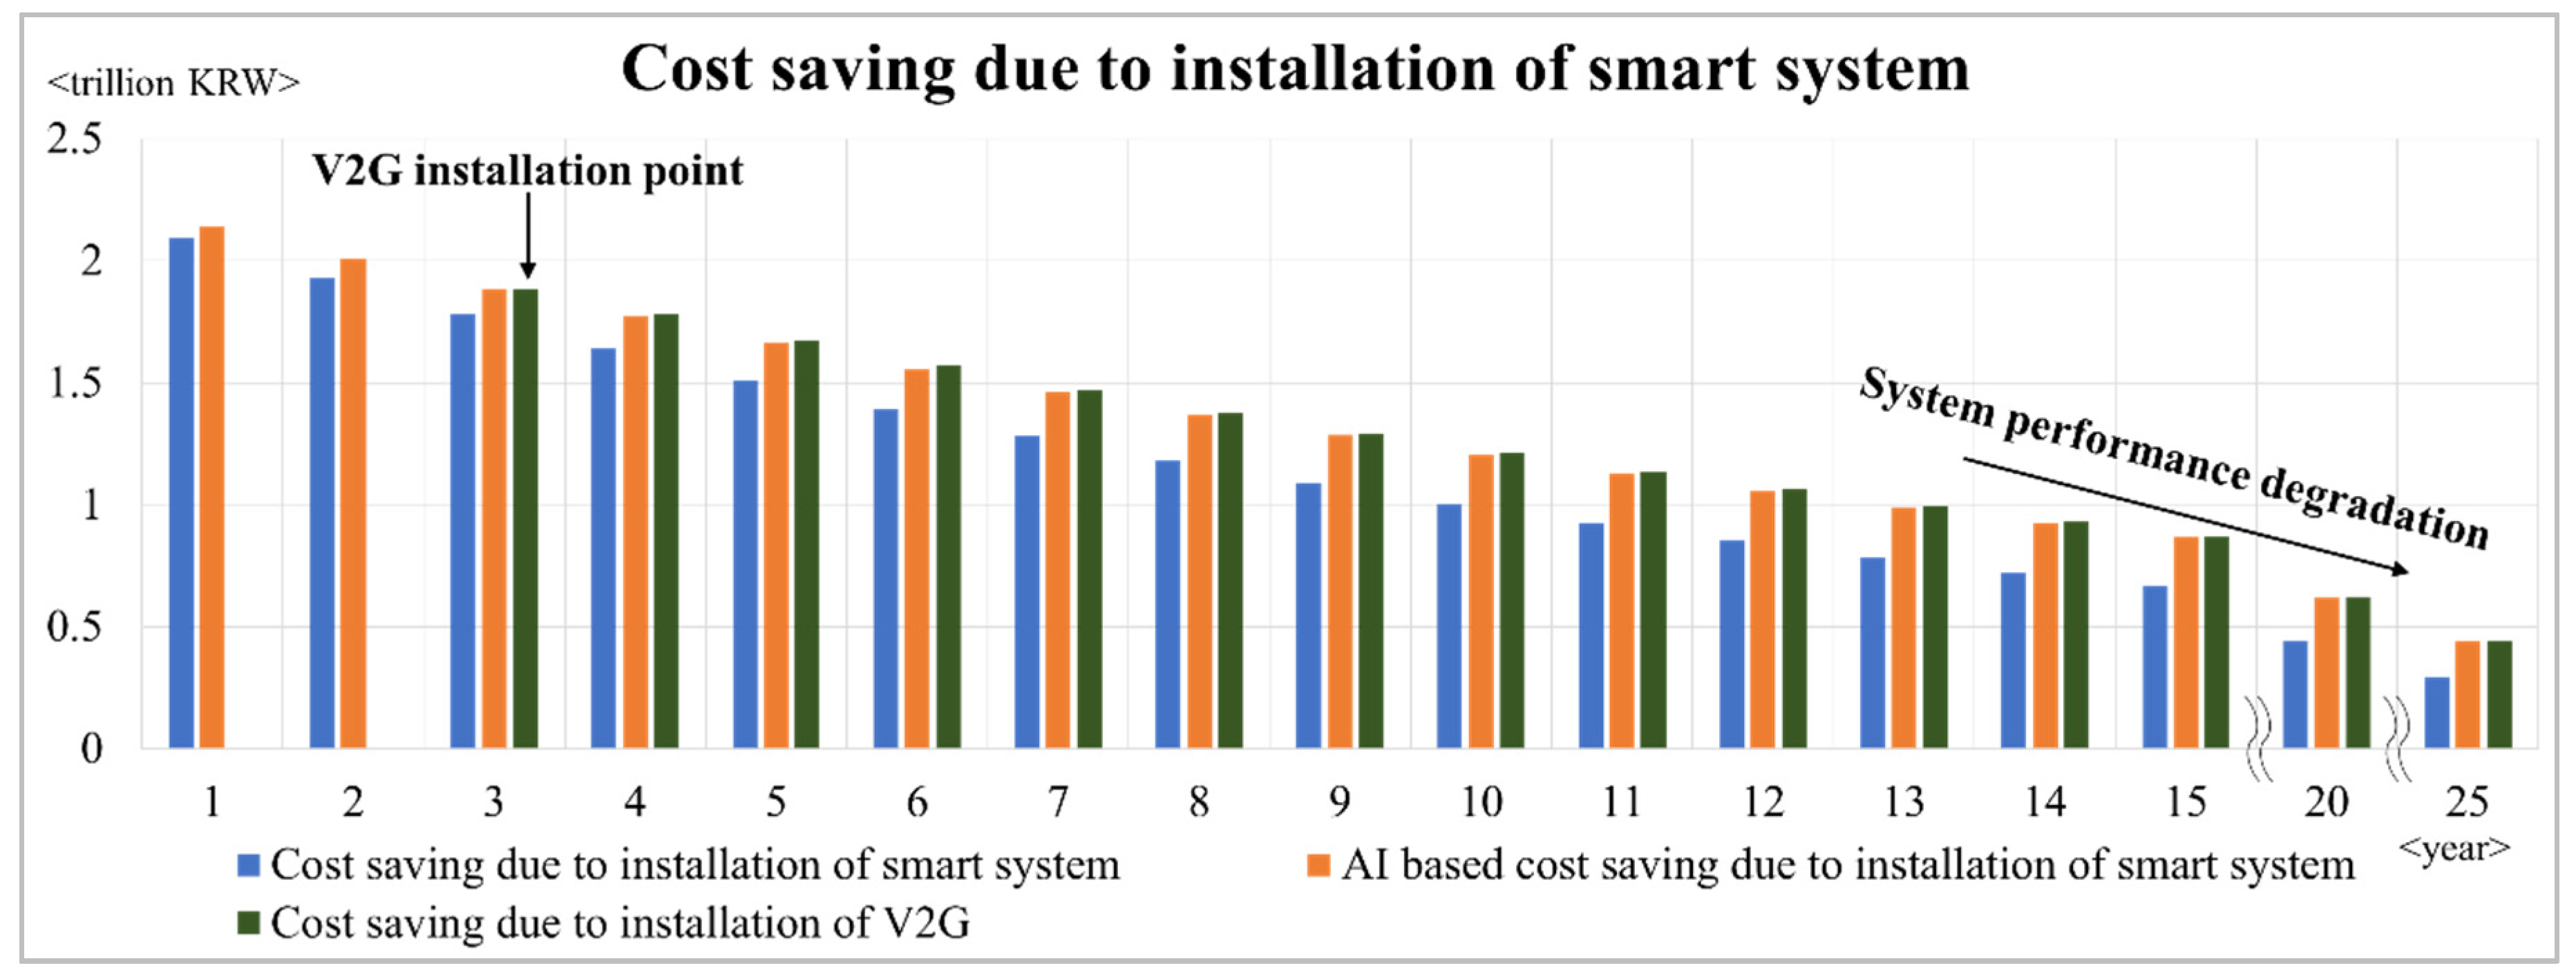
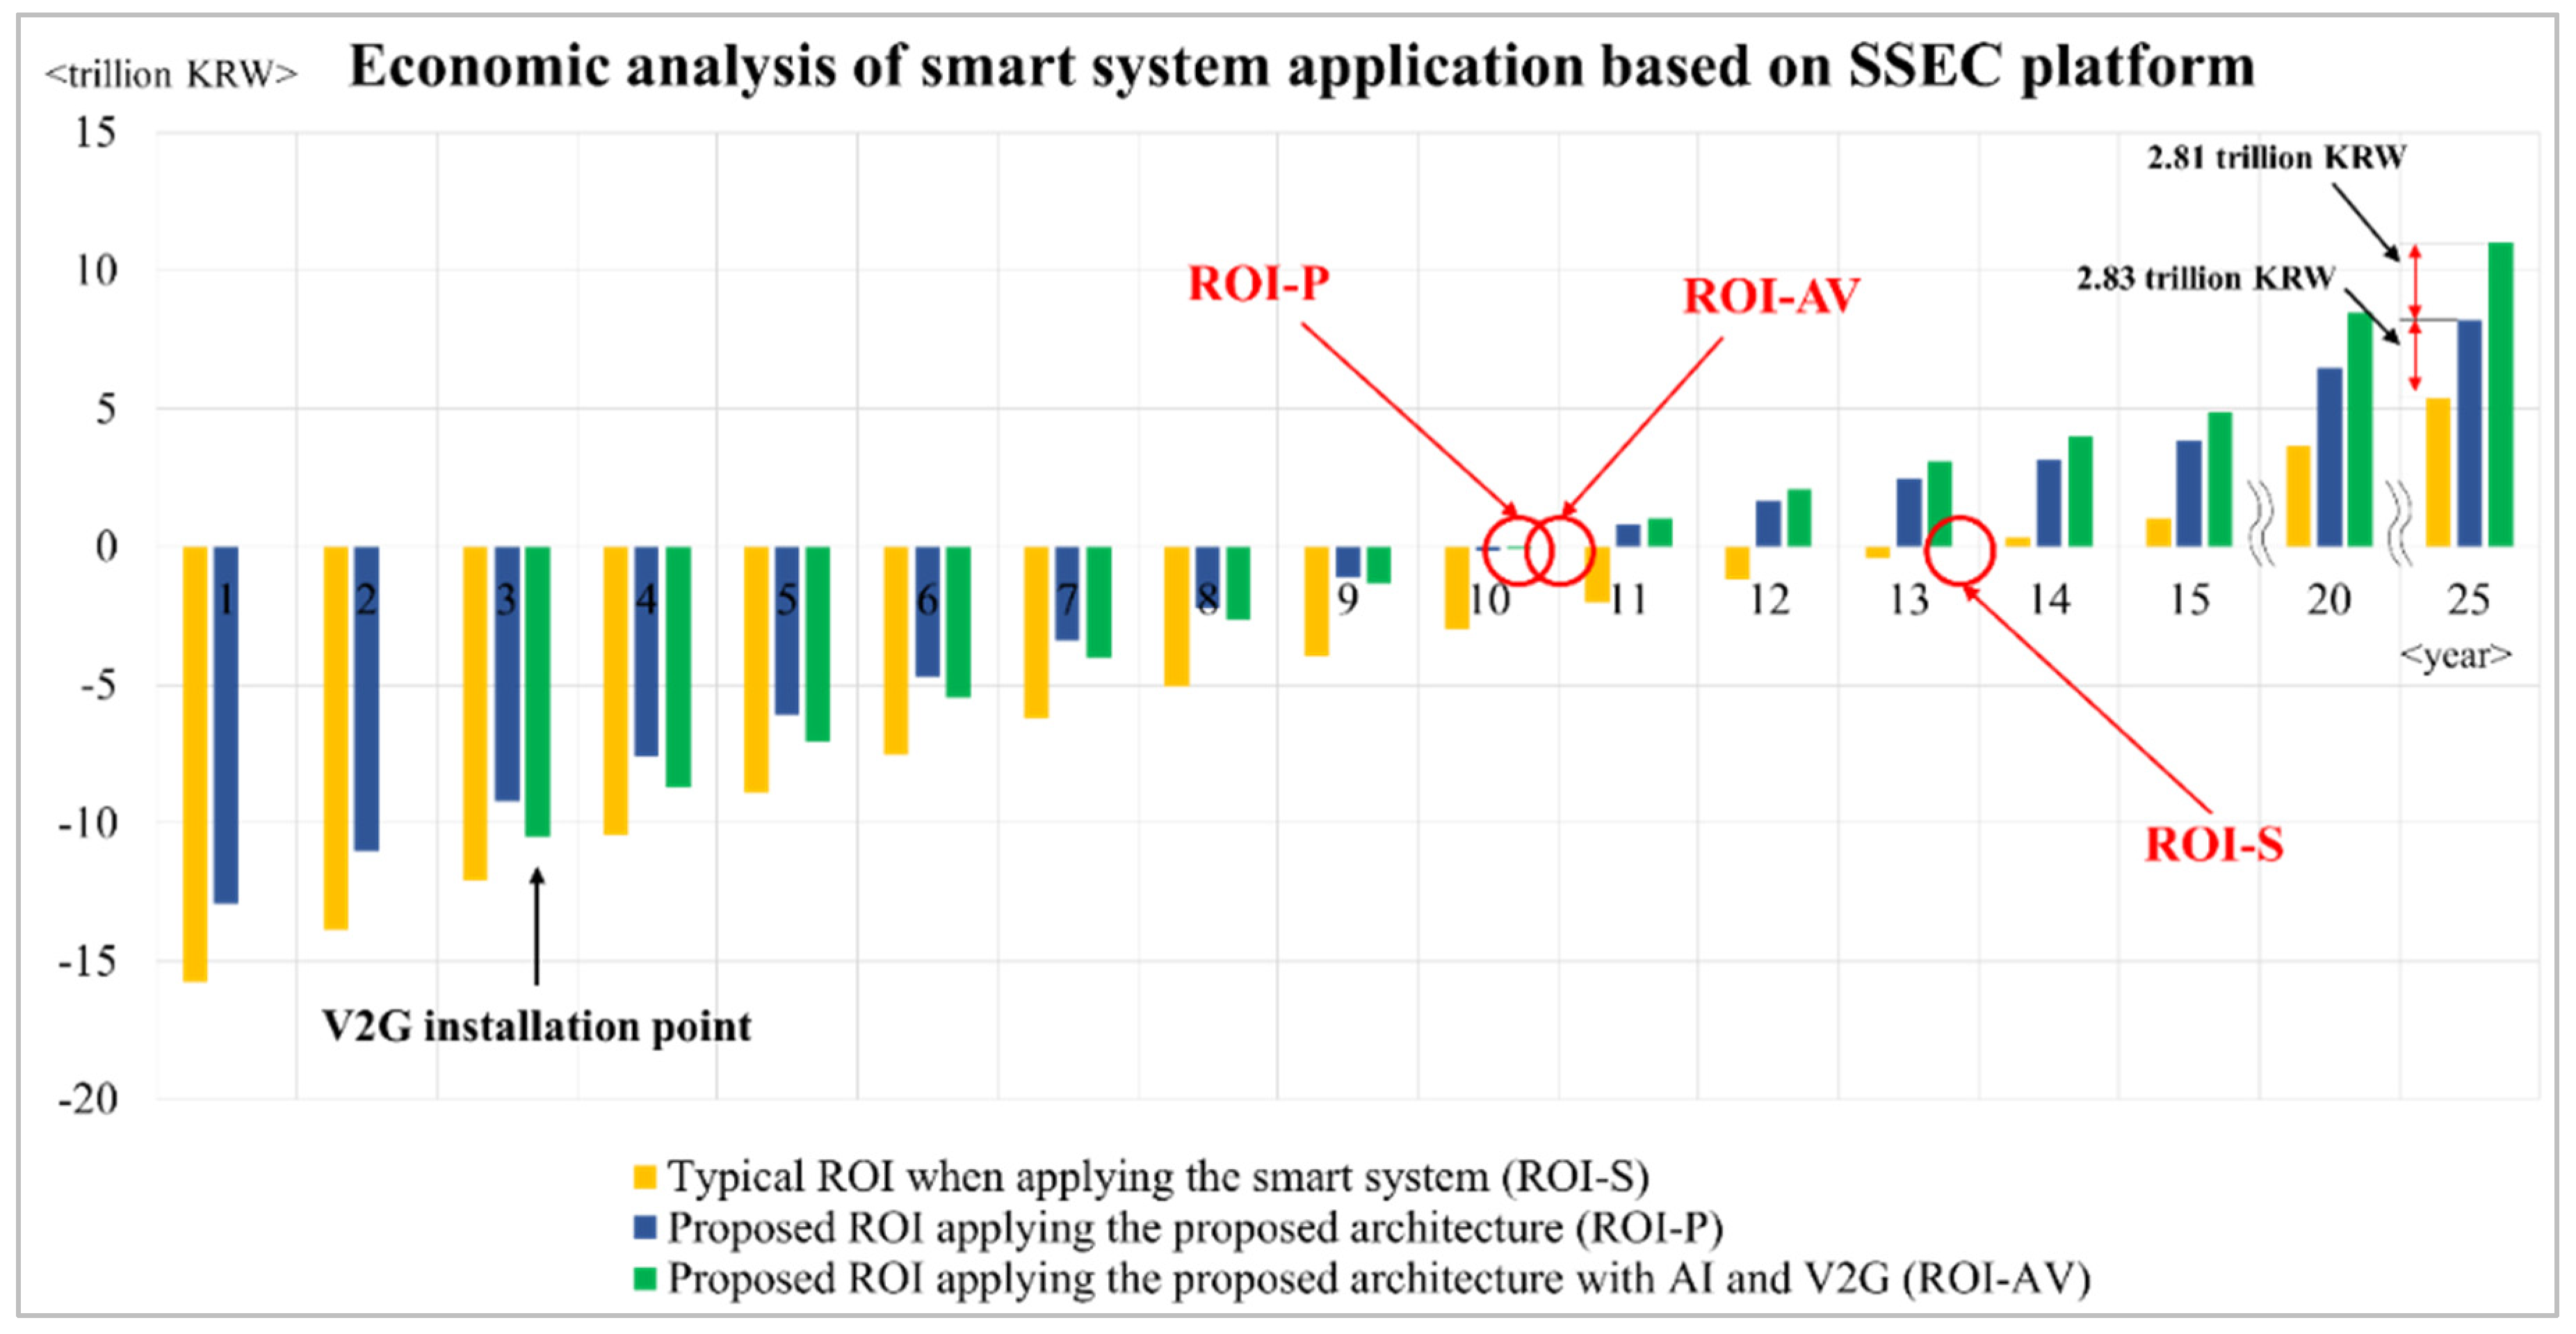
Figure 14 shows cost saving due to installation of smart system. It shows that cost saving patterns can be seen to increase with system intelligence. On the other hand, we set system performance degradation rate and system maintenance rate as 5% and 3% like Table 8, so, Figure 14 shows the system performance is decreased as time passes. Figure 15 presents the results of an economic analysis conducted with respect to applying this architecture. It was found that there was a difference compared to the ROI mentioned above in Section 5.3.1 because the system performance degradation rate was considered in this simulation. It consists of three ROIs. ROI-S is obtained by configuring a smart system before reflecting the proposed architecture. ROI-P is the ROI that can be obtained based on the proposed architecture. ROI-AV represents the ROI that can be obtained by applying AI and V2G/EV to the proposed architecture. From this simulation, we set the factor of energy saving variation rate due to AI-based smart system as time passes as 2 [51] (Yi Liu et al. proposed energy savings of more than 50% per day are achieved through DRL (deep reinforcement learning)-based energy scheduling for 40 households in each 5 communities. In this paper, it is assumed that energy saving is possible by 30% after 10 years as time passes by AI-based smart system considering the performance degradation and other exceptional cases.), and expected cost saving due to installation of V2G/EV is 0.01136 [50]. It can be seen that ROI-P is faster than ROI-AV and ROI-S with the passage of time. The reason ROI-P is faster than ROI-AV, ROI-AV is relatively slower than ROI-P is that initial construction costs (V2G/EV) are incurred. Nevertheless, the benefit of ROI-AV is 2.81 trillion KRW more than ROI-P after 25 years later. Also, it is possible to build a smart system that can be mass-customized by considering certain environmental factors of domestic buildings, and it is possible to construct a smart system that is designed optimally for a building environment by considering various environmental factors, service factors, and functional factors. Using a combination of various customized sensors and actuators and mass producing them would enable the systematic installation of a cost-effective system in various types of domestic buildings. The sensor system’s cost can be reduced when system expansion is considered. Compared to the general system construction costs, it is anticipated that the installation costs of this system will be lower; furthermore, new jobs can be created to activate small companies and start-ups.
6. Conclusions
6.1. Implications
This study suggested an AI-based physical and virtual platform using a 5-layer architecture to develop a SSEC. The architecture employs both a top-down and a bottom-up approach, has a cyclic structure, and the links between each energy can be readily analyzed. It was demonstrated that deploying the platform associated with this architecture will enable the speedy development and application of new services for SSECs. Based on this platform, the deployment of SSECs can be achieved and the following benefits obtained:
- Connectivity: As emphasized in this paper, connectivity is the most important element of a SEC platform. This paper presents an analysis of the interconnection between technology elements of a SEC. The system is designed to enhance the linkage of the entire energy system within the city through classification and analysis of the energy characteristics therein. The cyclic structure of the SEC platform is also shown, and it is considered possible to achieve sustainable development through a collaboration between researchers, operators, and users within the city.
- The rapid speed in which the platform can be developed and applied: The second important element of the SEC platform presented in this paper is rapid speed of development. The SEC platform is based on a complex top-down and bottom-up cyclic structure, and it is possible to create a SEC infrastructure rapidly in order to quickly provide an organized SEC through collaboration between various operators and users [9].
- Manufacturing process and cost effectiveness: Based on the combined top-down and bottom-up platform, it is possible to build mass-customization-based SEC infrastructure that is cost effective to implement and use [11]. Through an analysis of the links between software and hardware providers, it is expected that costs can be reduced by the mass-customization and manufacture of sensors and actuators. This would also enable small businesses and start-up companies, as well as large enterprises, to participate and achieve balanced economic development.
- Guidelines for pre-analyzing obstacles and risk management: Guidelines for applying services will be provided through physical and virtual simulations based on digital twin-based analysis and risk management of the SEC infrastructure [15].
6.2. Future Prospects
With respect to SSECs, the proposed 5-layer architecture will provide a platform to ensure sustainable development, rapid urban management [9], cost reductions [11], obstacle analysis, risk prevention [15], improved employment efficiency [52], and methods to provide an appropriate economic framework to accompany and facilitate the implementation of the model.
- Rapid urban establishment: Parker, Van Alstyne, and Choudary [9] pointed out that through platform, the development of smart and sophisticated IT technology can achieve speed and efficiency beyond time and space limitations. It is anticipated that the proposed top-down and bottom-up platform with a cyclic structure will contribute to the rapid and efficient construction of smart energy cities in the future.
- Obstacle analysis/risk prevention: This architecture ensures obstacle analysis/risk prevention by employing rapid and cost-effective measures prior to the building of SC, while also providing a preliminary analysis of the construction. Based on the digital twin, risk analysis and its prevention measures are taken into account in advance, and SC plans verified accordingly [15].
- Improved employment efficiency: Mass-customization of the proposed architecture makes it possible to construct smart systems specifically for domestic and industrial applications. This can reduce manufacturing costs and lead to the development of new industries. New small-scale localized start-ups and job opportunities [52] are expected in various domestic industries like information and communication technology (ICT)/IoT involving manufacturing, transportation, service industries, new HW/SW derivatives, and consulting.
Author Contributions
Architecture and System Design & Modeling: S.P. (Sanguk Park) and S.P. (Sangmin Park), Architecture and System Research: S.P. (Sehyun Park) and S.L., Editing: S.P. (Sangmin Park) and S.L., Supervision: S.P. (Sehyun Park), Project administration: S.P. (Sehyun Park).
Funding
This research received no external funding.
Acknowledgments
This work was supported by the Korea Institute of Energy Technology Evaluation and Planning (KETEP) and the Ministry of Trade, Industry and Energy (MOTIE) of the Republic of Korea (No. 20172010000470), and this research was supported by Chung-Ang University Research Scholarship Grants in 2018.
Conflicts of Interest
The authors declare no conflict of interest.
References
- McLaren, D.; Agyeman, J. Sharing Cities: A Case for Truly Smart and Sustainable Cities; MIT Press: Cambridge, MA, USA, 2015; ISBN 978-0-262-02972-8. [Google Scholar]
- Nielsen, P.S.; Amer, S.B.; Halsnæs, K. Definition of Smart Energy City and State of the Art of 6 Transform Cities Using Key Performance Indicators; 2013. Available online: https://orbit.dtu.dk/fedora/objects/orbit:126320/datastreams/file_384a28a6-01c9-4940-b04f-20558b2ebeb1/content (accessed on 2 February 2019).
- Defining a Smart Energy City. Available online: https://wsco-online.com/defining-a-smart-energy-city/ (accessed on 20 February 2017).
- Pezzutto, S.; Vaccaro, R.; Zambelli, P.; Mosannenzadeh, F.; Bisello, A.; Vettorato, D. FP7 SINFONIA project, Deliverable 2.1 SWOT analysis report of the refined concept/baseline (SINFONIA deliverables). Eur. Acad. Bolzano 2015. [Google Scholar]
- Höjer, M.; Wangel, J. Smart sustainable cities: Definition and challenges. In ICT Innovations for Sustainability; Springer: New York, NY, USA, 2015; pp. 333–349. ISBN 978-3-319-09227-0. [Google Scholar]
- Merriam-Webster. Available online: https://www.merriam-webster.com/dictionary/sustainable (accessed on 1 July 2019).
- Hayashi, Y.; Fujimoto, Y.; Ishii, H.; Takenobu, Y.; Kikusato, H.; Yoshizawa, S.; Amano, Y.; Tanabe, S.-I.; Yamaguchi, Y.; Shimoda, Y. Versatile Modeling Platform for Cooperative Energy Management Systems in Smart Cities. Proc. IEEE 2018, 106, 594–612. [Google Scholar] [CrossRef]
- Allam, Z.; Newman, P. Redefining the Smart City: Culture, Metabolism and Governance. Smart Cities 2018, 1, 4–25. [Google Scholar] [CrossRef] [Green Version]
- Parker, G.G.; Van Alstyne, M.W.; Choudary, S.P. Platform Revolution: How Networked Markets are Transforming the Economyand How to Make Them Work for You; WW Norton & Company: New York, NY, USA, 2016; ISBN 9780393249132. [Google Scholar]
- Shahidehpour, M.; Li, Z.; Ganji, M. Smart Cities for a Sustainable Urbanization: Illuminating the Need for Establishing Smart Urban Infrastructures. IEEE Electrif. Mag. 2018, 6, 16–33. [Google Scholar] [CrossRef]
- Park, S.; Park, S.; Byun, J.; Park, S. Design of a mass-customization-based cost-effective Internet of Things sensor system in smart building spaces. Int. J. Distrib. Sens. Netw. 2016, 12, 1550147716660895. [Google Scholar] [CrossRef]
- Krylovskiy, A.; Jahn, M.; Patti, E. Designing a smart city internet of things platform with microservice architecture. In Proceedings of the 2015 3rd International Conference on Future Internet of Things and Cloud, Rome, Italy, 24–26 August 2015; pp. 25–30. [Google Scholar]
- Mehmood, Y.; Ahmad, F.; Yaqoob, I.; Adnane, A.; Imran, M.; Guizani, S. Internet-of-things-based smart cities: Recent advances and challenges. IEEE Commun. Mag. 2017, 55, 16–24. [Google Scholar] [CrossRef]
- Komninos, N.; Bratsas, C.; Kakderi, C.; Tsarchopoulos, P. Smart city ontologies: Improving the effectiveness of smart city applications. J. Smart Cities 2015, 1, 31–46. [Google Scholar] [CrossRef]
- Boschert, S.; Rosen, R. Digital twin—The simulation aspect. In Mechatronic Futures; Springer: New York, NY, USA, 2016; pp. 59–74. ISBN 978-3-319-32154-7. [Google Scholar]
- Navidi, A.; Khatami, F.A.-S. Energy management and planning in smart cities. Cired-Open Access Proc. J. 2017, 2017, 2723–2725. [Google Scholar] [CrossRef]
- Ejaz, W.; Naeem, M.; Shahid, A.; Anpalagan, A.; Jo, M. Efficient energy management for the internet of things in smart cities. IEEE Commun. Mag. 2017, 55, 84–91. [Google Scholar] [CrossRef]
- Brundu, F.G.; Patti, E.; Osello, A.; Del Giudice, M.; Rapetti, N.; Krylovskiy, A.; Jahn, M.; Verda, V.; Guelpa, E.; Rietto, L. IoT Software Infrastructure for Energy Management and Simulation in Smart Cities. IEEE Trans. Ind. Inform. 2017, 13, 832–840. [Google Scholar] [CrossRef]
- Allam, Z.; Newman, P. Economically Incentivising Smart Urban Regeneration. Case Study of Port Louis, Mauritius. Smart Cities 2018, 1, 53–74. [Google Scholar] [CrossRef] [Green Version]
- Poole, D.L.; Mackworth, A.K.; Goebel, R. Computational Intelligence: A Logical Approach; Oxford University Press: New York, NY, USA, 1998; Volume 1, ISBN 978-0-19510-270-3. [Google Scholar]
- Kaplan, A.; Haenlein, M. Siri, Siri, in my hand: Who’s the fairest in the land? On the interpretations, illustrations, and implications of artificial intelligence. Bus. Horiz. 2019, 62, 15–25. [Google Scholar] [CrossRef]
- Khan, S.; Paul, D.; Momtahan, P.; Aloqaily, M. Artificial intelligence framework for smart city microgrids: State of the art, challenges, and opportunities. In Proceedings of the 2018 Third International Conference on Fog and Mobile Edge Computing (FMEC), Barcelona, Spain, 23–26 April 2018; pp. 283–288. [Google Scholar]
- Allam, Z. Achieving Neuroplasticity in Artificial Neural Networks through Smart Cities. Smart Cities 2019, 2, 118–134. [Google Scholar] [CrossRef] [Green Version]
- Allam, Z. The emergence of anti-privacy and control at the nexus between the concepts of safe city and smart city. Smart Cities 2019, 2, 96–105. [Google Scholar] [CrossRef]
- Zdraveski, V.; Mishev, K.; Trajanov, D.; Kocarev, L. Iso-standardized smart city platform architecture and dashboard. IEEE Pervasive Comput. 2017, 16, 35–43. [Google Scholar] [CrossRef]
- Sholla, S.; Naaz, R.; Chishti, M.A. Ethics aware object oriented smart city architecture. China Commun. 2017, 14, 160–173. [Google Scholar] [CrossRef]
- Ahlgren, B.; Hidell, M.; Ngai, E.C.-H. Internet of things for smart cities: Interoperability and open data. IEEE Internet Comput. 2016, 20, 52–56. [Google Scholar] [CrossRef]
- Pereira, J.; Ricardo, L.; Luís, M.; Senna, C.; Sargento, S. Assessing the reliability of fog computing for smart mobility applications in VANETs. Future Gener. Comput. Syst. 2019, 94, 317–332. [Google Scholar] [CrossRef]
- Postranecky, M.; Svitek, M.; Zambrano, E.C. SynopCity© Virtual HUB-A Testbed for Smart Cities. IEEE Intell. Transp. Syst. Mag. 2018, 10, 50–57. [Google Scholar] [CrossRef]
- Lv, Z.; Yin, T.; Zhang, X.; Song, H.; Chen, G. Virtual Reality Smart City Based on WebVRGIS. IEEE Internet Things J. 2016, 3, 1015–1024. [Google Scholar] [CrossRef]
- Prendinger, H.; Gajananan, K.; Zaki, A.B.; Fares, A.; Molenaar, R.; Urbano, D.; van Lint, H.; Gomaa, W. Tokyo virtual living lab: Designing smart cities based on the 3d internet. IEEE Internet Comput. 2013, 17, 30–38. [Google Scholar] [CrossRef]
- Mohammadi, N.; Taylor, J.E. Smart city digital twins. In Proceedings of the 2017 IEEE Symposium Series on Computational Intelligence (SSCI), Honolulu, HI, USA, 27 November–1 December 2017; pp. 1–5. [Google Scholar]
- Alptekinoğlu, A.; Corbett, C.J. Mass customization vs. mass production: Variety and price competition. Manuf. Serv. Oper. Manag. 2008, 10, 204–217. [Google Scholar] [CrossRef]
- Davis, S.M. Future perfect. In Human Resource Management in International Firms; Springer: New York, NY, USA, 1990; pp. 18–28. [Google Scholar]
- Pezzutto, S.; De Felice, M.; Fazeli, R.; Kranzl, L.; Zambotti, S. Status Quo of the Air-Conditioning Market in Europe: Assessment of the Building Stock. Energies 2017, 10, 1253. [Google Scholar] [CrossRef]
- Ürge-Vorsatz, D.; Cabeza, L.F.; Serrano, S.; Barreneche, C.; Petrichenko, K.J.R.; Reviews, S.E. Heating and cooling energy trends and drivers in buildings. Renew. Sustain. Energy Rev. 2015, 41, 85–98. [Google Scholar] [CrossRef] [Green Version]
- Heating & Cooling. Available online: https://www.irena.org/heatingcooling (accessed on 31 January 2018).
- Pezzutto, S.; Fazeli, R.; De Felice, M.; Sparber, W. Future development of the air-conditioning market in Europe: An outlook until 2020. Wiley Interdiscip. Rev. Energy Environ. 2016, 5, 649–669. [Google Scholar] [CrossRef]
- Santamouris, M. Cooling the cities—A review of reflective and green roof mitigation technologies to fight heat island and improve comfort in urban environments. Sol. Energy 2014, 103, 682–703. [Google Scholar] [CrossRef]
- Norton, B.A.; Coutts, A.M.; Livesley, S.J.; Harris, R.J.; Hunter, A.M.; Williams, N.S.G. Planning for cooler cities: A framework to prioritise green infrastructure to mitigate high temperatures in urban landscapes. Landsc. Urban Plan. 2015, 134, 127–138. [Google Scholar] [CrossRef]
- How Cities Are Getting Smart Using Artificial Intelligence. Available online: https://www.forbes.com/sites/tomvanderark/2018/06/26/how-cities-are-getting-smart-using-artificial-intelligence/amp/ (accessed on 26 Jun 2018).
- Fukumizu, K. Geometry of neural networks: Natural gradient for learning. In Handbook of Biological Physics; Elsevier: Amsterdam, The Netherlands, 2001; Volume 4, pp. 731–769, 1383–8121. [Google Scholar]
- Payback Period, Investopedia. Available online: https://www.investopedia.com/terms/p/paybackperiod.asp (accessed on 20 May 2019).
- Ministry of Land, Infrastructure and Transport. Available online: http://www.molit.go.kr/portal.do (accessed on 1 February 2017).
- STATISTICS KOREA. Available online: http://www.index.go.kr/potal/main/EachDtlPageDetail.do?idx_cd=1226 (accessed on 1 January 2019).
- Power Data Open Potal System. Available online: http://home.kepco.co.kr/kepco/BD/BDBAPP001/BDBAPP001.do?menuCd=FN33020101#clickExcel (accessed on 1 October 2018).
- Byun, J.; Park, S.; Kang, B.; Hong, I.; Park, S. Design and implementation of an intelligent energy saving system based on standby power reduction for a future zero-energy home environment. IEEE Trans. Consum. Electron. 2013, 59, 507–514. [Google Scholar] [CrossRef]
- Kim, J.; Byun, J.; Jeong, D.; Choi, M.-I.; Kang, B.; Park, S. An IoT-based home energy management system over dynamic home area networks. Int. J. Distrib. Sens. Netw. 2015, 11, 828023. [Google Scholar] [CrossRef]
- Byun, J.; Park, S. Development of a self-adapting intelligent system for building energy saving and context-aware smart services. IEEE Trans. Consum. Electron. 2011, 57, 90–98. [Google Scholar] [CrossRef]
- Høj, J.; Juhl, L.; Lindegaard, S. V2G—An Economic Gamechanger in E-Mobility? World Electr. Veh. J. 2018, 9, 35. [Google Scholar] [CrossRef]
- Liu, Y.; Yang, C.; Jiang, L.; Xie, S.; Zhang, Y. Intelligent Edge Computing for IoT-Based Energy Management in Smart Cities. IEEE Netw. 2019, 33, 111–117. [Google Scholar] [CrossRef]
- Lee, J.; Kee, C.J.; Kim, D.; Kim, C.; Choi, J.; Lee, D. SW Convergence Strategy in Manufacturing/Service Industry: Software and Systems Product Line (SSPL). J. Inf. Technol. Serv. 2012, 11, 295–308. [Google Scholar] [CrossRef]
Figure 1.
Future sustainable smart energy city (SSEC).

Figure 2.
Layering architecture of physical sustainable smart energy city (SSEC) platform.

Figure 3.
5-layer architecture-based SSEC physical/virtual platform architecture.

Figure 4.
Cyclic structure of SSEC platform.

Figure 5.
Overview of physical/virtual platform.


Figure 7.
Sustainable energy city (SEC) architecture.

Figure 8.
Artificial Intelligence (AI)-based optimal management in the SSEC.

Figure 9.
Schematic representation of physical connection scenarios.

Figure 10.
Schematic representation of total connection scenarios.

Figure 11.
Smart clean zero energy city platform and scenario flow chart.

Figure 12.
Collaborative energy robotics-based smart energy prosumer platform.

Figure 13.
Economic graph for smart system application.

Figure 14.
Expected cost saving graph due to installation of smart system (trillion KRW).

Figure 15.
Economic analysis of smart system application based on SSEC platform (trillion KRW).


Table 1.
Summary of related works and analysis of novelty between each paper * Category (SO: Social, T: Technical, EC: Economical, S: Sustainability, P: Integrated Platform, A: AI, DS: Digital-twin/Simulation, E: Energy Efficiency, L: Low-cost).
Table 1.
Summary of related works and analysis of novelty between each paper * Category (SO: Social, T: Technical, EC: Economical, S: Sustainability, P: Integrated Platform, A: AI, DS: Digital-twin/Simulation, E: Energy Efficiency, L: Low-cost).
| Author(s) | Description | Purpose | Category | Novelty (Keywords) | |||||
|---|---|---|---|---|---|---|---|---|---|
| SO | T | EC | |||||||
| S | P | A | DS | E | L | ||||
| Navidi, A. et al. (2017) | Energy management and planning in smart cities | Energy consumption model planning in smart cities | √ | √ | √ | Energy efficiency model | |||
| Ejaz, W. et al. (2017) | Efficient energy management for the internet of things in smart cities | IoT-based EMS for smart cities | √ | IoT-based EMS | |||||
| Brundu, F.G. et al. (2017) | IoT software infrastructure for energy management and simulation in smart cities | IoT based simulation for smart cities | √ | √ | IoT-based simulation | ||||
| Allam, Z. et al. (2018) | Economically incentivising smart urban regeneration | Propose a smart urban regeneration model | √ | √ | √ | Smart urban regeneration model | |||
| Hayashi, Y. et al. (2018) | Versatile modeling platform for cooperative energy management systems in smart cities | Modeling a platform including cooperative EMSs | √ | √ | √ | Platform-based smart cities | |||
| Khan, S. et al. (2018) | Artificial intelligence framework for smart city microgrids | Scalable deep-learning based framework in microgrid | √ | √ | √ | √ | Scalable framework | ||
| Allam, Z. (2019) | Achieving neuroplasticity in artificial neural networks through smart cities | Artificial neural networks based smart city modeling | √ | √ | √ | AI-based smart city modeling | |||
| Shahidehpour, M. et al. (2018) | Smart cities for a sustainable urbanization | Illuminating the need for establishing smart urban infrastructures | √ | √ | √ | Sustainable smart city | |||
| Zdraveski, V. et al. (2017) | Iso-standardized smart city platform architecture and dashboard | Smart city platform architecture and dashboard | √ | √ | User friendly dashboard | ||||
| Sholla, S. et al. (2017) | Ethics aware object-oriented smart city architecture | Object-oriented layered architecture | √ | √ | Socio-cultural and ethical aspects | ||||
| Ahlgren, B. et al. (2019) | Internet of things for smart cities: interoperability and open data | IoT for smart cities with interoperability and open data | √ | √ | Interoperability for smart cities | ||||
| Postranecky, M. et al. (2014) | Virtual HUB-A testbed for smart cities | Framework of a platform for smart cities | √ | √ | Platform-based smart cities | ||||
| Lv, Z. et al. (2016) | Virtual reality smart city based on WebVRGIS | VR based simulation system for smart city | √ | √ | VR-based simulation | ||||
| Prendinger, H. et al. (2013) | Designing smart cities based on the 3D internet | 3D internet-based smart cities simulation | √ | 3D smart cities simulation | |||||
| Mohammadi, N. et al. (2017) | Smart city digital twins | Provide predictive insights by digital twins in smart city | √ | Digital-twins based smart city modeling | |||||
| Proposed paper (AI-based physical and virtual platform with 5-layered architecture for sustainable smart energy city development) | √ | √ | √ | √ | √ | √ | Integrated platform | ||
Table 2.
Statistics relating to building types in Korea (1000 ).
| Classification | 2017 | |||||
|---|---|---|---|---|---|---|
| Total | Residential | Commercial | Industrial | Educational/Social | Others | |
| Total | 7,126,526 | 4,612,604 | 1,246,859 | 309,519 | 191,739 | 765,805 |
| % | 100 | 65 | 18 | 4 | 3 | 11 |
| Area of the Buildings | 3,641,993 | 2,357,098 | 637,349 | 158,062 | 97,970 | 391,514 |
Table 3.
Estimated average cost of smart building system (module).
| Classification | Configuration | Device/Module | Estimated Price (KRW) |
|---|---|---|---|
| Sensor | Temperature Sensor | High-precision humidity sensor/communication support | 25,000 |
| Humidity Sensor | |||
| Motion Sensor | Radar or infrared/communication support | 30,000 | |
| Gas Sensor | CO2 gas or flammable gas sensor | 15,000 | |
| IoT Development board | Beacon module, Communication module, Power module, Management module | Linux embedded development board (Raspberry Pi 3) | 45,000 |
| Other | Battery | Lithium polymer based on 10,000 mAh | 20,000 |
| Case | Aluminum case | 20,000 | |
| Other materials | Sensor PCB, LED, etc. | 15,000 | |
| Total Expected IoT sensor system cost | 170,000 | ||
Table 4.
The range (area) of operation of one IoT sensor system.
| Classification | Residential | Commercial | Industrial | Educational/Social | Others |
|---|---|---|---|---|---|
| Area (m2) | 20 | 30 | 60 | 30 | 40 |
Table 5.
Number of IoT sensor systems (1000 ).
| Classification | Sum | Residential | Commercial | Industrial | Educational/Social | Others |
|---|---|---|---|---|---|---|
| Area | 3,641,993 | 2,357,098 | 637,349 | 158,062 | 97,970 | 391,514 |
| Number of IoT Systems | 154,787,737 | 117,854,898 | 21,244,959 | 2,634,375 | 3,265,654 | 9,787,856 |
Table 6.
Number of devices
| Classification | Sum | Residential | Commercial | Industrial | Educational/Social | Others |
|---|---|---|---|---|---|---|
| Total number of buildings | 7,126,526 | 4,612,604 | 1,246,859 | 309,519 | 191,739 | 765,805 |
| Average Number of Devices | - | 26 | 17 | 9 | 17 | 13 |
| Number of Devices | 79,096,534 | 60,223,851 | 10,856,174 | 1,346,166 | 1,668,749 | 5,001,595 |
Table 7.
Electricity usage in October 2018 in Korea (KRW).
| Classification | Number of Customers | Electricity Usage | Electricity Cost |
|---|---|---|---|
| Street lamp | 1,911,808 | 304,477,507 | 33,663,433,372 |
| Education | 20,986 | 528,152,156 | 50,322,575,003 |
| Agricultural | 1,764,578 | 1,216,707,442 | 60,752,904,386 |
| Industrial | 420,076 | 24,087,789,722 | 2,226,143,945,153 |
| Normal | 804,166 | 498,712,119 | 28,381,961,421 |
| Standard | 3,157,320 | 8,055,963,989 | 955,703,815,963 |
| Residential | 15,271,199 | 5,285,672,914 | 518,092,390,863 |
| Sum | 23,350,133 | 39,977,475,849 | 3,873,061,026,161 |
Table 8.
Economic analysis of smart system application to domestic buildings.
| Classification | Unit | Contents |
|---|---|---|
| Smart System Installing Cost in all buildings in Korea (SSIC) | trillion KRW | 17.86 |
| Electricity fee for one year | trillion KRW | 19 |
| Energy saving rate due to installation of smart system | % | 11 |
| Additional Energy saving variation rate due to AI-based smart system | % | 2 |
| Expected Cost Saving through System installation (ECSS) | trillion KRW | 2.09 |
| V2G/EV Supply and Installation Costs (VSIC) | trillion KRW | 1.38 |
| Expected Cost Saving due to installation of V2G/EV (ECSV) [50] | trillion KRW | 0.01136 |
| System performance degradation rate | % | 5 |
| System Maintenance rate | % | 3 |
| Cost saving rate due to proposed architecture [11] | % | 15.9 |
| Expected Cost Saving through Proposed architecture (ECSP) | trillion KRW | 2.83 |
© 2019 by the authors. Licensee MDPI, Basel, Switzerland. This article is an open access article distributed under the terms and conditions of the Creative Commons Attribution (CC BY) license (http://creativecommons.org/licenses/by/4.0/).
Share and Cite
MDPI and ACS Style
Park, S.; Lee, S.; Park, S.; Park, S. AI-Based Physical and Virtual Platform with 5-Layered Architecture for Sustainable Smart Energy City Development. Sustainability 2019, 11, 4479. https://0-doi-org.brum.beds.ac.uk/10.3390/su11164479
AMA Style
Park S, Lee S, Park S, Park S. AI-Based Physical and Virtual Platform with 5-Layered Architecture for Sustainable Smart Energy City Development. Sustainability. 2019; 11(16):4479. https://0-doi-org.brum.beds.ac.uk/10.3390/su11164479
Chicago/Turabian StylePark, Sanguk, Sanghoon Lee, Sangmin Park, and Sehyun Park. 2019. "AI-Based Physical and Virtual Platform with 5-Layered Architecture for Sustainable Smart Energy City Development" Sustainability 11, no. 16: 4479. https://0-doi-org.brum.beds.ac.uk/10.3390/su11164479
Note that from the first issue of 2016, this journal uses article numbers instead of page numbers. See further details here.