Landfill Site Selection Using MCDM Methods and GIS in the Sulaimaniyah Governorate, Iraq
by
 ,
,
Karwan Alkaradaghi
1,2,3, 
Salahalddin S. Ali
2,4,5,
Nadhir Al-Ansari
1,* ,
,
Jan Laue
1 and
Ali Chabuk
1 1
Department of Civil, Environmental and Natural Resources Engineering, Lulea University of Technology, 97187 Lulea, Sweden
2
Department of Geology, College of Science, Sulaimani University, Sulaimaniyah 460013, Iraq
3
Kurdistan Institution for Strategic Studies and Scientific Research, Sulaimaniyah 460013, Iraq
4
Komar University of Science and Technology, Sulaimaniyah 460013, Iraq
5
Komar Research Center, Sulaimaniyah 460013, Iraq
*
Author to whom correspondence should be addressed.
Sustainability 2019, 11(17), 4530; https://0-doi-org.brum.beds.ac.uk/10.3390/su11174530
Submission received: 22 July 2019
/
Revised: 13 August 2019
/
Accepted: 17 August 2019
/
Published: 21 August 2019
(This article belongs to the Special Issue Environmental Behaviour and Collective Decision Making)
Abstract
:A shortage of land for waste disposal is one of the serious problems that faces urban areas in developing countries. The Sulaimaniyah Governorate, located in the north of Iraq, is one of the major cities in the Kurdistan Region of the country, covering an area of 2400 km2 with a population of 856,990 in 2016. Currently, there is no landfill site in the study area that meets scientific and environmental criteria, and inappropriate solid waste dumping is causing negative environmental impacts. The process of landfill site selection is considered a complex process and is restricted by numerous factors and regulations. This paper proposes multi-criteria decision-making (MCDM) methods in a model for landfill site decision. The model assumes the input of two groups of factors that need to satisfy the optimal values of weight coefficients. These groups of constants are natural factors and artificial factors, and they included thirteen selected criteria: slope, geology, land use, urban area, villages, rivers, groundwater, slope, elevation, soil, geology, road, oil and gas, land use, archaeology and power lines. The criteria were used in the geographic information system (GIS), which has a high capacity to process and analyze various data. In addition, multi-criteria decision-making (MCDM) methods followed by the weighted linear combination (WLC) method were used to derive criteria weightings using a matrix of pair-wise comparison. Finally, all the multi criteria decision methods were combined to obtain an intersection of the suitability index map for candidate landfill sites. Seven appropriate sites for landfill were suggested, all of which satisfied the scientific and environmental criteria which were adopted in this study.
1. Introduction
Municipal solid waste (MSW) is the main by-product of urban life. Approximately 3.5 million tons of MSW are generated daily on a global scale [1]. Population growth, improving standards of living after economic recovery, and industrial activities are all major reasons for a significant increase in solid waste quantity output in urban areas [2].
The problem of solid waste is very serious in developing countries. About 80% of the world population are living in these countries [3]. Due to the situation of these countries, such waste is affecting humans and their environment. For this reason, legislations and laws have been developed since the mid-twentieth century to ensure sustainable development and management of waste in a prudent manner to minimize the effect on human and environment [4]. This article offers a method that can be used easily to select the most suitable site for solid waste landfill. Selecting the site using this technique will help to overcome all negative outcomes on human and environment.
The Governorate of Sulaimaniyah has undergone fast urban growth in the last two decades [5] and the quantity of waste generation has also risen at a high pace along with fast urbanization [1,4]. This has caused negative impacts on the environment [6,7], not least because there is no available landfill site that fulfils the necessary scientific and environmental requirements. A further significant impact from poor solid waste management planning in the study area arises from disposal sites, with the total solid waste collected by the municipality being dumped, untreated, near the Tanjaro River close to the Sulaimaniyah city. The cumulative solid waste quantity exceeds the capacity of municipal authority management options, resulting in a potentially adverse impact on the environment, human health, and the quality of urban life [6,8]. Thus, the selection of suitable landfill sites is crucial for sustainable urban development. It is very important to suggest a landfill site, even in countries that recycle or combust of their waste for environmental protection [9,10].
Multi-criteria decision-making (MCDM) and GIS have been used widely in various fields and for different applications, including the possibility of groundwater pollution [11], land evaluation for peri-urban agriculture [12], soil environment [13], hospital site selection and urban planning [14].
In the literature, the Analytical Hierarchy Process (AHP) has been frequently used to assess the weights of prospective variables, and a combination of GIS software and AHP have been used by many scientists to select appropriate landfill sites among many candidate locations [15,16,17,18,19,20,21,22,23,24,25,26].
The purpose of this article is to establish an appraisal blueprint to identify appropriate locations for waste landfill site selection using the Geographic Information System (GIS) incorporated with multi-criteria decision analysis. GIS has almost become an integral tool for making good decisions on the selection of landfill site [27]. Therefore, to achieve the research objective, important criteria were considered that influenced the environment and waste management as a dataset for the decision model.
In this study, the weight of each influencing factor was determined by the analytic hierarchy process (AHP), straight rank sum (SRS), ratio scale weighting (RSW), and simple additive weighting (SAW) methods; all models combined manage large complex data and achieve a robust result for a suitable landfill site decision. Furthermore, the geographic information system GIS technique is used for spatial data to manage the considerable amount of data from various sources efficiently in a short time and at a lesser cost, and this model can be used to analyze the natural and artificial factors that impact the environment during landfill site selection [10,23,28].
The selection method for a landfill site was established using the following sequential steps: evaluating categories so as to accord them a suitable weighting in the digital boundary map framework; identifying the final landfill location map using the special analysis tool in GIS: excluding restricted and unsuitable areas as sites for landfill to simplify the selection process of candidate locations [26,29].
The objective of this research is to identify the most appropriate landfill site in the Governorate of Sulaymaniyah using important criteria that correspond to scientific and environmental standards.
2. Study Area
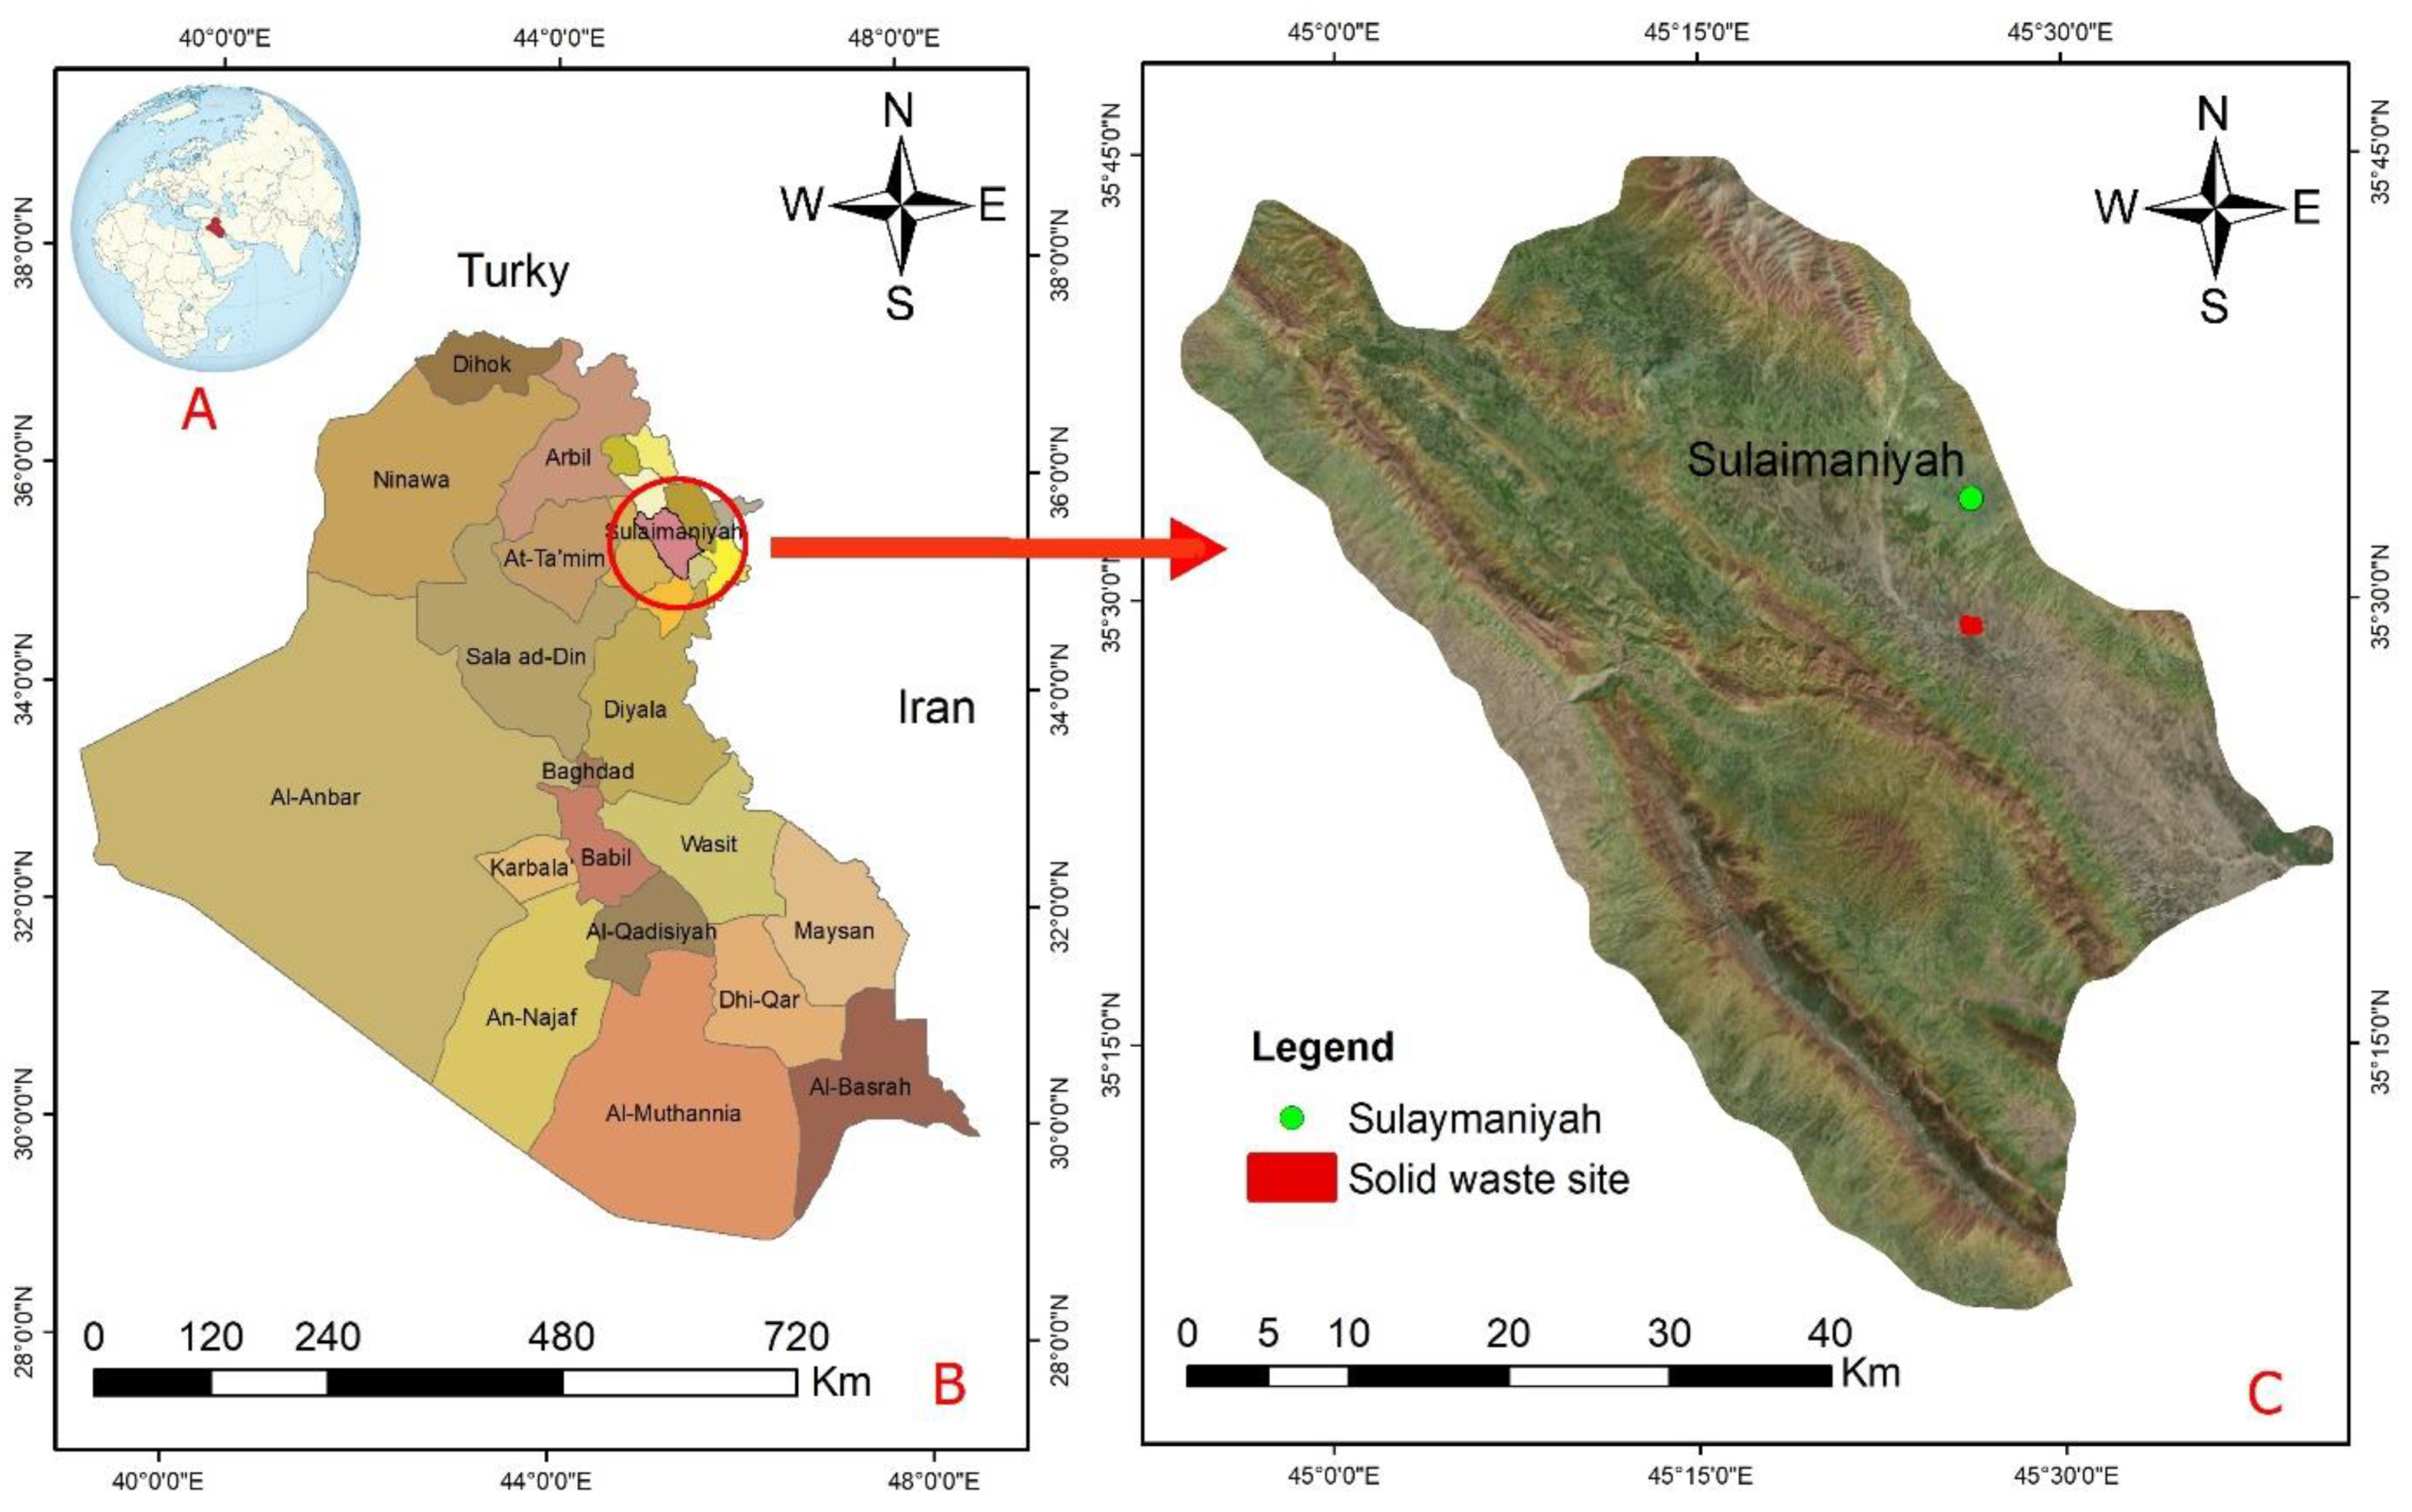
Sulaimaniyah is among the major cities in the region of Kurdistan and Iraq [30]. It is located between latitude 35°15′0′′ N and 35°45′0′′ N and longitude 45°0′0′′ E and 45°30′0′′ E, approximately 370 km north east of Baghdad, Iraq’s capital. The city is situated in low-lying land covering an area of around 2400 km2 and is bounded in the north by Goizha Mountain and the south by Qaradagh Mountain. The research region is distinguished by a separate Mediterranean-type continental interior climate with annual average precipitation varying from (500 to 700) mm. The Sulaimaniyah governorate had a population of about 856,990 inhabitants in 2016 [31]. The administrative boundary unit of the Sulaimaniyah governorate is shown in Figure 1 [32].
3. Materials and Methods
To present a suitable site selection landfill map, spatial analysis tools in GIS were used to prepare thirteen different criteria as layers covering the study area, with each criterion consisting of a database of a digital map prepared within GIS. All processed datasets used to input the AHP model of landfill dumpsite followed these principal steps:
- Development of a digital GIS database (spatial information) and creation of mapping limitations using regions of exclusion.
- Creating appropriate buffer zones or special limitations around significant regions to fit each criterion map.
- Using MCDA models to specify the most preferred alternative and determine each criterion weighting according to the priority of the study objective.
- Weightings of sub-criteria based on literature, expert opinion, environmental guidelines and regulations.
- Overlap of all weighted criteria resulted from (AHP, SRS, RSW and SAW) methods in GIS to prepare a suitable index map and indicate the priority for optimizing sites for landfill siting.
3.1. The Hierarchical Scheme for Landfill Siting
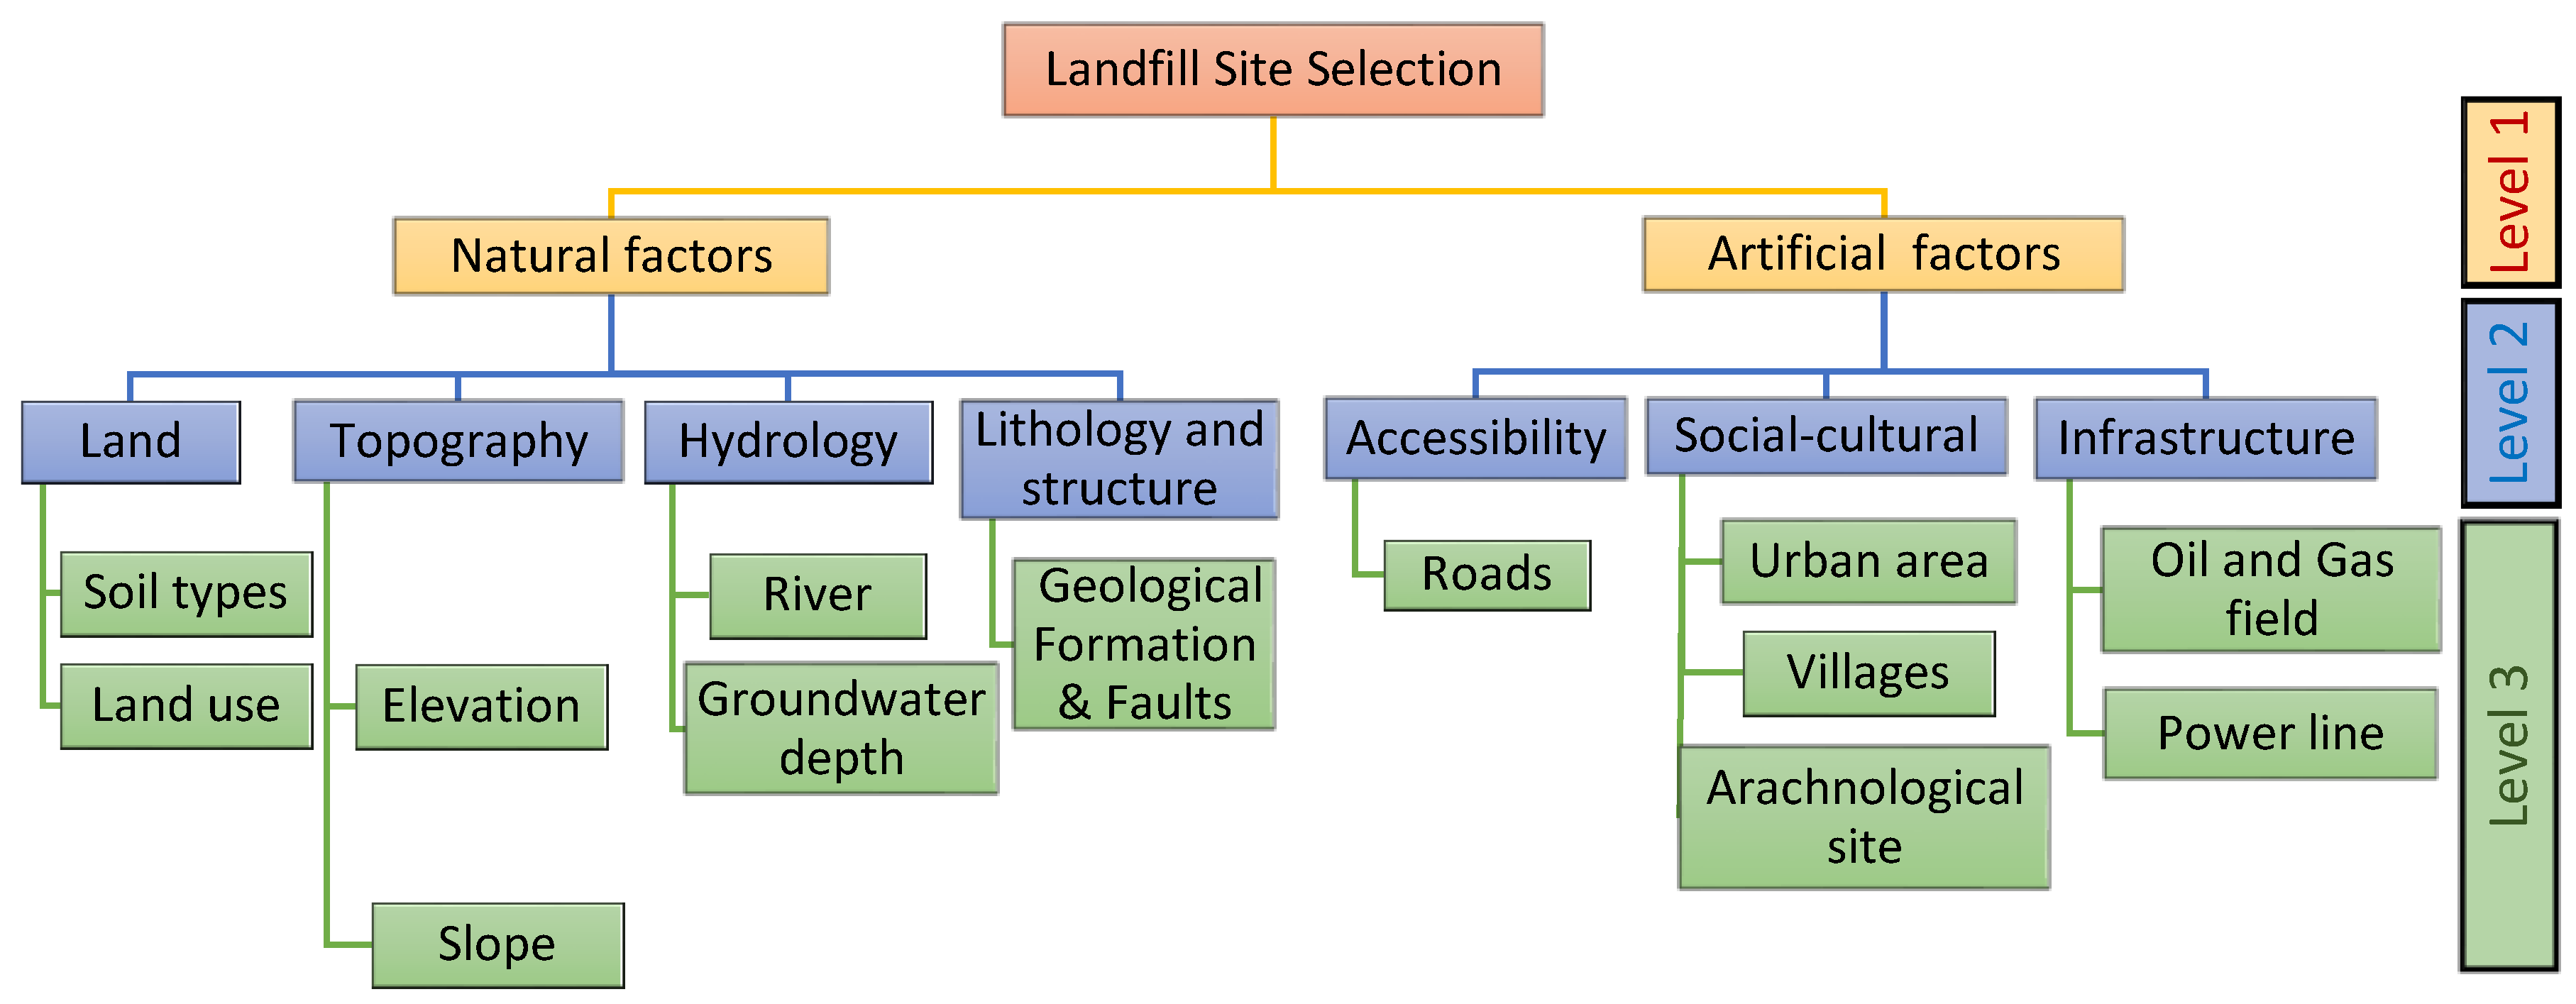
The hierarchical framework for decision-making was based on expert views in multi-criteria analysis, prior research and available information in the study area [33]. The hierarchical scheme of the site selection involves three levels as presented in Figure 2.
The first level in the proposed model represents identification of the factors affecting the potential landfill site model, which consists of two categories: natural environmental factors, and artificial factors. The second level contains six primary criteria: land, topographical, hydrological, geology, infrastructure, accessibility and social-cultural factors. The third level involves all thirteen criteria that were used in the present research to determine suitable sites as the optimum solution for landfill solid waste disposal.
The hierarchical scheme was designed according to the relations between each criterion and the decision process for landfill site selection.
The “river” criterion was adopted in order to protect surface water from organic, inorganic and microbial pollutants and contamination from leachate leaking from the solid waste landfill, which is a very common phenomenon in rapidly developing countries [34,35]. Distances from roads to the selected landfill location must ensure proximity to the road network with a view to facilitating transport and thus reducing the relative costs. Moreover, access to a landfill site should be adequate to ensure that the aesthetics of the region are not adversely affected [16,36]. The criterion of topography (elevation) was selected in respect of the risk of flooding in the area [37]. Steep slopes would make it difficult to transport the waste to the site and cause leachate drainage into flat regions and water bodies that cause contamination, while slopes that are too flat would affect the runoff drainage [16,23,38].
For the “urban area” criterion, an approximate distance of solid waste sites depends on many factors, such as governmental regulations and environment suggestions from scientists. Generally, the approximate distance should be appropriate for urban planning and potential future expansion, as well as ensuring impacts on public health, the aesthetic aspect of the city. Furthermore, a landfill site should be at a proper distance from the boundaries of urban regions due to the economic factors of the transport costs [18,39,40,41].
The “soil” criterion was used to preserve the study region from contamination by leachate transportation through the unsaturated zone within soil layers. The soil of the study area consists of four types of soil which are known as alluvial and recent deposits [42,43].
The “power lines” criterion was selected to prevent any danger to and from high voltage power lines and to ensure minimal disruption to the infrastructure near the solid waste site [44]. The “archaeological” criterion is the national cultural heritage, which includes numerous archeological and historical sites. In the current study, the criteria “oil and gas field” were adopted to protect important infrastructure, which is considered the most valuable source of national wealth [45,46].
“Geological formations” describes the outcropped and subsurface lithology. In the current study, this criterion was adopted to protect the study area from geological hazards by understanding the engineering properties of the formations for settlement and other large structure building and by finding economic and valuable formations like groundwater and oil accumulation, together with raw material for cement, gypsum and aggregates [42].
The “land use” criterion was adopted according to the land use classification and land specification due to priority of land use and the distance between the disposal site and factories, pasture and forests, also considering the cost of unused land and ownership of agriculture land [5].
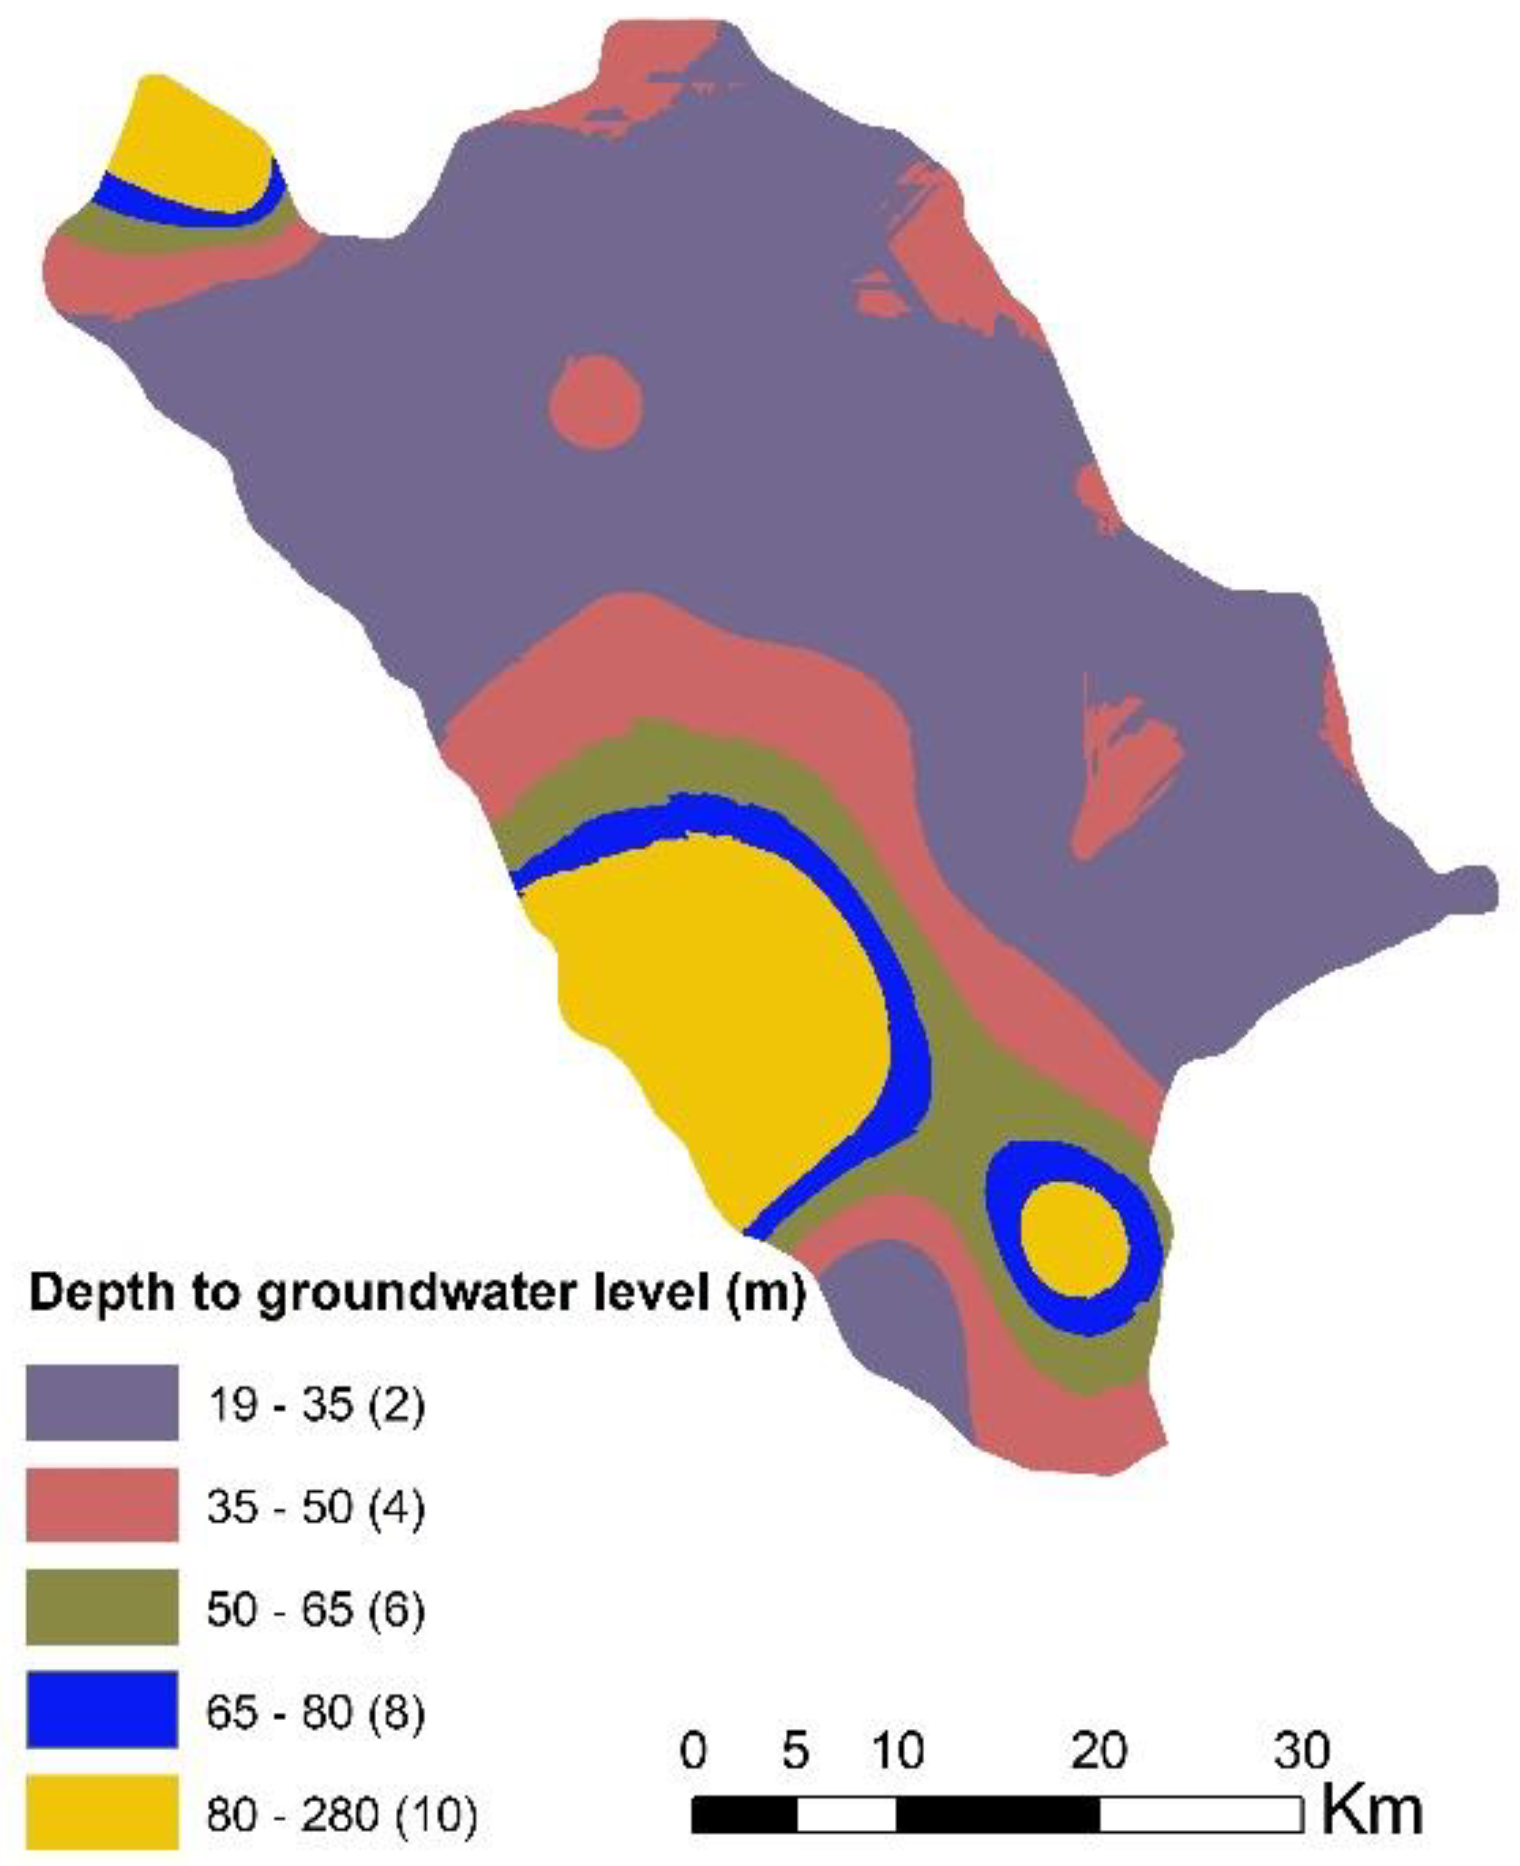
Groundwater ranges in depth from 19 to 280 m below the ground surface in most regions of the Sulaimaniyah Governorate. The landfill location should be located in an area with a deep groundwater depth in order to decrease the risk of leachate from solid waste and protect water aquifers from pollution [18,34].
3.2. Dataset Criteria Map
In this study, thirteen data sets obtained from international organizations and various government sources were used as input parameters for AHP modelling. The first source is available government data, including urban area, archaeological sites, power lines, oil and gas fields, villages, soil and geological formations. These digital data were converted into format files using GIS.
The river, road, and elevation data from the United States Geological Survey USGS Earth Explorer and the elevation map were downloaded as a digital elevation model that was converted to a slope map. The source of the data is presented in Table 1.
Water level depth data was obtained from the Sulaymaniyah groundwater authority, and 235 wells were added to GIS using the spatial analysis tools “Kriging” to create a map of the groundwater table in the Sulaymaniyah Governorate. The land use classification was prepared using satellite data and processed by remote sensing software (ENVI 5.4).
3.3. Criteria Restriction
Specific geographic features created using buffer zones around each criterion using GIS spatial analysis tools. A buffer zone is a neutral area that can be separated by grade to decrease or eliminate the impact of land use practices on delicate regions or natural characteristics. To determine the minimum and maximum distance from landfill locations, each criterion should be characterized by the recommended distance according to the potential environmental risks, human health and excess cost, and by taking into account the requirements of government regulations [47,48]. As shown in Table 2, the buffer areas were created at a distance from each feature to the required criteria based on a literature review.
3.4. Sub-Criteria Rating Values
Each criterion was classified into sub-criteria in this research and assigned a suitability rating value from zero to ten [58]. Due to the associated legislation, limitations and regulations, the criteria and variables are determined and assessed for their suitability for the research region, together with experience, information from literature reviews and scientific experts in this field. This was done in order to collect more information about category priorities for the study area and to rate the categories’ importance in respect of solid waste site selection.
A number of steps were followed to evaluate the rating value for each criterion and sub-criteria using the GIS spatial analysis tools in a sequence (Buffer, Clip, Extract, Overlay, Proximity, Convert, Reclassify and Map Algebra). Sub-criteria buffer zone and rating values for the input layer are shown in Table 3.
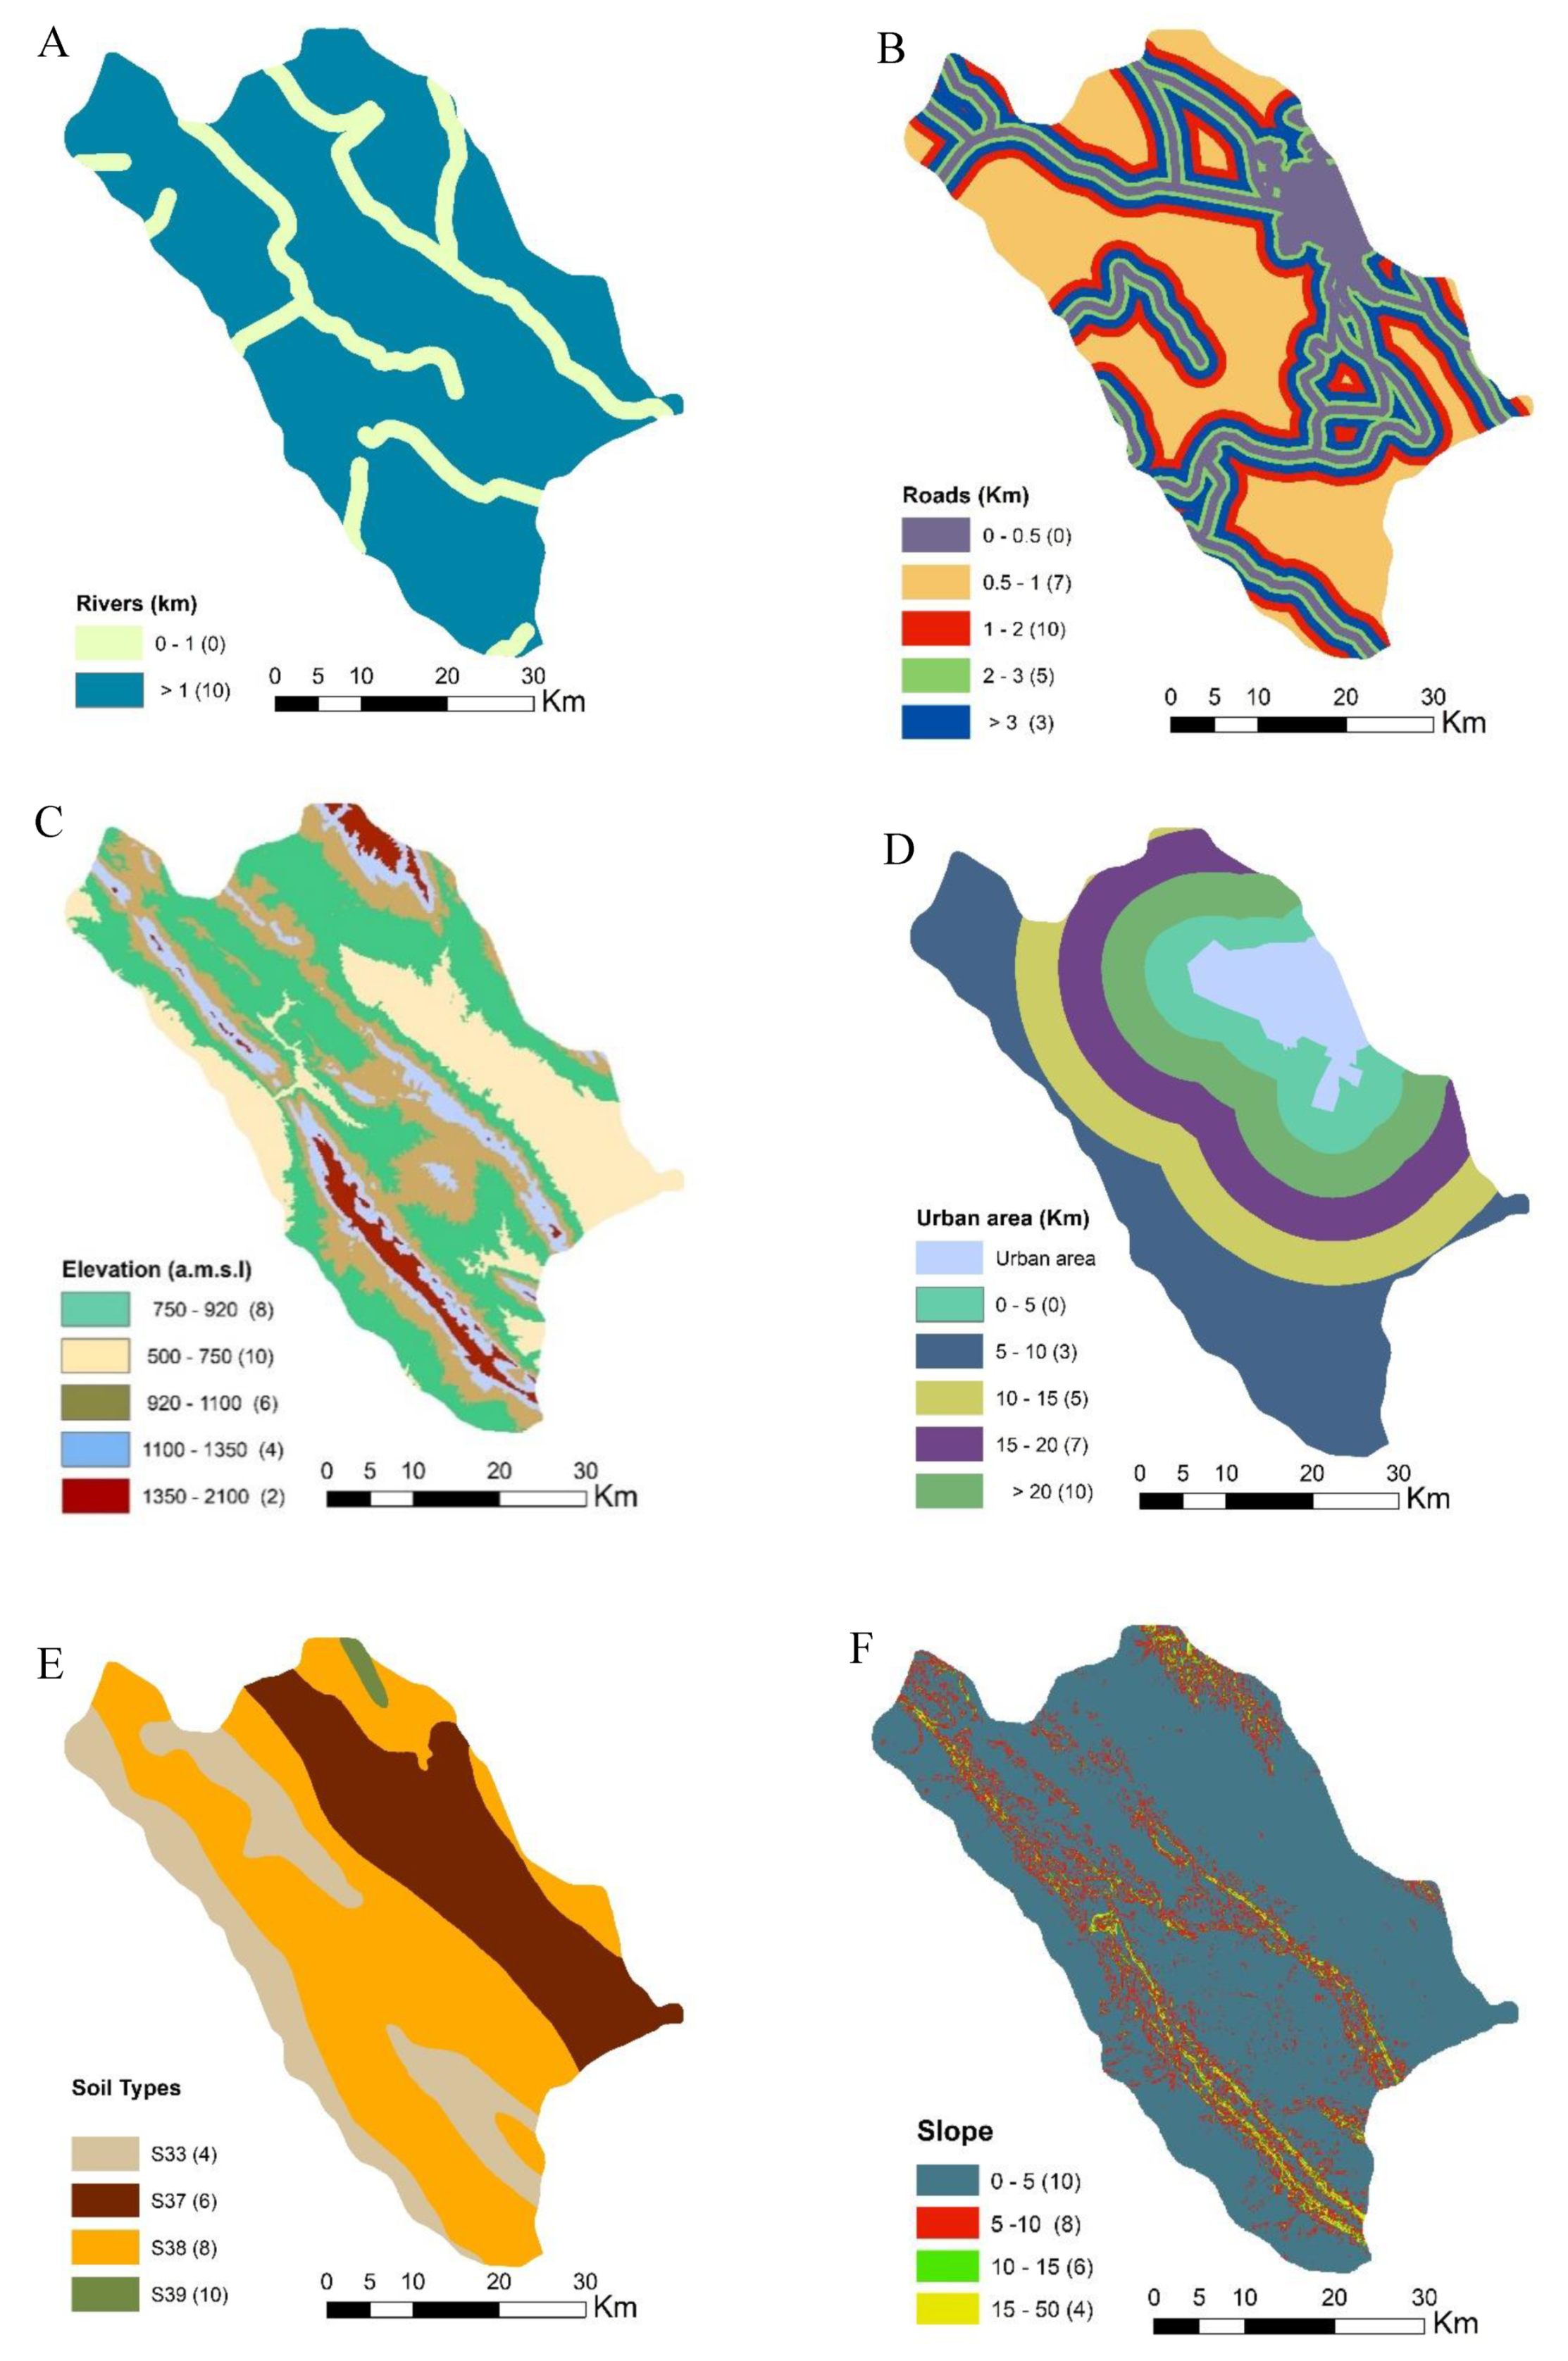
In this revise, a distance of less than 1000 m from the boundaries of a river was given a rating value of 0 to reduce the potential for river contamination from landfill, and a rating value of 10 was provided at distances higher than 1000 m (Figure 3A). Main roads and highways were integrated into the “roads” criterion. The greatest score of 10 was allocated to buffer areas from roads to landfill locations of 1000–2000 m. Buffer zones of less than 500 m and those of more than 3000 m were given grades of 0 and 3, respectively. Buffer areas of 500–1000 m were allocated a grade of 7 depending on the aesthetic effects on the region, while buffer zones of 2000–3000 m were given a grade of 5 to reduce transportation costs (Figure 3B).
For the elevation layer, the digital elevation model in the form of the raster elevation map was divided into five categories due to the study area altitude, whereby 1350–2100, 1100–1350, 920–1100, 750–920 and 500–750 above mean sea level (a.m.s.l.) were given ratings of 2, 4, 6, 8 and 10, respectively. In this research, appropriate elevations for the selection of landfill sites were given grading values of 8 and 10 (Figure 3C).
The layer “urban area” criterion was classified into five categories. Buffer zones of more than 20 km were given the highest score of 10. Buffer zones of 15–20 km, 10–15 km, 5–10 km and less than 5 km were given the scores of 7, 5, 3 and 0, respectively (Figure 3D). Cover soil in the Sulaimaniyah government is classified into four types of soil. These soil groups are (S33), consisting of Brown Soil, Medium and Shallow Phase over “Bakhtyary Gravel,” (S37), consisting of Chestnut Soil, Deep phase, (S38), consisting of Rough Broken and Stony Land, and (S39), defined as Rough Mountainous Land. These soil types were ratings of 4, 6, 8 and 10 respectively (Figure 3E).
Four categories have been identified for Land Slope, less than 5°, 5–10°, 10–15° and 15–50°, and these were given ratings of 10, 8, 6 and 4 respectively. According to the literature, less than 5° is considered the best slope for landfill locations to avoid the transportation of waste leachate to adjacent areas (Figure 3F).
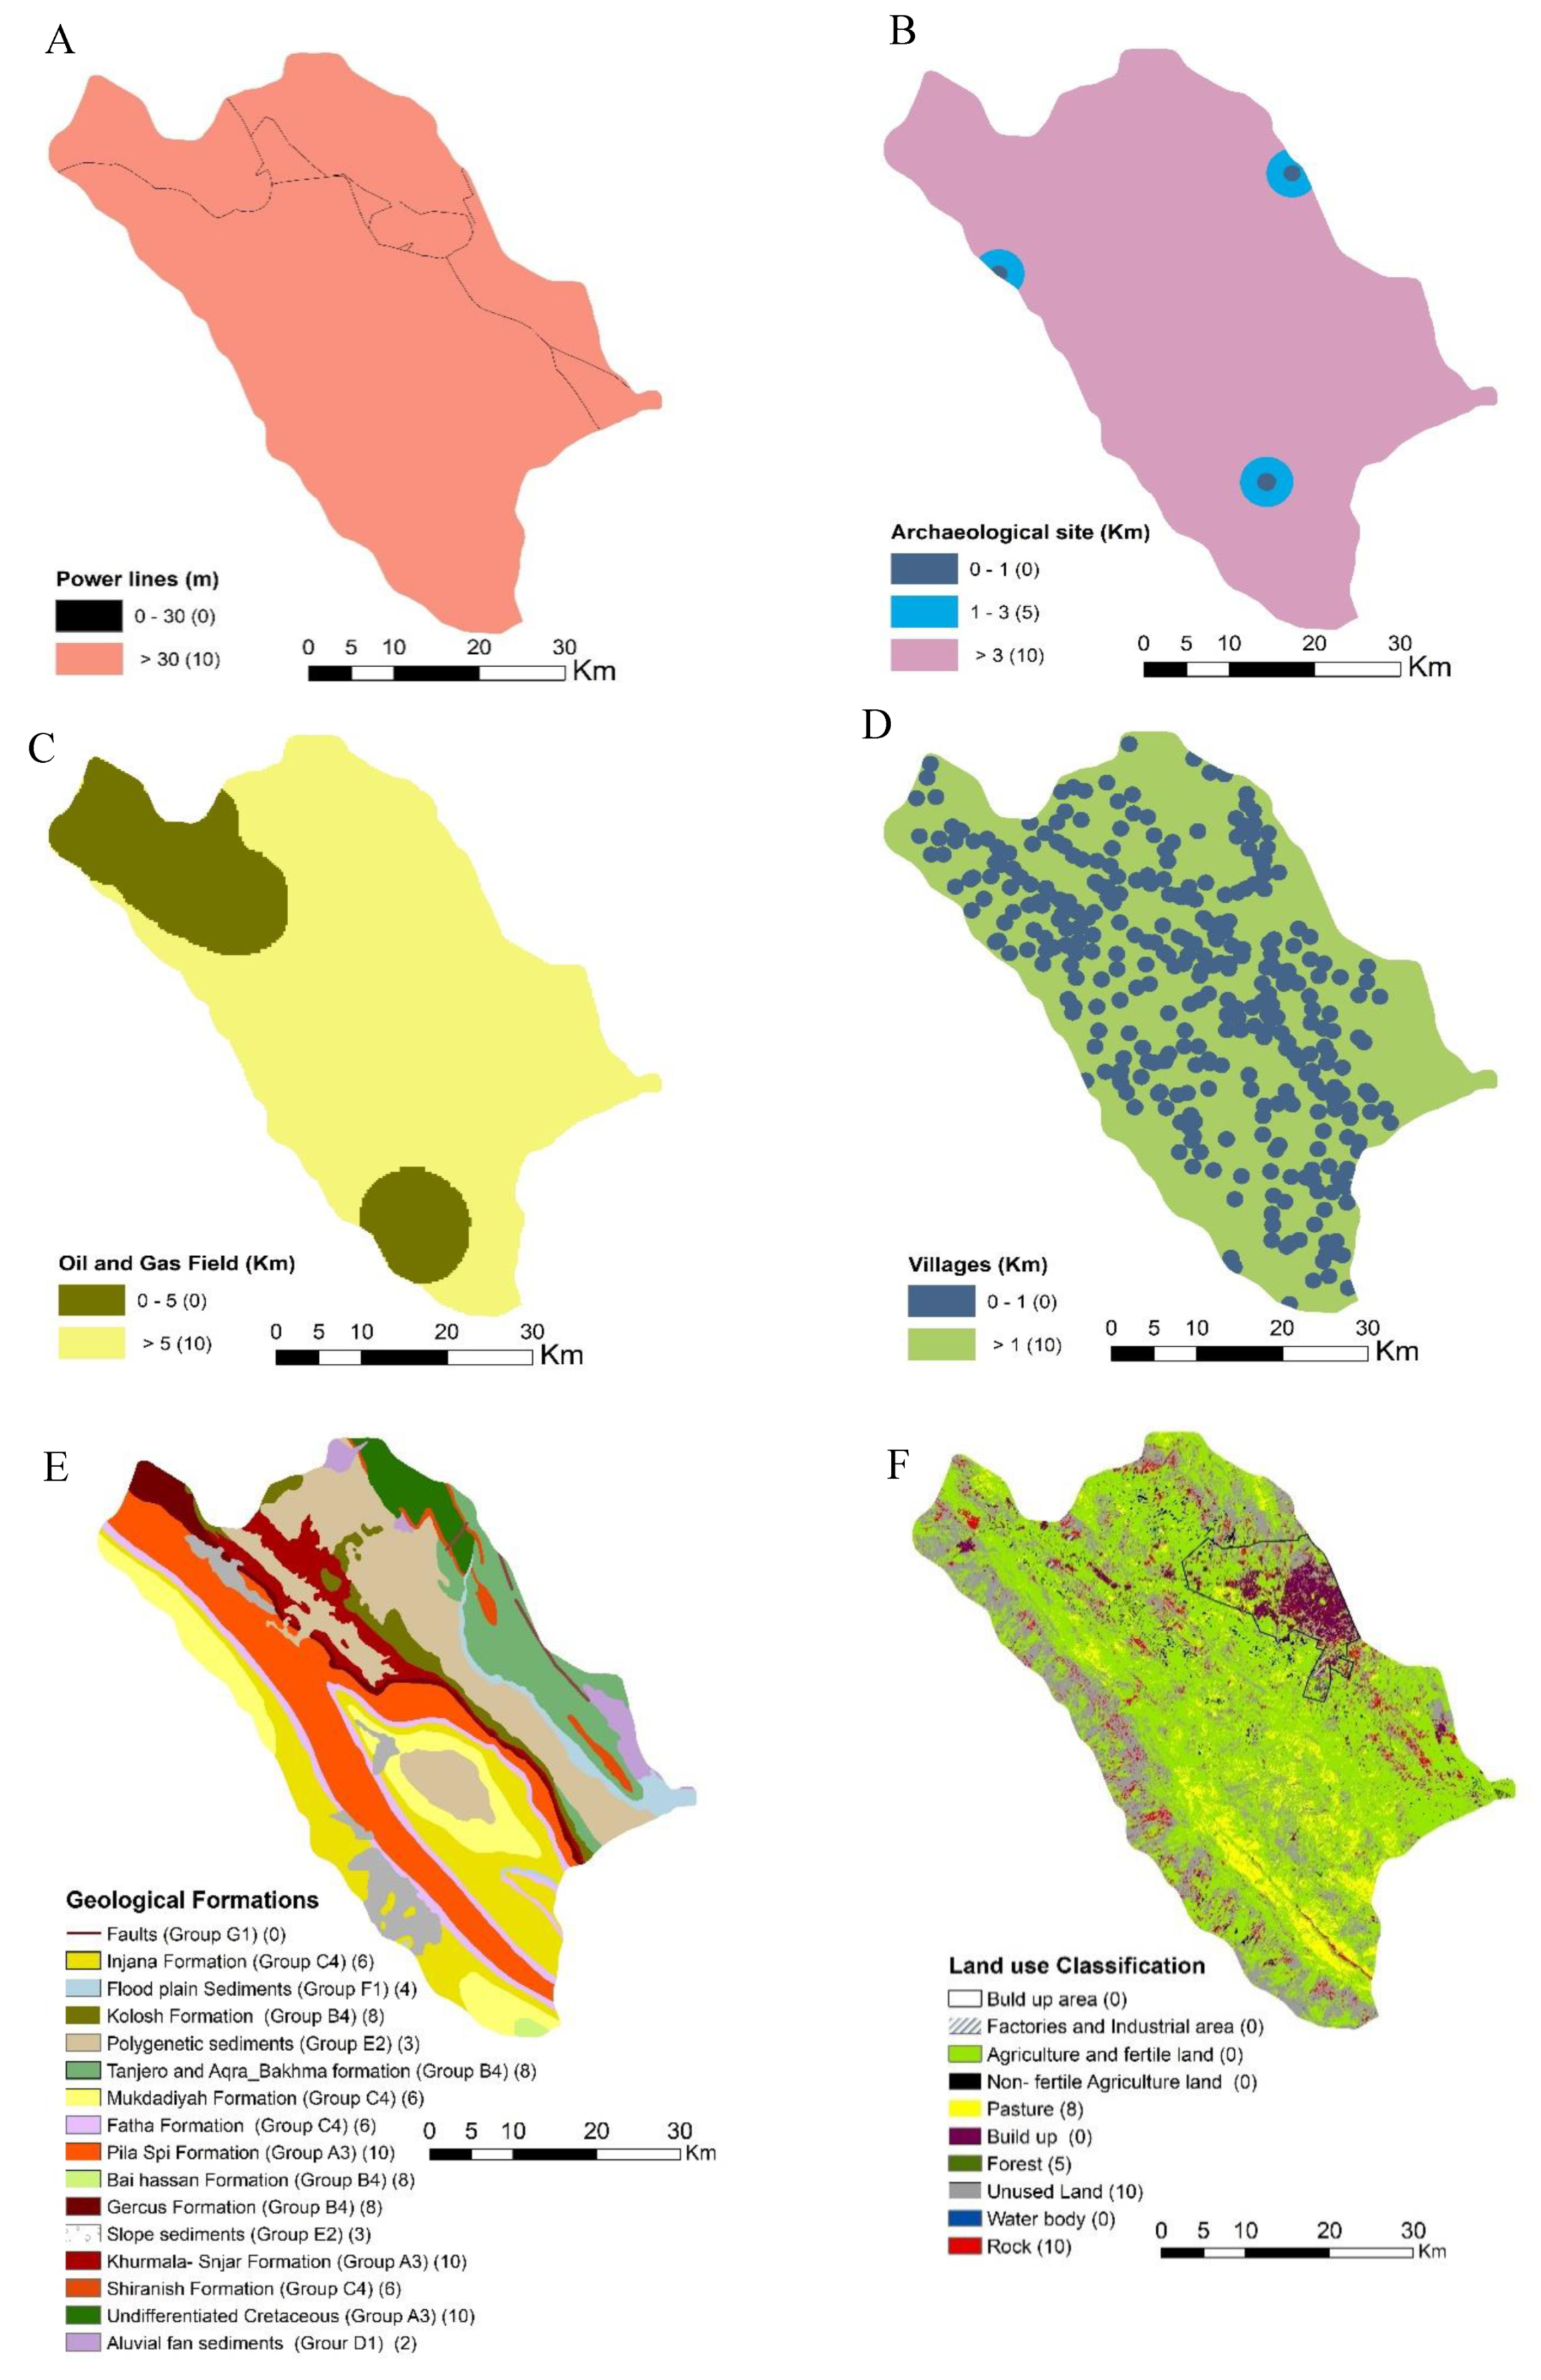
In this study, buffer zones should be more than 30 m from a landfill site to power lines on both sides, and they were given a score of 10, with distances of less than 30 m being given a grading of 0. The reason why these values are chosen to prevent the high voltage energy resulting from these lines (Figure 4A).
The “archaeological sites” criterion was categorized into three sub-criteria, a buffer zone of less than 1 km has been classified as zero. Buffer zones of 1–3 km and those of more than 3 km were rated as 5 and 10 respectively (Figure 4B).
Buffer zones of less than 5 km and 1 km were provided zero ratings in the “oil and gas” and “village” layers. Buffer zones higher than these values were given 10 grading values. (Figure 4C,D).
Sub-criteria for “Geological formations” consisted of seven groups. G1, D1, E2, F1, C4, B4 and A3 were given ratings of 0, 2, 3, 4, 6, 8 and 10, respectively (Figure 4E). The suitability index in these groups was classified according to the lithology and permeability of the sediments due to grain size distribution. The lithology of the geological formations are described as below [42]:
- B4:
- Tanjero and Aqra-Bekhma formations: Intercalation of shale, Mudstone, sandstone and conglomerate, interbedded with beds of back-reef deposit.
- B4:
- Bai Hassan Formation: Sandy conglomerate and sandstone.
- B4:
- Gercus Formation: Alteration of red claystone, sandstone and rare conglomerate.
- B4:
- Kolosh—Sinjar Formation: Dark grey claystone, shale, siltstone and rare conglomerate.
- A3:
- Undifferentiated Cretaceous.
- A3:
- Pilaspi Formation: Limestone and chalky marl with chert nodules, slightly interfingering with Avana Formation.
- A3:
- Khurmala Formation: Well bedded limestone.
- C4:
- Mukdadiyah Formation: Pebbly sandstone, claystone and sandstone.
- C4:
- Injana Formation: Sandstone interbedded with claystone.
- C4:
- Fatha Formation: Cyclic deposit of claystone, marl, gypsum and sandstone with occasional limestone.
- C4:
- Shiranish formation: Bluish grey marl and marly limestone.
- F1:
- Flood plain Sediments: (consisting of sand, silt and mud).
- E2:
- Gulneri formation (Polygenetic sediments): Dukan, Qamchuqa, Sarmord in piramagroon anticline.
- E2:
- Slope sediments Pebbly, sandy, silty and clayey soil.
- D1:
- Alluvial fan sediments, gravel, sand and mud.
- G1:
- Faults.
The 2017 Landsat 8 (OLI) satellite image was downloaded for land use and land cover classification using remote sensing software ENVI 5.3 for image processing. Geometric correction was used through pre-processing calibration. The methods for image processing include statistical algorithms that change the visual appearance of the image, and fast line-of-sight atmospheric analysis of hypercubes (FLAASH) converted the digital images to surface reflection to remove atmospheric effects and generate a reflection of the surface image. Using the pre-processed classified images from the training data (region of interest, ROI) and considering the maximum likelihood of estimating probabilistic model parameters in a supervised classification technique based on Bayesian theory [59], the layer of “land use” was classified into ten sub-criteria: Airport, Build up, Water body, Factories and Industrial area, Agriculture and fertile land, non-fertile and agriculture land. These were given a rate of zero due to unsuitability, while Forest, Pasture, Rock and Unused land were given a rate of 10, 8, 6 and 4, respectively (Figure 4F).
To generate the groundwater layer map, the Kriging method in geostatistical analysis tools was used in GIS to obtain the best interpolation between groundwater depths in 235 drilled wells throughout the study area. The groundwater level data measurements were carried out from 2000 to 2015 and were obtained from the (Groundwater Directorate in Sulaimaniyah). Generally, landfill site selection is influenced by groundwater depths due to the extent of groundwater contamination through leaching. In this study, groundwater depths were classified into five intervals, from 19–35 m, 35–50m, 50–65 m, 65–80 m and 80–280 m, with rating values of 2, 4, 6, 8 and 10 respectively (Figure 5).
3.5. Multi-Criteria Decision-Making Methods
3.5.1. Analytical Hierarchy Process (AHP)
The Analytic Hierarchy Process (AHP) is a multi-criteria decision-making strategy where all criteria are assigned to different levels using pairwise comparison in the matrix to derive the relative weights for criteria [58]. It provides the judgment matrix by comparing the degree of significance of the relative element [58,60], and each index’s weight is relative to the general objective, thereby simplifying the decision-making process. The process judgment of pairwise comparisons is done through the priority importance of intensity using a numerical scale of 9 degrees, according to the sequence values from 1 (Equal importance) to 9 (Extreme importance) as presented in Table 4. AHP output evaluates the general preference for each of the options, which ultimately allows decision makers to choose the best strategy [53,58].
Thus, every alternative can be evaluated in terms of the decision criteria and each criterion can be estimated by its weight in order to implement a pair comparison in the matrix (relative scale of importance). The values of (aij) when (ii= 1, 2, 3, …, m) and (j = 1, 2, 3, …, n) are used to indicate the performance values in the rows and columns of the matrix. The upper diagonal triangle of the matrix is filled with the values of comparison criteria, while the lower triangle of the matrix represents the reciprocal values of the upper diagonal, using Equation (1) [10,26,62].
where, (aij) is the element of the row (i) and column (j) of the matrix.
The typical comparison matrix for the relative importance of the criteria can be represented as follows in a decision matrix:
The eigenvectors for each row are calculated using geometric principles, multiplying the value for each criterion in each column in the same row of the original pair-wise comparison matrix, and then applying this to each row. This is represented as follows [58]:
where, = eigenvalue for the row (i); n = number of elements in row (i)
The priority vector or AHP weight is determined by normalizing the eigenvalue to 1 (divided by their sum) [58], as follows:
The maximum eigenvalue or maximum lambda (λmax) is obtained from the summation of products between each component of the priority vector and the sum of columns of the reciprocal matrix, as shown in the following formula [58]:
where, aij is the criteria in each column in the matrix, and Wi is the value of weight for each criterion which corresponds to the priority vector in the decision matrix.
The consistency index represents the equivalent of the mean deviation of each comparative element and the standard deviation of the evaluation error from the true ones [63], which will often turns out to be larger than the value describing a fully consistent matrix in order to provide a measure of severity of this deviation [58,64].
where, CI is the consistency index, n is the size or order of the matrix.
The consistency ratio (CR) is obtained by dividing the consistency index value (CI) by the random index value, here (RI = 1.56), and n is the size of the matrix (n = 13). Table 5 shows the mean random index value RI for a matrix with different sizes [58].
In this study, RI13 = 1.56 and CR = 0.027. CR should be less than 0.1 because, if CR is less than 0.1, the ratio indicates a reasonable of consistency level in the pairwise comparison.
The importance and weight of each parameter were compared with each parameter in the weight assessment procedure. This was done by taking account the views of the expert that have worked in this field. Each parameter specifies a value for the weight that it merits by assuming the method of straightforward additive weighting. These weights are then used to organize the comparison matrix to revise the correct weight for each parameter. The pairwise comparison matrix for the 13 criteria is presented in (Table 6).
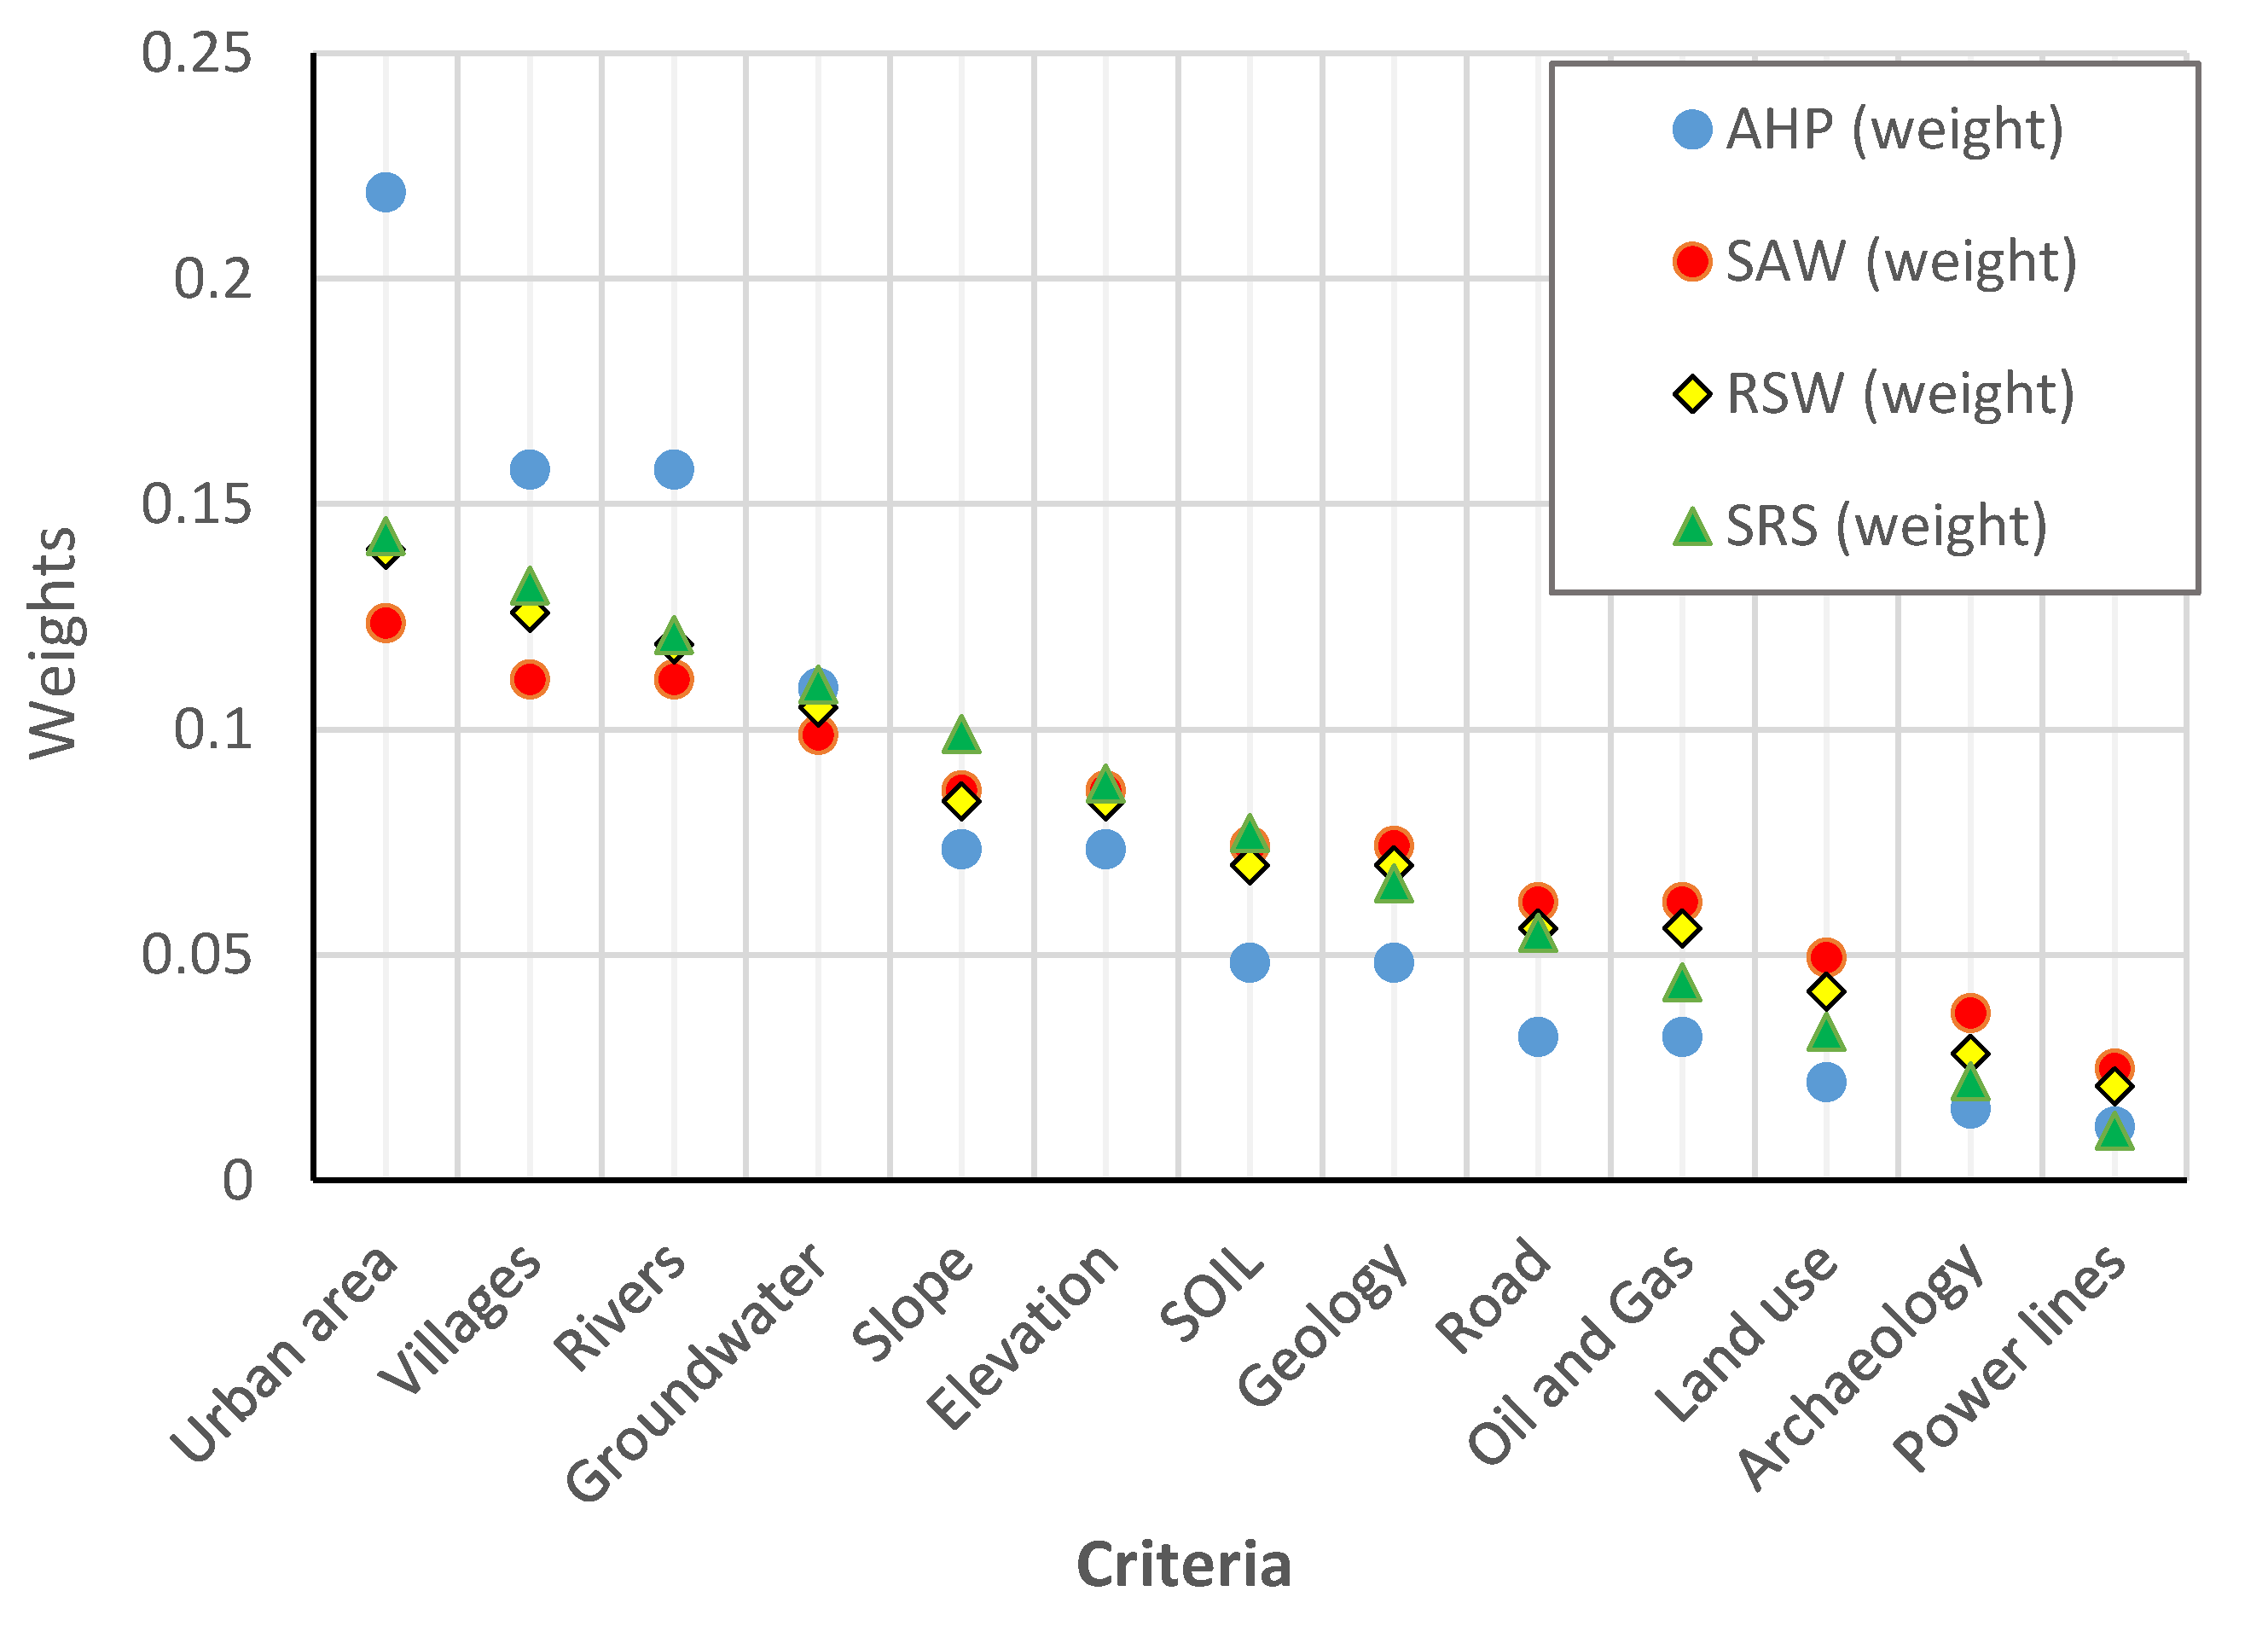
In addition, multi-criteria decision-making (MCDM) methods were used to obtain the comparative weights for each criterion using different methods including: Analytical Hierarchy Process (AHP), Simple Additive Weighting (SAW), Ratio Scale Weighting (RSW) and Straight Rank Sum (SRS).
To obtain the suitability index value for the potential areas, the WLC (Weighted Linear Combination) method was used based on the following formula
where, Ai: is the suitability index, Wj: is the relative importance weight of the criterion, Cij: is the grading value (i) under criterion (j), and n: is the total number of criteria [28,29].
The WLC method was applied on all criteria using the special analysis tools “map algebra” in GIS to all criteria using the special analysis tools “map algebra” in GIS to assess the suitability index map. This is achieved by summing up the products by multiplying the sub-criteria rating values for each criterion (based on expert opinion in this sector) by the corresponding relative importance weight.
3.5.2. Simple Additive Weighting (SAW) Method
Simple additive weighting (SAW) is a basic ranking method and is specified as a weighted linear combination or scoring method using a multi-attribute decision approach [56]. The approach is based on weighted averages, with the weights of comparative significance directly allocated by the decision-maker to assess the weight for each criterion and to select the significance and weight of each criterion relative to the other criterion. The normalization of the relative weight of importance is done by dividing the weight of the criterion by their summation. The simple additive weighting method evaluates each alternative using the following formula [44,66].
where, Wi is the normalized weight of each criterion by its sum; Ai is the weight of each criterion in the row (i); Aj is the weight of each criterion in the column (j); n is the number of criteria.
3.5.3. Straight Rank Sum (SRS) Method
The straight rank sum method (SRS) is considered to be a kind of ranking method. It is a straightforward technique used to determine the weights of the criteria by arranging the criteria according to comparative significance in decreasing order from the most to the least important depending on the preferences of the decision-makers using the formula (n − ri + 1). Then, the weights of the criteria are normalized by dividing each weight of criterion by its sum Σ (n − rg + 1) according to Equation (9) [18,67].
where, Wi is the relative importance of normalized weight for (i) criterion; n is the number of criteria in the research under consideration (g = 1, 2, …, n), and ri is the ranking position for the criterion.
3.5.4. Ratio Scale Weighting (RSW) Method
In the Ratio Scale Weighting (RSW) technique, the decision process is based on the allocation of an appropriate ratio score value for each criterion, where the value of 100 is provided to the most important criterion as the basis for the other criteria values. The values below 100 are assigned proportionally to criteria which are lower in order based on the importance of each criterion compared to the other criteria [44]. In order to estimate the current criteria weights (NWi) using the Ratio Scale Weighting (RSW) technique, the proportional weight value of each criterion is divided by the lowest in importance proportional weight value of the criterion. Then, the normalized weights of the criteria, RSW method, are estimated as follows [67]:
where, Wi is the normalized weight of each criterion divided by the sum of new weight of each criterion; NWi is the new weight of each criterion of the area (i) under criterion (j); n is the number of criteria.
4. Results and Discussion
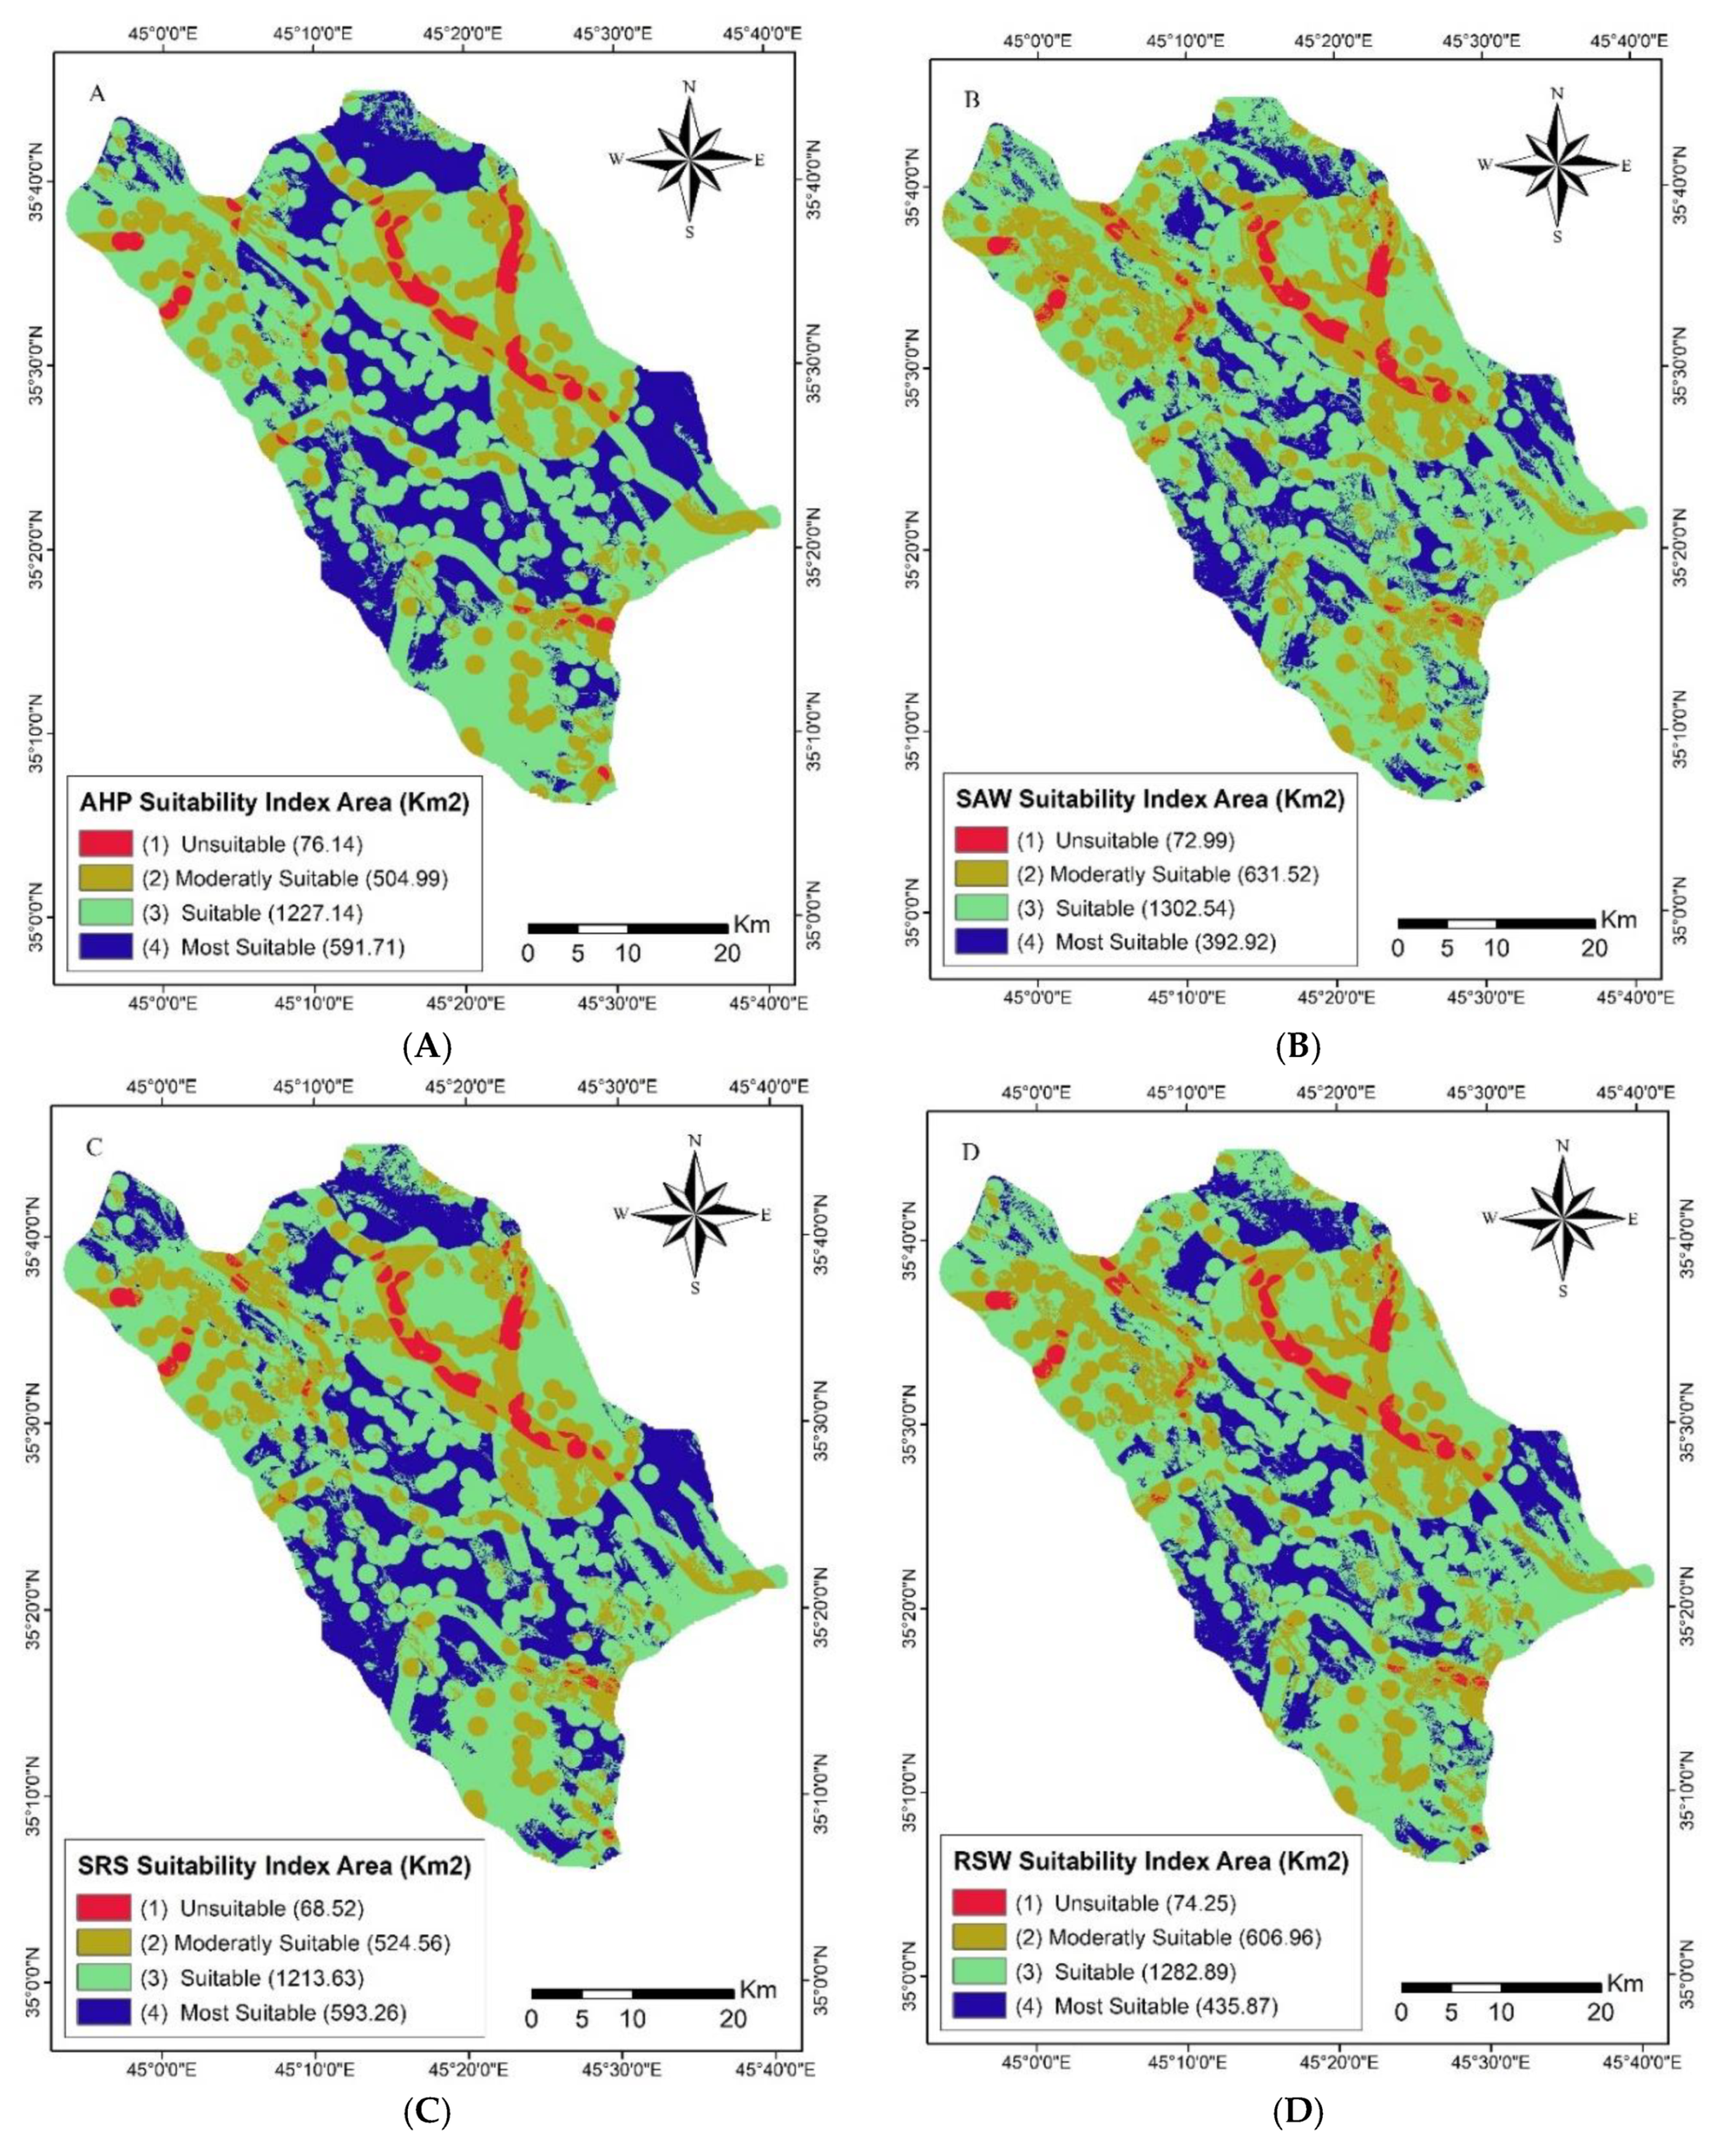
From constructing a matrix of comparison, the maximum eigenvalue or maximum lambda (λmax) in this study is equal to 13.51 and consistency index (CI) equals 0.04, criterion weight results defined by all MCDM methods (including AHP, SAW, RSW and SRS methods) are show in Table 7. The suitability index map for landfill sites in the Sulaimaniyah Governorate adapted using the WLC methods for AHP, SAW, SRS and RSW, where criteria branched with higher sub-criteria take higher weighting in the AHP method than the others, as presented in Figure 6. Therefore, unsuitable areas take a higher portion of the area in the AHP method compared to other methods, as presented in Figure 7.
The suitability index value in each method is categorized into four classifications of suitability areas, these categories are unsuitable areas, moderately suitable areas, suitable areas and most suitable areas, each method represent a different value in area, (Figure 7A–D) Each category’s area is calculated over the total study area which resulted in the final index of suitability for landfill locations as assessed in Figure 8.
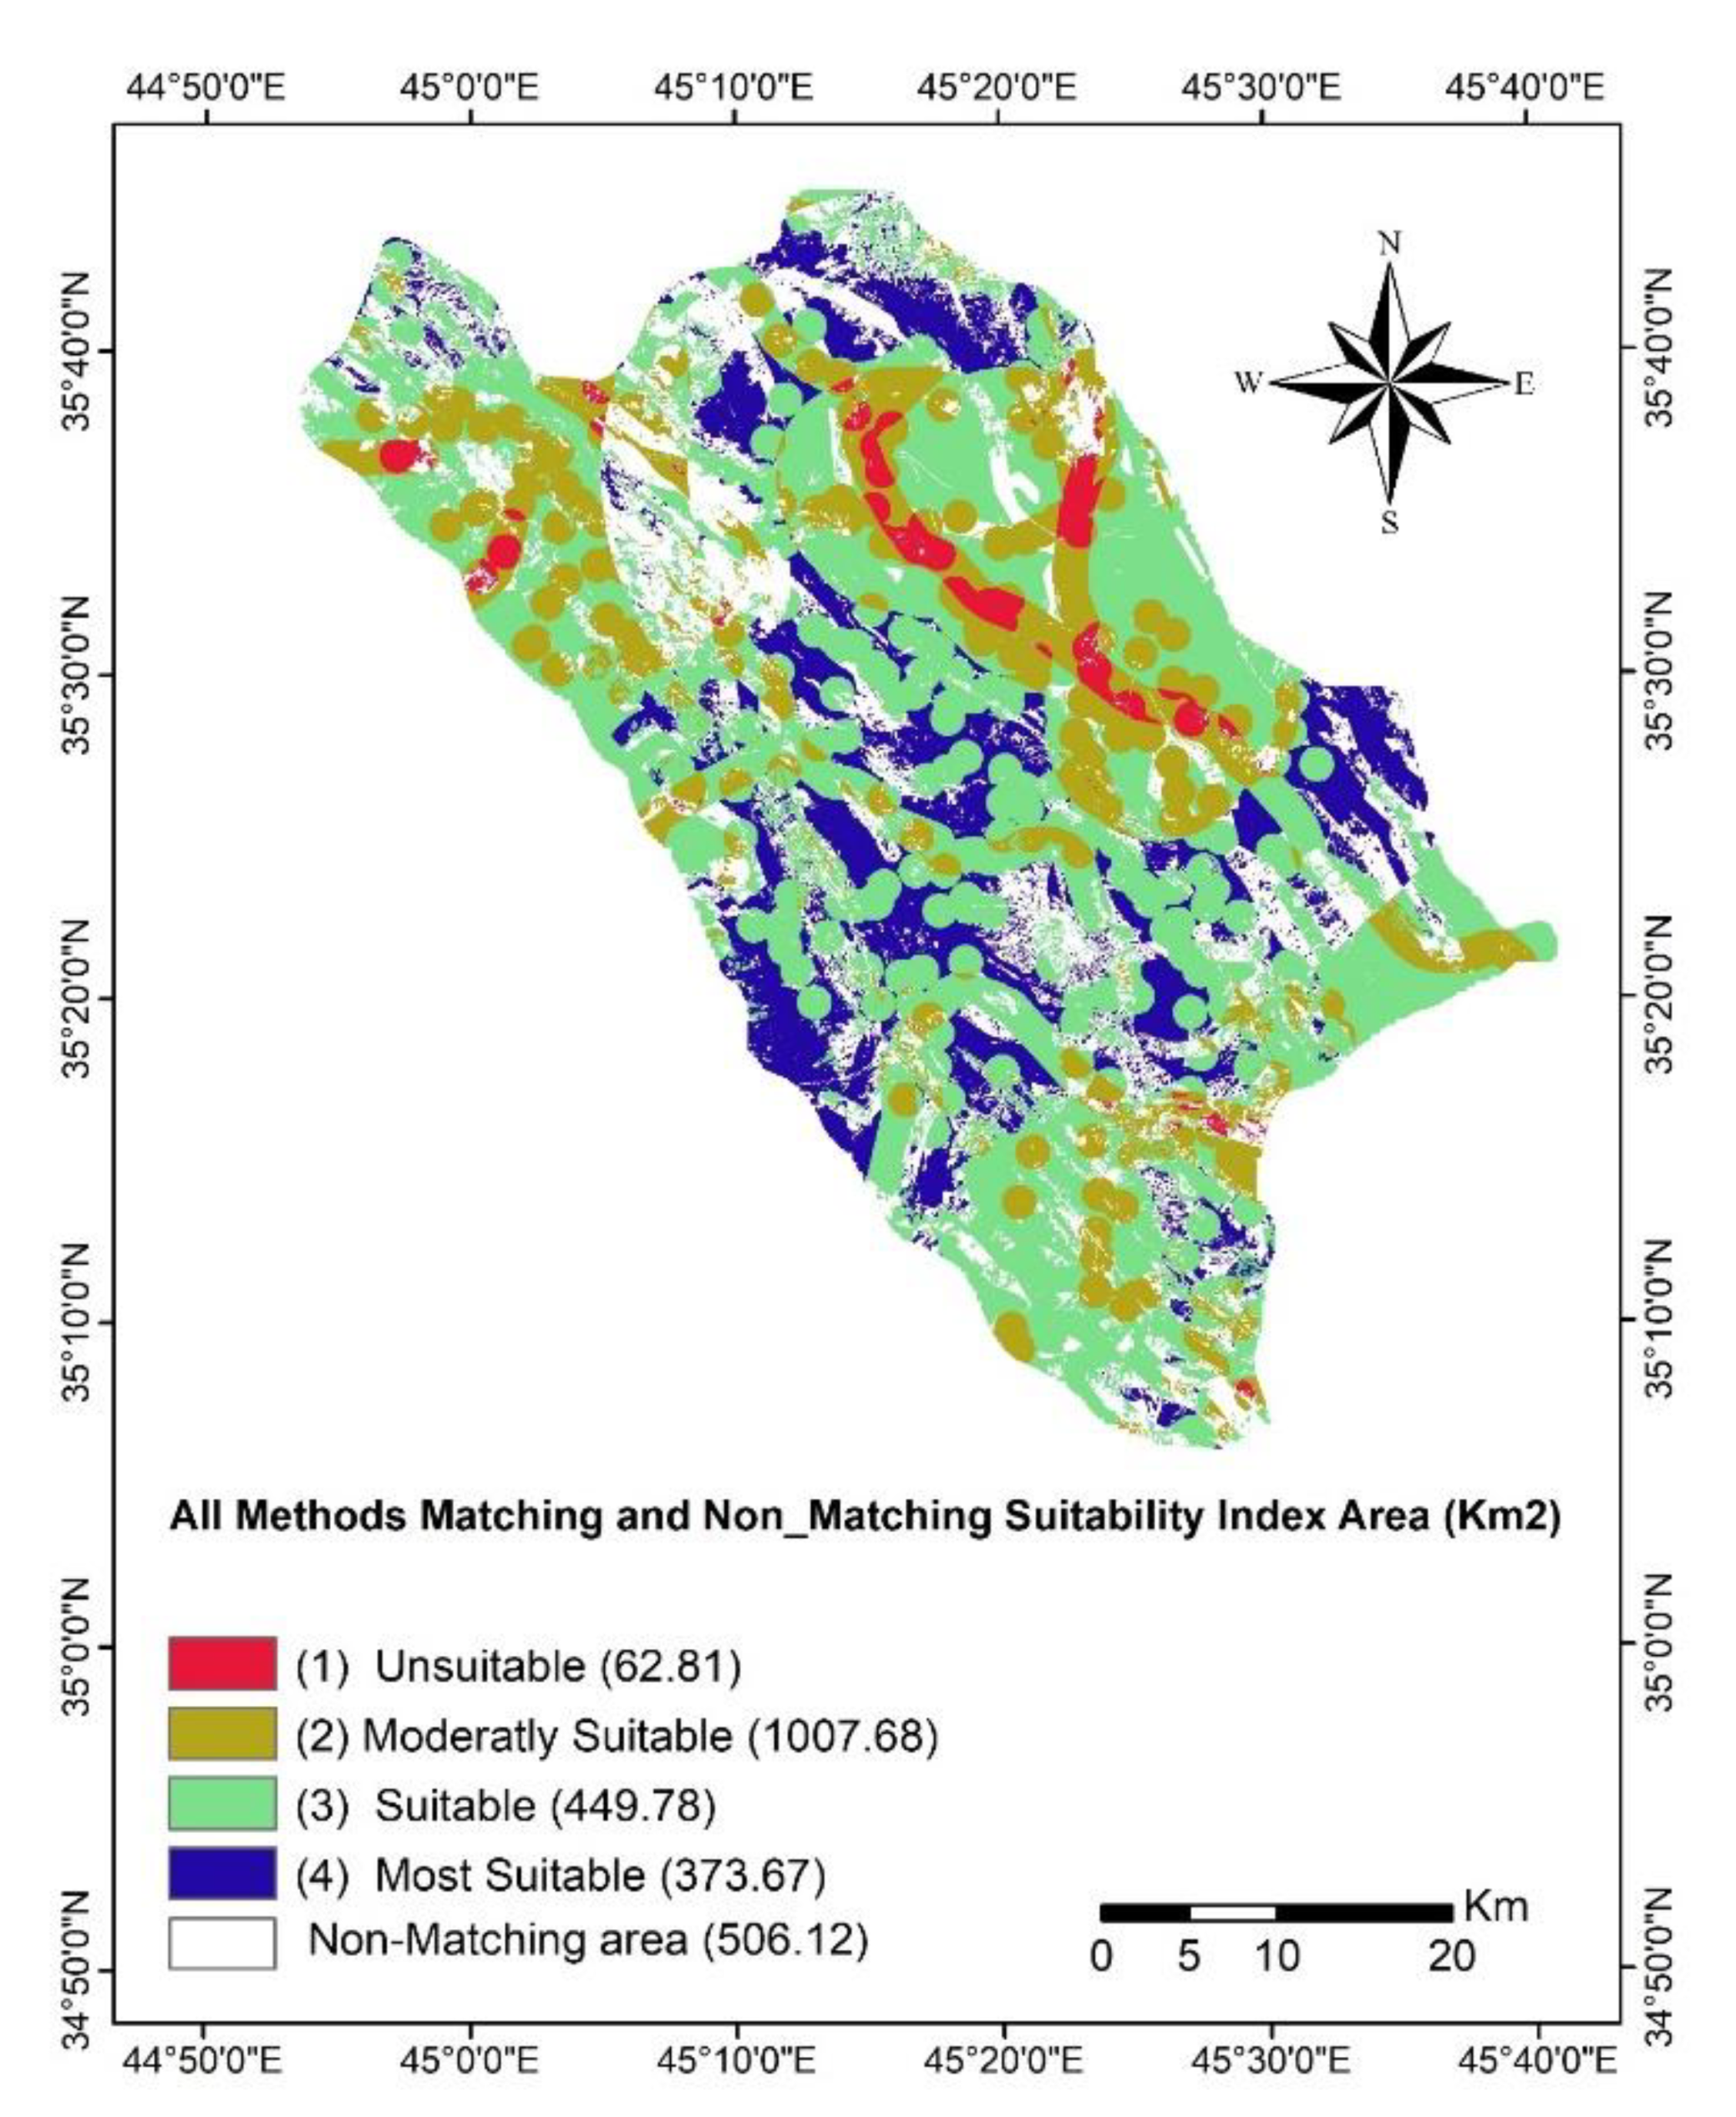
The suitability index map shows that each method slightly differs from the other methods in terms of area, but all methods were overlaid to determine the intersecting area within the map index, as seen in Figure 9.
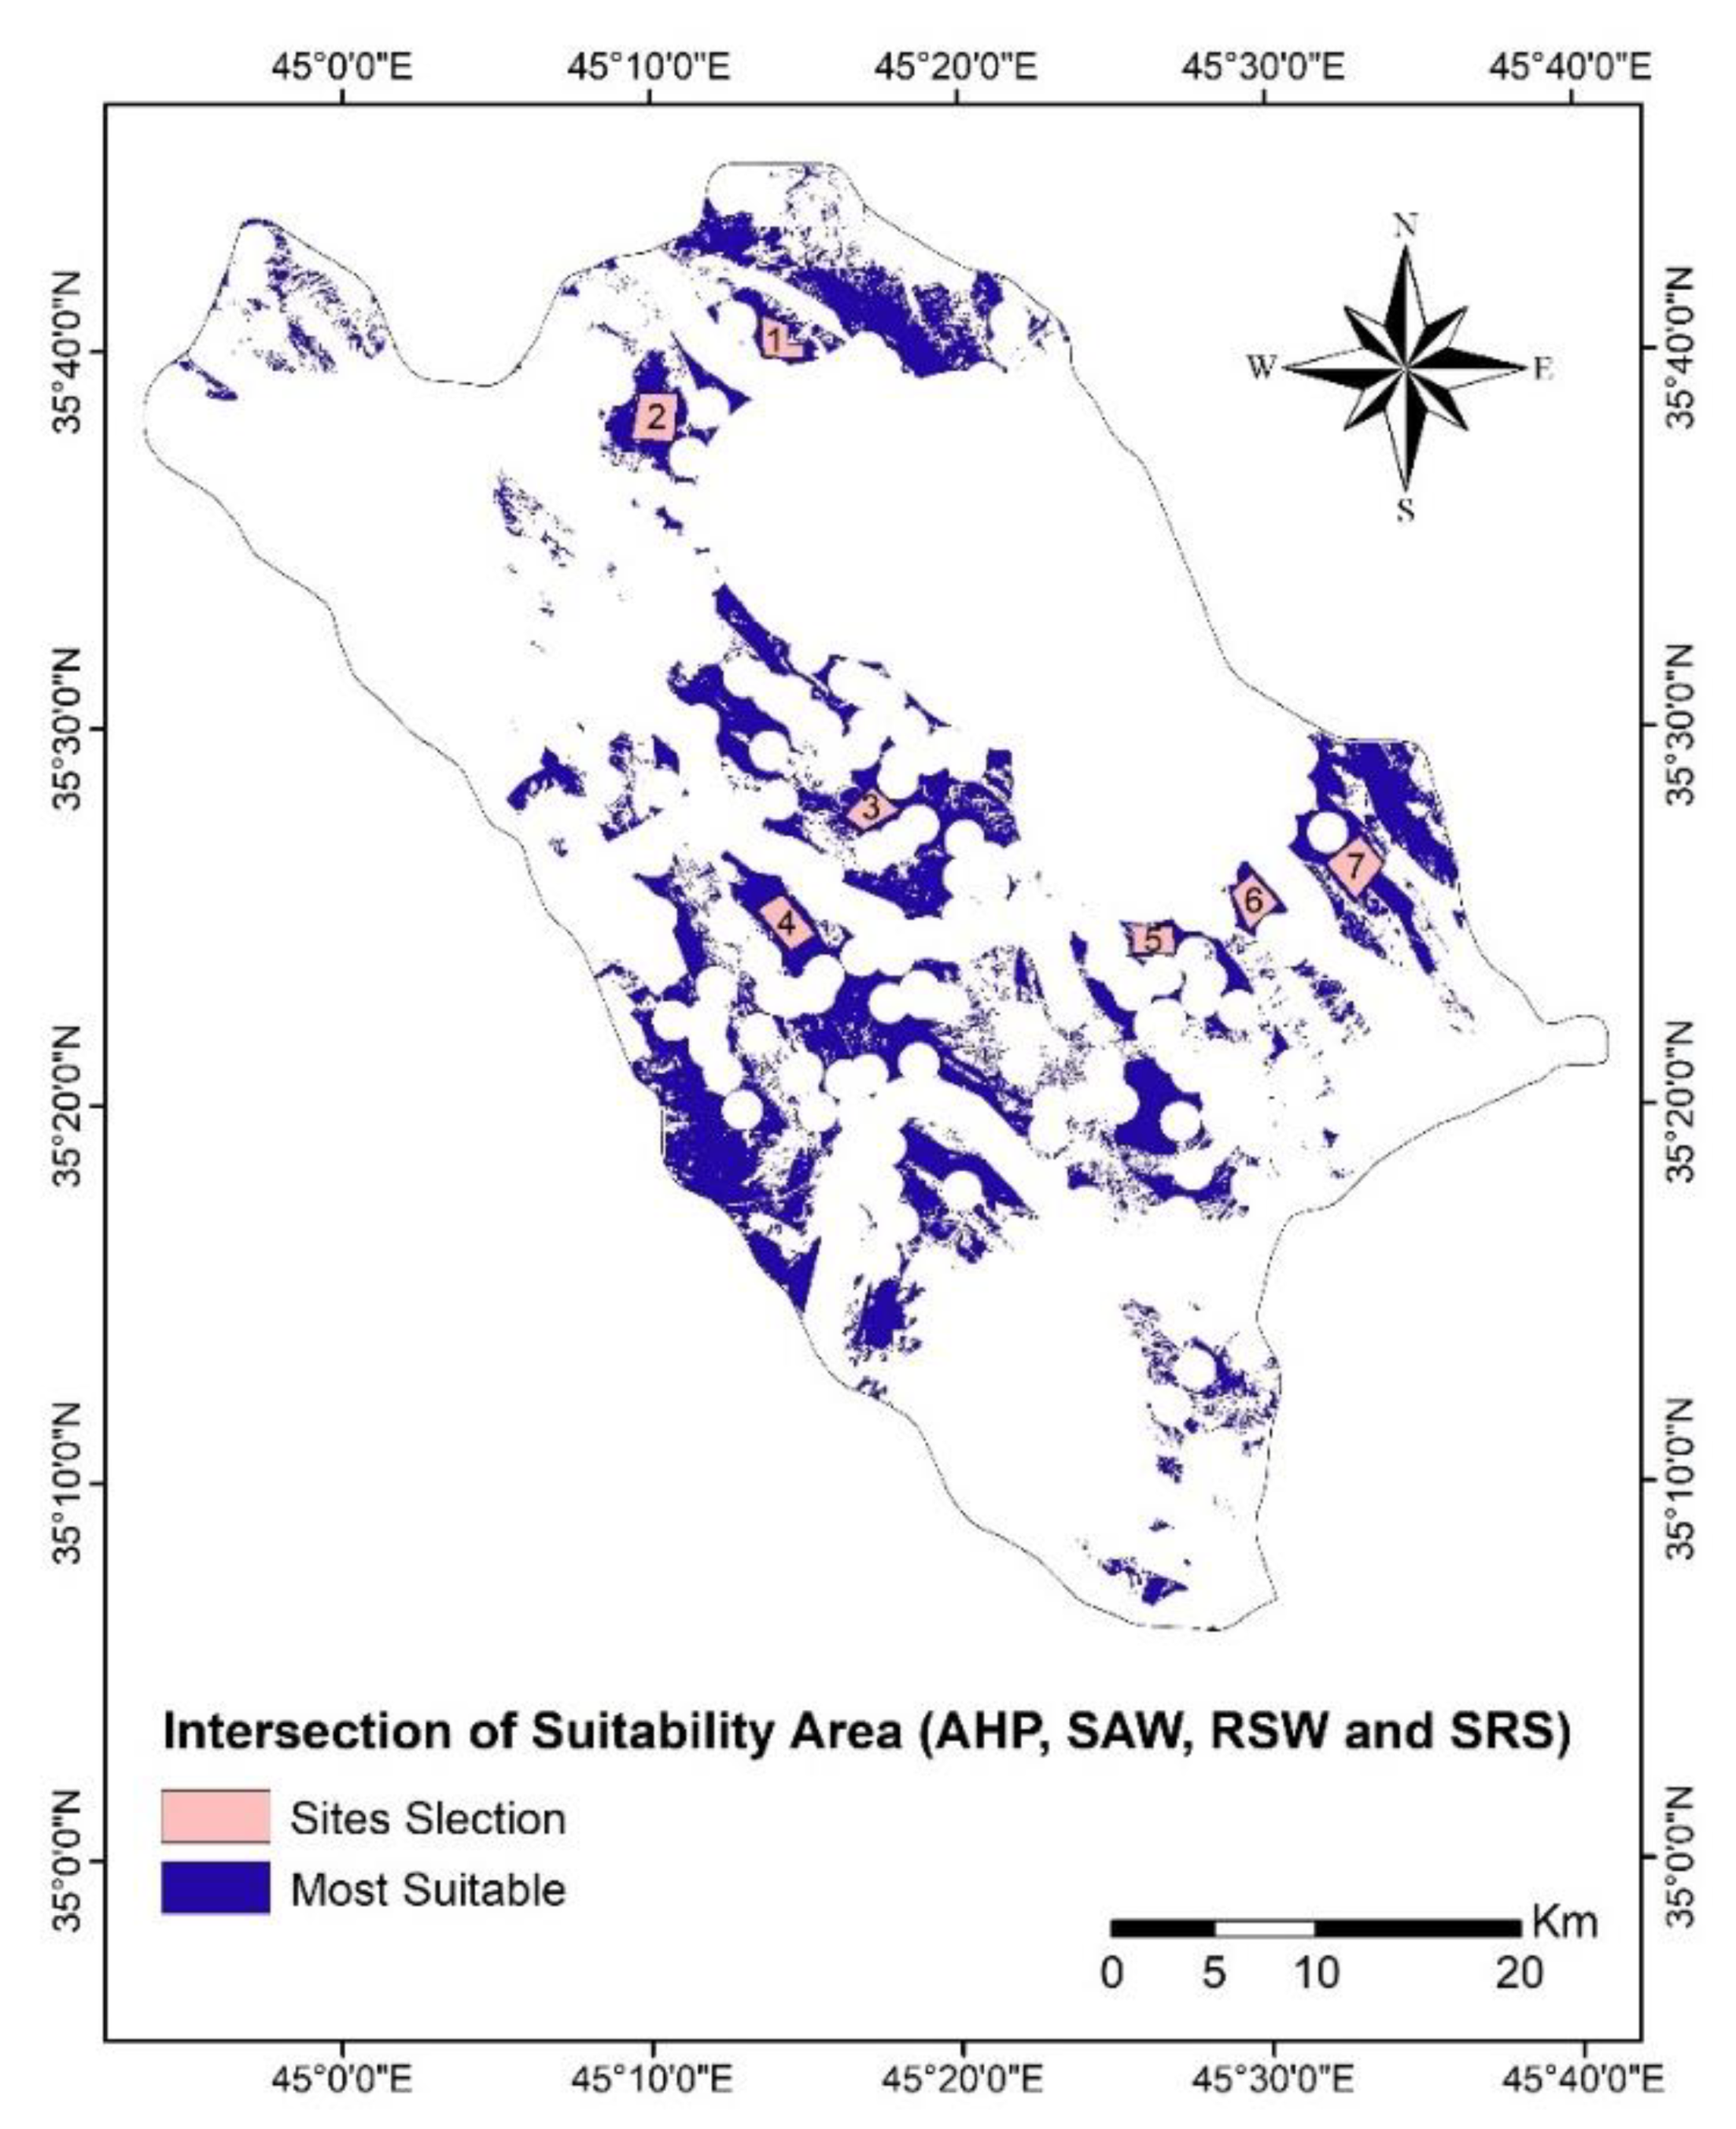
Total matching of suitable areas for all method was estimated as being 80%, while non-matching area represents 20% of the area. Thus, seven candidate sites were suggested for the landfill in the Sulaimaniyah Governorate in the “most suitable index” category according to the AHP, SAW, RSW and SRS methods, with areas of 2.74, 4.48, 2.80, 3.67, 2.67, 3.18 and 4.36 km2 respectively as shown in Figure 10. Given the expectation of huge annual waste generation of 473,000 tons over a small open dumping disposal site of about 0.45 km2 in area [58], this value needs to be more than 2.5 km2 for future planning.
5. Conclusions
The existing waste disposal sites in the Sulaimaniyah Governorate do not fulfill science and environmental requirements. The goal of this study was to pursue proper selection processes while avoiding environmental problems, and to suggest suitable sites for landfill using GIS and Multi-criteria decision-making (MCDM) techniques to facilitate shifting the present dumpsite to an alternative location. To decide on the most adequate sites for landfills in the Sulaimaniyah Governorate, thirteen layers of criteria were incorporated into GIS to make a decision analysis process using a pairwise comparison through constructing a matrix of comparison. These layers, according to their importance were urban area, villages, rivers, groundwater, slope, elevation, soil, geology, road, oil and gas, land use, archaeology and power lines.
The AHP, SAW, RSW and SRS methods were used in MCDM to derive the weightings of the criteria, and the WLC method was applied on all methods to produce the output map, including a landfill suitability index for the Sulaimaniyah Governorate. The final map was produced from the intersection of all methods’ maps, with total matching for suitable areas for all methods estimated at 80%, while non-matching area presents 20% of the area. Seven candidate locations were suggested on the final map for landfill in the Sulaimaniyah Governorate within the category of “most suitable” area.
Author Contributions
K.A., methodology, investigation, validation, software and writing of the first and final draft. A.C., Software and methodology; S.S.A., N.A.-A. and J.L., validation, visualization, project administration, supervision writing the final draft.
Conflicts of Interest
The authors declare no conflict of interest.
References
- Mian, M.M.; Zeng, X.L.; Nasry, A.A.N.B.; Al-Hamadani, S.M.Z.F. Municipal solid waste management in China: A comparative analysis. J. Mater. Cycles Waste Manag. 2017. [Google Scholar] [CrossRef]
- Zhu, M.H.; Fan, X.M.; Rovetta, A.; He, Q.C.; Vicentini, F.; Liu, B.K.; Giusti, A.; Liu, Y. Municipal solid waste management in Pudong New Area, China. Waste Manag. 2009. [Google Scholar] [CrossRef]
- Pearce, D. Auditing the Earth: The Value of the World’s Ecosystem Services and Natural Capital. Environ. Sci. Policy Sustain. Dev. 1998, 40, 23–28. [Google Scholar] [CrossRef]
- Al-Hanbali, A.; Al-Ansari, N.A.; Knutsson, S. Locating Solid Waste Landfills in Mafraq City Jordan. J. Adv. Sci. Eng. Res. 2012, 2, 40–51. [Google Scholar]
- Alkaradaghi, K.; Ali, S.S.; Al-Ansari, N.; Laue, J. Evaluation of Land Use & Land Cover Change Using Multi-Temporal Landsat Imagery: A Case Study Sulaimaniyah Governorate, Iraq. J. Geogr. Inf. Syst. 2018, 10, 247–260. [Google Scholar] [Green Version]
- Othman, N.; Kane, T.; Hawrami, K. Environmental Health Assessment in Sulaymaniyah City and Vicinity. Tech. Rep. 2017. [Google Scholar] [CrossRef]
- Ugwuanyi, R.; Isife, T.C. Urbanization and Solid Waste Management Challenges NIGERIA Gender Project View Project Environment Project View Project. 2012. Available online: https://www.researchgate.net/publication/319448696 (accessed on 5 July 2019).
- Liu, A.; Ren, F.; Lin, W.Y.; Wang, J.Y. A review of municipal solid waste environmental standards with a focus on incinerator residues. Int. J. Sustain. Built Environ. 2015, 4, 165–188. [Google Scholar] [CrossRef] [Green Version]
- López, A.; Lobo, A. Emissions of C&D refuse in landfills: A European case. Waste Manag. 2014. [Google Scholar] [CrossRef]
- Uyan, M. MSW landfill site selection by combining AHP with GIS for Konya, Turkey. Environ. Earth Sci. 2014, 71, 1629–1639. [Google Scholar] [CrossRef]
- Abdullah, T.O.; Ali, S.S.; Al-Ansari, N.A.; Knutsson, S. Possibility of Groundwater Pollution in Halabja Saidsadiq Hydrogeological Basin, Iraq Using Modified DRASTIC Model Based on AHP and Tritium Isotopes. GeoScience 2018, 8, 236. [Google Scholar] [CrossRef]
- Thapa, R.B.; Murayama, Y. Land evaluation for peri-urban agriculture using analytical hierarchical process and geographic information system techniques: A case study of Hanoi. Land Use Policy 2008, 25, 225–239. [Google Scholar] [CrossRef] [Green Version]
- Li, Z.W.; Zeng, G.M.; Zhang, H.; Yang, B.; Jiao, S. The integrated eco-environment assessment of the red soil hilly region based on GIS—A case study in Changsha City, China. Ecol. Model. 2007, 202, 540–546. [Google Scholar] [CrossRef]
- Vahidnia, M.H.; Alesheikh, A.A.; Alimohammadi, A. Hospital site selection using fuzzy AHP and its derivatives. J. Environ. Manag. 2009, 90, 3048–3056. [Google Scholar] [CrossRef]
- Sharifi, M.; Hadidi, M.; Vessali, E.; Mosstafakhani, P.; Taheri, K.; Shahoie, S.; Khodamoradpour, M. Integrating multi-criteria decision analysis for a GIS-based hazardous waste landfill sitting in Kurdistan Province, western Iran. Waste Manag. 2009, 29, 2740–2758. [Google Scholar] [CrossRef]
- Javaheri, H.; Nasrabadi, T.; Jafarian, M.H.; Rowshan, G.R.; Khoshnam, H. Site Selection of Municipal Solid Waste Landfills Using Analytical Hierarchy Process Method in a Geographical Information Technology Environment in Giroft. J. Environ. Health Sci. Eng. 2006, 3, 177–184. [Google Scholar]
- Abdullah, L.; Adawiyah, C.W. Simple Additive Weighting Methods of Multi criteria Decision Making and Applications: A Decade Review. Int. J. Inf. Process. Manag. 2014, 5, 39–49. [Google Scholar]
- Effat, H.A.; Hegazy, M.N. Mapping potential landfill sites for North Sinai cities using spatial multicriteria evaluation. Egypt. J. Remote. Sens. Space Sci. 2012, 15, 125–133. [Google Scholar] [CrossRef] [Green Version]
- Korucu, M.K.; Karademir, A. Siting a municipal solid waste disposal facility, part II: The effects of external criteria on the final decision. J. Air Waste Manag. Assoc. 2014, 64, 131–140. [Google Scholar] [CrossRef]
- Ramjeawon, T.; Beerachee, B. Site selection of sanitary landfills on the small island of Mauritius using the analytical hierarchy process multi-criteria method. Waste Manag. Res. 2008, 26, 439–447. [Google Scholar] [CrossRef]
- Baiocchi, V.; Lelo, K.; Polettini, A.; Pomi, R. Land suitability for waste disposal in metropolitan areas. Waste Manag. Res. 2014, 32, 707–716. [Google Scholar] [CrossRef] [PubMed]
- Ersoy, H.; Bulut, F. Spatial and multi-criteria decision analysis-based methodology for landfill site selection in growing urban regions. Waste Manag. Res. 2009, 27, 489–500. [Google Scholar] [CrossRef] [PubMed]
- Yesilnacar, M.I.; Süzen, M.L.; Kaya, B.S.; Doyuran, V. Municipal solid waste landfill site selection for the city of Şanliurfa-Turkey: An example using MCDA integrated with GIS. Int. J. Digit. Earth 2012, 5, 147–164. [Google Scholar] [CrossRef]
- Alavi, N.; Goudarzi, G.; Babaei, A.A.; Jaafarzadeh, N.; Hosseinzadeh, M. Municipal solid waste landfill site selection with geographic information systems and analytical hierarchy process: A case study in Mahshahr County, Iran. Waste Manag. Res. 2013, 31, 98–105. [Google Scholar] [CrossRef] [PubMed]
- Afzali, A.; Sabri, S.; Rashid, M.; Samani, J.M.V.; Ludin, A.N.M. Inter-Municipal Landfill Site Selection Using Analytic Network Process. Water Resour. Manag. 2014, 28, 2179–2194. [Google Scholar] [CrossRef]
- Şener, Ş.; Sener, E.; Karagüzel, R. Solid waste disposal site selection with GIS and AHP methodology: A case study in Senirkent-Uluborlu (Isparta) Basin, Turkey. Environ. Monit. Assess. 2011. [Google Scholar] [CrossRef] [PubMed]
- Sener, B.; Süzen, M.L.; Doyuran, V. Landfill site selection by using geographic information systems. Environ. Geol. 2006, 49, 376–388. [Google Scholar] [CrossRef]
- Charnpratheep, K. Preliminary landfill site screening using fuzzy geographical information systems. Waste Manag. Res. 1997, 15, 197–215. [Google Scholar] [CrossRef]
- El-Alfy, Z.; Elhadary, R.; Ahmed, E.A. Integrating GIS and MCDM to Deal with Landfill Site Selection. Int. J. Eng. Technol. 2010, 10, 32–42. [Google Scholar]
- Hassan, M.K.R. Urban environmental problems in cities of the Kurdistan region in Iraq. Local Environ. 2010, 15, 59–72. [Google Scholar] [CrossRef]
- Ministry of Planning-Kurdistan Regional Office (KRSO). Population Estimates for the Kurdistan Region by Governorate and District, Erbil. 2017. Available online: http://www.krso.net/Default.aspx (accessed on 10 July 2019).
- Office of UN Resident Co-Ordinator. Common Country Assessment. 2002. Available online: http://www.sprep.org/att/IRC/eCOPIES/Countries/Vanuatu/3 (accessed on 8 July 2019).
- Sabri, S.; Yaakup, A. Multi-criteria expert based analysis for ranking the urban gentrification drivers in developing countries. In Proceedings of the 2nd International Conference on Built Environment in Developing Countries (ICBEDC 2008), Penang, Malaysia, 3–4 December 2008. [Google Scholar]
- Maiti, S.; De, S.; Hazra, T.; Debsarkar, A.; Dutta, A. Characterization of Leachate and Its Impact on Surface and Groundwater Quality of a Closed Dumpsite—A Case Study at Dhapa, Kolkata, India. Procedia Environ. Sci. 2016, 35, 391–399. [Google Scholar] [CrossRef]
- Han, D.; Currell, M.J. Persistent organic pollutants in China’s surface water systems. Sci. Total Environ. 2017, 580, 602–625. [Google Scholar] [CrossRef] [PubMed]
- Moeinaddini, M.; Khorasani, N.; Danehkar, A.; Darvishsefat, A.A.; zienalyan, M. Siting MSW landfill using weighted linear combination and analytical hierarchy process (AHP) methodology in GIS environment (case study: Karaj). Waste Manag. 2010. [Google Scholar] [CrossRef]
- Prahl, B.F.; Boettle, M.; Costa, L.; Kropp, J.P.; Rybski, D. Damage and protection cost curves for coastal floods within the 600 largest European cities. Sci. Data 2018, 5, 180034. [Google Scholar] [CrossRef] [PubMed]
- Aksaler, N.; Yerli, S.K.; Erdogan, M.A.; Kaba, K.; Ak, T.; Aslan, Z.; Bakis, V.; Demircan, O.; Evren, S.; Keskin, V.; et al. Astronomical site selection for Turkey using GIS techniques. Exp. Astron. 2015, 39, 547–566. [Google Scholar] [CrossRef] [Green Version]
- Zeiss, C.; Lefsrud, L. Analytical Framework for Waste-Facility Siting. J. Urban Plan. Dev. 1995, 121, 115–145. [Google Scholar] [CrossRef]
- Tagaris, E.; Sotiropoulou, R.-E.P.; Pilinis, C.; Halvadakis, C.P. A Methodology to Estimate Odors around Landfill Sites: The Use of Methane as an Odor Index and Its Utility in Landfill Siting. J. Air Waste Manag. Assoc. 2003, 53, 629–634. [Google Scholar] [CrossRef]
- Orecchio, S.; Fiore, M.; Barreca, S.; Vara, G. Volatile Profiles of Emissions from Different Activities Analyzed Using Canister Samplers and Gas Chromatography-Mass Spectrometry (GC/MS) Analysis: A Case Study. Int. J. Environ. Res. Public Health 2017, 14, 195. [Google Scholar] [CrossRef] [PubMed]
- Jassim, S.Z.; Goff, J.C. Geology of Iraq; Dolin, Prague and Moravain Museum: Brno, Czech Republic, 2006; p. 356. [Google Scholar]
- Buringh, P. Soils and Soil Conditions in Iraq; The Ministry of Agriculture: Baghdad, Iraq, 1960; p. 337. [Google Scholar]
- Şener, B. Landfill Site Selection by Using Geographic Information Systems; Middle East Technical University: Çankaya/Ankara, Turkey, 2004; Available online: http://0-onlinelibrary-wiley-com.brum.beds.ac.uk/doi/10.1002/cbdv (accessed on 4 July 2019).
- Chabuk, A.J.; Al-Ansari, N.; Hussain, H.M.; Knutsson, S.; Pusch, R. GIS-based assessment of combined AHP and SAW methods for selecting suitable sites for landfill in Al-Musayiab Qadhaa, Babylon, Iraq. Environ. Earth Sci. 2017, 76, 1–12. [Google Scholar] [CrossRef]
- Chabuk, A.; Al-Ansari, N.; Hussain, H.M.; Knutsson, S.; Pusch, R. Landfill Sites Selection Using Analytical Hierarchy Process and Ratio Scale Weighting: Case Study of Al-Mahawil, Babylon, Iraq. Engineering 2017, 9, 123–141. [Google Scholar] [CrossRef] [Green Version]
- Siddiqui, M.Z.; Everett, J.W.; Vieux, B.E. Landfill Siting Using Geographic Information Systems: A Demonstration. J. Environ. Eng. 1996, 122, 515–523. [Google Scholar] [CrossRef]
- Kara, C.; Doratli, N. Application of GIS/AHP in siting sanitary landfill: A case study in Northern Cyprus. Waste Manag. Res. 2012, 30, 966–980. [Google Scholar] [CrossRef] [PubMed]
- Chang, N.B.; Parvathinathan, G.; Breeden, J.B. Combining GIS with fuzzy multicriteria decision-making for landfill siting in a fast-growing urban region. J. Environ. Manag. 2008, 87, 139–153. [Google Scholar] [CrossRef] [PubMed]
- Lin, H.Y.; Kao, J.J. Enhanced Spatial Model for Landfill Siting Analysis. J. Environ. Eng. 2002, 125, 845–851. [Google Scholar] [CrossRef]
- Wang, G.; Qin, L.; Li, G.; Chen, L. Landfill site selection using spatial information technologies and AHP: A case study in Beijing, China. J. Environ. Manag. 2009, 90, 2414–2421. [Google Scholar] [CrossRef] [PubMed]
- Nas, B.; Cay, T.; Iscan, F.; Berktay, A. Selection of MSW landfill site for Konya, Turkey using GIS and multi-criteria evaluation, Environ. Monit. Assess. 2010, 160, 491–500. [Google Scholar] [CrossRef] [PubMed]
- Chabuk, A.; Al-Ansari, N.; Hussain, H.M.; Knutsson, S.; Pusch, R.; Laue, J. Combining GIS applications and method of multi-criteria decision-making (AHP) for landfill siting in Al-Hashimiyah Qadhaa, Babylon, Iraq. Sustainability 2017, 9, 1392. [Google Scholar] [CrossRef]
- Isalou, A.A.; Zamani, V.; Shahmoradi, B.; Alizadeh, H. Landfill site selection using integrated fuzzy logic and analytic network process (F-ANP). Environ. Earth Sci. 2013, 68, 1745–1755. [Google Scholar] [CrossRef]
- Demesouka, O.; Vavatsikos, A.; Anagnostopoulos, K. GIS-based multicriteria municipal solid waste landfill suitability analysis: A review of the methodologies performed and criteria implemented. Waste Manag. Res. 2014, 32, 270–296. [Google Scholar] [CrossRef] [PubMed]
- Yildirim, V. Application of raster-based GIS techniques in the siting of landfills in Trabzon Province, Turkey: A case study. Waste Manag. Res. 2012, 30, 949–960. [Google Scholar] [CrossRef] [PubMed]
- Gupta, R.; KewalRamani, M.A.; Ralegaonkar, R.V. Environmental Impact Analysis Using Fuzzy Relation for Landfill Siting. J. Urban Plan. Dev. 2003, 129, 121–139. [Google Scholar] [CrossRef]
- Saaty, T.L. The analytic hierarchy process: Planning, priority setting. Resour. Alloc. 1980, 287. [Google Scholar] [CrossRef]
- Alkaradaghi, K.; Ali, S.S.; Al-Ansari, N.; Laue, J. Advances in Remote Sensing and Geo Informatics Applications; Springer Nature: Basel, Switzerland, 2019. [Google Scholar] [CrossRef]
- Rezaei-Moghaddam, K.; Karami, E. A multiple criteria evaluation of sustainable agricultural development models using AHP. Environ. Dev. Sustain. 2008, 10, 407–426. [Google Scholar] [CrossRef]
- Saaty, T.L. A scaling method for priorities in hierarchical structures. J. Math. Psychol. 1977, 15, 234–281. [Google Scholar] [CrossRef]
- Teknomo, K. Analytic hierarchy process (AHP). Meas. Bus. Excell. 2006. [Google Scholar] [CrossRef]
- Sólnes, J. Environmental quality indexing of large industrial development alternatives using AHP. Environ. Impact Assess. Rev. 2003, 23, 283–303. [Google Scholar] [CrossRef]
- Belton, V.; Stewart, T.J. Multiple criteria decision analysis An Integrated Approach; Springe: Berlin/Heidelberg, Germany, 2002. [Google Scholar]
- Chang, C.W.; Wu, C.R.; Lin, C.T.; Lin, H.L. Evaluating digital video recorder systems using analytic hierarchy and analytic network processes. Inf. Sci. 2007, 177, 3383–3396. [Google Scholar] [CrossRef]
- Afshari, A.; Mojahed, M.; Yusuff, R. Simple additive weighting approach to personnel selection problem. Int. J. Innov. Manag. Technol. 2010, 1, 511–515. [Google Scholar] [CrossRef]
- Rawat, J.S.E.; Kumar, M. Monitoring land use/cover change using remote sensing and GIS techniques: A case study of Hawalbagh block, district Almora, Uttarakhand, India, Egypt. J. Remote Sens. Sp. Sci. 2015, 18, 77–84. [Google Scholar] [CrossRef]
Figure 1.
Location map of the study area.

Figure 2.
Hierarchical scheme of the decision process for landfill site selection.

Figure 3.
Suitability Index Maps: (A) Rivers; (B) Roads; (C) Elevation; (D) Urban area; (E) Soil types; (F) Slope.
Figure 3.
Suitability Index Maps: (A) Rivers; (B) Roads; (C) Elevation; (D) Urban area; (E) Soil types; (F) Slope.

Figure 4.
Suitability Index Maps: (A) Power lines; (B) Archaeological site; (C) Oil and gas field; (D) Villages; (E) Geological formations; (F) Land use classification.
Figure 4.
Suitability Index Maps: (A) Power lines; (B) Archaeological site; (C) Oil and gas field; (D) Villages; (E) Geological formations; (F) Land use classification.

Figure 5.
Suitability Index Map of Groundwater depth.

Figure 6.
Criteria weighting of MCDM methods AHP, SAW, SRS and RSW.

Figure 7.
Suitability index map with area using multi-criteria decision-making (MCDM) methods (A–D).
Figure 7.
Suitability index map with area using multi-criteria decision-making (MCDM) methods (A–D).

Figure 8.
Multi-criteria decision-making (MCDM) methods comparison in the suitability index areas.

Figure 9.
Overlay map of all MCDM methods matching and non-matching suitability index area.

Figure 10.
Candidate solid waste sites according to intersection of suitability area using multi-criteria decision-making (MCDM) methods.
Figure 10.
Candidate solid waste sites according to intersection of suitability area using multi-criteria decision-making (MCDM) methods.


Table 1.
Source of the criteria map.
| No. | Criteria Map | Source |
|---|---|---|
| 1. | Rivers | United States Geological Survey USGS Earth Explorer. |
| 2. | Roads | United States Geological Survey USGS Earth Explorer and elevation map. |
| 3. | Elevation | United States Geological Survey USGS Earth Explorer Digital Elevation Model (DEM) with 30 m pixel size. |
| 4. | Urban area | Digitized from Ministry of Municipality and converted into shape files. |
| 5. | Soil type | Ministry of Agriculture—Iraq, Map scale 1:1,000,000. |
| 6. | Slope | Digital Elevation Model (DEM) converted to slope map using GIS. |
| 7. | Powerline | United Nations Office for the Coordination of Humanitarian Affairs—UNOCHA HIC Iraq, Map scale 1:40,000. |
| 8. | Archaeological sites | Kurdistan region—Iraq, Ministry of municipality and tourism General board of tourism, Map scale 1:250,000. |
| 9. | Oil and Gas Field | Ministry of Natural Resources Kurdistan Regional Government, Map scale 1: 250,000. |
| 10. | Villages | United nations office for the coordination of humanitarian affairs UNOCHA, Map scale 1:40000. |
| 11. | Land Use | USGS earth explorer, Landsat 8 Operational Land Imager (OLI.) |
| 12. | Geological Formations | Ministry of Industry and Minerals—Iraq, State Company of Geological Survey and Mining, Map scale 1:250,000. |
| 13. | Depth to groundwater level | Groundwater Directorate in Sulaimaniyah. |
Table 2.
Exclusionary criteria and suggested buffering values of the study area.
| No. | Criteria | Exclusionary Criteria (Buffer Zone) | Researchers’ Suggestion |
|---|---|---|---|
| 1. | Rivers | 1 km | [15,35,49] |
| 2. | Roads | 500 m | [18,50,51,52,53] |
| 3. | Elevation | Exclude 1350–2100 m | [23,52,54,55] |
| 4. | Urban area | 5 km | [18,44,53,54] |
| 5. | Soil types | Exclude high permeable soil | [15,43] |
| 6. | Slope | Exclude areas 15–50 degree | [36,52,53,54] |
| 7. | Powerline | 30 m | [27,56] |
| 8. | Archaeological sites | 1 km | [21,22,57] |
| 9. | Oil and Gas Field | 5 km | [10,26] |
| 10. | Villages | 1 km | [27,46] |
| 11. | Geological Formations | Exclude faults | [13,27,38,42] |
| 12. | Land use | Exclude agriculture, water body, build up, airport and industrial area | [12,15] |
| 13. | Depth to groundwater level | Exclude water depth 19–35 m | [36,52,54] |
Table 3.
Layers buffer zone with sub-criteria ratings.
| No. | Criteria | Sub-Criteria and Buffer Zone | Rating Values | No. | Criteria | Sub-Criteria and Buffer Zone | Rating Values |
|---|---|---|---|---|---|---|---|
| 1 | Rivers (km) (A) | 0–1 | 0 | 2 | Roads (km) (B) | 0–0.5 | 0 |
| 0.5–1 | 7 | ||||||
| >1 | 10 | 1–2 | 10 | ||||
| 2–3 | 5 | ||||||
| >3 | 3 | ||||||
| 3 | Elevation (a.m.s.l) (C) | 1350–2100 | 2 | 4 | Urban area (km) (D) | 0–5 | 0 |
| 1100–1350 | 4 | 5–10 | 3 | ||||
| 920–1100 | 6 | 10–15 | 5 | ||||
| 500–750 | 8 | 15–20 | 7 | ||||
| 750–920 | 10 | >20 | 10 | ||||
| 5 | Soil types (E) | S33 | 4 | 6 | Slope (degree) (F) | 15–50 | 4 |
| S37 | 6 | 10–15 | 6 | ||||
| S38 | 8 | 5–10 | 8 | ||||
| S39 | 10 | 0–5 | 10 | ||||
| 7 | Power lines (m) (G) | 0–30 | 0 | 8 | Archaeological site (km) (H) | 0–1 | 0 |
| >30 | 10 | 1–3 | 5 | ||||
| >3 | 10 | ||||||
| 9 | Oil and Gas Field (Km) (I) | 0–5 | 0 | 10 | Villages (km) (J) | 0–1 | 0 |
| >5 | 10 | >1 | 10 | ||||
| 11 | Geological Formations (K) | Fault G1 | 0 | 12 | Land Use (L) | Airport | 0 |
| D1 | 2 | Build up | 0 | ||||
| E2 | 3 | Water body | 0 | ||||
| F1 | 4 | Factories & Industrial area | 0 | ||||
| C4 | 6 | Agriculture & fertile land | 0 | ||||
| B4 | 8 | Non-fertile agriculture land | 0 | ||||
| A3 | 10 | Forest | 5 | ||||
| Pasture | 8 | ||||||
| Rock | 10 | ||||||
| Unused Land | 10 | ||||||
| 13 | Depth to groundwater level (m) (M) | 19–35 | 2 | ||||
| 35–50 | 4 | ||||||
| 50–65 | 6 | ||||||
| 65–80 | 8 | ||||||
| 80–280 | 10 | ||||||
Note: (a.m.s.l.) is above mean sea level.
| Numerical Value | Definition |
|---|---|
| 1 | Equal importance |
| 2 | Equal to moderate importance |
| 3 | Moderate importance |
| 4 | Moderate to strong importance |
| 5 | Strong importance |
| 6 | Strong to very strong importance |
| 7 | Very strong importance |
| 8 | Very to extremely strong importance |
| 9 | Extreme importance |
| n | 1 | 2 | 3 | 4 | 5 | 6 | 7 | 8 | 9 | 10 | 11 | 12 | 13 |
| RI | 0 | 0 | 0.58 | 0.9 | 1.12 | 1.24 | 1.32 | 1.41 | 1.45 | 1.49 | 1.51 | 1.48 | 1.56 |
Table 6.
Pairwise comparison matrix for selecting a suitable landfill location.
| A | B | C | D | E | F | G | H | I | J | K | L | M | Eg | Pr | λmax | |
|---|---|---|---|---|---|---|---|---|---|---|---|---|---|---|---|---|
| A | 1 | 2 | 2 | 3 | 4 | 4 | 5 | 5 | 6 | 6 | 7 | 8 | 9 | 4.08 | 0.22 | 0.86 |
| B | 0.50 | 1 | 1 | 2 | 3 | 3 | 4 | 4 | 5 | 5 | 6 | 7 | 8 | 2.94 | 0.16 | 1.02 |
| C | 0.50 | 1.00 | 1 | 2 | 3 | 3 | 4 | 4 | 5 | 5 | 6 | 7 | 8 | 2.94 | 0.16 | 1.02 |
| D | 0.33 | 0.50 | 0.5 | 1 | 2 | 2 | 3 | 3 | 4 | 4 | 5 | 6 | 7 | 2.03 | 0.11 | 1.16 |
| E | 0.25 | 0.33 | 0.33 | 0.50 | 1 | 1 | 2 | 2 | 3 | 3 | 4 | 5 | 6 | 1.37 | 0.07 | 1.20 |
| F | 0.25 | 0.33 | 0.33 | 0.50 | 1 | 1 | 2 | 2 | 3 | 3 | 4 | 5 | 6 | 1.37 | 0.07 | 1.20 |
| G | 0.20 | 0.25 | 0.25 | 0.33 | 0.50 | 0.50 | 1 | 1 | 2 | 2 | 3 | 4 | 5 | 0.90 | 0.05 | 1.15 |
| H | 0.20 | 0.25 | 0.25 | 0.33 | 0.50 | 0.50 | 1.00 | 1 | 2 | 2 | 3 | 4 | 5 | 0.90 | 0.05 | 1.15 |
| I | 0.17 | 0.20 | 0.20 | 0.25 | 0.33 | 0.33 | 0.50 | 0.50 | 1 | 1 | 2 | 3 | 4 | 0.59 | 0.03 | 1.05 |
| J | 0.17 | 0.20 | 0.20 | 0.25 | 0.33 | 0.33 | 0.50 | 0.50 | 1 | 1 | 2 | 3 | 4 | 0.59 | 0.03 | 1.05 |
| K | 0.14 | 0.17 | 0.17 | 0.20 | 0.25 | 0.25 | 0.33 | 0.33 | 0.50 | 0.50 | 1 | 2 | 3 | 0.41 | 0.02 | 0.96 |
| L | 0.13 | 0.14 | 0.14 | 0.17 | 0.20 | 0.20 | 0.25 | 0.25 | 0.33 | 0.33 | 0.50 | 1 | 2 | 0.29 | 0.02 | 0.87 |
| M | 0.11 | 0.13 | 0.13 | 0.14 | 0.17 | 0.17 | 0.20 | 0.20 | 0.25 | 0.25 | 0.33 | 0.5 | 1 | 0.22 | 0.01 | 0.80 |
(A): Urban area; (B): Villages; (C): Rivers; (D): Groundwater depth; (E): Slope; (F): Elevation; (G): Soil types; (H): Geological formations; (I): Roads; (J): Oil and gas field; (K): Land use classification (L): Archaeological site; (M): Power lines. Eg = eigenvalue, Pr weight = Priority vectors weights and λmax = maximum lambda.
Table 7.
Criteria weighting based on multi-criteria decision-making methods (AHP, SAW, SRS and RSW).
Table 7.
Criteria weighting based on multi-criteria decision-making methods (AHP, SAW, SRS and RSW).
| No. | Criteria | AHP Weight | SAW Weight | RSW Weight | SRS Weight |
|---|---|---|---|---|---|
| 1. | Urban area | 0.219 | 0.124 | 0.140 | 0.143 |
| 2. | Villages | 0.158 | 0.111 | 0.126 | 0.132 |
| 3. | Rivers | 0.158 | 0.111 | 0.119 | 0.121 |
| 4. | Groundwater | 0.109 | 0.099 | 0.105 | 0.110 |
| 5. | Slope | 0.074 | 0.086 | 0.084 | 0.099 |
| 6. | Elevation | 0.074 | 0.086 | 0.084 | 0.088 |
| 7. | Soil | 0.048 | 0.074 | 0.070 | 0.077 |
| 8. | Geology | 0.048 | 0.074 | 0.070 | 0.066 |
| 9. | Road | 0.032 | 0.062 | 0.056 | 0.055 |
| 10. | Oil and Gas | 0.032 | 0.062 | 0.056 | 0.044 |
| 11. | Land use | 0.022 | 0.049 | 0.042 | 0.033 |
| 12. | Archaeology | 0.016 | 0.037 | 0.028 | 0.022 |
| 13. | Power lines | 0.012 | 0.025 | 0.021 | 0.011 |
| Sum | 1 | 1 | 1 | 1 | |
AHP: analytical hierarchy process, SRS: Straight Rank Sum Method, RSW: Ratio Scale Weighting, SAW: Simple Addictive Weighing Method.
© 2019 by the authors. Licensee MDPI, Basel, Switzerland. This article is an open access article distributed under the terms and conditions of the Creative Commons Attribution (CC BY) license (http://creativecommons.org/licenses/by/4.0/).
Share and Cite
MDPI and ACS Style
Alkaradaghi, K.; Ali, S.S.; Al-Ansari, N.; Laue, J.; Chabuk, A. Landfill Site Selection Using MCDM Methods and GIS in the Sulaimaniyah Governorate, Iraq. Sustainability 2019, 11, 4530. https://0-doi-org.brum.beds.ac.uk/10.3390/su11174530
AMA Style
Alkaradaghi K, Ali SS, Al-Ansari N, Laue J, Chabuk A. Landfill Site Selection Using MCDM Methods and GIS in the Sulaimaniyah Governorate, Iraq. Sustainability. 2019; 11(17):4530. https://0-doi-org.brum.beds.ac.uk/10.3390/su11174530
Chicago/Turabian StyleAlkaradaghi, Karwan, Salahalddin S. Ali, Nadhir Al-Ansari, Jan Laue, and Ali Chabuk. 2019. "Landfill Site Selection Using MCDM Methods and GIS in the Sulaimaniyah Governorate, Iraq" Sustainability 11, no. 17: 4530. https://0-doi-org.brum.beds.ac.uk/10.3390/su11174530
Note that from the first issue of 2016, this journal uses article numbers instead of page numbers. See further details here.