Article

Urban Expansion and the Loss of Prairie and Agricultural Lands: A Satellite Remote-Sensing-Based Analysis at a Sub-Watershed Scale

1
Department of History, Sociology, Geography & GIS, Tarleton State University, Stephenville, TX 76401, USA
2
Department of Earth & Environmental Sciences, University of Missouri-Kansas City, Kansas City, MO 64110, USA
*
Author to whom correspondence should be addressed.
Sustainability 2019, 11(17), 4673; https://0-doi-org.brum.beds.ac.uk/10.3390/su11174673
Submission received: 26 July 2019 / Revised: 21 August 2019 / Accepted: 23 August 2019 / Published: 28 August 2019
(This article belongs to the Section Sustainable Urban and Rural Development)

Abstract

:
Prairies or grasslands together with areas designated as agricultural lands are one of the largest types of land cover and land use that exist today. While prairies provide habitat to a wide variety of animals and organisms, and agricultural lands support human populations, these lands, especially those in the immediate vicinities of large urban areas, are giving way to urbanization at alarming rates. In particular, prairies are often viewed as wastelands because their benefit to the effective functioning of the urban ecosystem is often not fully understood. On the other hand, many agricultural lands are being converted for several urban uses because of the high economic returns from their sale. In this study, we classified SPOT (Satellite Pour l’Observation de la Terre) satellite data of the study area using the supervised maximum likelihood classification approach in order to investigate the loss of prairies and agricultural lands due to urban expansion in six sub-watersheds in the Kansas City metropolitan area of the States of Kansas and Missouri in the U.S. Based on the classified maps, we computed the magnitude and rate of urban expansion, and the proportion of loss in prairies and agricultural lands that was a result of urban expansion. Results from the 22-year study revealed that in all six sub-watersheds, agricultural lands and grassland were depleted at alarming rates with no sustainable effort to conserve them. These results provide baseline information that can support a data-driven and sustainable path for urban expansion in the examined sub-watersheds.

1. Introduction

Urban expansion is not new, neither is its effect on various ecosystems and land cover types. However, the alarming rates at which these lands are converted for urban uses require a deeper understanding of the conversion processes, especially when examined at small scales, such as the sub-watershed scale, which have not been studied in depth [1,2]. The ability to carry out this assessment at smaller scale will provide the opportunity to investigate urban expansion impacts that would have been lost when examined at larger scales. Rapid urban expansion in different parts of the world has led to significant changes on the types of land use and cover, including agricultural lands [3,4] and grasslands or prairie [5,6]. Urban expansion presents extreme problems to prairie and agricultural lands in the immediate vicinities of large urban areas. In particular, the conversion of farmlands near cities for other human uses is a global trend that challenges our long-term capacity to provide food, fiber, and ecosystem services to a growing world population [7], increasingly living in major cities around the world [2]. It is estimated that the population living in urban areas has increased from 30% in the 1950s to 54% in 2014 [8], with a projected increase to over 65% by 2050 [9]. This growth will continue to put pressure on the urban ecosystem, including grass and agricultural lands. Although most people recognize the effects that growing scarcity of fossil fuels and water will have on agriculture, there is less awareness of the impact of other factors such as loss of prime agricultural land and prairie on other human pursuits [10]. There is even less concern among the general population about essential ecosystem services that are provided by farmland and natural areas, such as providing clean water, reducing soil erosion, mitigating the impact of severe weather, preserving biodiversity, and maintaining open land for recreation [10], which support the effective functioning of the urban ecosystem. Thus, many even consider these lands, especially prairie, as wastelands. The conversion of agricultural lands for other urban uses tends to be very attractive in the short term because of the high economic returns from the sale of these lands, and the general perception that increased urbanization is a good index of economic growth. However, in the long term, these attractive benefits will present a challenge to future food production and ecosystem services that should support urban life.
Land is a basic resource for the survival and continued expansion of cities [11]. Nevertheless, as cities continue to expand, more units of land are converted from their natural state into urban areas. This process will eventually lead to land-use-related problems, which may include the development into a non-contiguous or “leapfrog” pattern or conversion from native land cover to designed land cover [12], including the introduction of non-native invasive species. Many case studies already exist on how urbanization has led to ecosystem degradation and loss of ecosystem services [13], especially provisioning services [14], which are mostly provided by prairies. Therefore, understanding urban expansion processes at a local scale and their impact on other types of land use that provide support for the urbanization process will help us cope with the emerging problems associated with urban development, and to ensure both environmental and socio-economic sustainability for the ever-growing urban population [15].
Urban expansion takes place through different forms: the redevelopment of built-up areas at higher densities, the infill of remaining open spaces in already built-up areas, or the development of greenbelt land around cities [16]. While urban expansion may take different forms across different cities across the globe as a result of differences in socio-economic, cultural, historical, and environmental conditions, as well as preferences [17], its effects on the natural and urban agricultural lands are similar, namely, mostly loss in grass/agricultural lands and ecosystem fragmentation. As a result, many rapidly urbanizing communities are struggling with the question of whether or not the loss of agricultural lands and the ecosystem degradation are inevitable in the expansion of their cities [7]. While many communities in the U.S. and Europe may be able to marginally balance expanding populations and commerce with a desire to maximize the remaining open space [7], other less developed regions of the world may suffer a huge direct loss of these lands [18]. This situation will eventually affect their ability to produce food [
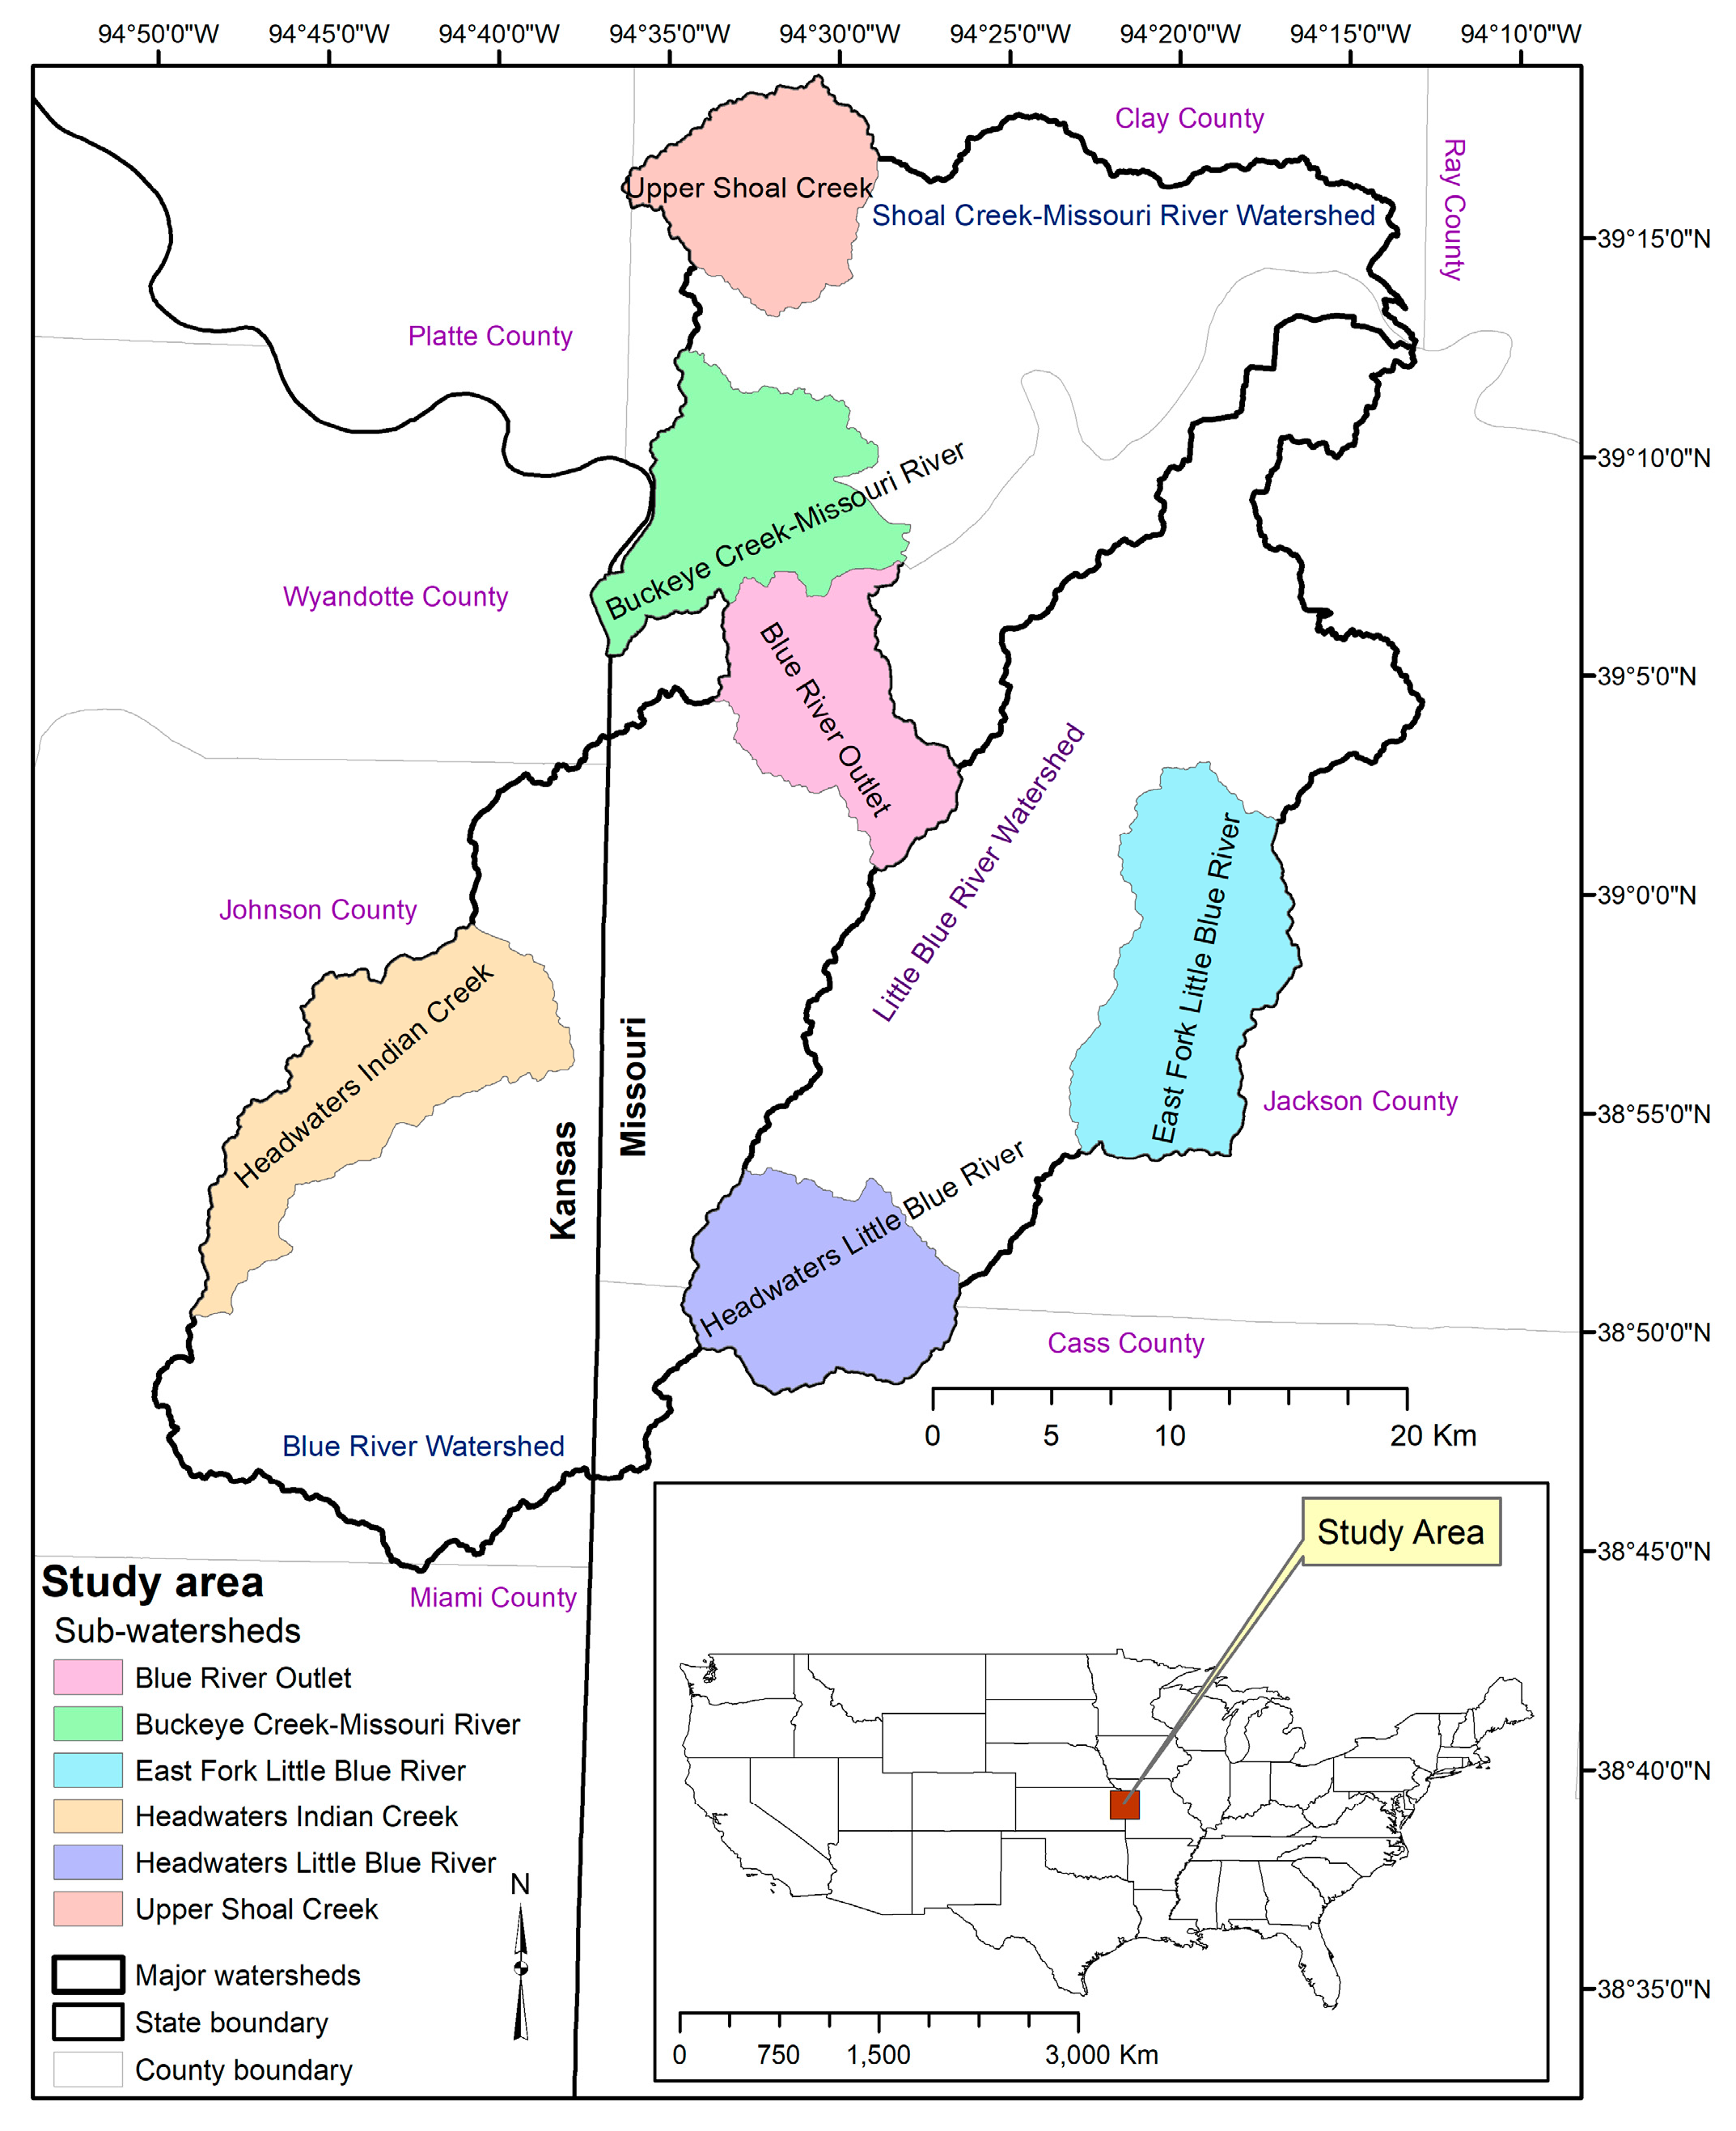
19] and maintain urban ecosystem health. However, for U.S. cities to achieve this balance, we must strive to understand the historical urban expansion processes that account for these effects. This will ultimately serve as a tool for balancing an expanding urban population with the sustainability of the natural environment and urban agricultural lands. As part of broader efforts to achieve this balance, this study identified one of the major sprawling cities in the U.S., namely, Kansas City [20], which lies in both Missouri and Kansas States. The goal was to assess the impact of urban expansion on the loss of prairie and agricultural lands in six sub-watersheds in the study area between 1992 and 2014, using SPOT satellite images. SPOT imagery is a product of remote sensing that is commonly used for studying urban growth [2,6,21,22]. SPOT satellite images are often preferred for this type of application because of their relatively higher spatial resolution when compared with products of similar medium resolution satellites, which allows for easier separation of feature categories during the classification process. Hence, SPOT imagery was adopted in this study.

2. Materials and Methods

2.1. Study Area

The Kansas City metropolitan area is a 14-county metropolitan area, anchored by Kansas City, Missouri, and straddling the border between the states of Missouri and Kansas. It is the second largest metropolitan area in Missouri after Greater St. Louis, and the largest with territory in Kansas, ahead of Wichita [23]. It has a total area of 20,596 km2 and a population of 2,343,008 [24], implying 100 people per square kilometer. With rapid urbanization, the area has witnessed significant population growth, with an estimated growth rate of about 11.3% between 2000 and 2010 [24]. The region’s employment is projected to grow from 1.0 million in 2010 to 1.3 million in 2040 [24]. This has led to urban sprawl, well described in previous research [20]. Kansas City metropolitan area is located in the wooded Osage Plains ecoregion, with natural vegetation that is a mosaic of oak-hickory woodland and bluestem prairie [25]. Six major sub-watersheds in the study area were identified for this study, namely, Upper Shoal Creek, Buckeye Creek-Missouri-River, Blue River Outlet, East Fork Little Blue River, Headwaters Indian Creek, and Headwaters Little Blue River.

2.2. Data Processing

In this study, we classified two SPOT satellite images (Table 1) that were used for conducting a change analysis between 1992 and 2014 in the six sub-watersheds constituting our study area (Figure 1). However, each sub-watershed was extracted from the classified maps to facilitate a sub-watershed scale analysis. The process involved initial and later images that determined the time-period for change analysis. The availability and accessibility of SPOT satellite images of the study area dictated the choice of image dates used in this study. Although we did not observe any direct negative impact of image date (months) variation on the results of our analysis, we believe it is important to report this possible limitation due to seasonal phenological changes between the two image dates.
The study used the 1992 image (with a spatial resolution of 20 m) as the initial year image and the 2014 image (with a spatial resolution of 10 m) as the final year image. For uniformity when carrying out the change analysis, the 2014 image was resampled from 10 m to 20 m using the nearest neighbor resampling technique. The study adopted four categories of land cover types, providing a general description of the landscape under study: impervious surfaces, farmlands/grasslands, forestlands, and wetlands (Table 2). The purpose was to later extract urban areas, agricultural lands, and grasslands from the classified maps in order to achieve the goal of this study. Because of the similarity in the spectral signatures of both agricultural lands and grasslands, we experienced some problems related to mixed classes; therefore, both classes were combined. Impervious surfaces were later used as urbanized areas in the six sub-watersheds.

2.3. Methodology

Image Classification and Accuracy Assessment

The SPOT satellite images used in this study were classified into four broad categories using the classification scheme in Table 2. The maximum likelihood (ML) classification approach, popularly used for thematic mapping with satellite multispectral imagery [26,27], was used to achieve this. This study used high-resolution images from Google Earth as reference images to conduct accuracy assessments on the classified maps (Table 3). The use of high-resolution images from Google Earth as reference maps when conducting accuracy assessment of classified images has been recommended as “good practice” in the literature [28]. Accuracy assessment ensures the usefulness and effectiveness of the classified maps [26]. Stratified random sampling, which typically satisfies most accuracy and area estimation objectives [28], was employed. This ensures that all the classes are properly represented in the sample. Using the stratified random sampling approach, we selected 250 reference points for each of the images classified. The six images were combined for this purpose. Table 4 reports the percent size of the land cover categories in each sub-watershed.

2.4. Analysis of Urban Expansion in Study Area (Six Sub-Watersheds)

Using the classified land use/land cover (LULC) maps, urbanized areas (represented by impervious surfaces) were extracted from the images of each sub-watershed for the years 1992 and 2014. Two measures of expansion were calculated from the results: rate of urban expansion and percent change in urban growth. However, in order to calculate these measures, we first quantified the size of urbanized areas in each of the sub-watersheds for each year (Table 5). The purpose was to detect change in the size of the urbanized areas in order to calculate the rate of urban growth and the proportion of loss in grassland/farmlands that was due to urbanization.

2.4.1. Percent Change in Urban Expansion

The temporal change in urban expansion between 1992 and 2014 was computed using Equation (1) modified after Fenta et al. [2]:
% UE = A 2 A 1 A 1 × 100
where A is the area coverage of urbanized areas at a given time.

2.4.2. Rate of Urban Expansion

The rate at which land is used for urbanized purposes in each sub-watershed was computed using Equation (2), modified after Xiao et al. [29] and Fenta et al. [4]:
RUE = ( B U A ) i + n ( B U A ) i n × ( B U A ) i   × 100    
where B U A i + n and B U A i represent urbanized area in hectares at time i + n and i, respectively, and n is the interval of the calculating period (in years).

2.5. Dynamics of Agricultural Land/Grassland Loss in the Six Sub-Watersheds

We examined the dynamics of agricultural land/grassland loss in the six sub-watersheds in order to determine and quantify the amount of loss to urban expansion. Two aspects of loss were examined: percent change in agricultural land/grassland (mostly loss) and percentage of agricultural land/grassland loss that was a result of urban expansion. In order to calculate these, a post-classification land use/land cover change analysis was conducted for each sub-watershed during the study period. A post-classification change analysis, widely used for change detection analysis, such as in Fenta et al. [2], reduces the possible effects of spectral resolution and sensor differences between multi-spectral images [30]. The change detection was conducted using a matrix analysis. The matrix analysis approach combines two thematic layers in which the output layer contains a separate class for every combination of two input classes. Output classes are assigned according to the coincidence of any two input classes [31]. The result here was a matrix showing all the classes that gained from a particular land use/land cover class, and all the classes that lost to this land use/land cover class. The proportion of agricultural land/grassland loss that was a result of urban expansion was derived from the result of this matrix. Equation (3) was used to derive the percent change in agricultural land/grassland and Equation (4) to calculate the proportion of agricultural land/grassland loss that was a result of urban expansion:
% AG = S t 2 S t 1 S t 1 × 100
where S is the size of agricultural land/grassland in hectares at a given time;
P = L T × 100
where P is the proportion of agricultural land/grassland loss that was a result of urban expansion (reported in percentage), L is the size of agricultural land/grassland loss that was a result of urban expansion in each sub-watershed (reported in ha), and T is the total size of agricultural land/grassland loss in each sub-watershed (reported in ha).

3. Results

3.1. Accuracy Assessment

The LULC maps produced by classifying the SPOT satellite images for the six sub-watersheds are shown in Figure 2, Figure 3, Figure 4, Figure 5, Figure 6 and Figure 7. The accuracy assessment for each year is reported in Table 3. While the producer’s and user’s accuracies of the classified maps are approximately within the range of 86% and 97% (except for wetlands in 2014), the overall classification accuracies for both years are above 90%, which is consistent with what is considered acceptable in the literature [2,28], and the land cover maps were therefore used for analysis in this study.

3.2. Change in LULC for the Six Sub-Watersheds

Table 4 reveals the percent size of LULC in each sub-watershed between 1992 and 2014. Although the focus of this study is on urban expansion and the loss of agricultural land/grasslands, changes in the other LULC categories are discussed briefly in Section 4. However, as shown in Table 4, agricultural land/grasslands had the highest percent size in all six sub-watersheds, except in the Blue Creek-Missouri River sub-watershed, which had urbanized areas (denoted by impervious surfaces) with the highest percent size. Agricultural lands reduced considerably from about 80% to 50.45% in the Blue River Outlet sub-watershed between 1992 and 2014. This sub-watershed had the highest loss in agricultural land/grassland between 1992 and 2014. Figure 2, Figure 3, Figure 4, Figure 5, Figure 6 and Figure 7 are a pictorial representation of the land cover types and how they changed throughout the study period.

3.3. Urban Expansion and Loss of Agricultural Land/Grassland in the Six Sub-Watersheds

Urbanization took place at an alarming rate between 1992 and 2014 in the six sub-watersheds. Table 5 and Table 6 show the rate of urban expansion and the percent increase in urbanized areas in all six sub-watersheds, respectively. In the Headwaters Indian Creek, for instance, urbanized areas increased from 1710.96 ha to 3868.80 ha, which is a 126% growth within a 22-year period.
With a 16.8 growth rate, the East Fork Little Blue River sub-watershed experienced the highest growth rate, followed by the Upper Shoal Creek-Missouri River, with a growth rate of 14.4. The Blue River Outlet sub-watershed experienced the lowest growth rate (5.5), followed by the Headwaters Indian Creek and Buckeye Creek-Missouri River sub-watersheds. Despite this, the proportion of loss in agricultural lands and grasslands that was a result of urban expansion was highest in the Buckeye Creek-Missouri River, followed by the Headwaters Indian Creek sub-watersheds.
Table 6 shows the result of the change analysis for urbanized areas and agricultural land/grassland between 1992 and 2014. The table reveals that East Fork Little Blue River sub-watershed experienced the most growth, followed by Upper Shoal Creek-Missouri River. However, in terms of agricultural land/grassland loss, the Headwaters Indian Creek experienced the highest loss, with about 97% of this loss due to urban expansion, as shown in Table 7. Most of the loss in agricultural land/grassland in the Buckeye Creek-Missouri River sub-watershed was due to urban expansion (Table 7).

4. Discussion

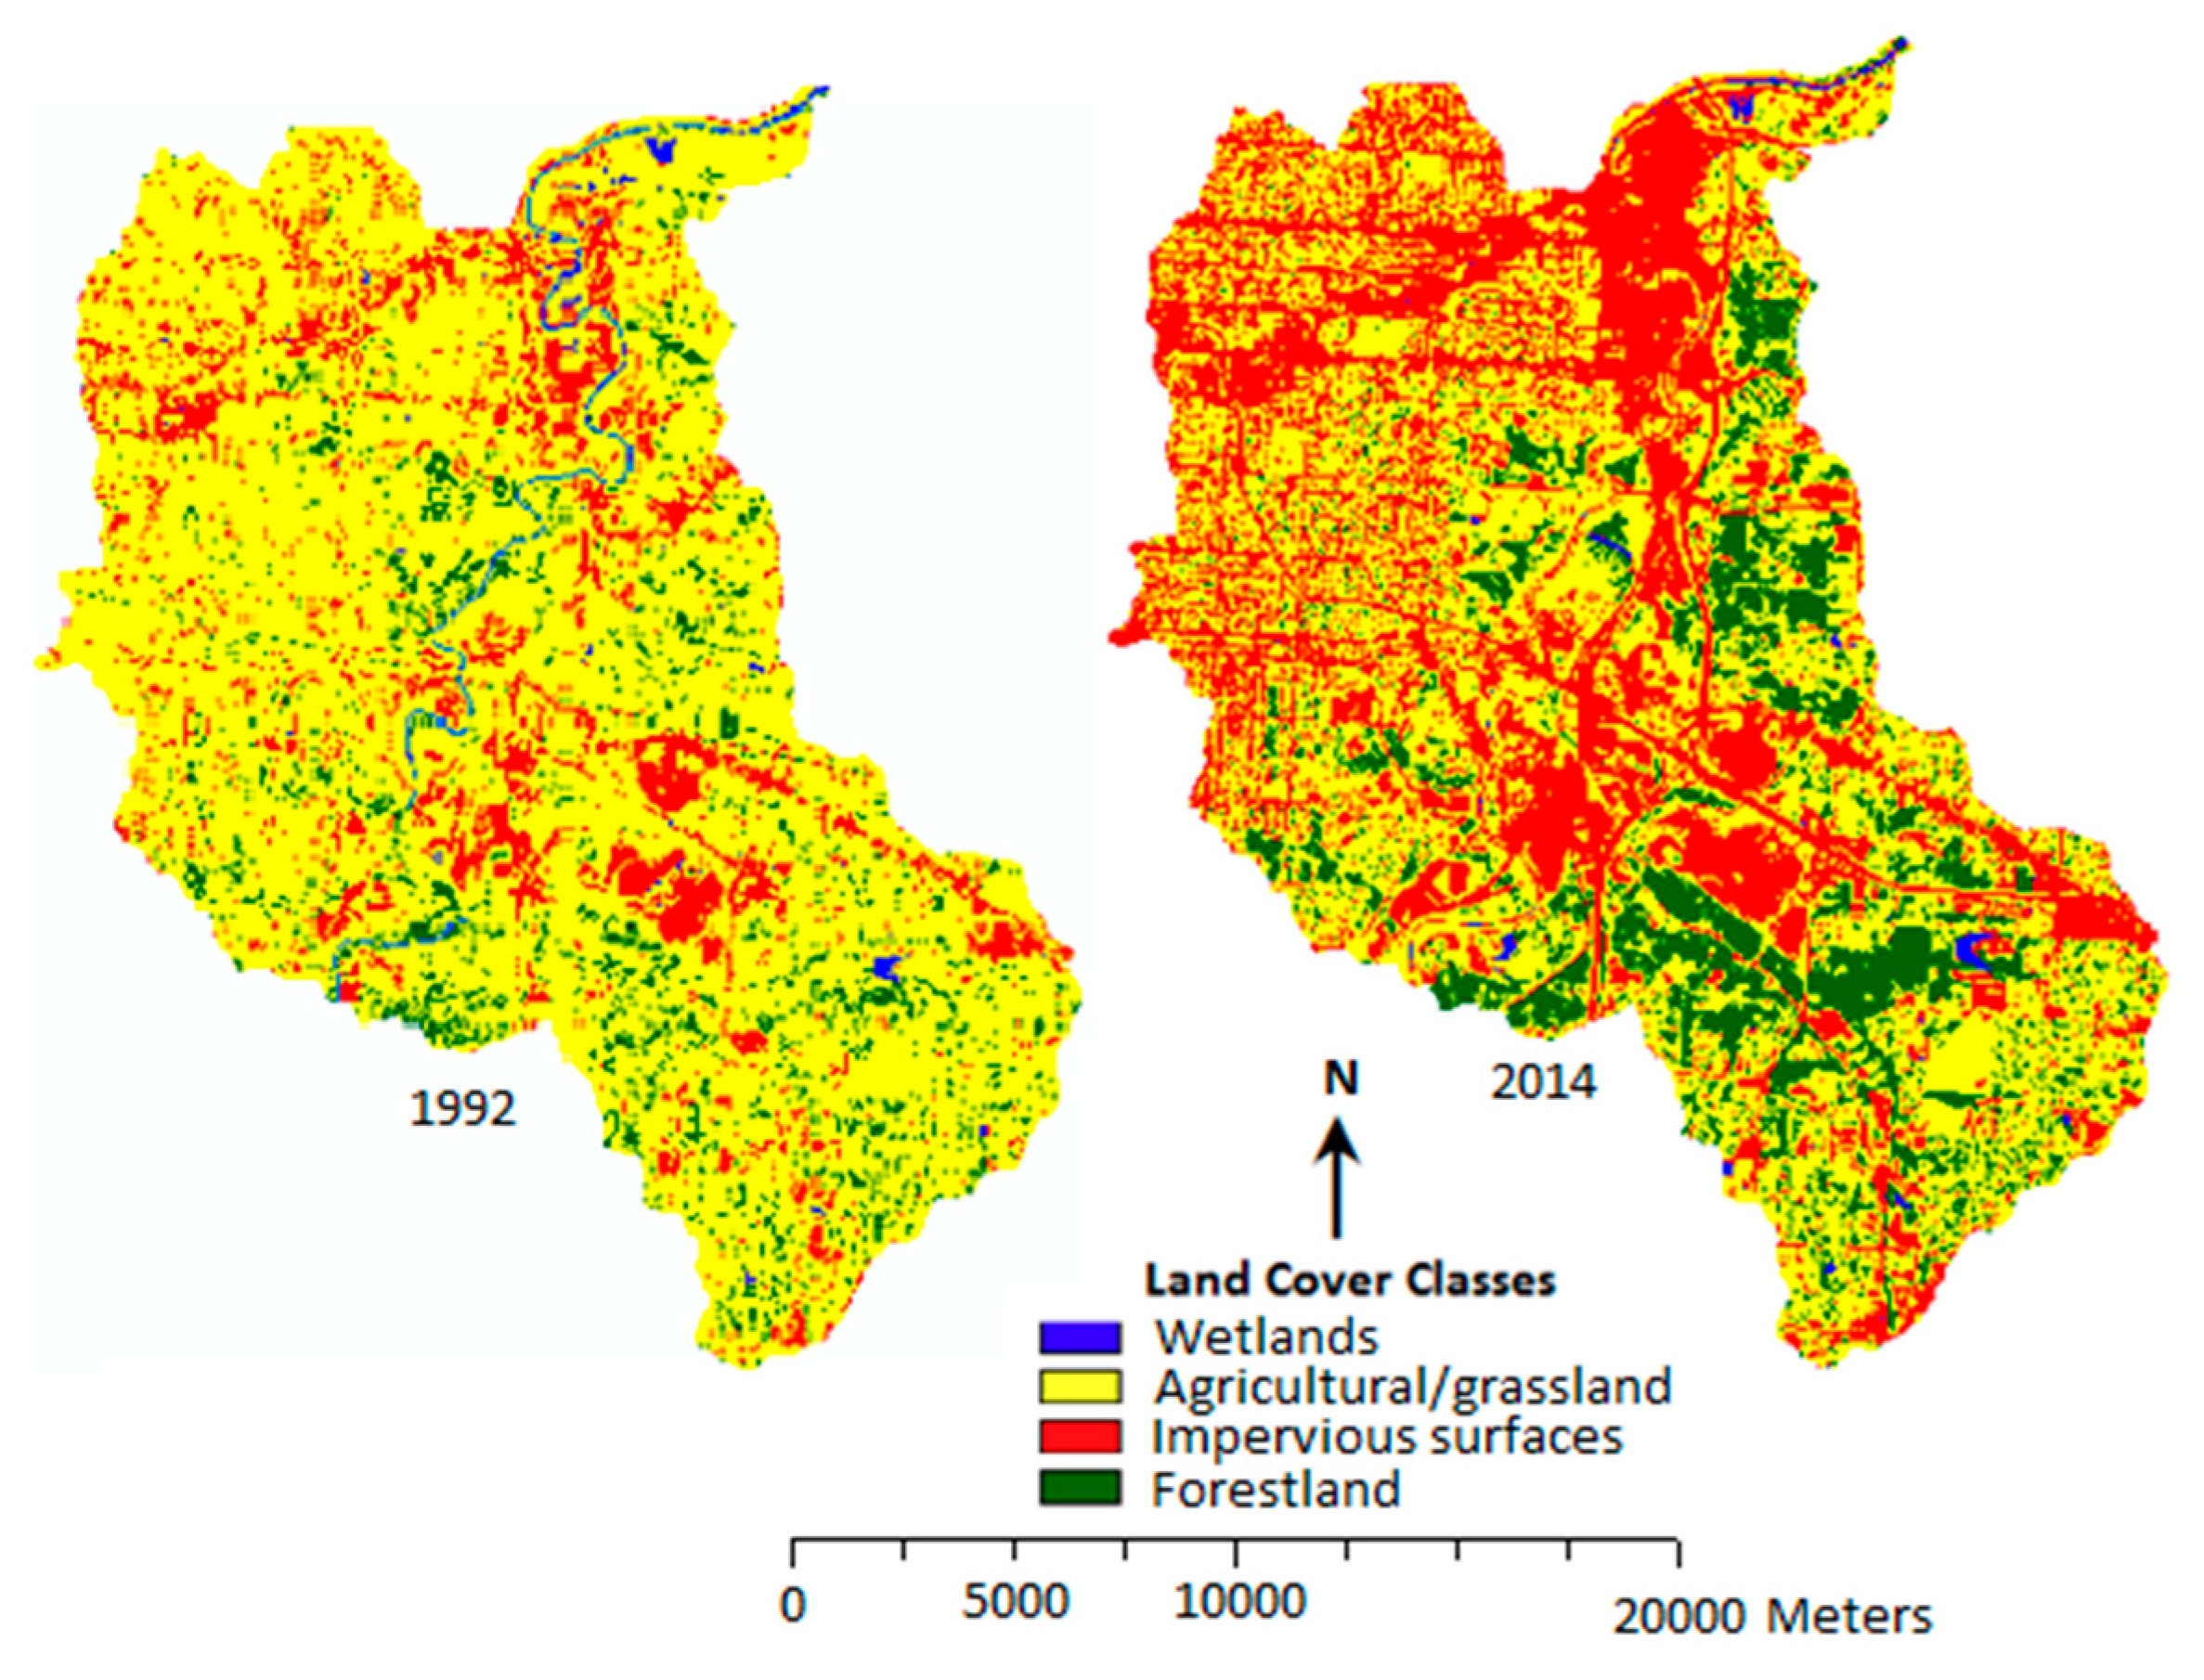
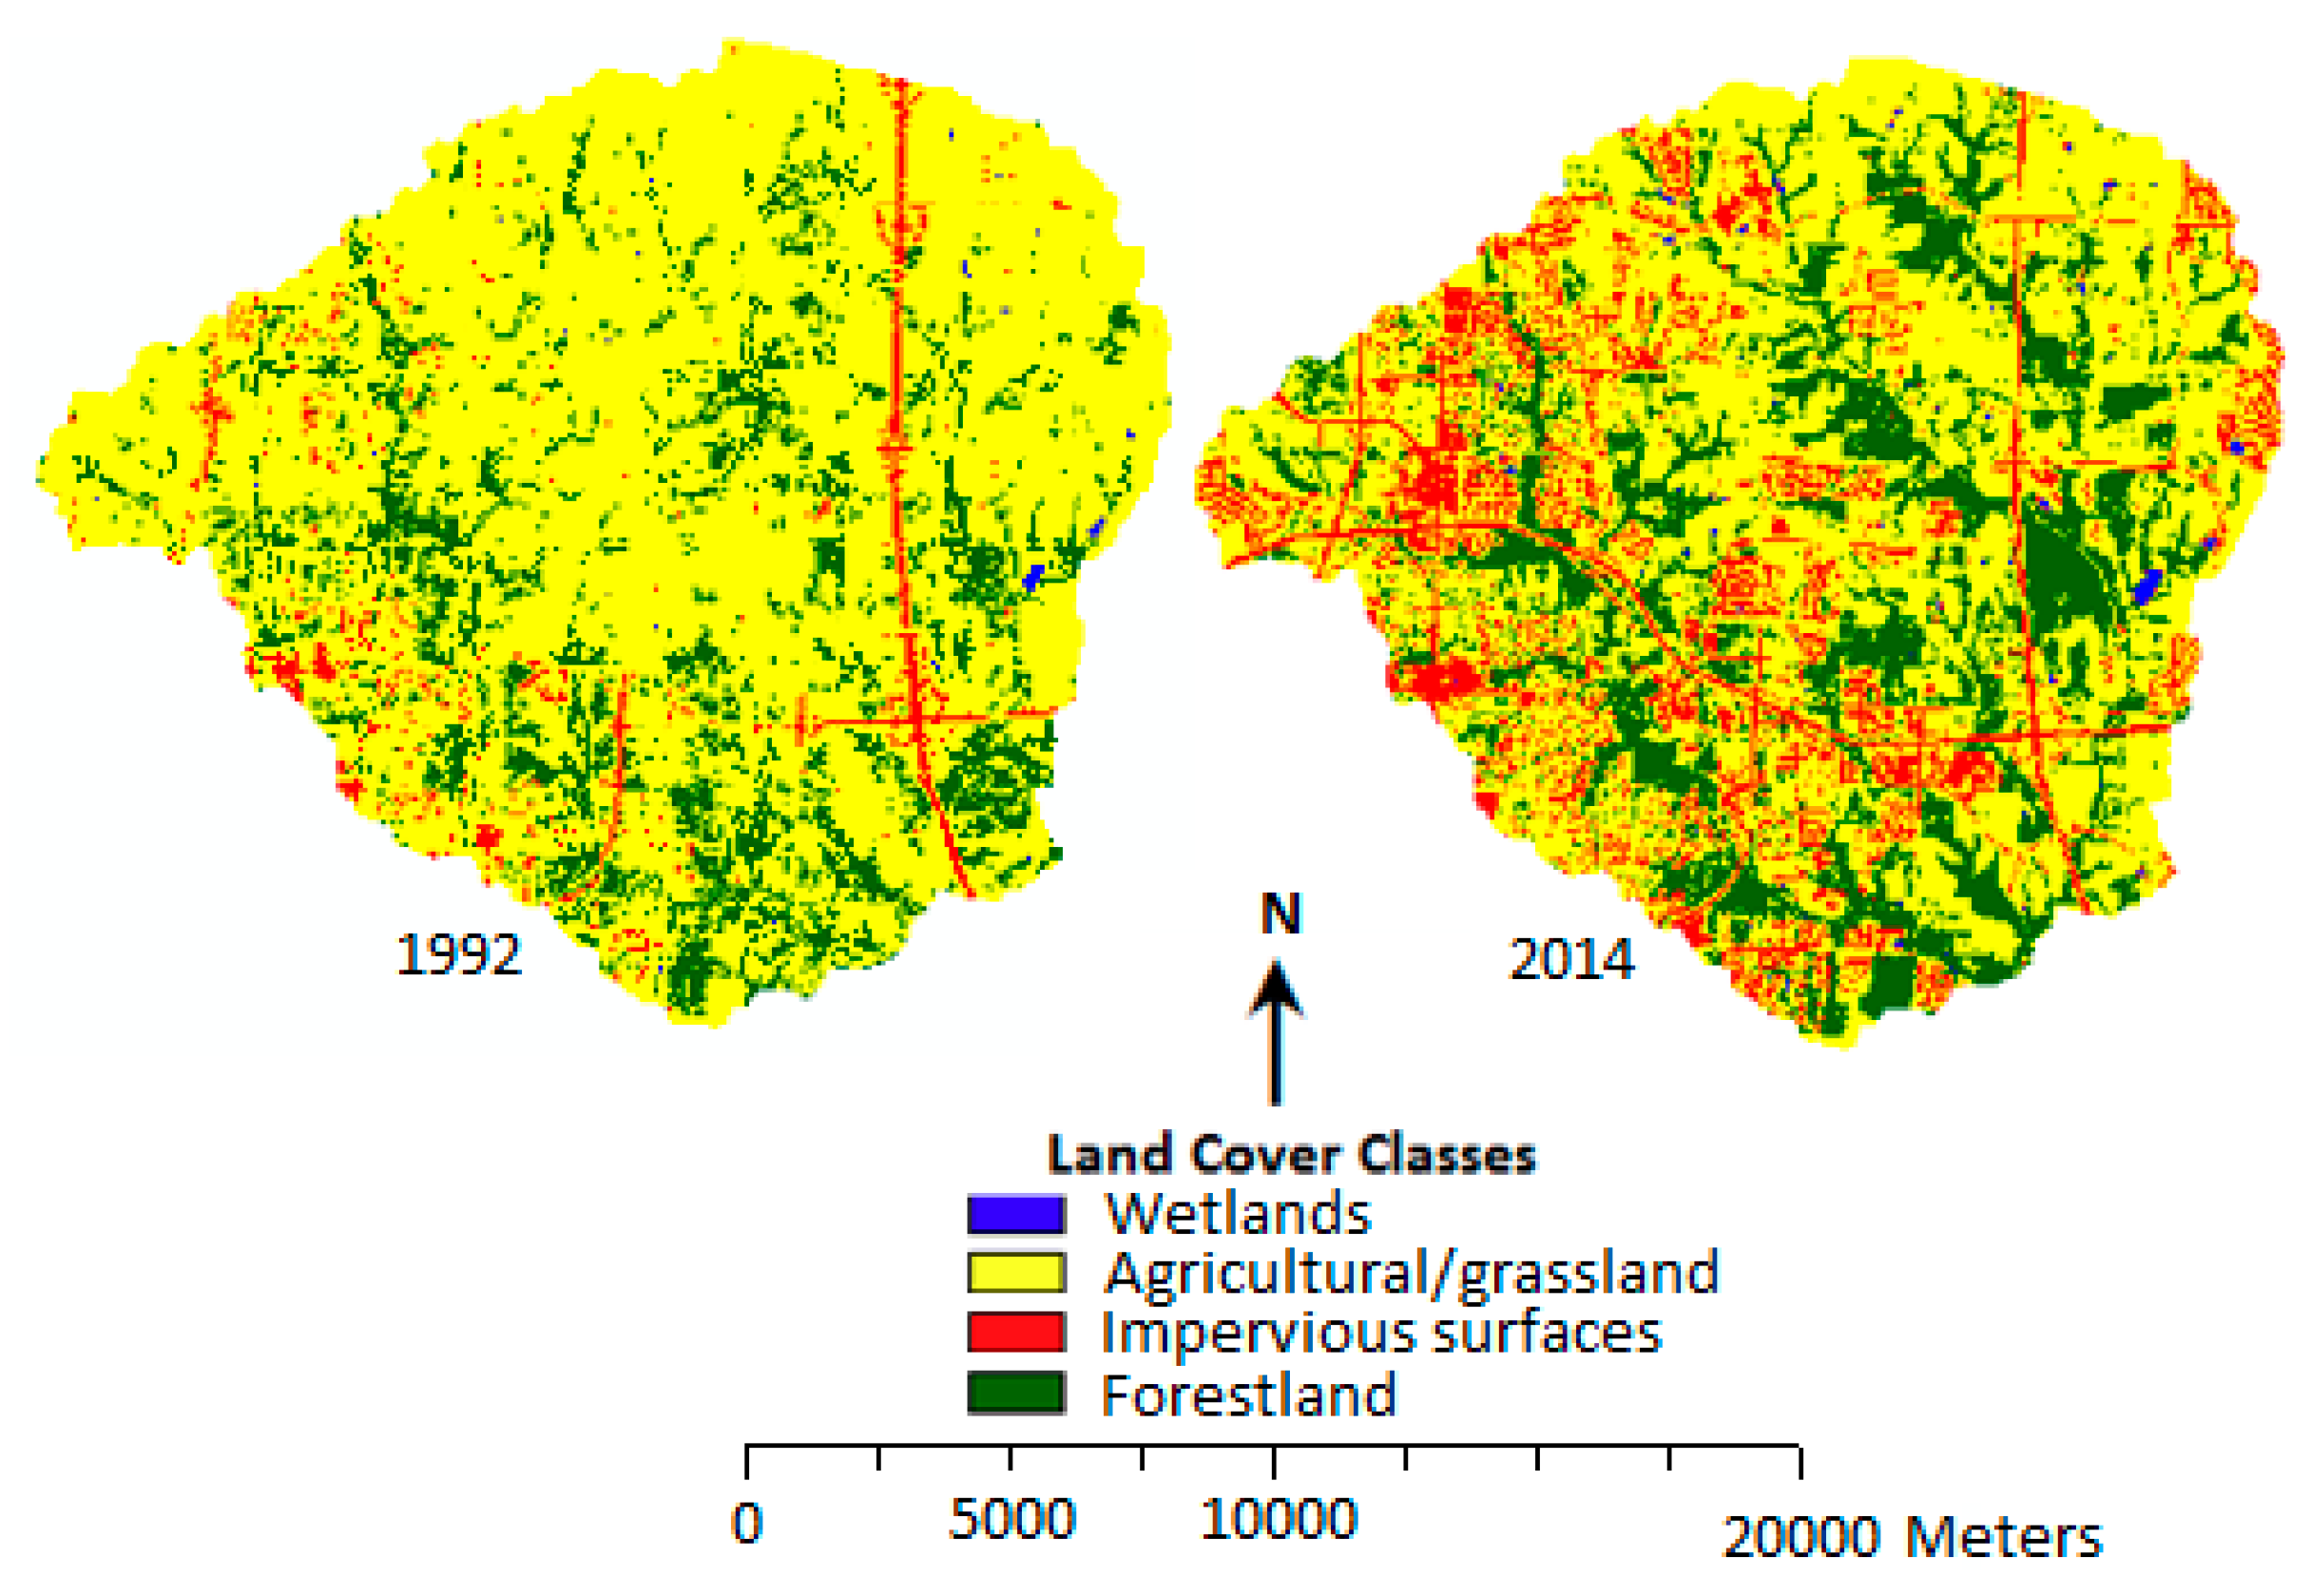
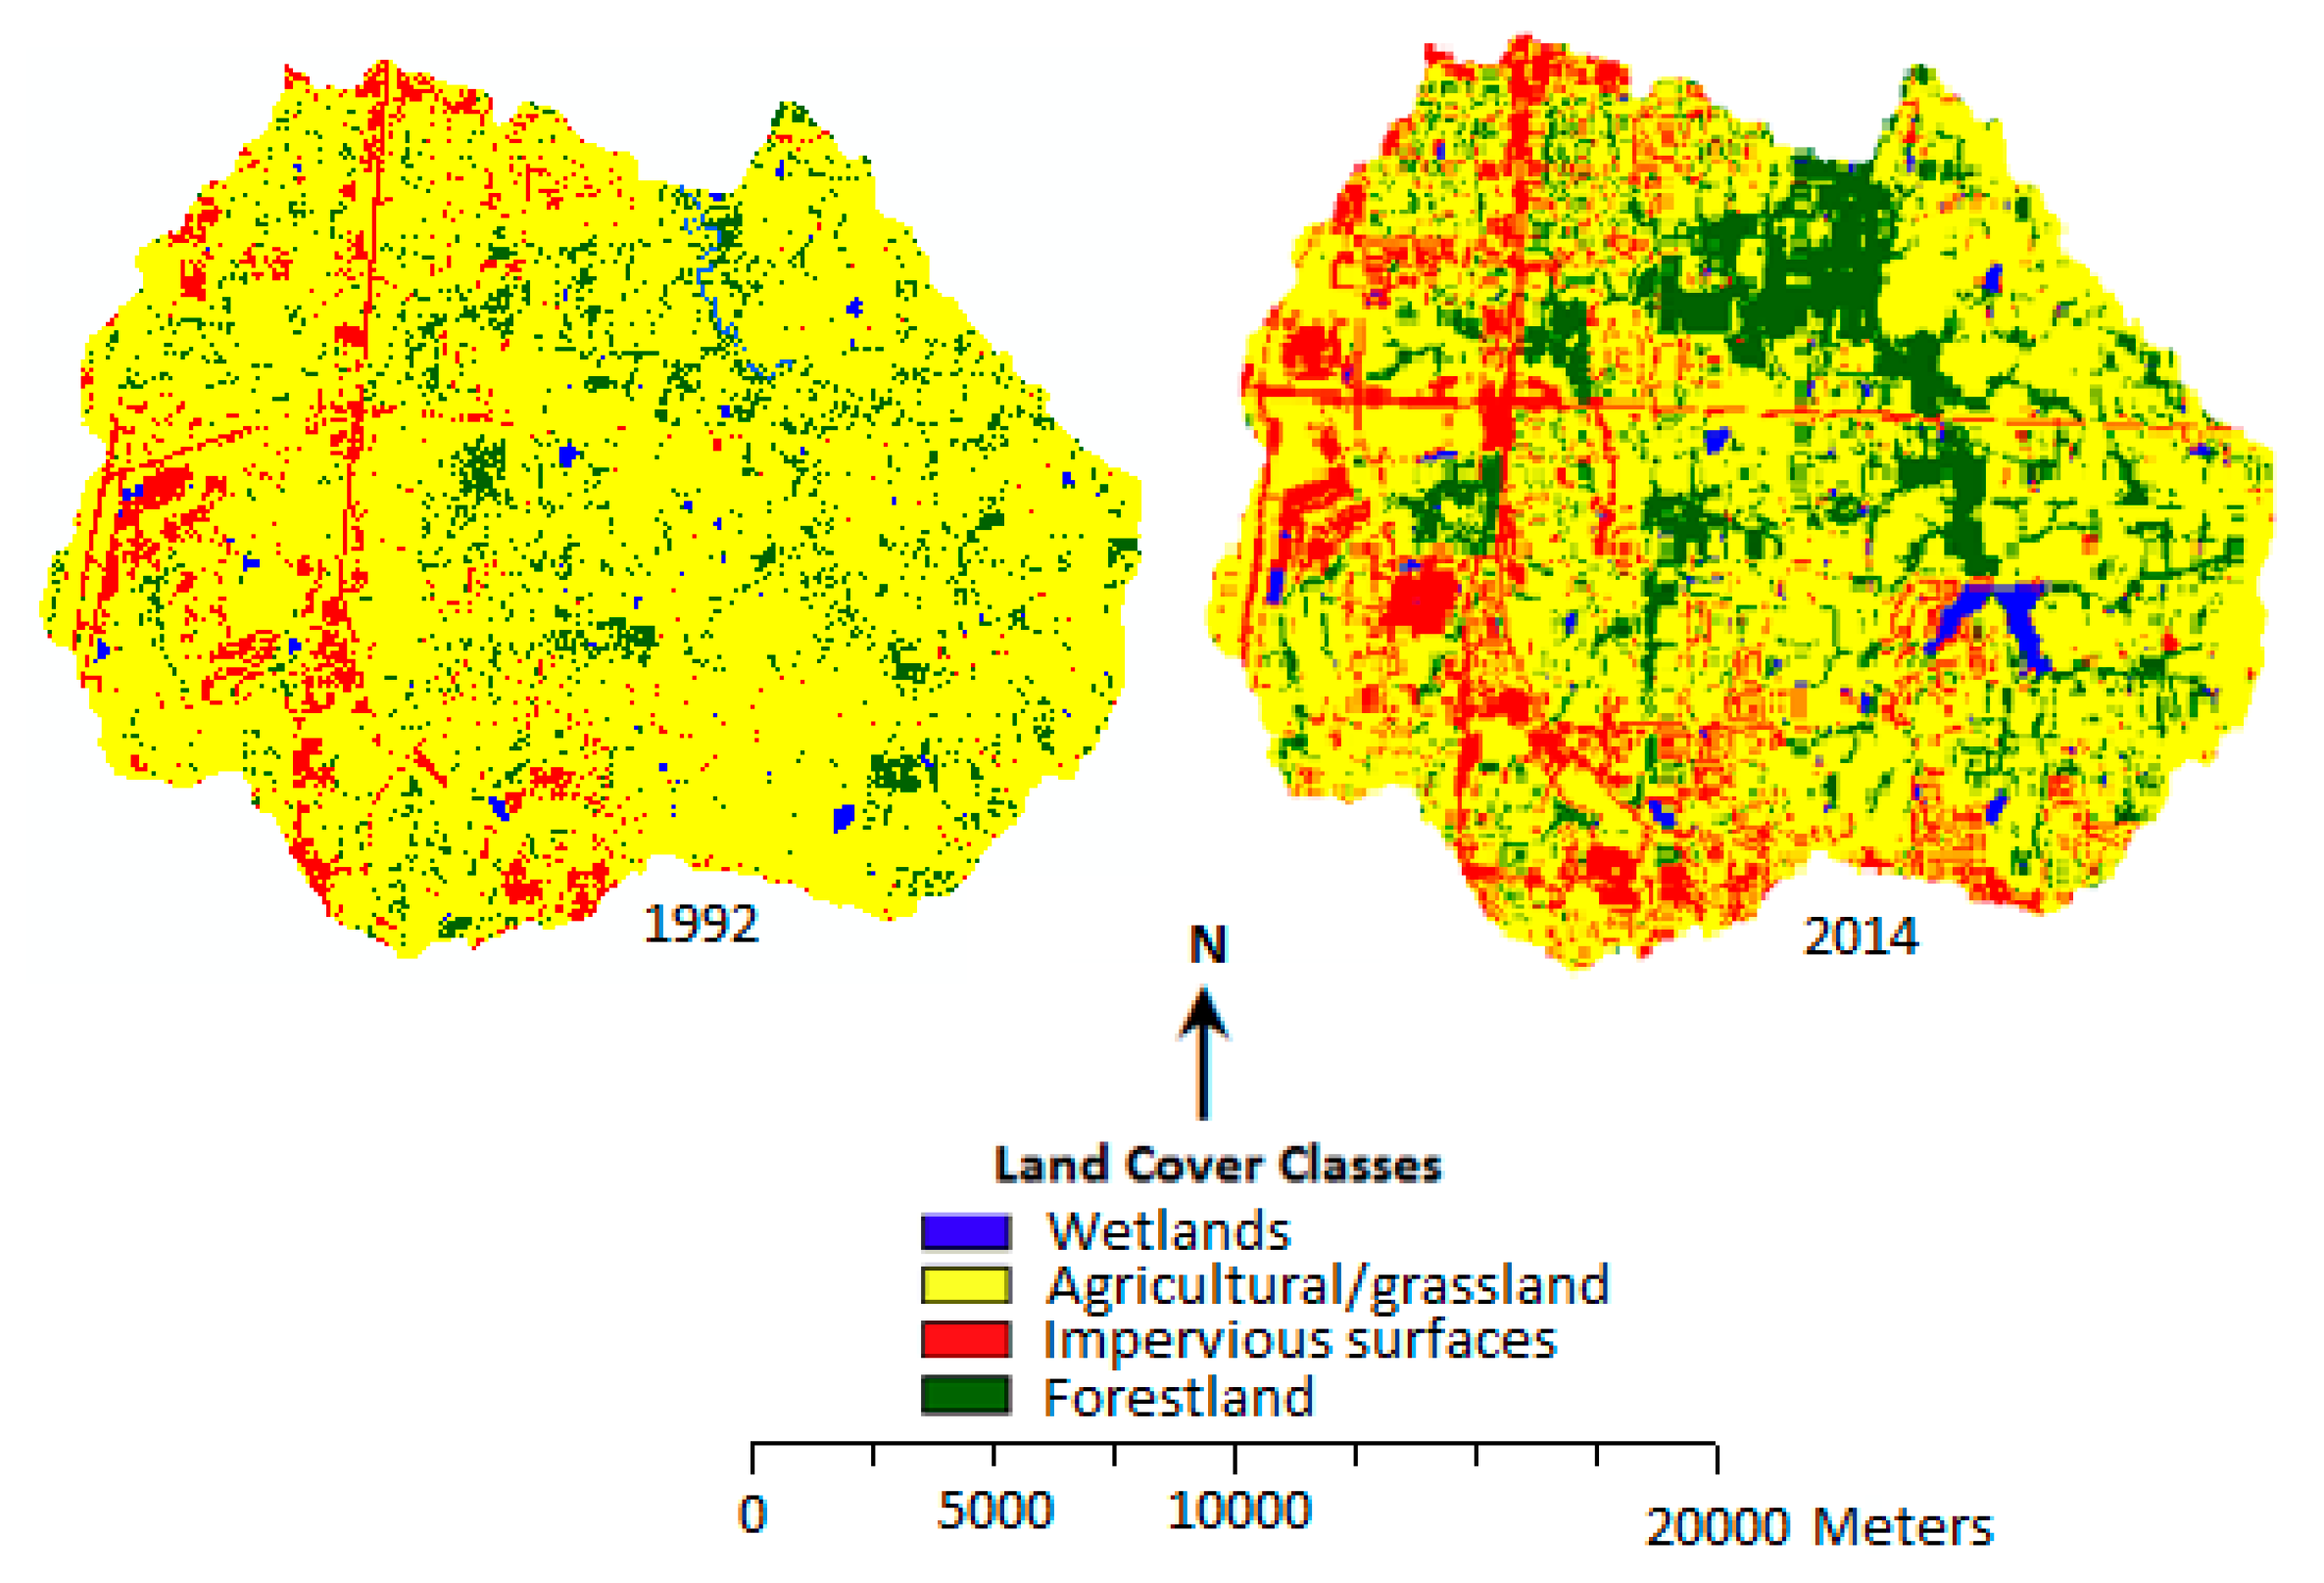
As shown in the results, agricultural lands and grasslands reduced considerably in all six sub-watersheds. This result is consistent with what others have reported in the literature when classifying the LULC of many urban centers and their immediate vicinity [2,25,32,33]. This consistent result suggests that this a common phenomenon around the world. However, by investigating this loss in the specific six sub-watersheds, specific mitigation strategies can be adopted and implemented in each area. The dynamics of change in wetland were balanced between losses and gains in the six sub-watersheds. For instance, while wetlands decreased from 0.71% to 0.3% in the Headwaters Indian Creek sub-watershed, they increased in the East Fork Little Blue River and Blue Creek-Missouri River sub-watersheds. This pattern of loss and increase can be observed in the other three sub-watersheds as well. Urbanized areas increased in all six sub-watersheds, which is normal considering results from similar studies in the study area and elsewhere [2,32,33,34,35].
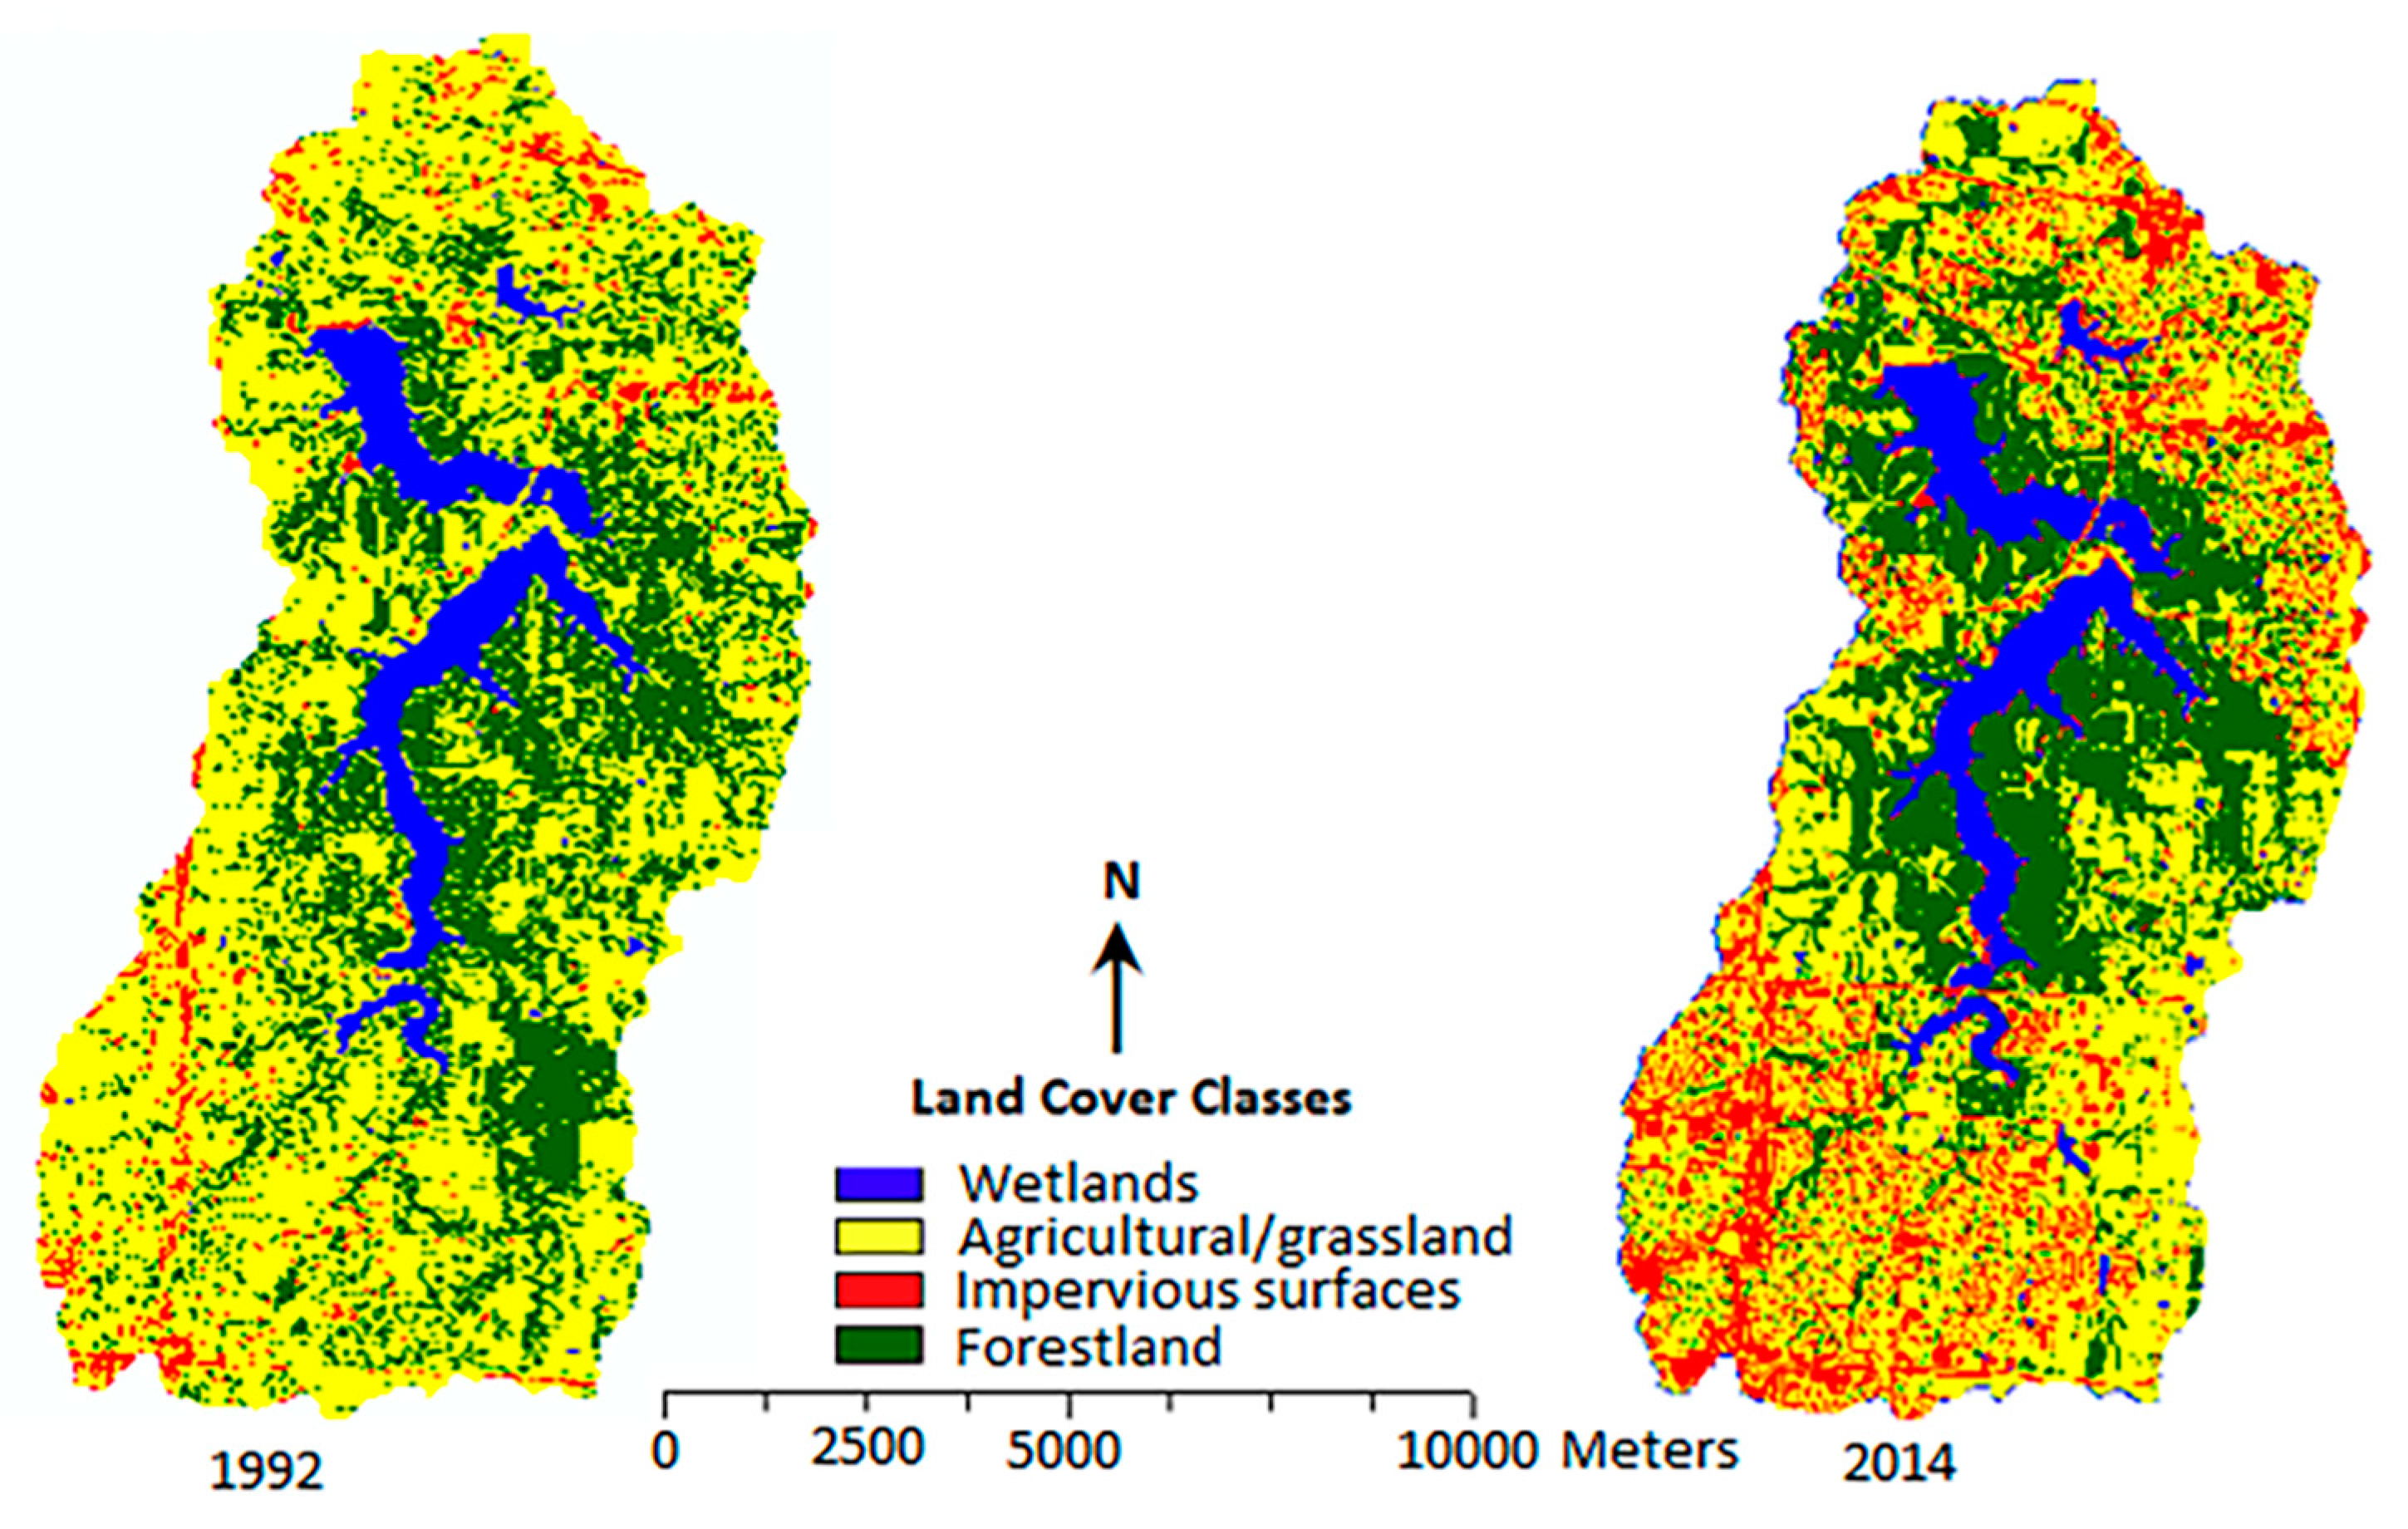
Forestland cover increased in all six sub-watersheds except for the East Fork Little Blue River sub-watershed, in which it decreased from 29.58% to 28.55%. This pattern is consistent with the work of Ji et al. [32], whose findings from investigating urban wetlands dynamics in the area indicated that forestland increased from 13.49% in 1992 to 23.56% in 2008. Ji et al. [20] suggested that the increase in forestland across the area at large could be the result of tree planting as part of suburban development. Recent studies also showed that forest cover generally increased in both the states of Missouri and Kansas [36,37], which is the general trend in the U.S. since the 1990s [38].
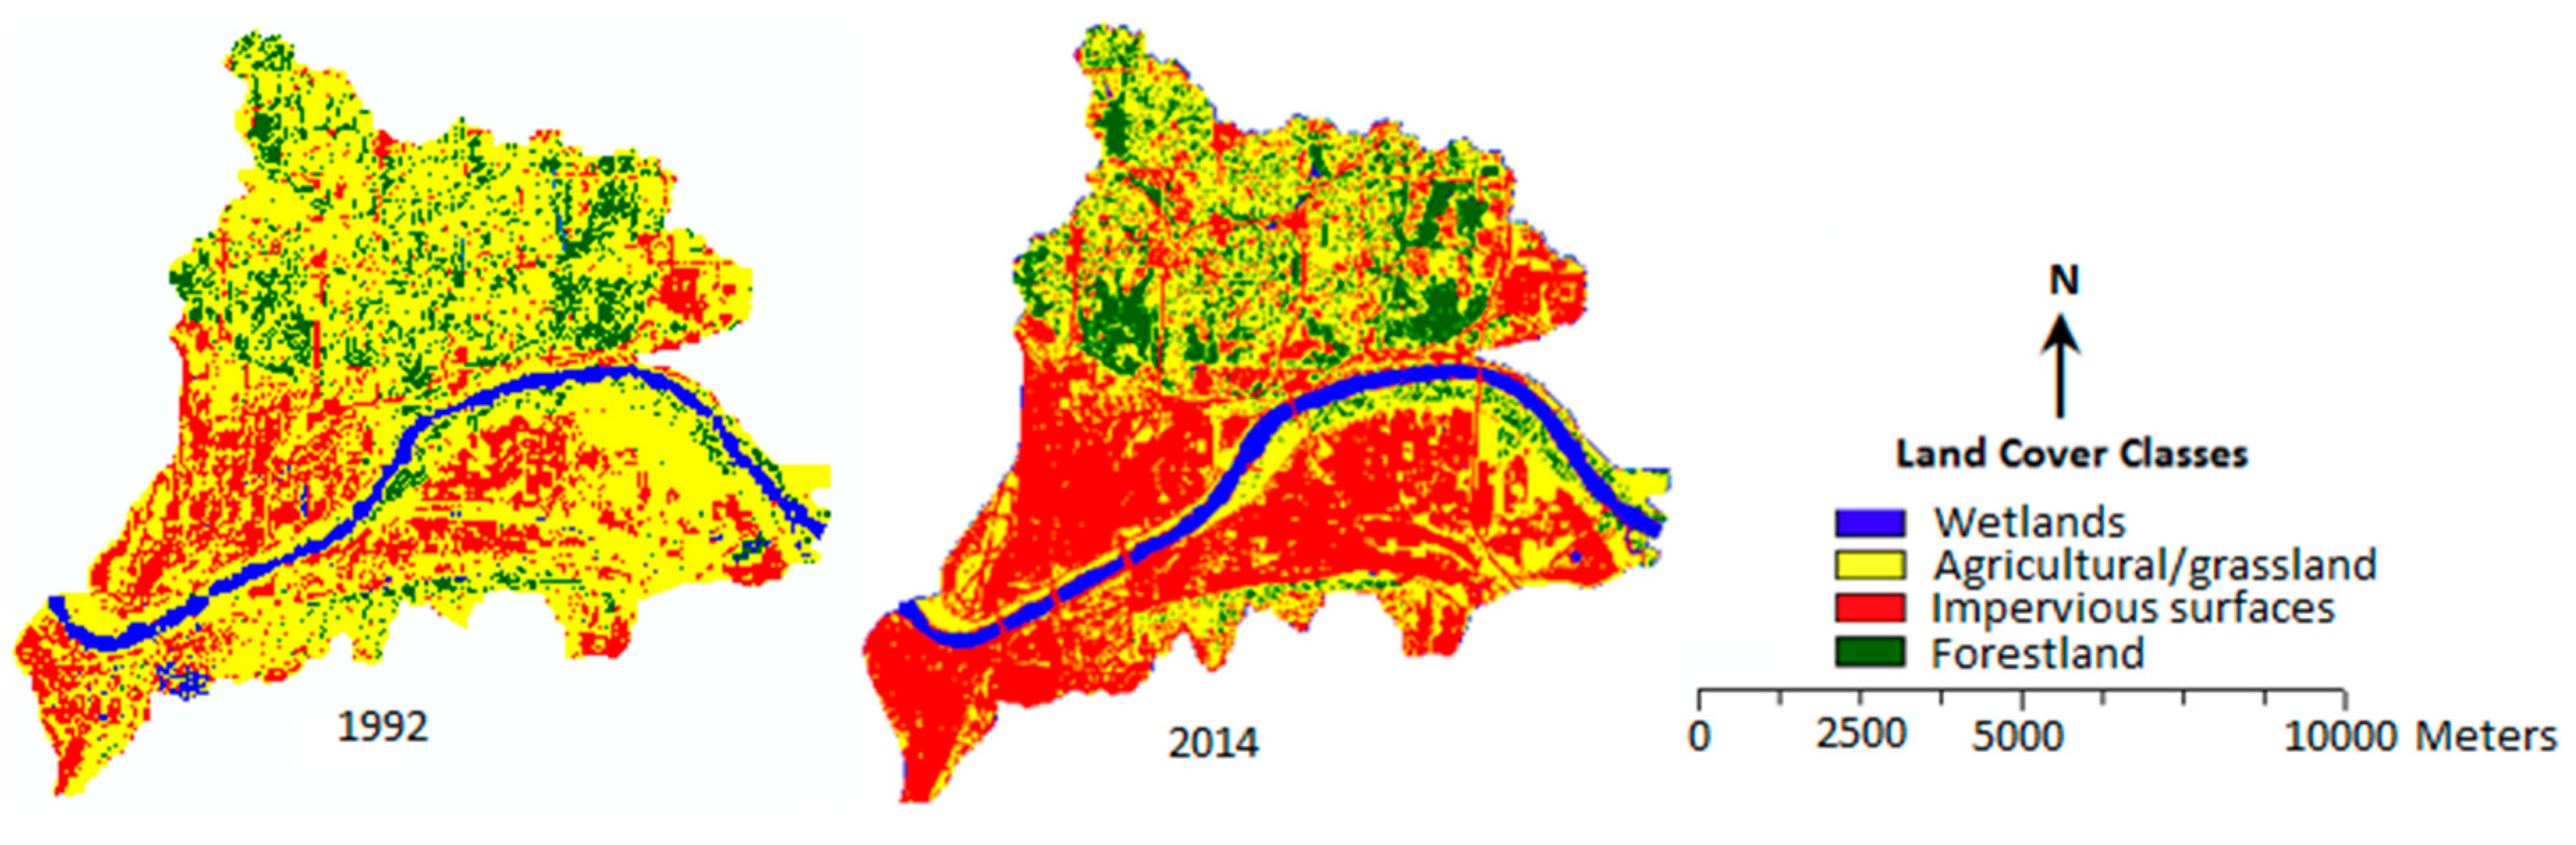
The East Fork Little Blue River sub-watershed experienced the highest growth in urbanized areas between 1992 and 2014. A previous study by Mid America Regional Council (MARC) [24] showed that the population increased in the area, with an estimated growth rate of about 11.3% between 2000 and 2010. This growth encouraged the continued expansion of urbanized areas in the study location. The rate of expansion is similar to the pattern of growth in the sub-watersheds. For instance, East Fork Little Blue River had the highest rate of expansion followed by Upper Shoal Creek-Missouri River. Urban expansion in all the sub-watersheds took place at the expense of the other LULC types. Many types of LULC, particularly agricultural land/grassland, were converted for urban uses. In a report for the U.S. Environmental Protection Agency, Region 7, Rouse [39] showed that although the East Fork Little Blue River sub-watershed’s land use was predominantly farming in the past, within the last 20 years, urban growth from the Kansas City metropolitan area has spread into eastern Jackson County, prompting significant commercial and residential development. Today, the cities of Lee’s Summit and Blue Springs account for most of the growth within the East Fork Little Blue River sub-watershed [39].
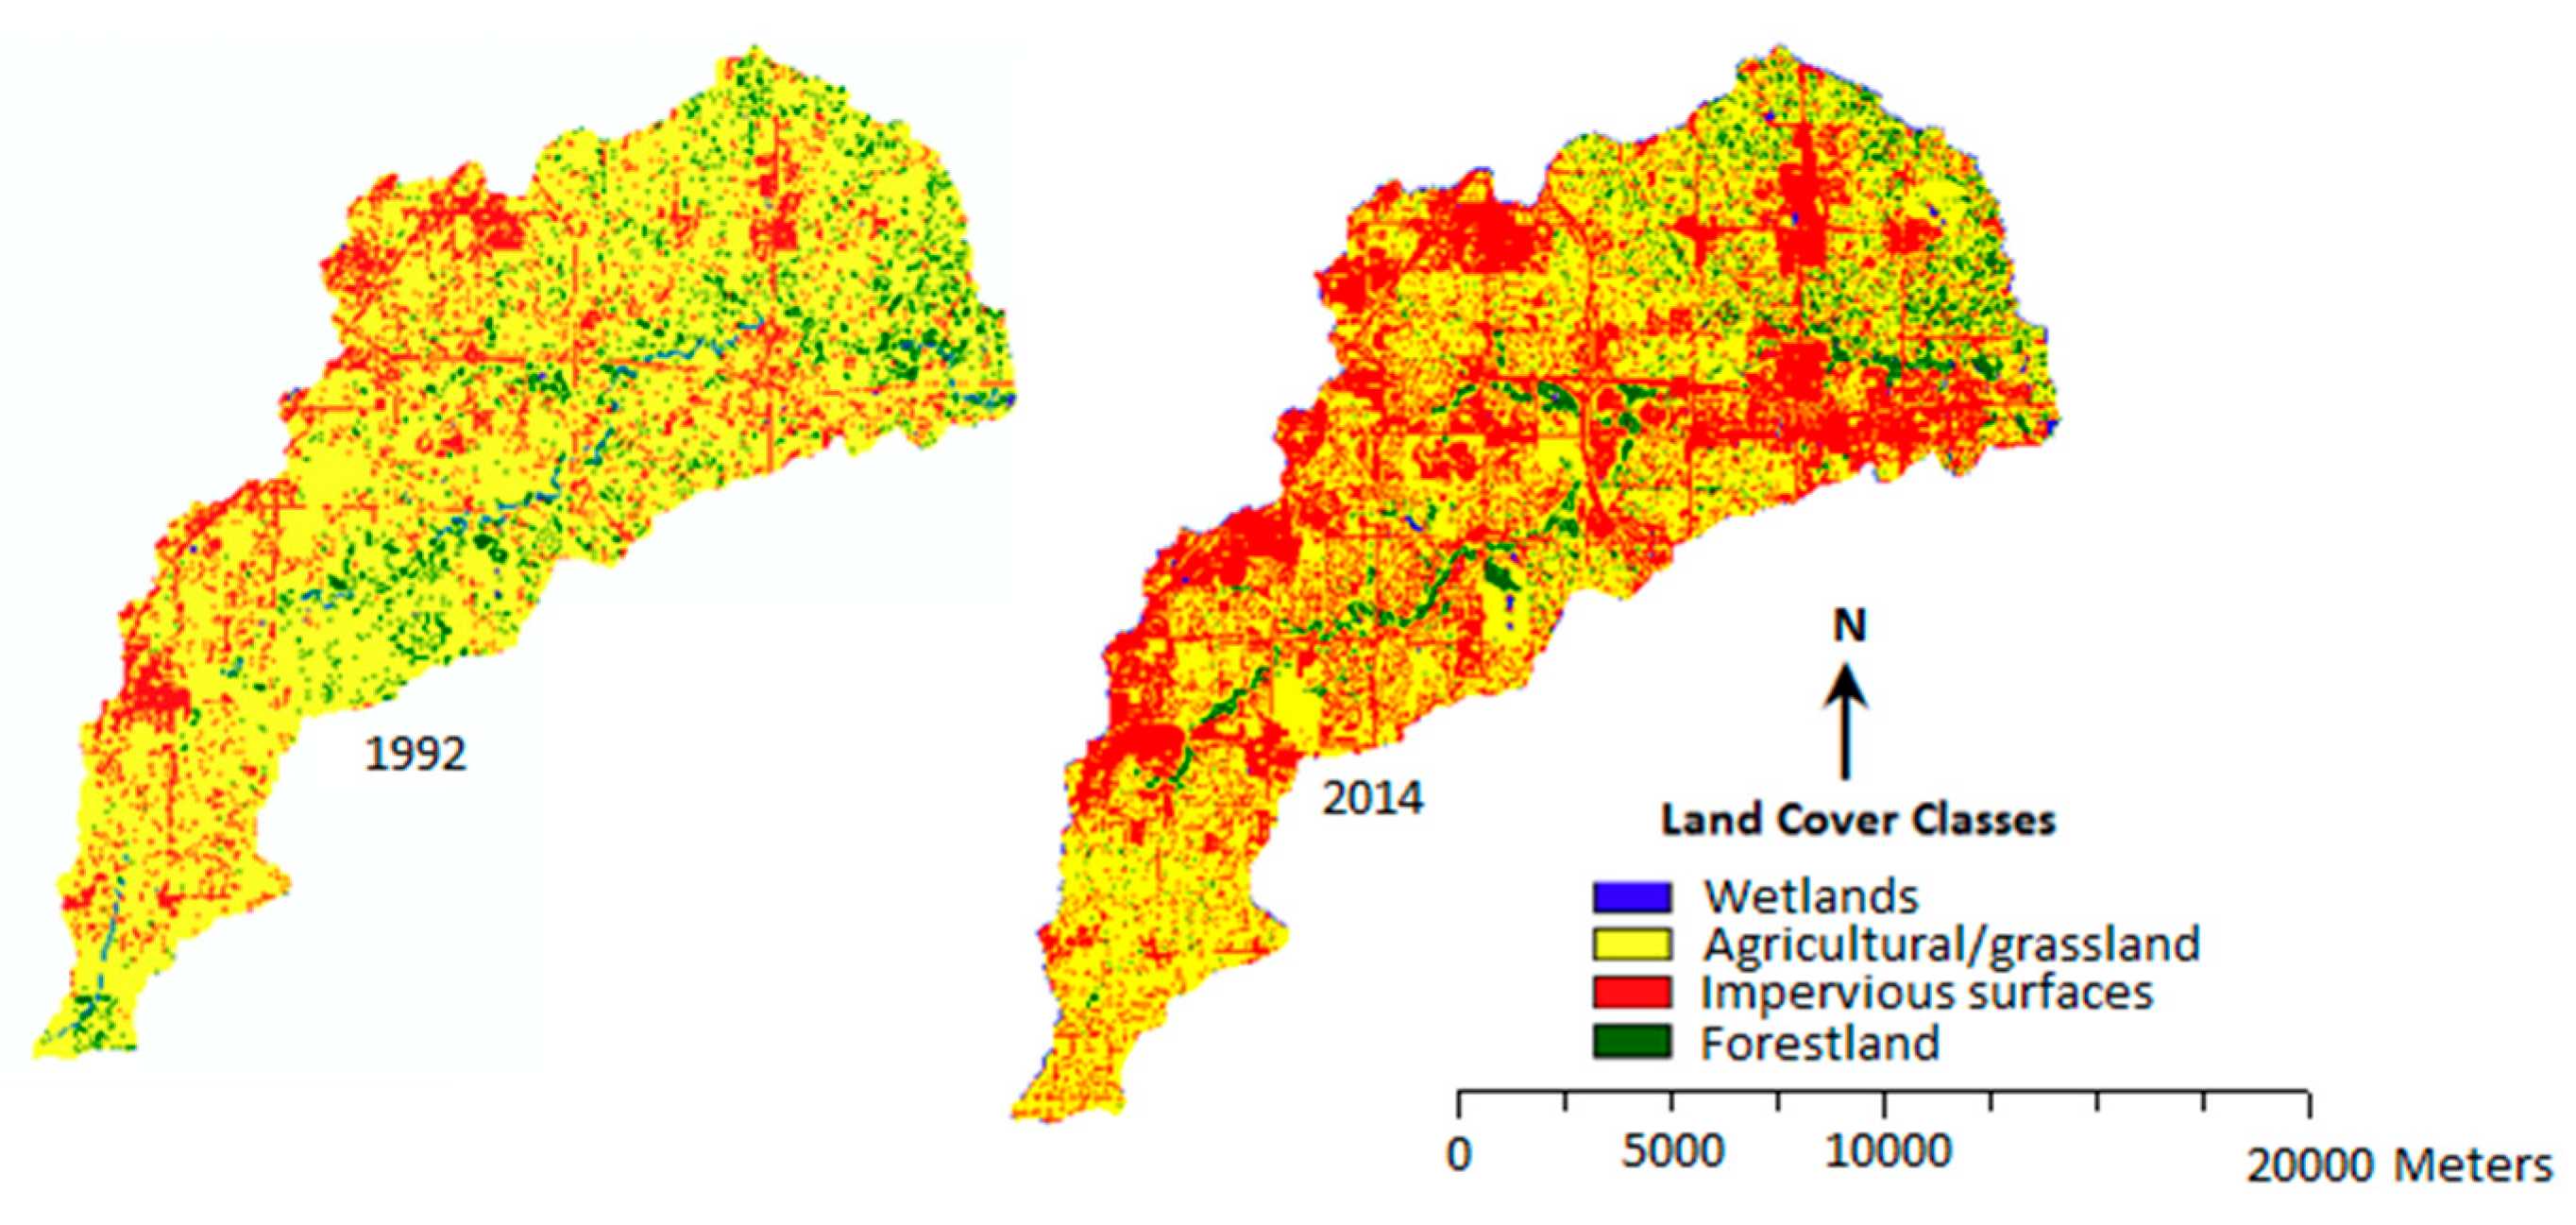
Our study also showed that agricultural land/grassland decreased in the East Fork Little Blue River by 20%, with 92.02% of this loss being due to urban expansion. In the Headwaters Indian Creek sub-watershed, 2299.8 ha of grassland/agricultural land were lost between 1992 and 2014. Of this loss, 96.77% was due to urban expansion. Similar results were found in the other sub-watersheds. This study thus revealed the alarming impact of urban expansion on the loss of agricultural lands and grasslands in the six sub-watersheds.

5. Conclusions

The impact of urban expansion on agricultural land/grassland in six sub-watersheds was investigated between 1992 and 2014. In order to achieve this, the types of LULC of the study area were produced by classifying SPOT satellite images of the sub-watersheds. The supervised maximum likelihood classification approach, popularly used for thematic mapping, was used for classifying the SPOT images. The maps produced from this classification process were used to investigate the loss of prairies and agricultural lands to urban expansion in six sub-watersheds in the Kansas City metropolitan area of the States of Kansas and Missouri in the U.S. Based on the classified maps, we calculated the magnitude and rate of urban expansion, and the proportion of loss in prairies and agricultural lands that was a result of urban expansion. Over the 22-year study period, urbanized areas increased at an accelerated rate. The East Fork Little Blue River and the Upper Shoal Creek Missouri River experienced the highest growth rates, with 16.8 and 14.4, respectively. Agricultural land/grassland decreased in all six sub-watersheds, while wetlands and forestlands had different patterns of gains and losses. However, beyond just revealing the dynamics of change in the six sub-watersheds, this study revealed that a greater proportion of the loss experienced in agricultural land/grassland was due to urbanization, which is similar to what others have reported elsewhere. For instance, three of the six sub-watersheds (Headwaters Indian Creek, East Fork Little Blue River, and Buckeye Creek-Missouri River) had proportions of loss to agricultural land/grassland higher than 90%, which is very high by all standards. While this may not be viewed negatively from an economic standpoint, ecologically speaking, it is negative [26]. The question then arises, should urbanization be halted or reduced in sub-watersheds to minimize the loss to agricultural lands/grasslands? While this is not a realistic goal, city planners can focus on planning urban expansion to minimize sprawl, which has been previously documented [20]. Sprawl creates many patches, which is not good for biodiversity because it fragments the landscape. Compact development with infills rather than leapfrog development should be encouraged. This study revealed that a rapid assessment of the magnitude of agricultural lands/grasslands that have been converted for urban uses over a period of time is achievable. Satellite images thus provide a quick and effective way of monitoring the impact of urban expansion on the natural environment. Results from this study can serve as baseline information for policy makers and planners at the local level of administration in ensuring that urban expansion in each of the sub-watershed studied is smart and sustainable. Future work will examine the implications of the loss in prairies and farmlands on food cost and biodiversity in the study area.

Author Contributions

Conceptualization, O.Z. and W.J.; methodology, O.Z.; software, O.Z.; validation, O.Z. and W.J.; formal analysis, O.Z.; investigation, O.Z.; resources, O.Z. and W.J.; data curation, O.Z.; writing—original draft preparation, O.Z.; writing—review and editing, O.Z. and O.F.; visualization, O.F.; supervision, W.J.; project administration, O.Z.; funding acquisition, W.J.

Funding

This research was funded by USEPA grant number CD97701501 and the APC was funded by the College of Liberal and Fine Arts, Tarleton State University.

Conflicts of Interest

The authors declare no conflict of interest

References

  1. Cohen, B. Urbanization in developing countries: Current trends, future projections, and key challenges for sustainability. Technol. Soc. 2006, 28, 63–80. [Google Scholar] [CrossRef]
  2. Fenta, A.A.; Yasuda, H.; Haregeweyn, N.; Belay, S.A.; Hadush, Z.; Gebremedhin, A.M.; Mekonnen, G. The dynamics of urban expansion and land use/land cover changes using remote sensing and spatial metrics: The case of Mekelle City of northern Ethiopia. Int. J. Remote Sens. 2017, 38, 4107–4129. [Google Scholar] [CrossRef]
  3. Soffanian, A.; Nadoushan, A.M.; Yaghmaei, L.; Falahatkar, S. Mapping and analyzing urban expansion using remotely sensed imagery in Isfahan, Iran. World Appl. Sci. J. 2010, 9, 1370–1378. [Google Scholar]
  4. Tewolde, M.G.; Cabral, P. Urban sprawl analysis and modelling in Asmara, Eritrea. Remote Sens. 2011, 3, 2148–2165. [Google Scholar] [CrossRef]
  5. Araya, Y.H.; Cabral, P. Analysis and modelling of urban land cover change in Setubal and Sesimbra, Portugal. Remote Sens. 2010, 2, 1549–1563. [Google Scholar] [CrossRef]
  6. Mundia, C.N.; Murayama, Y. Modelling spatial processes of urban growth in African cities: A case study of Nairobi City. Urban Geogr. 2010, 31, 259–272. [Google Scholar] [CrossRef]
  7. Hansen, T.; Francis, C. Multifunctional Rural Landscapes; University Nebraska Center for Applied Rural Innovation (CARI): Lincoln, NE, USA, 2007; Available online: http://cari.unl.edu/SustainableAg/pdf/ MultifunctionalRuralLandscapes.pdf (accessed on 3 May 2019).
  8. World Bank. World Bank Database. 2015. Available online: http://data.worldbank.org (accessed on 3 May 2019).
  9. United Nations. World Urbanization Prospects: The 2014 Revision. Available online: http://esa.un.org/unpd/wup/index.htm (accessed on 3 June 2019).
  10. Francis, A.C.; Hansen, E.T.; Fox, A.A.; Hesje, J.P.; Nelson, E.H.; Lawseth, E.A.; English, A. Farmland conversion to non-agricultural uses in the US and Canada: Current impacts and concerns for the future. Int. J. Agric. Sustain. 2012, 10, 8–24. [Google Scholar] [CrossRef]
  11. Zhang, S.; Zhang, B.; Zhang, L.; Lu, C.; Cheng, X. Spatiotemporal evolution of urban land uses in modern urbanization of China. Chin. Geogr. Sci. 2010, 20, 132–138. [Google Scholar] [CrossRef]
  12. Shrestha, M.K.; York, A.M.; Boone, C.G.; Zhang, S. Land fragmentation due to rapid urbanization in the Phoenix Metropolitan Area: Analyzing the spatiotemporal patterns and drivers. Appl. Geogr. 2012, 32, 522–531. [Google Scholar] [CrossRef]
  13. Li, B.; Chen, D.; Wu, S.; Zhou, S.; Wang, T.; Chen, H. Spatio-temporal assessment of urbanization impacts on ecosystem services: Case study of Nanjing City, China. Ecol. Indic. 2016, 71, 416–427. [Google Scholar] [CrossRef]
  14. Qiu, B.; Li, H.; Zhou, M.; Zhang, L. Vulnerability of ecosystem services provisioning to urbanization: A case of China. Ecol. Indic. 2015, 57, 505–513. [Google Scholar] [CrossRef]
  15. Wang, H.; He, Q.; Liu, X.; Zhuang, Y.; Hong, S. Global urbanization research from 1991 to 2009: A systematic research review. Landsc. Urban Plan. 2012, 104, 299–309. [Google Scholar] [CrossRef]
  16. Angel, S.; Parent, J.; Civco, D.L.; Blei, A.; Potere, D. The dimensions of global urban expansion: Estimates and projections for all countries 2000–2050. Prog. Plan. 2011, 75, 53–107. [Google Scholar] [CrossRef]
  17. Small, C.; Pozzi, F.; Elvidge, C.D. Spatial analysis of global urban extents from the DMSP-OLS night-lights. Remote Sens. Environ 2005, 96, 277–291. [Google Scholar] [CrossRef]
  18. Tan, M.; Li, X.; Xie, H.; Lu, C. Urban land expansion and arable land loss in China—A case study of Beijing–Tianjin–Hebei region. Land Use Policy 2005, 22, 187–196. [Google Scholar] [CrossRef]
  19. Jiang, L.; Deng, X.; Seto, K.C. The impact of urban expansion on agricultural land use intensity in China. Land Use Policy 2013, 35, 33–39. [Google Scholar] [CrossRef]
  20. Ji, W.; Ma, J.; Twibell, R.W.; Underhill, K. Characterizing urban sprawl using multi-stage remote sensing images and landscape metrics. Comput. Environ. Urban Syst. 2006, 30, 861–879. [Google Scholar] [CrossRef]
  21. Sharma, L.; Pandey, C.P.; Nathawat, S.M. Assessment of land consumption rate with urban dynamics change using geospatial techniques. J. Land Use Sci. 2012, 7, 135–148. [Google Scholar] [CrossRef]
  22. Boori, S.M.; Netzband, M.; Choudhary, K.; Voženílek, V. Monitoring and modeling of urban sprawl through remote sensing and GIS in Kuala Lumpur, Malaysia. Ecol. Process. 2015, 4, 15. [Google Scholar] [CrossRef] [Green Version]
  23. Zubair, A.O.; Ji, W.; Weilert, E.T. Modeling the Impact of Urban Landscape Change on Urban Wetlands Using Similarity Weighted Instance-Based Machine Learning and Markov Model. Sustainability 2017, 9, 2223. [Google Scholar] [CrossRef]
  24. MARC (Mid-America Regional Council). Census Data for the MARC Region. 2010. Available online: http://www.marc.org/Data-Economy/Metrodataline/Population/Census-2010 (accessed on 3 May 2019).
  25. Weilert, E.T.; Ji, W.; Zubair, A.O. Article Assessing the Impacts of Streamside Ordinance Protection on the Spatial and Temporal Variability in Urban Riparian Vegetation. ISPRS Int. J. Geo-Inf. 2018, 7, 282. [Google Scholar] [CrossRef]
  26. Zubair, O.A.; Ji, W. Assessing the Impact of Land Cover Classification Methods on the Accuracy of Urban Land Change Prediction. Can. J. Remote Sens. 2015, 41, 170–190. [Google Scholar] [CrossRef]
  27. Chen, D.; Stow, D. The effect of training strategies on supervised classification at different spatial resolutions. Photogramm. Eng. Remote Sens. 2002, 68, 1155–1162. [Google Scholar]
  28. Olofsson, P.; Food, M.G.; Herold, M.; Stehmand, V.S.; Woodcock, E.C.; Wulder, A.M. Good practices for estimating area and assessing accuracy of land change. Remote Sens. Environ. 2014, 148, 42–57. [Google Scholar] [CrossRef]
  29. Xiao, J.; Shen, Y.; Ge, J.; Tateishi, R.; Tang, C.; Liang, Y.; Huang, Z. Evaluating urban expansion and land use change in Shijiazhuang, China, by using GIS and remote sensing. Landsc. Urban Plan. 2006, 75, 69–80. [Google Scholar] [CrossRef]
  30. Lu, D.; Mausel, P.; Brondi’Zio, E.; Moran, E. Change detection techniques. Int. J. Remote Sens. 2004, 25, 2365–2407. [Google Scholar] [CrossRef]
  31. ERDAS Field Guide. 1999. Available online: http://web.pdx.edu/~emch/ip1/FieldGuide.pdf (accessed on 3 June 2019).
  32. Ji, W.; Xu, X.; Murambadoro, D. Understanding urban wetland dynamics: Cross-scale detection and analysis of remote sensing. Int. J. Remote Sens. 2015, 36, 1763–1788. [Google Scholar] [CrossRef]
  33. Bagan, H.; Yamagata, Y. Land-cover change analysis in 50 global cities by using a combination of Landsat data and analysis of grid cells. Environ. Res. Lett. 2014, 9, 064015. [Google Scholar] [CrossRef]
  34. Megahed, Y.; Cabral, P.; Silva, J.; Caetano, M. Land Cover Mapping Analysis and Urban Growth Modelling Using Remote Sensing Techniques in Greater Cairo Region—Egypt. ISPRS Int. J. Geo-Inf. 2015, 4, 1750–1769. [Google Scholar] [CrossRef]
  35. Cao, H.; Liu, J.; Fu, C.; Zhang, W.; Wang, G.; Yang, G.; Luo, L. Urban Expansion and Its Impact on the Land Use Pattern in Xishuangbanna since the Reform and Opening up of China. Remote Sens. 2017, 2, 137. [Google Scholar] [CrossRef]
  36. United States Department of Agriculture. Forests of Missouri. 2014. Available online: https://www.fs.fed.us/nrs/pubs/ru/ru_fs40.pdf (accessed on 28 February 2019).
  37. Kansas Forest Service. Forest in Kansas. 2018. Available online: https://www.kansasforests.org/kansas_forest_services/forestsinkansas.html (accessed on 28 February 2019).
  38. The World Bank Open Data. World Bank Database. 2019. Available online: https://data.worldbank.org/indicator/AG.LND.FRST.ZS?end=2016&locations=US&start=1990&view=chart (accessed on 28 February 2019).
  39. Rouse. Assessing Urban Wetlands. Final Report to the U.S. Environmental Protection Agency, Region 7. 2004. Available online: https://dnr.mo.gov/geology/wrc/docs/urban-wetlands.pdf?/env/wrc/docs/urban-wetlands.pdf (accessed on 28 February 2019).
Figure 1. Location of the six sub-watersheds constituting the study area.
Sustainability 11 04673 g001
Figure 2. Land use/land cover maps of Headwaters Indian Creek sub-watershed for the years 1992 and 2014.
Sustainability 11 04673 g002
Figure 3. Land use/land cover maps of East Fork Little Blue River sub-watershed for the years 1992 and 2014.
Sustainability 11 04673 g003
Figure 4. Land use/land cover maps of Buckeye Creek-Missouri River sub-watershed for the years 1992 and 2014.
Sustainability 11 04673 g004
Figure 5. Land use/land cover maps of Blue River Outlet sub-watershed for the years 1992 and 2014.
Sustainability 11 04673 g005
Figure 6. Land use/land cover maps of Upper Shoal Creek-Missouri River sub-watershed for the years 1992 and 2014.
Sustainability 11 04673 g006
Figure 7. Land use/land cover maps of Headwaters Little Blue River sub-watershed for the years 1992 and 2014.
Sustainability 11 04673 g007
Table 1. List of SPOT images.
SensorDateSpectral ModeNo. of BandsProcessing LevelSpatial Resolution (m)Source
SPOT 229 January 1992XS31A20SPOT image corporation
SPOT 511 August 2014J42A10SPOT image corporation
Table 2. Classification scheme adopted.
Land Cover CategoryDescription
Impervious surfacesResidential areas, shopping centers, industrial and commercial facilities, highways and major streets, and associated properties and parking lots
ForestlandAreas of land with collection of trees
Agricultural land/grasslandsAreas with grasses, brush, crops, and in general, non-forest vegetation
WetlandsOpen water bodies and vegetated lowlands such as riparian areas
Table 3. Combined accuracy assessment of the classified maps.
Accuracy Assessment
Land Use/Cover Classes19922014
Accuracy Assessment (%)
Producer’sUser’sProducer’sUser’s
Agricultural land/grassland88.793.495.5290.14
Forestland94.887.387.2785.71
Impervious surfaces91.586.186.7997.87
Wetland92.190.362.50100.00
Overall classification accuracy90.190.8
Table 4. Percent size of the land cover categories in the sub-watersheds.
Land Cover ClassesHICEFLBRBC-MRBROUSC-MRHLBR
Area (%)Area (%)Area (%)Area (%)Area (%)Area (%)
199220141992201419922014199220141992201419922014
Wetlands0.700.317.067.944.454.861.110.490.151.260.651.26
Agricultural land/grassland77.8255.1360.0447.9565.4738.3479.8850.4581.5267.6385.4467.63
Impervious surfaces15.2337.643.3215.5620.0345.0712.8235.143.3514.656.5314.65
Forest6.256.9229.5828.5510.0512.466.1913.9214.9816.467.3816.46
Total100100100100100100100100100100100100
HIC: Headwaters Indian Creek; EFLBR: East Fork Little Blue River; BC-MR: Buckeye Creek-Missouri River; BRO: Blue River Outlet; USC-MR: Upper Shoal Creek-Missouri River; HLBR: Headwaters Little Blue River.
Table 5. Rate of urban expansion in the six sub-watersheds.
Sub-WatershedsRate of Urban Expansion
Headwaters Indian Creek5.7
East Fork Little Blue River16.8
Buckeye Creek-Missouri River6.8
Blue River Outlet5.5
Upper Shoal Creek-Missouri River14.4
Headwaters Little Blue River7.9
Table 6. Change in the urbanized areas and agricultural land/grassland in the six sub-watersheds.
Sub-WatershedsArea in Hectares
Urbanized AreasAgricultural Land/Grassland
1992 (ha)2014 (ha)% Change1992 (ha)2014 (ha)% Change
Headwaters Indian Creek1710.963868.801265590.923291.12−41
East Fork Little Blue River342.321604.883696184.684946.88−20
Buckeye Creek-Missouri River1501.163731.441497671.485465.32−29
Blue River Outlet510.441147.241256677.325293.92−21
Upper Shoal Creek-Missouri River219.44915.43175344.364166.68−22
Headwaters Little Blue River920.922528.641755735.723629.44−37
Table 7. Proportion of loss in agricultural land/grassland due to urban expansion.
Sub-WatershedTotal Loss
(ha)
Loss Due to Urban Expansion
(ha)(%)
Headwaters Indian Creek2299.82225.7296.77
East Fork Little Blue River1237.81140.0092.09
Buckeye Creek-Missouri River2206.162193.5299.43
Blue River Outlet1383.40810.5658.59
Upper Shoal Creek-Missouri River1177.68722.4861.35
Headwaters Little Blue River2106.281763.1283.71

