Optimization Method for Reducing the Air Pollutant Emission and Aviation Noise of Arrival in Terminal Area


1
Air Traffic Department, College of Civil Aviation, Nanjing University of Aeronautics and Astronautics, Nanjing 210016, China
2
Terminal Radar Control Center, Jiangsu Air Traffic Management Sub-bureau, Nanjing 210016, China
*
Author to whom correspondence should be addressed.
Sustainability 2019, 11(17), 4715; https://0-doi-org.brum.beds.ac.uk/10.3390/su11174715
Submission received: 23 July 2019
/
Revised: 24 August 2019
/
Accepted: 27 August 2019
/
Published: 29 August 2019
(This article belongs to the Special Issue Sustainable Mobility: Social, Technological and Environmental Issues)
Abstract
:In order to reduce the environmental impact of aircraft operation in the terminal area, this paper researched the route optimization method. Firstly, this paper constructed the air pollutant emission and noise assessment model, and the flight performance model. Secondly, aiming at reducing air emissions and noise level, the multi-objective terminal area route optimization model is established based on the principles of flight safety and flight procedure construction. Then this paper puts forward the path optimization method of emission and noise reduction of terminal area route network, through the research on the priority setting method of terminal area approach and departure route planning. The route segmentation method and NSGA-II algorithm are employed to solve the problem. Finally, a numerical case study is carried out for the Shanghai terminal area, and yields the following results: (1) Compared with the original route network, the optimized route network in the terminal area can significantly reduce emission and noise by reducing pollutant emission by 51.4% and noise influence by 21.5%; (2) The method can also reduce fuel consumption by 60.5% and the total route length by 21.1%.
1. Introduction
Terminal area, as a key node in the air transport network, is a complex area which provides air traffic control service for arrival and departure aircrafts. It usually contains one or more airports characterized by dense and changeable traffic flow, intricate route structure and multiple coexistence of runway operation modes. Due to the unreasonable route network planning in the terminal area, the air emissions and noise from aircraft seriously affect the ecological environment, and the contradiction between the development of civil aviation and environmental protection is increasingly prominent. Therefore, on the premise of ensuring safety, reducing the environmental impact of air traffic in the terminal area is of great significance to promote the development of green civil aviation and sustainable social development [1].
In general, flight activity is an important source of air and noise pollutants. Areas close to airports are usually more polluted [2,3]. With regard to it, many scholars have studied the route optimization of emission and noise reduction in terminal area air route network and achieved a series of achievements. Regarding the optimization of emission reduction and noise reduction for a single route in the terminal area, Stell analyzed the data of the descending trajectory of some aircraft types, and calculated the optimal position of the top of descent (TOD) with the given thrust and drag models, by considering the environmental impact [4]. Mitchell selected the optimal flight speed of aircraft along the departure route by taking noise and fuel consumption into consideration [5]. Wang et al. designed a de-noising optimization method for departure route based on fuzzy theory [6]. Muller et al. took the arrival route of Seattle Airport as an example for analysis, and the results showed that the optimized single arrival route could save about 40% of fuel consumption at most [7]. Hartjes et al. proposed the design method of emission reduction and noise reduction of departure route in terminal area under the influence of single event, combining with the degree of residents’ annoyance caused by noise [8]. Braakenburg et al. proposed a noise-reducing trajectory design method for arrival routes with the influence of multiple events, and designed a piecewise optimization method for approach routes based on Area Navigation (RNAV) [9]. Dougui et al. considered aircraft conflicts in the terminal area and proposed the arrival route design method based on the light propagation model by referring to the mode of light propagation in media [10,11]. Richter et al. used two-layer hybrid algorithm to calculate the minimum noise trajectory [12]. Li et al. designed an improvement method of the arrival route for preliminary noise reduction, by taking the population affected by noise as the evaluation reference, and changed the noise impact range by changing the horizontal flight path of aircraft [13,14]. Taghizadeh et al. used the atmospheric dispersion model to construct the dispersion model of air emissions in the terminal area, and the emission databank of International Civil Aviation Organization (ICAO) was utilized to estimate the pollutant emission rate of each aircraft [15].
On the route network path optimization of the terminal area, Xue et al. optimized the two-dimensional route network path of the terminal area. The results showed that the optimized arrival and departure route could effectively reduce fuel consumption [16]. In order to further reduce the mutual interference between routes, Wang et al. studied the take-off and landing route of runway 05L of Xianyang Airport in Xi ’an [17,18], proposed 3D departure route optimization method with the shortest path and the route network optimization sequence principle. He et al. designed the route trajectory search method with angle extension and proposed the economic optimal method to arrival and departure route optimization [19]. Liu et al. proposed the arrival and departure route optimization method based on A* algorithm by considering the influence of dangerous weather [20]. Zhou et al. proposed the terminal area route network optimization method based on simulated annealing algorithm by referring to the Standard Instrument Departure (SID) and Standard Instrument Arrival (STAR). The above scholars all adopted the route network optimization sequence principle proposed by Wang [21]. Sidiropoulos et al. designed the dynamic terminal area route optimization method when studying the route network of London multi-airport terminals, and established the route network priority evaluation mode based on the analytic hierarchy process [22]. In addition, Kim et al. proposed the terminal arrival and departure fix optimization model in combination with the airspace structure optimization of the terminal area, and the results showed that the optimized fixes can effectively reduce fuel consumption and environmental impact [23]. Then, Man et al. found a complete and efficient framework capable of dynamically modelling the integration of arrival and departure trajectories on parallel runways, and modelled the conflict detection and resolution in presence of curved trajectory and radius-to-fix merging process [24]. Sidiropoulos proposed a framework for the design of dynamic arrival and departure routes in MAS Terminal Maneuvering Areas and used the AirTOp fast-time simulation model to prove the advantages in distance, time, fuel burn, and controller workload [25].
At present, the scholars’ research on route network planning of terminal area mainly focuses on the single optimization goal of the shortest route or the minimum fuel consumption or noise impact. Most of them start from the micro perspective such as the local horizontal or vertical profile of a single route, but lack of solving the environmental impact of the route network in the terminal area from the macro level. In addition, in the existing priority evaluation mode of route network, the number of evaluation indexes is small and it is difficult to provide scientific decision-making. In order to develop the safe, efficient environmentally and friendly route network, this paper proposes a terminal area route network optimization method for reduction of air emissions and noise.
This paper establishes a route network optimization model by considering fuel consumption, air emissions, aviation noise factors and operation efficiency, uses non-dominated sorting genetic algorithm with elitist strategy to search the optimal results, and then compares with before optimization route network terminal area for analysis.
2. Description
The route of the terminal area is a network structure composed of all approach routes and departure routes in the terminal area. Currently, the arrival and departure routes of the terminal area are planned and designed according to the flight procedure rules specified in ICAO Doc8168 [26]. The designer uses simple auxiliary tools to complete the procedure and makes operational rules and restrictions by considering the factors such as airport layout, aircraft performance, meteorological conditions, navigation facilities and airspace restrictions.
At present, safety is the primary goal of terminal area flight procedure construction, and the terminal area route network planning method with manual design as the main means, so the economy and sustainability of the flight in the terminal area cannot be taken into account simultaneously due to subjective and objective limitations. Under the background of green transportation, the fuel economy and environmental impact of the terminal area should be considered in the planning and design stage of terminal area route network.
2.1. Environmental Impact
When aircraft flying in the terminal area, the pollutants discharged by the aircraft will directly threaten the health of animals and plants due to the low flight altitude; and the noise will affect the surface covered by the route network and damage the ecological environment. Therefore, the environmental influence on the terminal area mainly includes air emissions and noise.
2.1.1. Air Emissions
The air pollutants discharged by aircraft in the terminal area include nitrogen oxide (NOX), carbon monoxide (CO), hydrocarbon (HC), sulfur oxide (SOX), etc. The emission of pollutant gas is related to its emission index (EI)), fuel flow rate and emission time. The emission of pollutant gas can be expressed as:
where, Em is the emission of pollutant m, EGi is the number of engines of aircraft i, FFi is the fuel flow rate of a single engine of aircraft i in ti time, EIi,m is the emission index of pollution gas m of aircraft i, and ti is the flight time of aircraft i. The operational characteristics of aircraft engines are related to atmospheric conditions. If there is any deviation from International Standard Atmosphere (ISA), it needs to be corrected. According to the reference emission index of the engine emission database (EDB version 23) of the International civil aviation organization, the emission index value under non-standard atmosphere can be calculated based on the actual meteorological conditions.
2.1.2. Noise
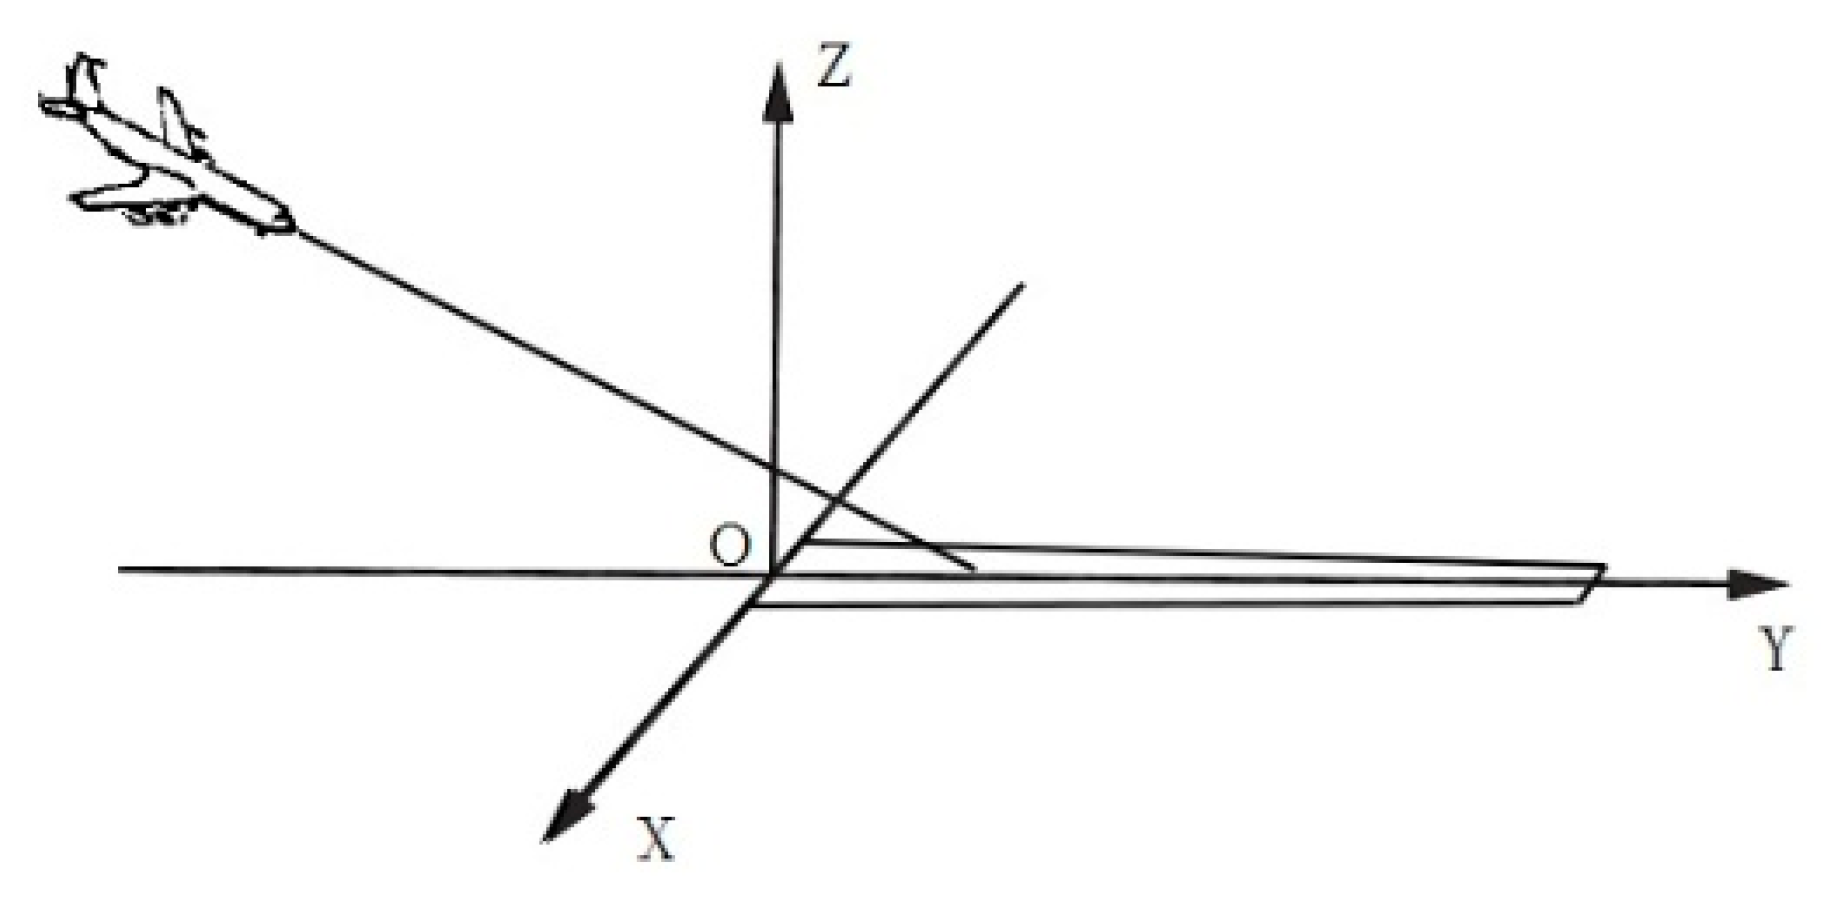
Aviation noise has the characteristics of spatiotemporal discontinuity and accumulation, so it is necessary to construct a coordinate system when evaluating the noise level. In this paper, the Cartesian coordinate system is constructed: the origin is the midpoint of the airport runway; the X-axis is through the origin and perpendicular to the runway centerline, and the right side of the approach route is positive; the Y-axis is consistent with the runway centerline, and it is positive after the runway threshold; the z-axis is the vertical axis through the origin, the runway entry elevation is zero and the value higher than the entry plane is positive, as shown in Figure 1.
In China, we use weighted equivalent continuous sensible noise level (WECPNL) [27] to measure the noise level. The calculation formula is as follows:
where, N1 is the number of aircraft from 07:00 to 19:00 during the day, N2 is the number of aircraft from 19:00 to 23:00 in the evening, N3 is the number of aircraft from 23:00 to 07:00 at night, T0 = 10 s is the reference time, is the average effective perceived noise level, is the single event noise level generated by aircraft i on the measuring point (x,y) when flying in the k segment of the route j, which value can be calculated by regression analysis of the Noise-Power-Distance (NPD) data from Aircraft Noise and Performance Database (ANP) [28].
Currently, most researches take the coverage of noise level as the evaluation indicator, but it cannot directly and accurately reflect the impact of aviation noise on the surrounding residents. This paper refers to the noise exposure population evaluation method proposed by Jinhua Li [13,14], divides the covered area of the terminal area into several grids with an area of S, and takes the center of the grid as the noise measuring point. According to the density distribution of residents, the total population of different noise level was calculated. The population which are exposure to greater than noise level L dB can be expressed as follows:
where, G(x,y) represents the grid with the center coordinate of (x,y), ρ(x,y) represents the population density within G(x,y), person/m2, q(x,y) represents the population quantity within G(x,y), represents the noise value of G(x,y), and AS represents the evaluation range of the terminal area.
2.2. Operation Conflict
There is a large number of intersections and convergence because air traffic flows are dense and variable in terminal area, it is easy to cause air traffic jam, flight delay, and dangerous approach. In order to solve the flight conflict caused by the space configuration of terminal area route, this paper proposes the method of assessing the route planning priority (Section 3.2) and setting route protection zone.
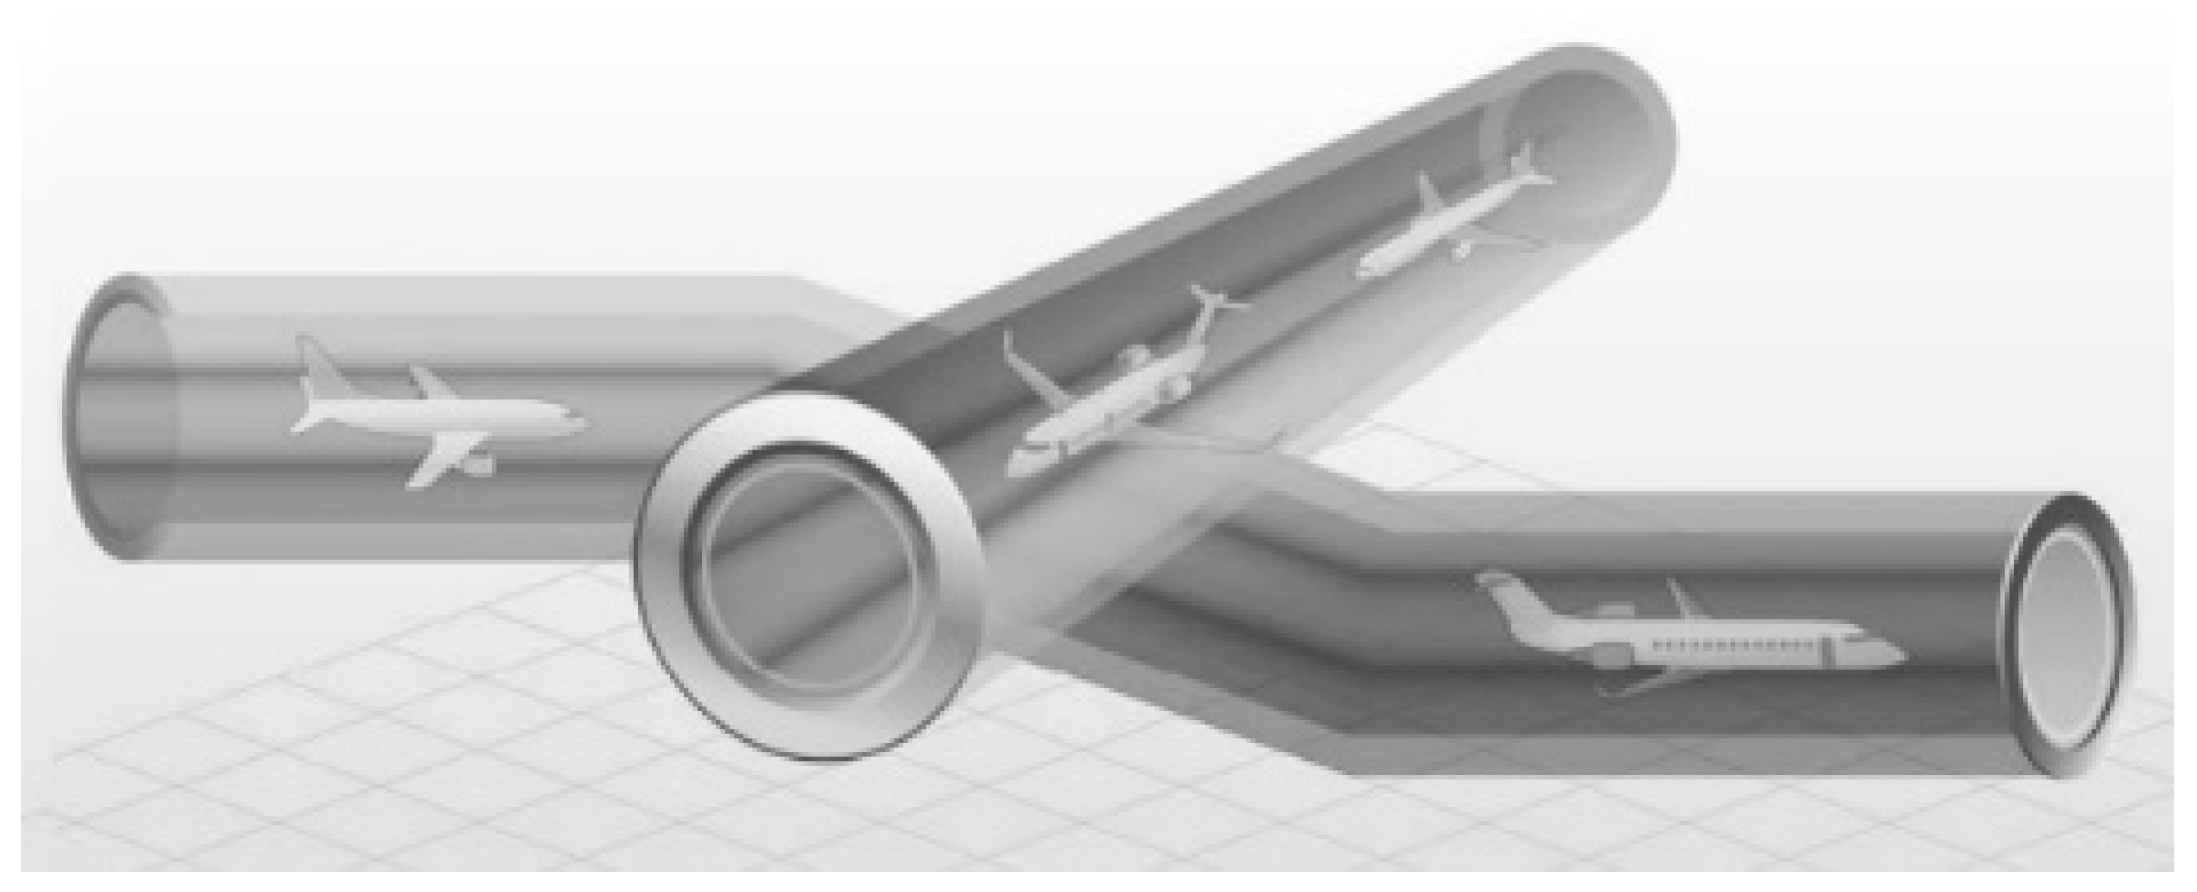
The priority of each route is evaluated, and the emission reduction and noise reduction optimization of each route is carried out successively according to the priority evaluation sequence of routes before the route planning of route network in the terminal area. During the optimization of each single route, the route protection area of terminal area is set up to avoid the mutual influence among route networks. This paper sets the route protection interval referring to the setting method of aircraft safety protection zone which is specified in ICAO Doc4444 [29]: the minimum horizontal separation of aircraft is 5000 m, the height of the altitude interval is 300 m. The route protection zone in the terminal area is shown in Figure 2.
3. Model
According to the operational characteristics of the route and the aircraft performance, this section constructs the terminal area route network optimization model for emission reduction and noise reduction. In order to standardize the optimization process and facilitate the problem description, the following assumptions are made for the model: (1) all aircraft fly along the designated route without considering the flight deviation caused by navigation or pilot operation; (2) the airspace resources of the terminal area are not restricted except for obstacles, (3) the time can be divided into equally time slots, and the meteorological data remains unchanged in each slot.
3.1. Aircraft Performance
Fuel consumption, aviation emissions, and noise are related to the flight status of aircraft and engine operation characteristics. In this paper, a 3-dof aircraft dynamic motion mode was established combined with aerodynamics and the base of aircraft data (BADA) model [30]. The particle model of aircraft includes: coordinate (x,y,z), true airspeed(VT), flight path angle (γ), bank angel (μ), heading angle (λ), engine thrust (F), drag (D), aircraft mass (m), flight height (H), etc., regardless of wind speed and ignoring the high lift device effect, the aircraft particle mode is expressed as follows:
3.2. Route Planning Priority
In order to reduce the optimization complexity, this paper proposes the method of route planning priority in the terminal area. The planning and design method of terminal area route should consider the operation requirements, such as flight procedure construction specification (ICAO Doc8168), flight flow distribution, aircraft type distribution, flight time distribution, flight attributes and etc. In order to make the best use of the airspace resources, reduce the environmental impact and avoid flight conflicts physically, the priority of the route planning should be evaluated from three aspects: operational efficiency, airspace utilization and environmental impact.
Operational efficiency refers to the influence of each route on the terminal area operation, and can be evaluated by considering the characteristic of the flight attributes, the routes directions and etc.
Resource utilization refers to the utilization of airspace resources in the terminal area, including time resources and space resources, and can be evaluated by taking the flight flow distribution and rules of the route into considerations.
Environmental impact refers to the impact of each route on the environment of terminal area and surroundings, including air emission and noise, and can be evaluated by considering aircraft type distribution rule and flight characteristics of the route.
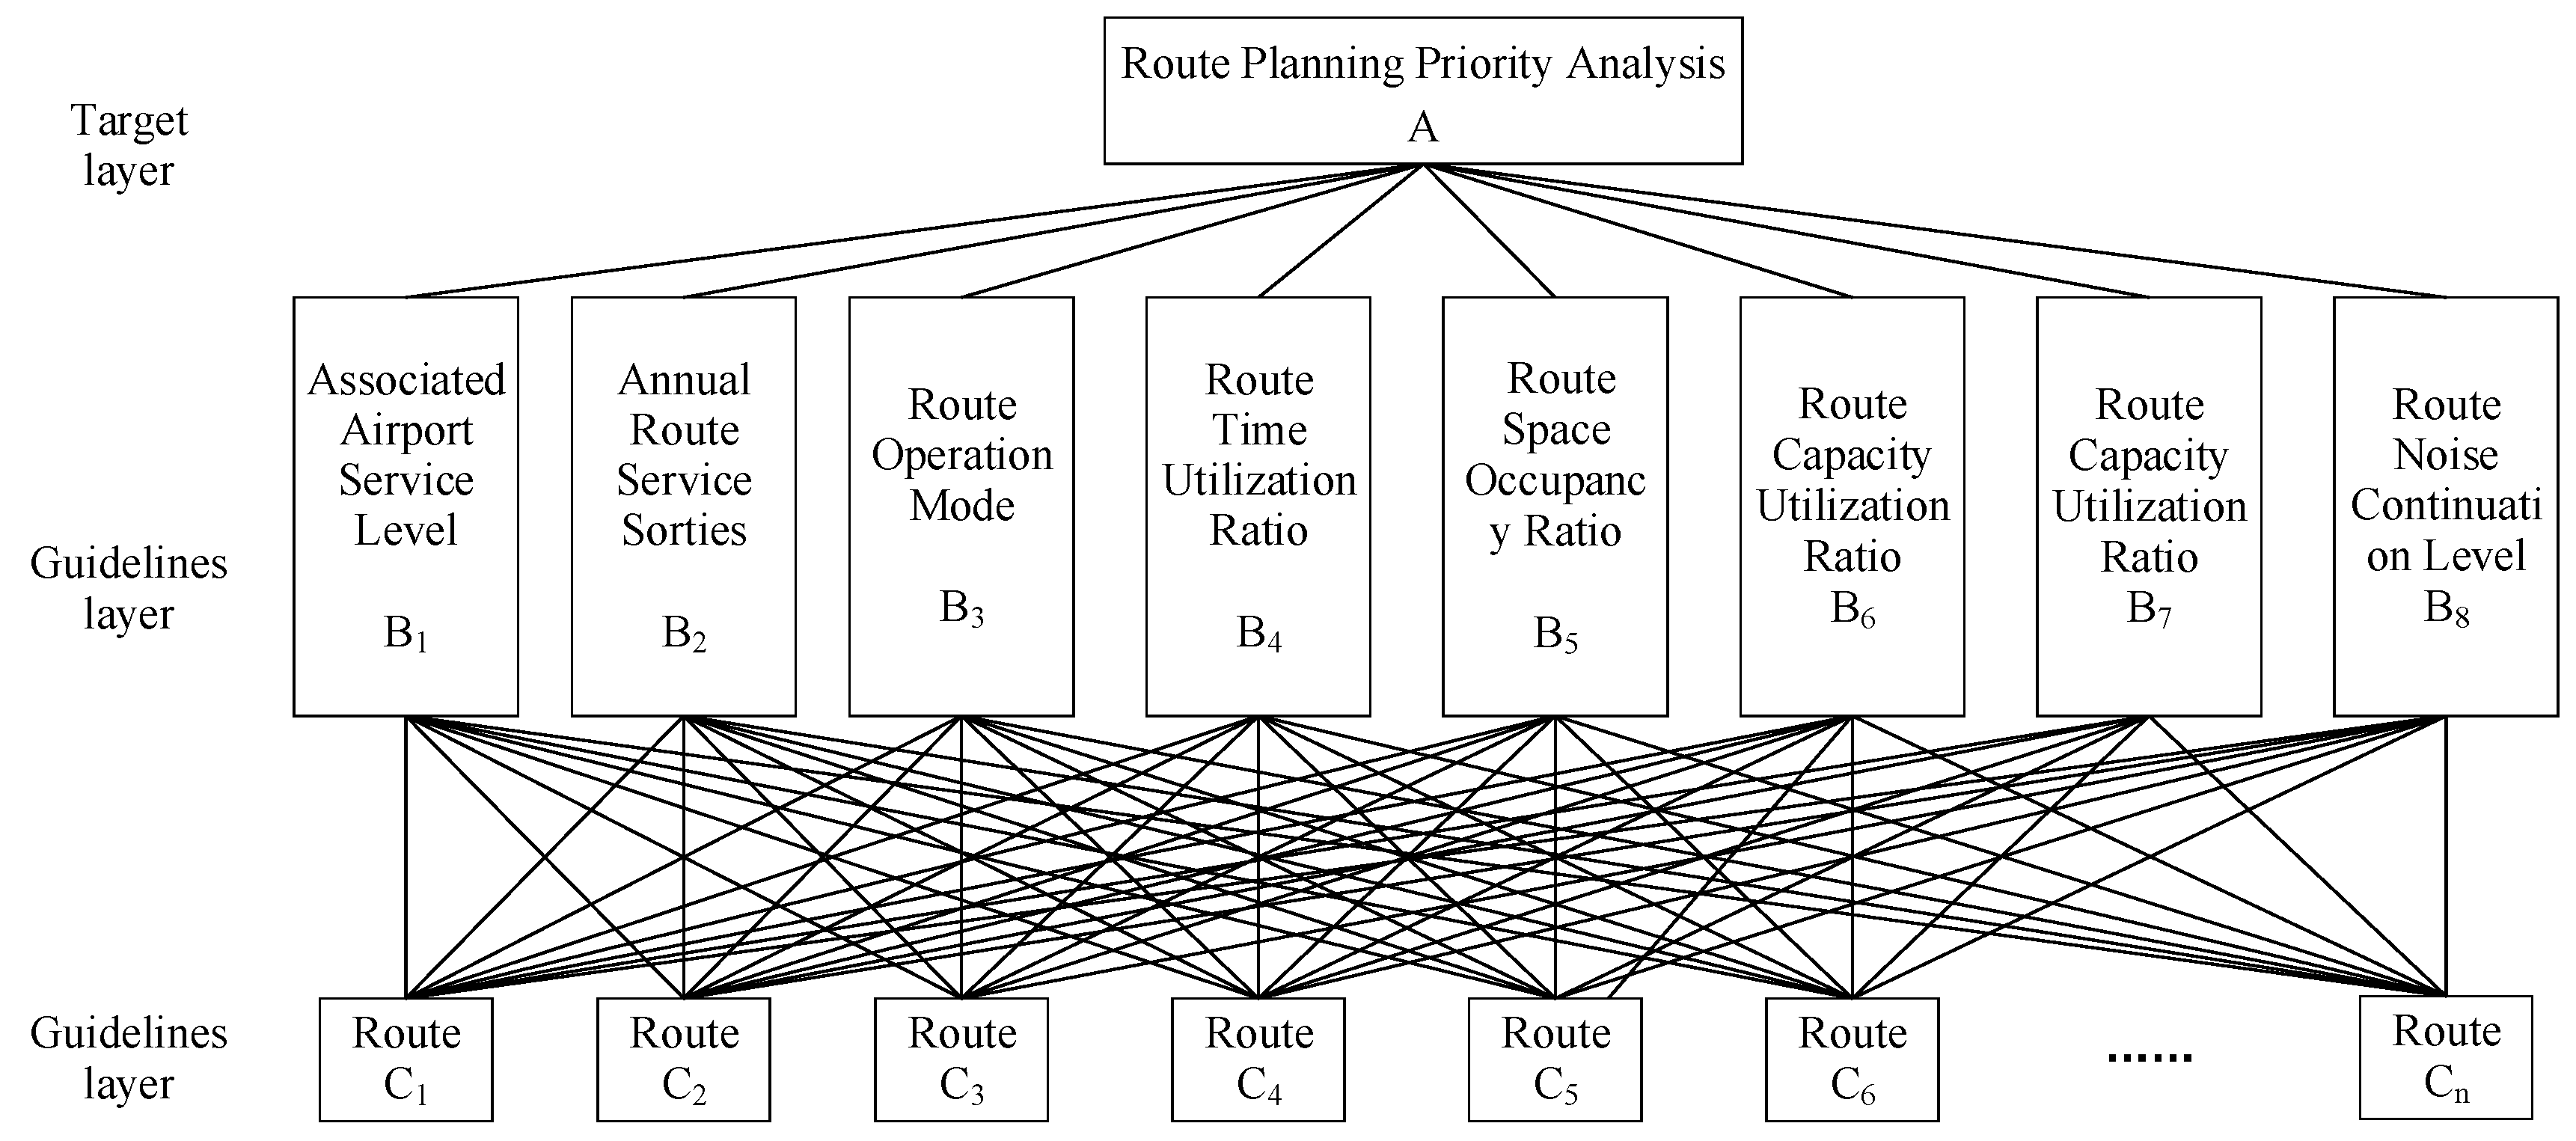
According to the definition of operational efficiency, airspace utilization and environmental impact, this paper chooses 8 evaluation index of route planning priority: associated airport service level, annual route service sorties, routes operation mode, route time utilization ratio, route space occupancy ratio, route capacity utilization ratio, route air emissions and route noise level. The Analytic Hierarchy Process (AHP) is adopted to establish the route planning in the analysis of the priority ladder class structure mode, as shown in Figure 3. According to the characteristics of airport operation, the priority of route planning in terminal area route network can be determined.
3.3. Method of Route Segment Construction
In order to optimize the route in the available airspace of the terminal area, this paper adopts the method of route segmentation and searches optimal result in both horizontal and vertical space. The starting and ending points of the arrival and departure routes are set as follows:
- The starting point of the arrival route is the arrival fix at the boundary of the terminal area, and the ending point of the arrival route is the tangent of the glide path and the outer marker;
- The starting point of departure route is the runway threshold, and the ending point of departure route is the departure fix on the terminal area boundary.
The route is divided into several segments in airline route selection, the segment length is . The candidate points of segments were constructed in horizontal and vertical planes respectively to form the segment search space. By combining the candidate points of any adjacent segments, the terminal area arrival and departure routes are finally formed.
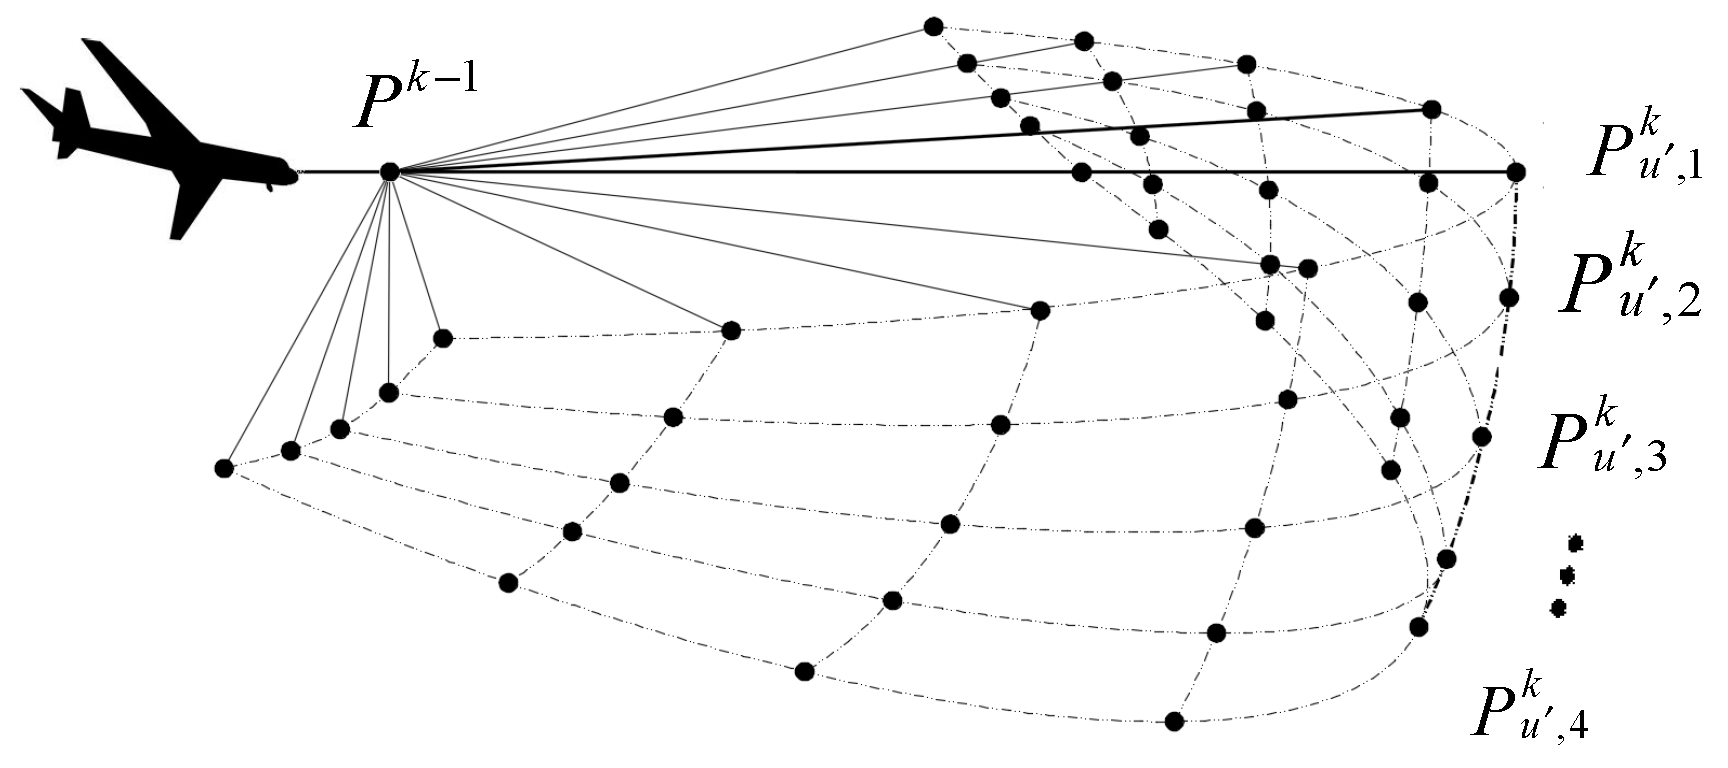
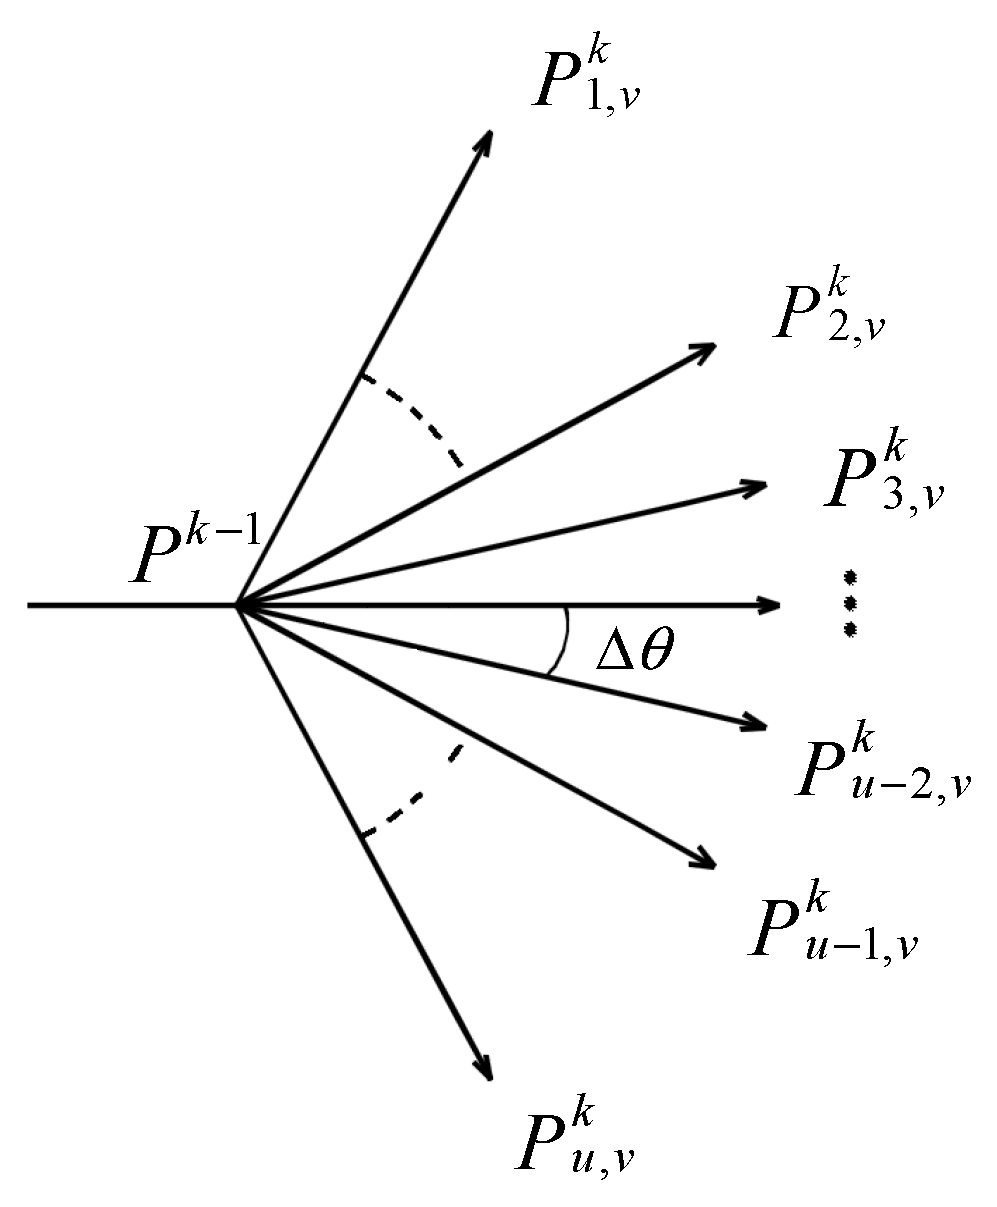
is the candidate point of segment k, and the search space of segment k is u column, v row, , , , represents the 3D coordinates of the candidate point of segment, , represents the heading angle and flight path angle of segment k, as shown in Figure 4, is the end point of segment k-1 and the starting point of segment k.
When the candidate points of segments were constructed, according to aircraft performance, passenger comfort and flight safety requirements, the maximum deviation angle of the segment is set as the minimum deviation angle of aircraft type i in the horizontal profile, and the horizontal angle between adjacent candidate points in the arrival and departure route is set as , therefore, the heading angle , , as shown in Figure 5.
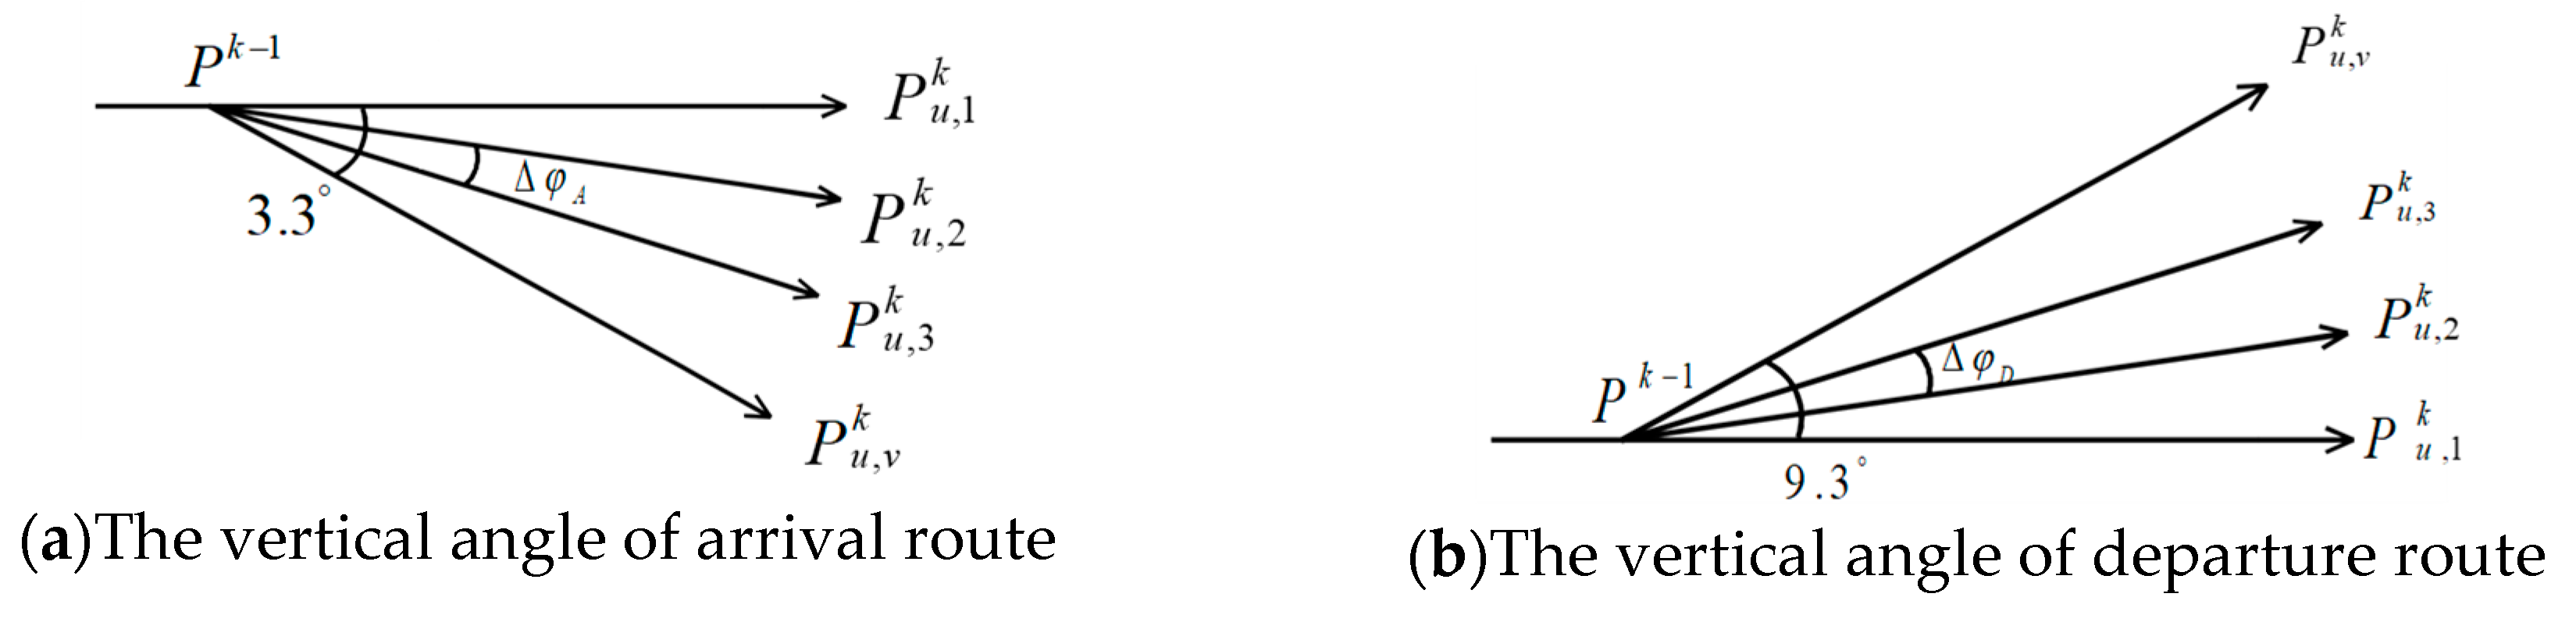
The flight path angle of arrival route should be 0 ~ 3.3° in the vertical profile [26], so the vertical angle between adjacent segment candidate points of arrival route is set to 1.1°, as shown in Figure 6a. The flight path angle of departure route should be 0 ~ 9.3° [26], so the vertical angle between adjacent segment candidate points of departure route is set to 3.1°, as shown in Figure 6b. Therefore, the pitch angle , .
3.4. The Optimization Mode
3.4.1. The Objective Function
The purpose of route optimization in this paper is to achieve the reduction of air emission, noise level and cost on the basis of ensuring safety and improving efficiency. Therefore, this paper establishes the optimization objective from two perspectives of reducing air emissions and reducing noise.
1. Minimum aviation pollutant emission
Reducing the air emissions of pollution gas is one of the important goals of the development of green aviation. Because the emission level of each pollution gas is too different, the air emission need to be normalized. Therefore, the objective of minimizing the normalized air emissions can be expressed as:
where, is the number of i-type-aircraft in route j, represents the total air emissions in route j, , , respectively represent the air emissions of pollutant gas m of i-type-aircraft during descending, level flight, and climbing in segment k, , , respectively represent the flight time of i-type-aircraft during descending, level flight, and climbing in segment k, , , respectively represent the fuel flow rate of i-type-aircraft during descending, level flight, and climbing in segment k, , , respectively represent the emission index of pollutant gas m of i-type-aircraft during descending, level flight, and climbing in segment k. , , and are decision variables, represents the ground distance from the vertical projection of segment k to obstacle o, is the vertical distance from segment k to obstacle o, w is the width of route protection zone, is the minimum obstacle clearance.
2. Minimum Noise Level
ICAO specifies that 65 dB is the maximum threshold of noise level in the residential areas, and noise below 65 dB is considered as a comfortable living environment. Therefore, this paper aims to minimize the total exposure population affected by noise level above 65 dB. The objective function is expressed as:
3.4.2. Constraint Condition
1. Segment Point Uniqueness
Between each two adjacent segments, the candidate point of the previous segment can only be the starting point of the next segment, which should meet the following conditions:
where, is the amount of segments in route j.
2. Obstacle Clearance
The height of route in the terminal area should keep the minimum obstacle clearance (MOC) with the obstacles, that is:
where, (x0, y0) is the two-dimensional coordinates of the obstacle o, and the value of MOC refers to Doc8168 [26].
3. Segment Turning Constraint
Segment turning constraint is an indicator of route smoothness. In order to meet the requirements of aircraft maneuverability and passenger comfort, the deflection angle between segments should meet the following conditions:
where, is the length of segment k, is the average true speed of aircraft on segment k, and is the minimum turning angular speed of all types of aircrafts.
4. Flight Around the Restricted Area
The routes in the terminal area need to give priority to the flight around the restricted area or the dangerous area, and the following conditions should be met:
where, is the actual distance between the aircraft and the restricted area R, and DS is the safety interval between the aircraft and the restricted area which is about 33,000 feet (10,000 meters).
4. Numerical Case Study
In this chapter, Shanghai terminal area is selected as the research object. Runway 34 and 35L of Shanghai Pudong international airport (ZSPD) are used for arrival, while runway 35R is used for departure. Runway 36R for arrival and 36L for departure at Shanghai Hongqiao international airport (ZSSS). In the experiment, 16 typical routes are used as the analysis objects, and their names and codes are shown in Table 1.
Typical busy days in Shanghai terminal area (25 July 2017) were selected to provide the required atmospheric environment, flight plan, aircraft type ratio and other data. The total number of flights in Shanghai terminal area are 1782, among which the number of flights in ZSPD and ZSSS are 1086 (arrival 542, departure 544) and 696 (arrival 349, departure 347) respectively.
4.1. Priority of Route Planning
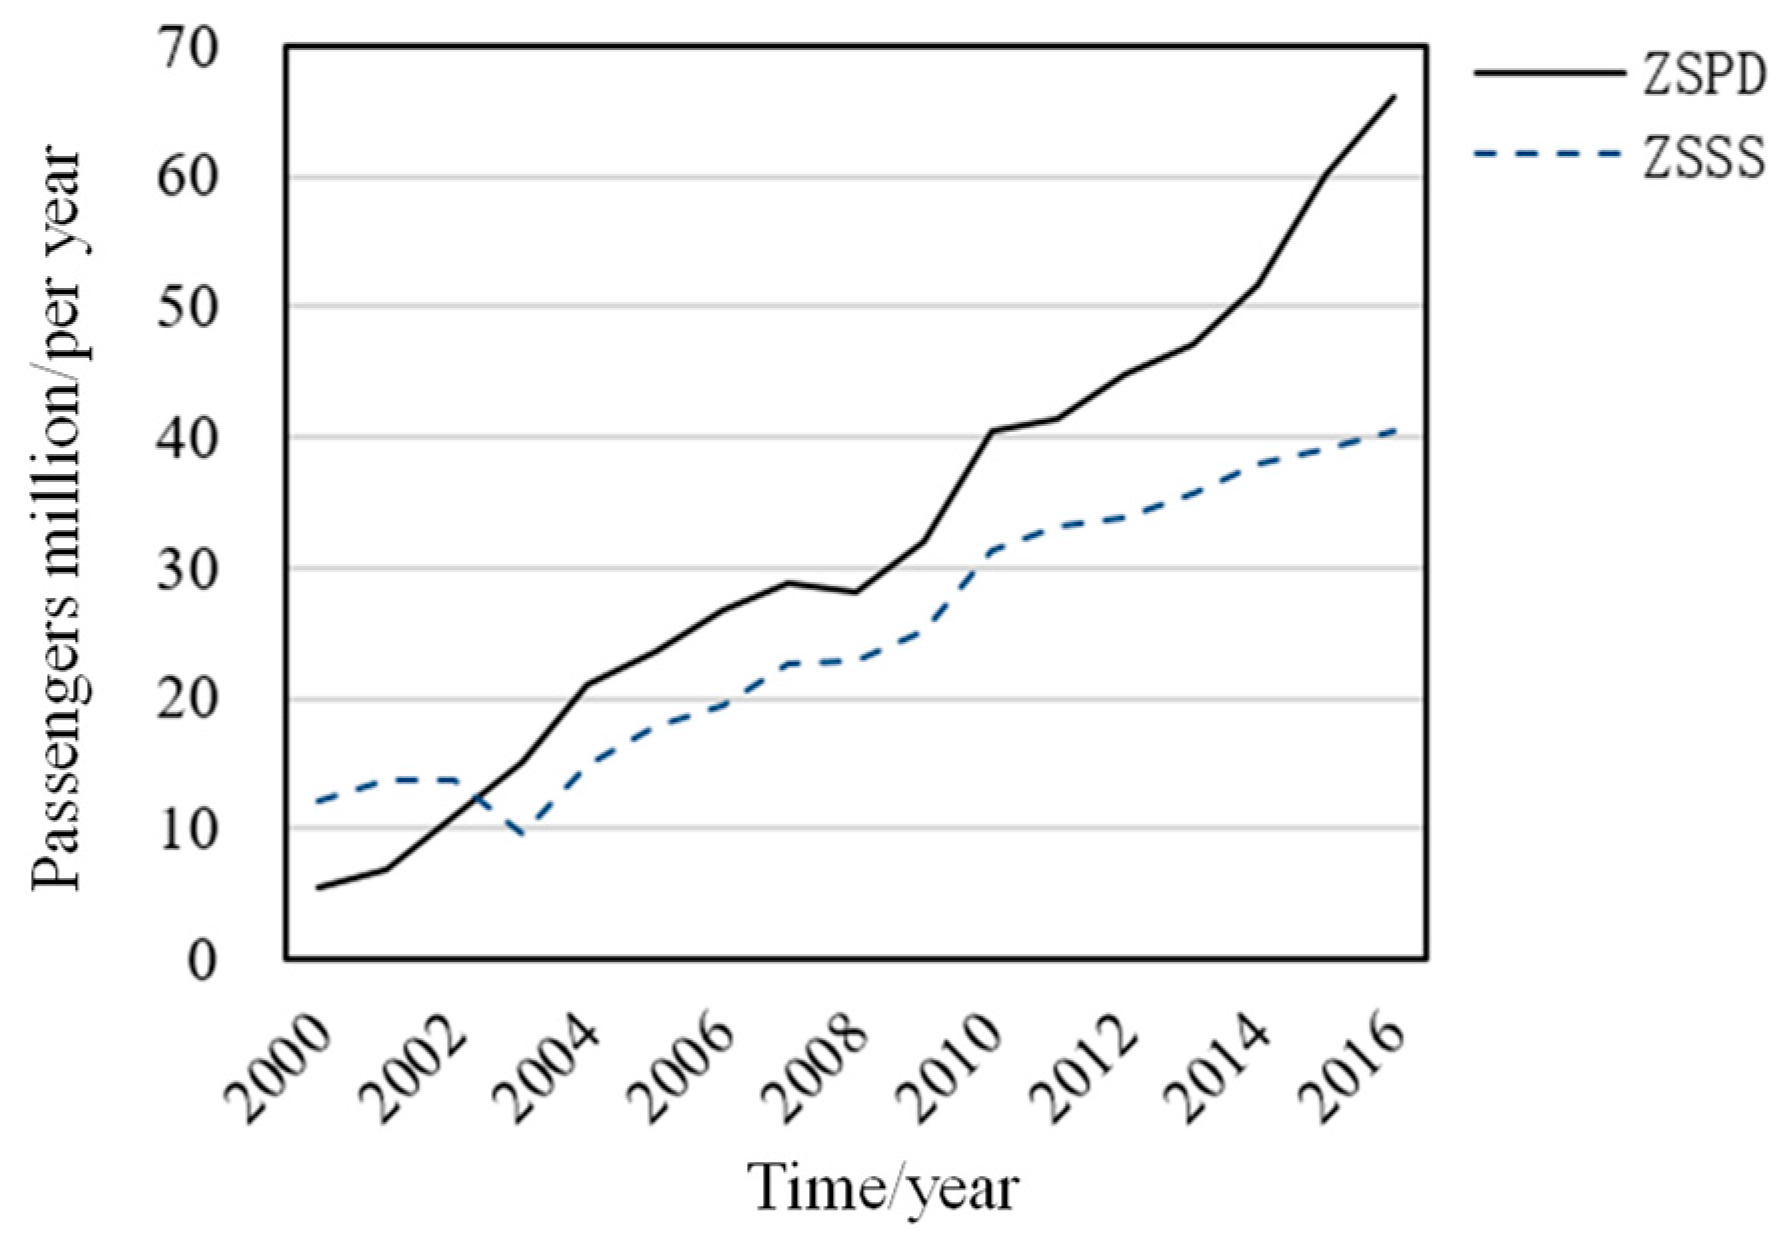
Based on the statistical analysis of historical data, the total passenger service of ZSPD and ZSSS over the years is shown in Figure 7. The aircraft movement area reference code of ZSPD is 4F, and the peak hour flights are 96, while aircraft movement area reference code of ZSSS is 4E, and the peak hour flights are 59.
Construct the priority evaluation index judgment matrix of route planning, as shown in Table 2.
By calculating the relative weight of each elements and performing the consistency check, the synthetic weight of each element can be calculated, and the priority of importance of each route is (from high to low): R13, R5, R6, R2, R14, R16, R11, R8, R9, R12, R3, R4, R10, R15, R7, R1, as shown in Table 3.
4.2. Optimized Result
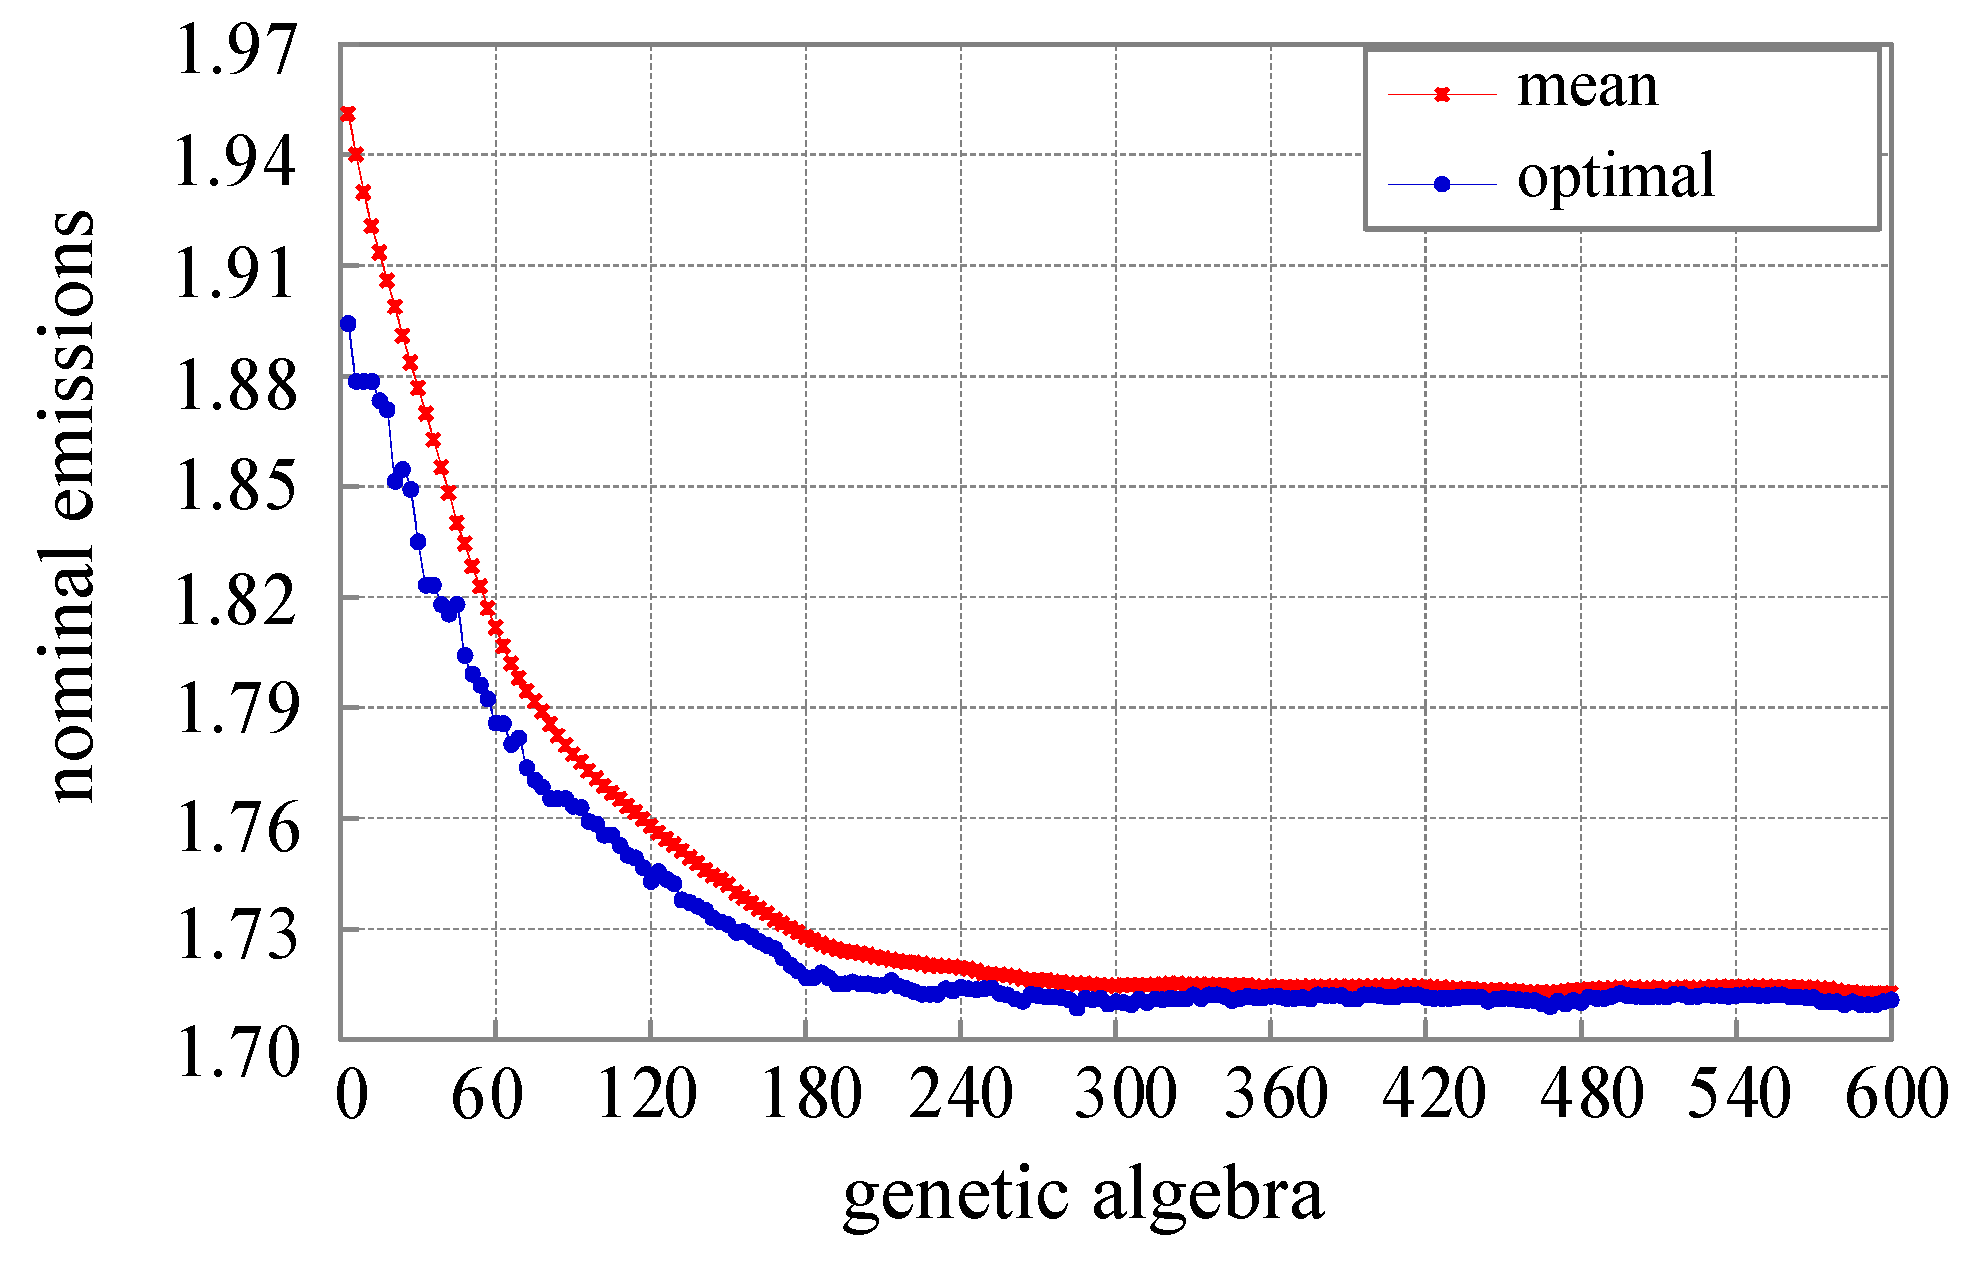
Because there are 16 routes in Shanghai terminal area and many candidate points of the flight segment, the optimization calculation work is heavy. In this paper, the genetic algorithm (NSGA-II) [31] with gene retention strategy is selected for solution. After optimization, the normalized emission of terminal routes decreased rapidly from 1.892 to 1.746 within 120 generations, and then decreased to 1.723 within 240 generations. After 300 generations, it tended to be stable with little fluctuation, as shown in Figure 8.
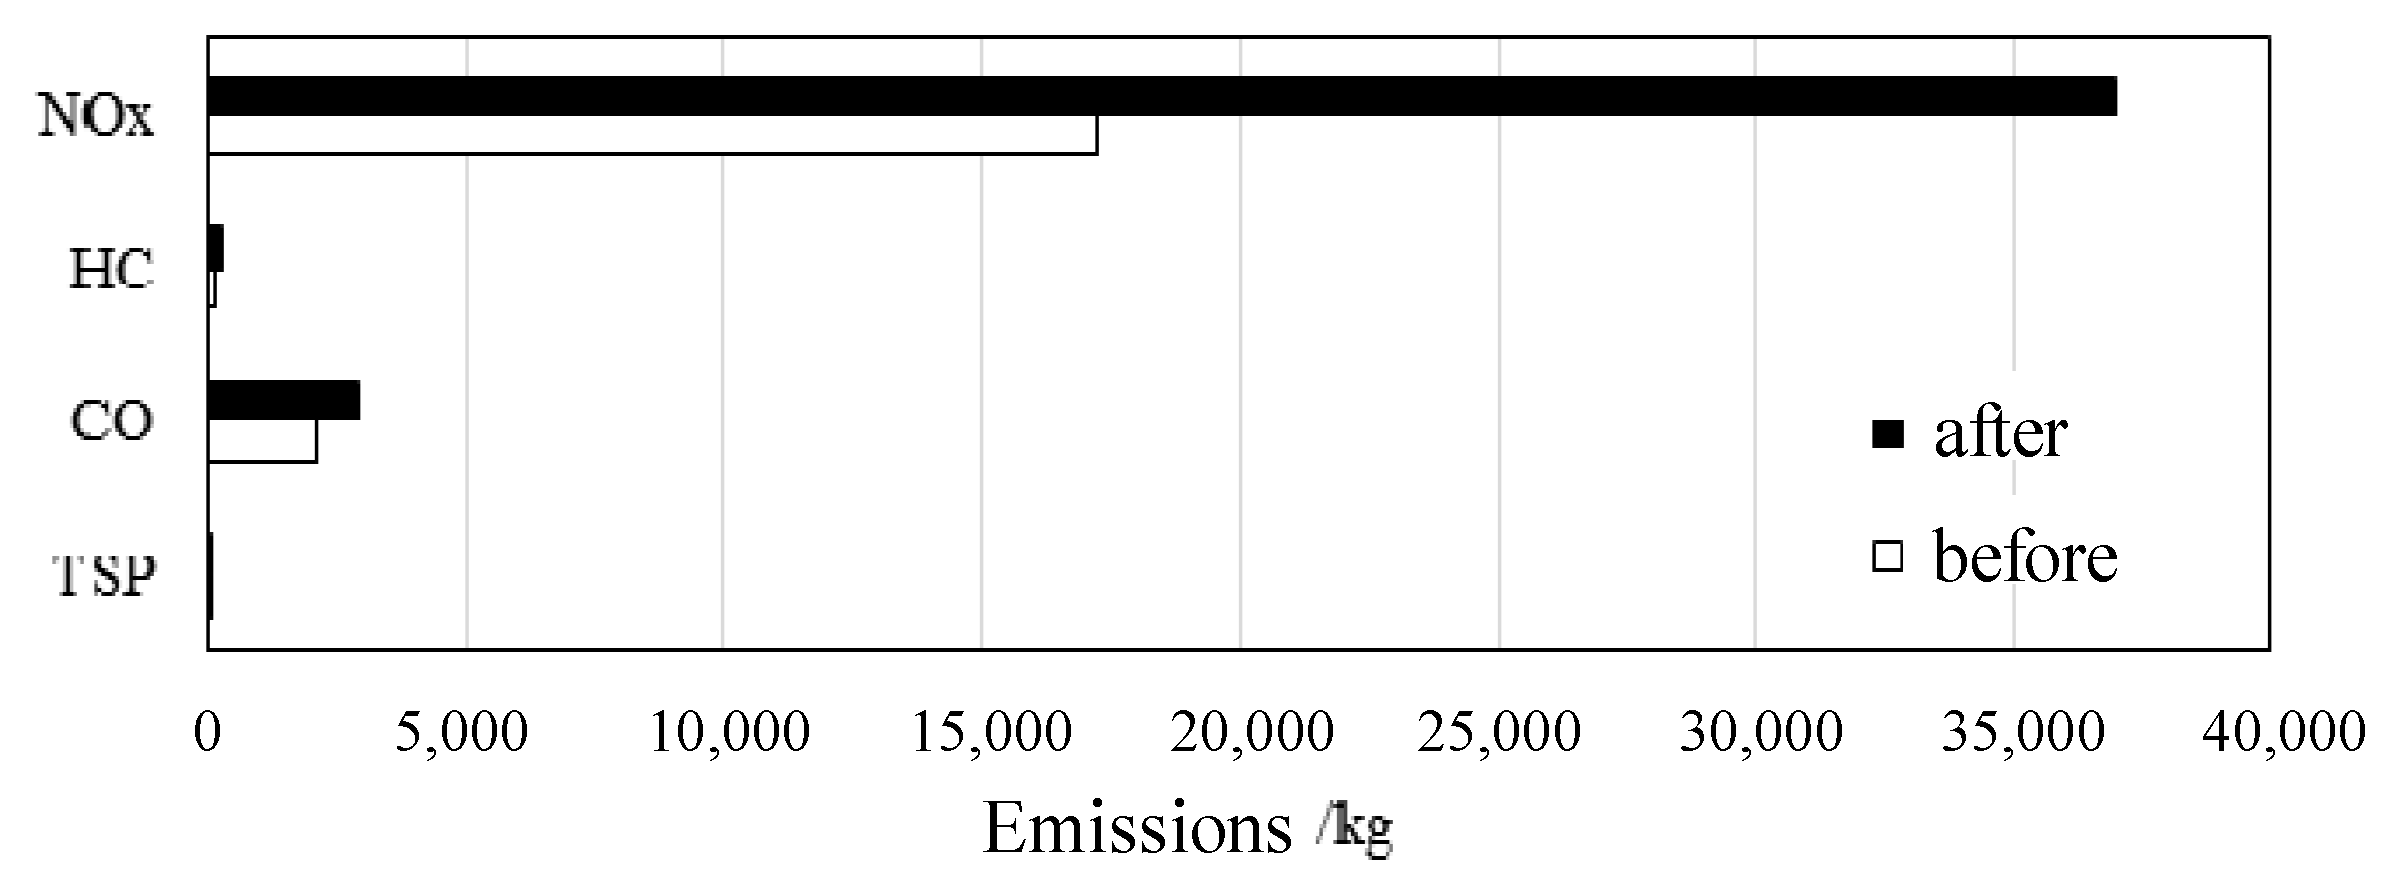
Comparing with the emissions before optimization, the pollutant emissions of the terminal area routes after optimization is decreased from 40,331.3 kg to 19,595.8 kg, and the decrement is 51.4%. The emission of NOx, HC, CO and total suspended particulate (TSP) are decreased from 36,998.9 kg, 297.8 kg, 2938.9 kg and 95.8 kg to 17,258.4 kg, 176.4 kg, 2106.4 kg and 54.6 kg, as shown in Figure 9.
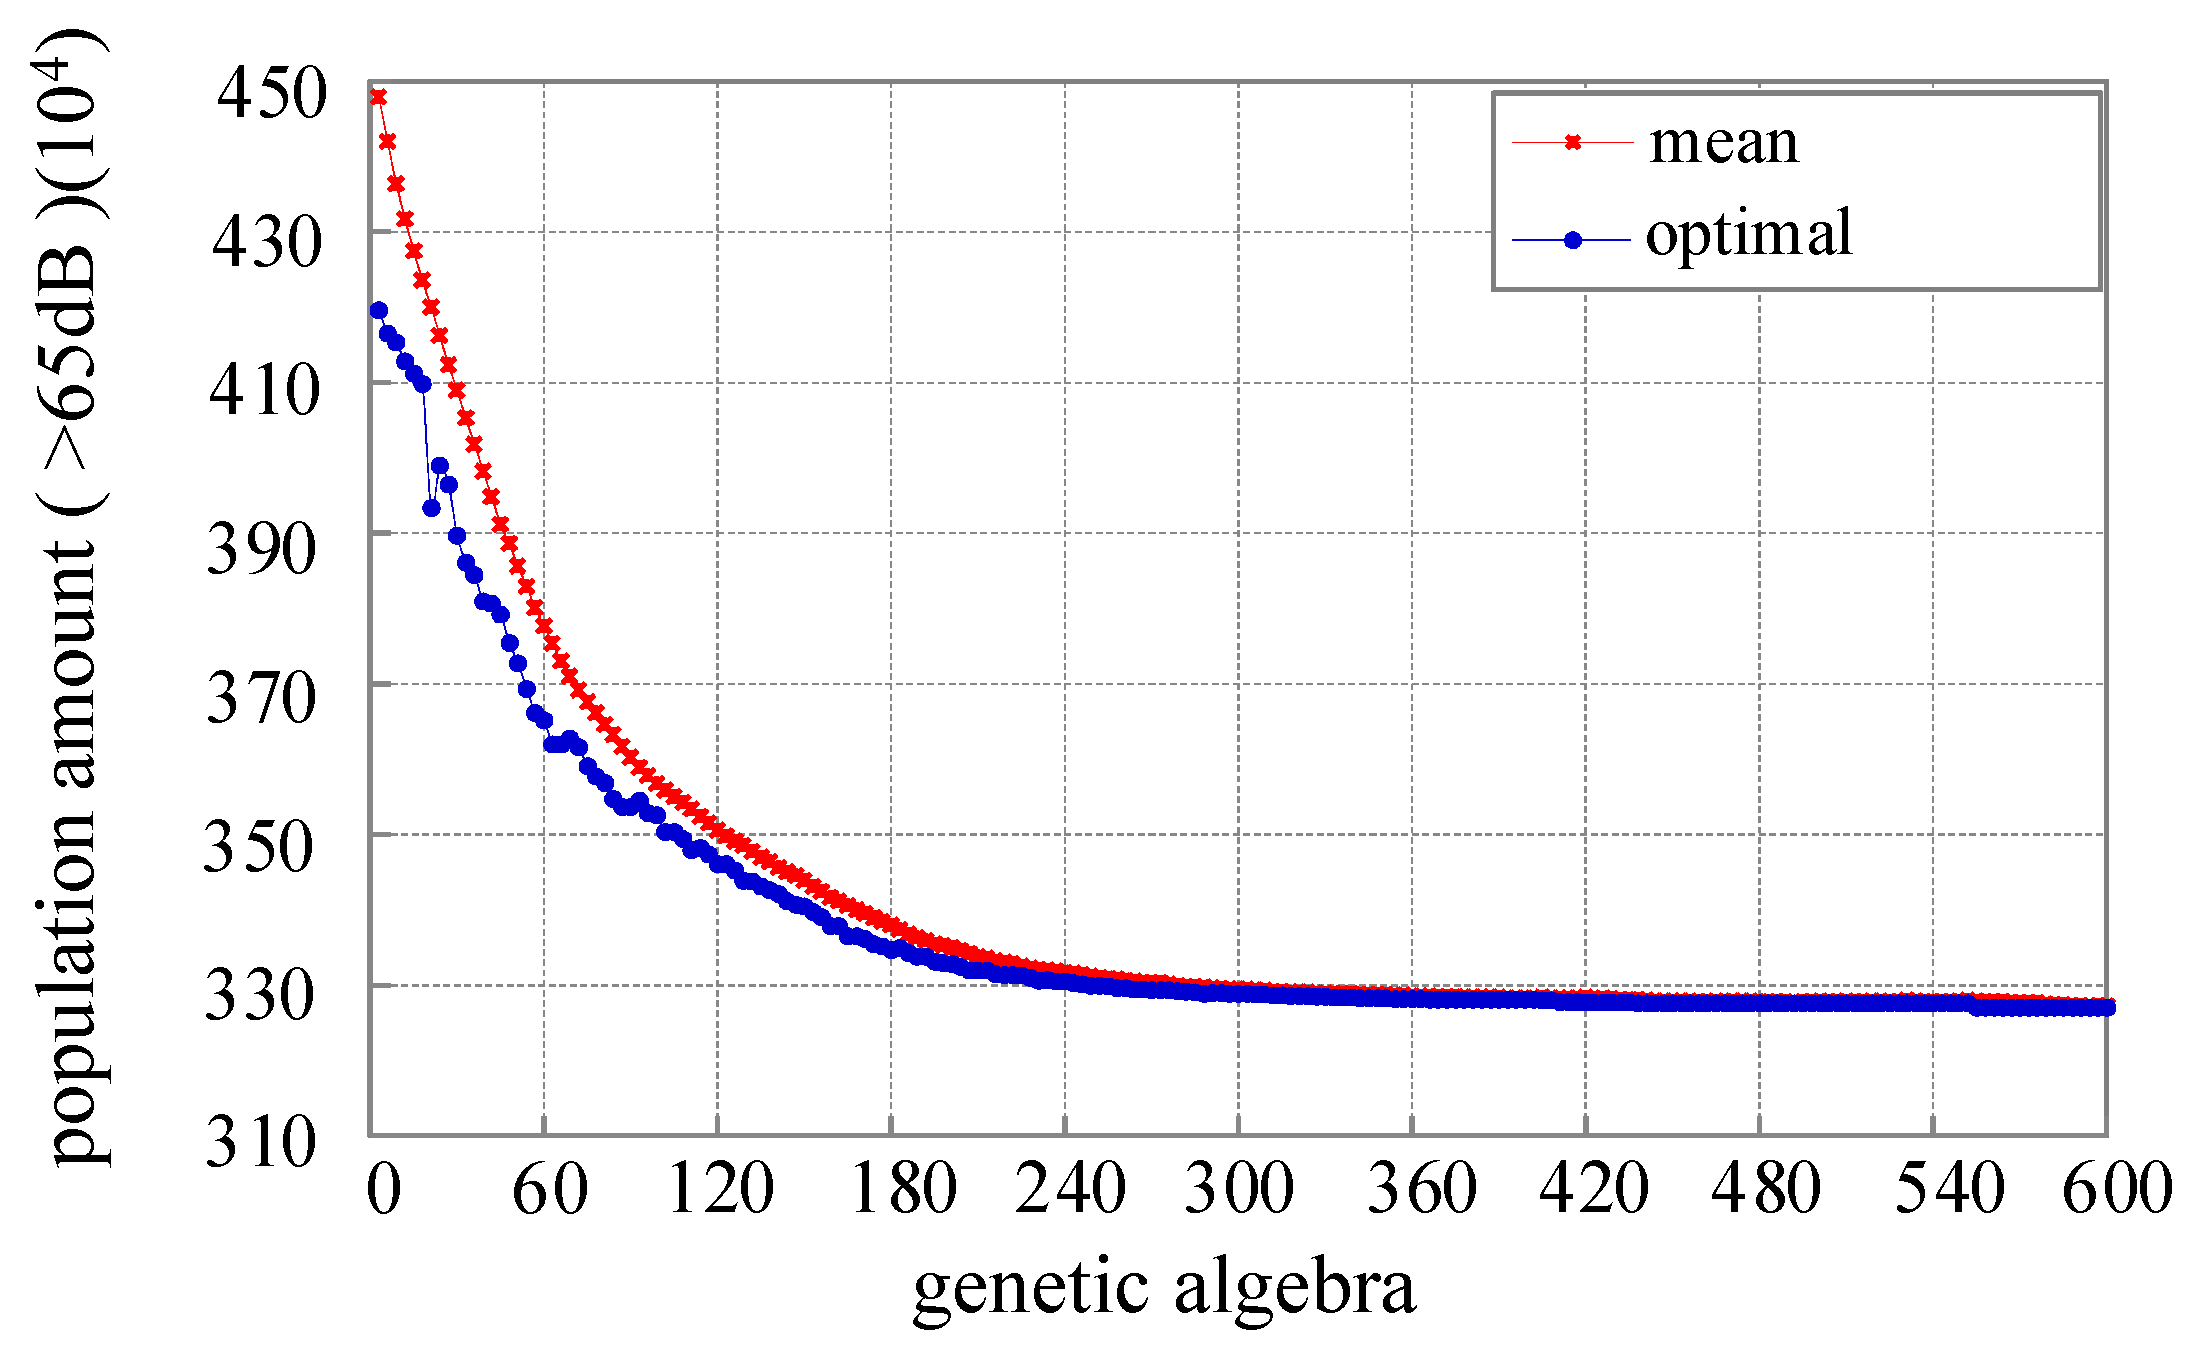
As shown in Figure 10, the exposure population affected by noise level above 65 dB are decreased rapidly from 4.181 million to 3.353 million within 180 generations. In the 180–240 generation, the optimal value decreased slowly, from 3.353 million to 3.31 million. After 300 generations, the fluctuation is very small.
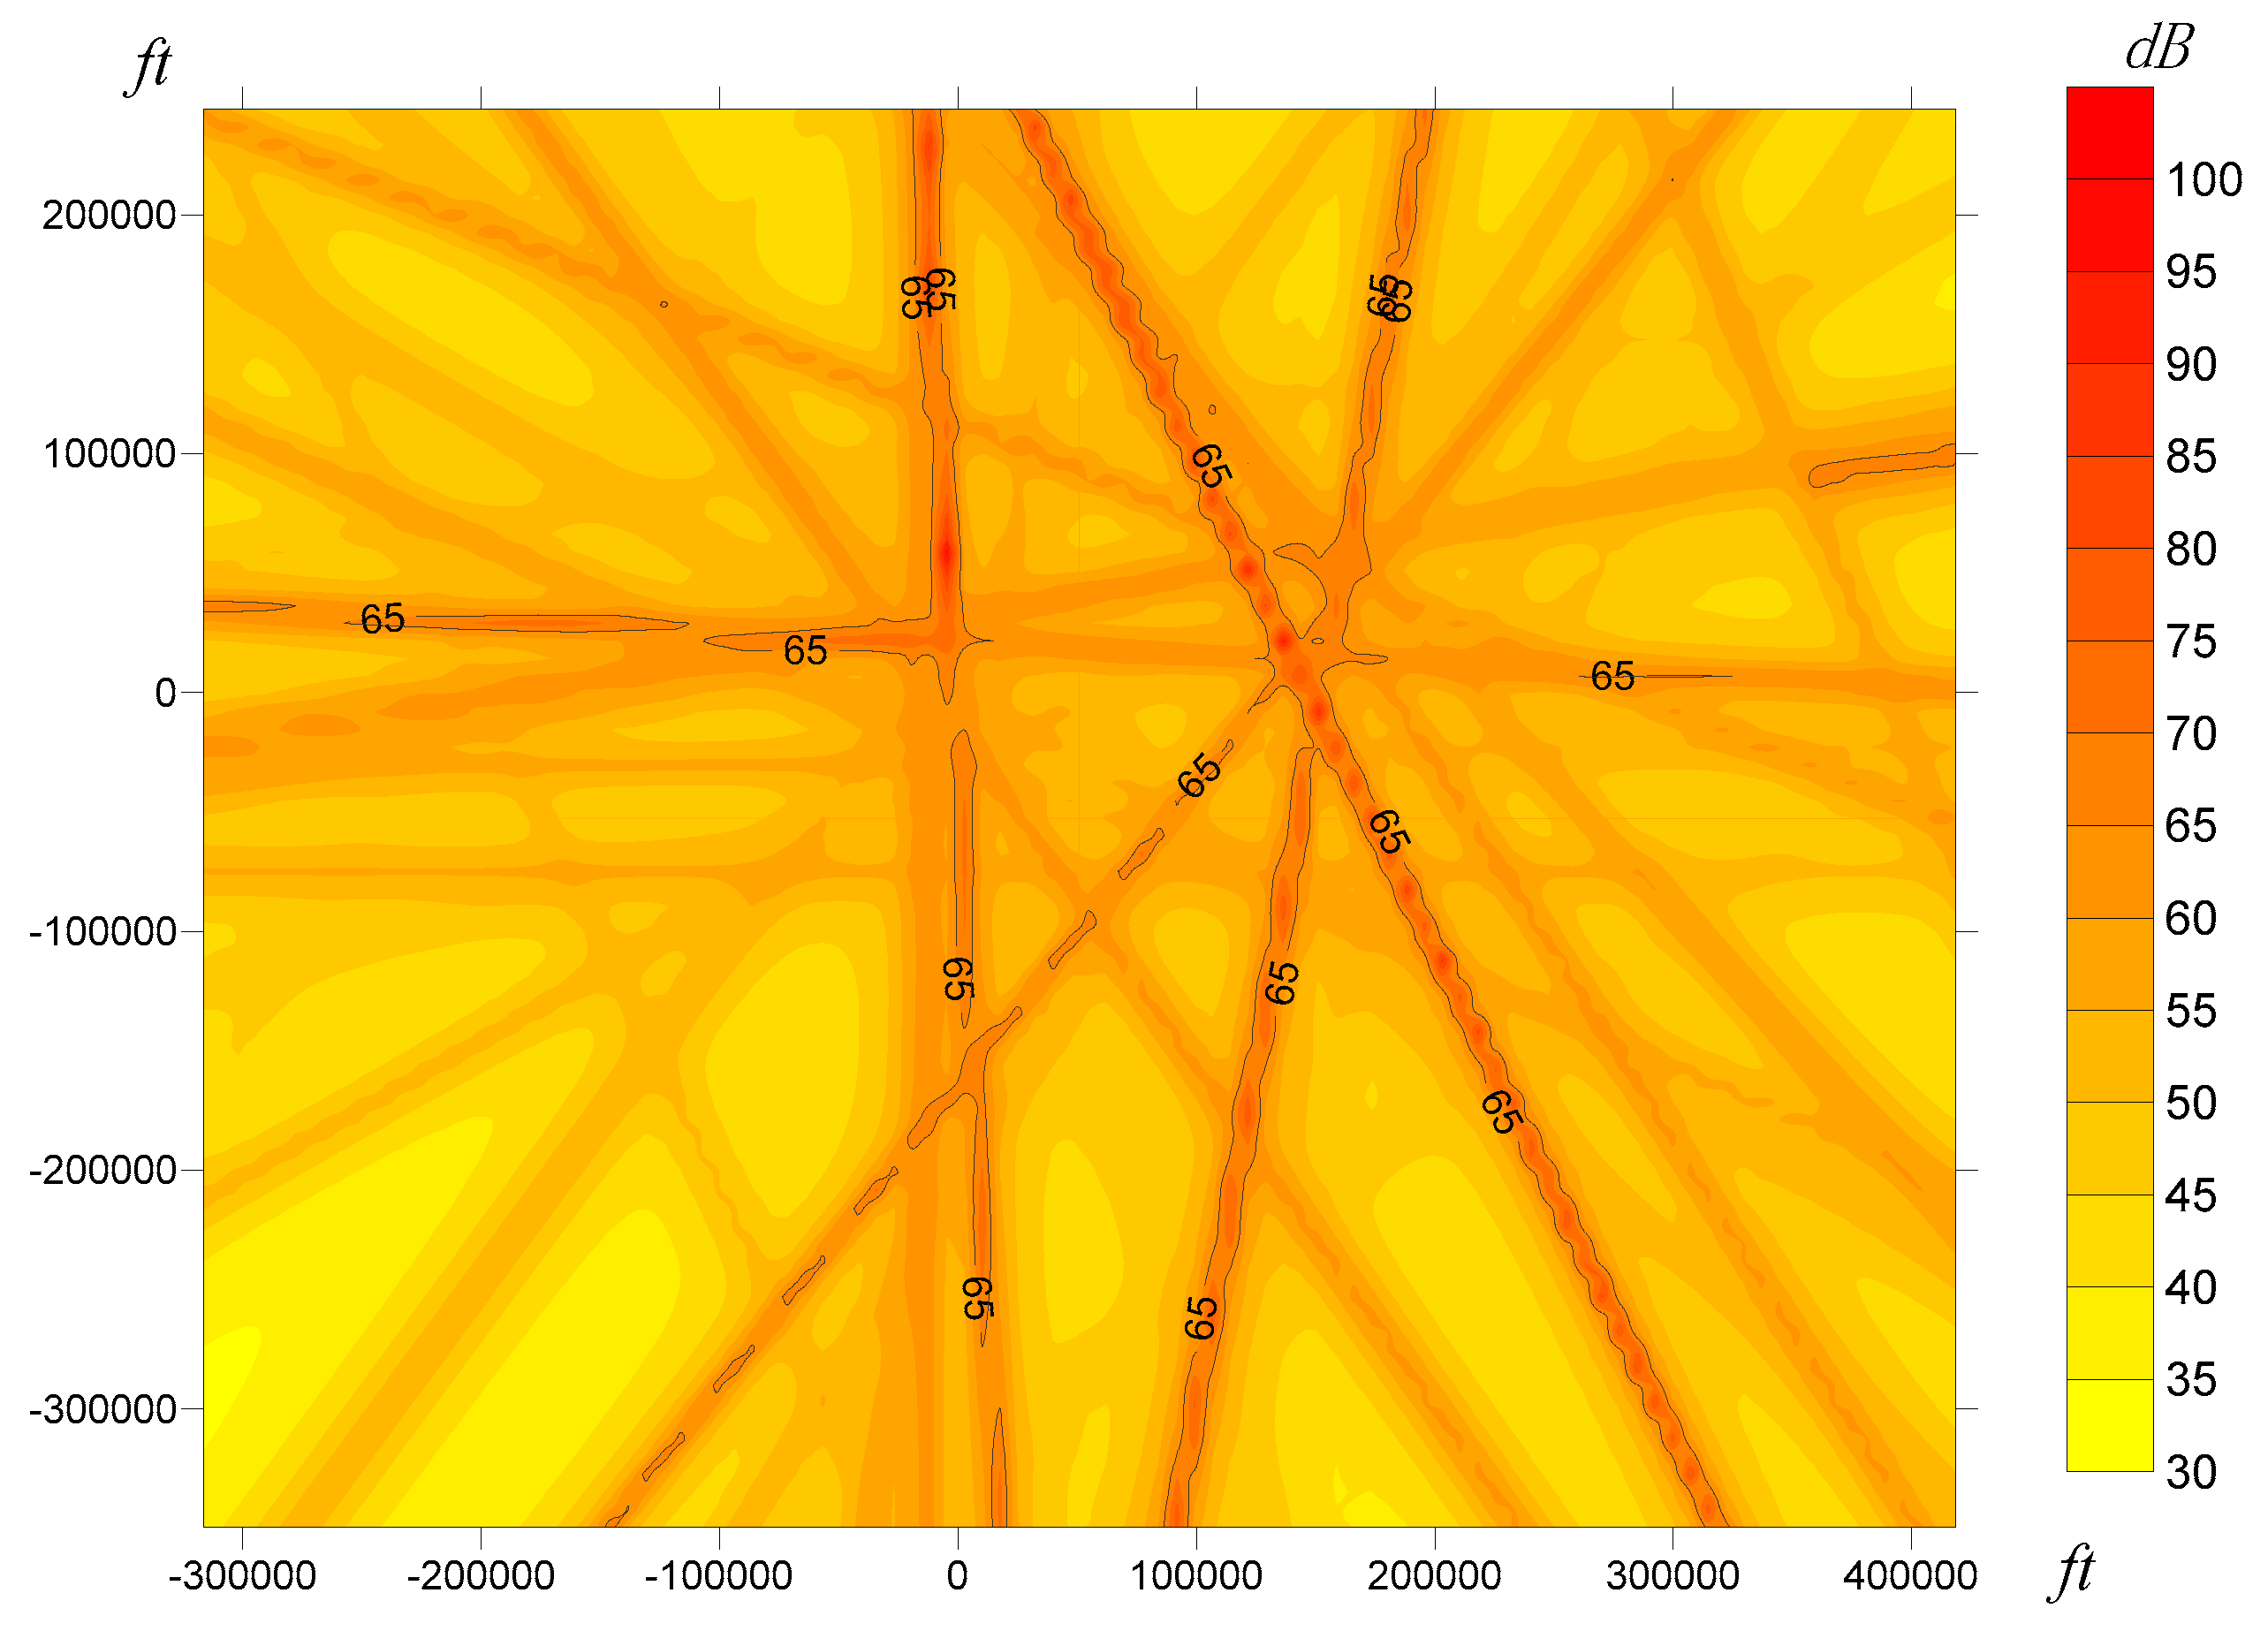
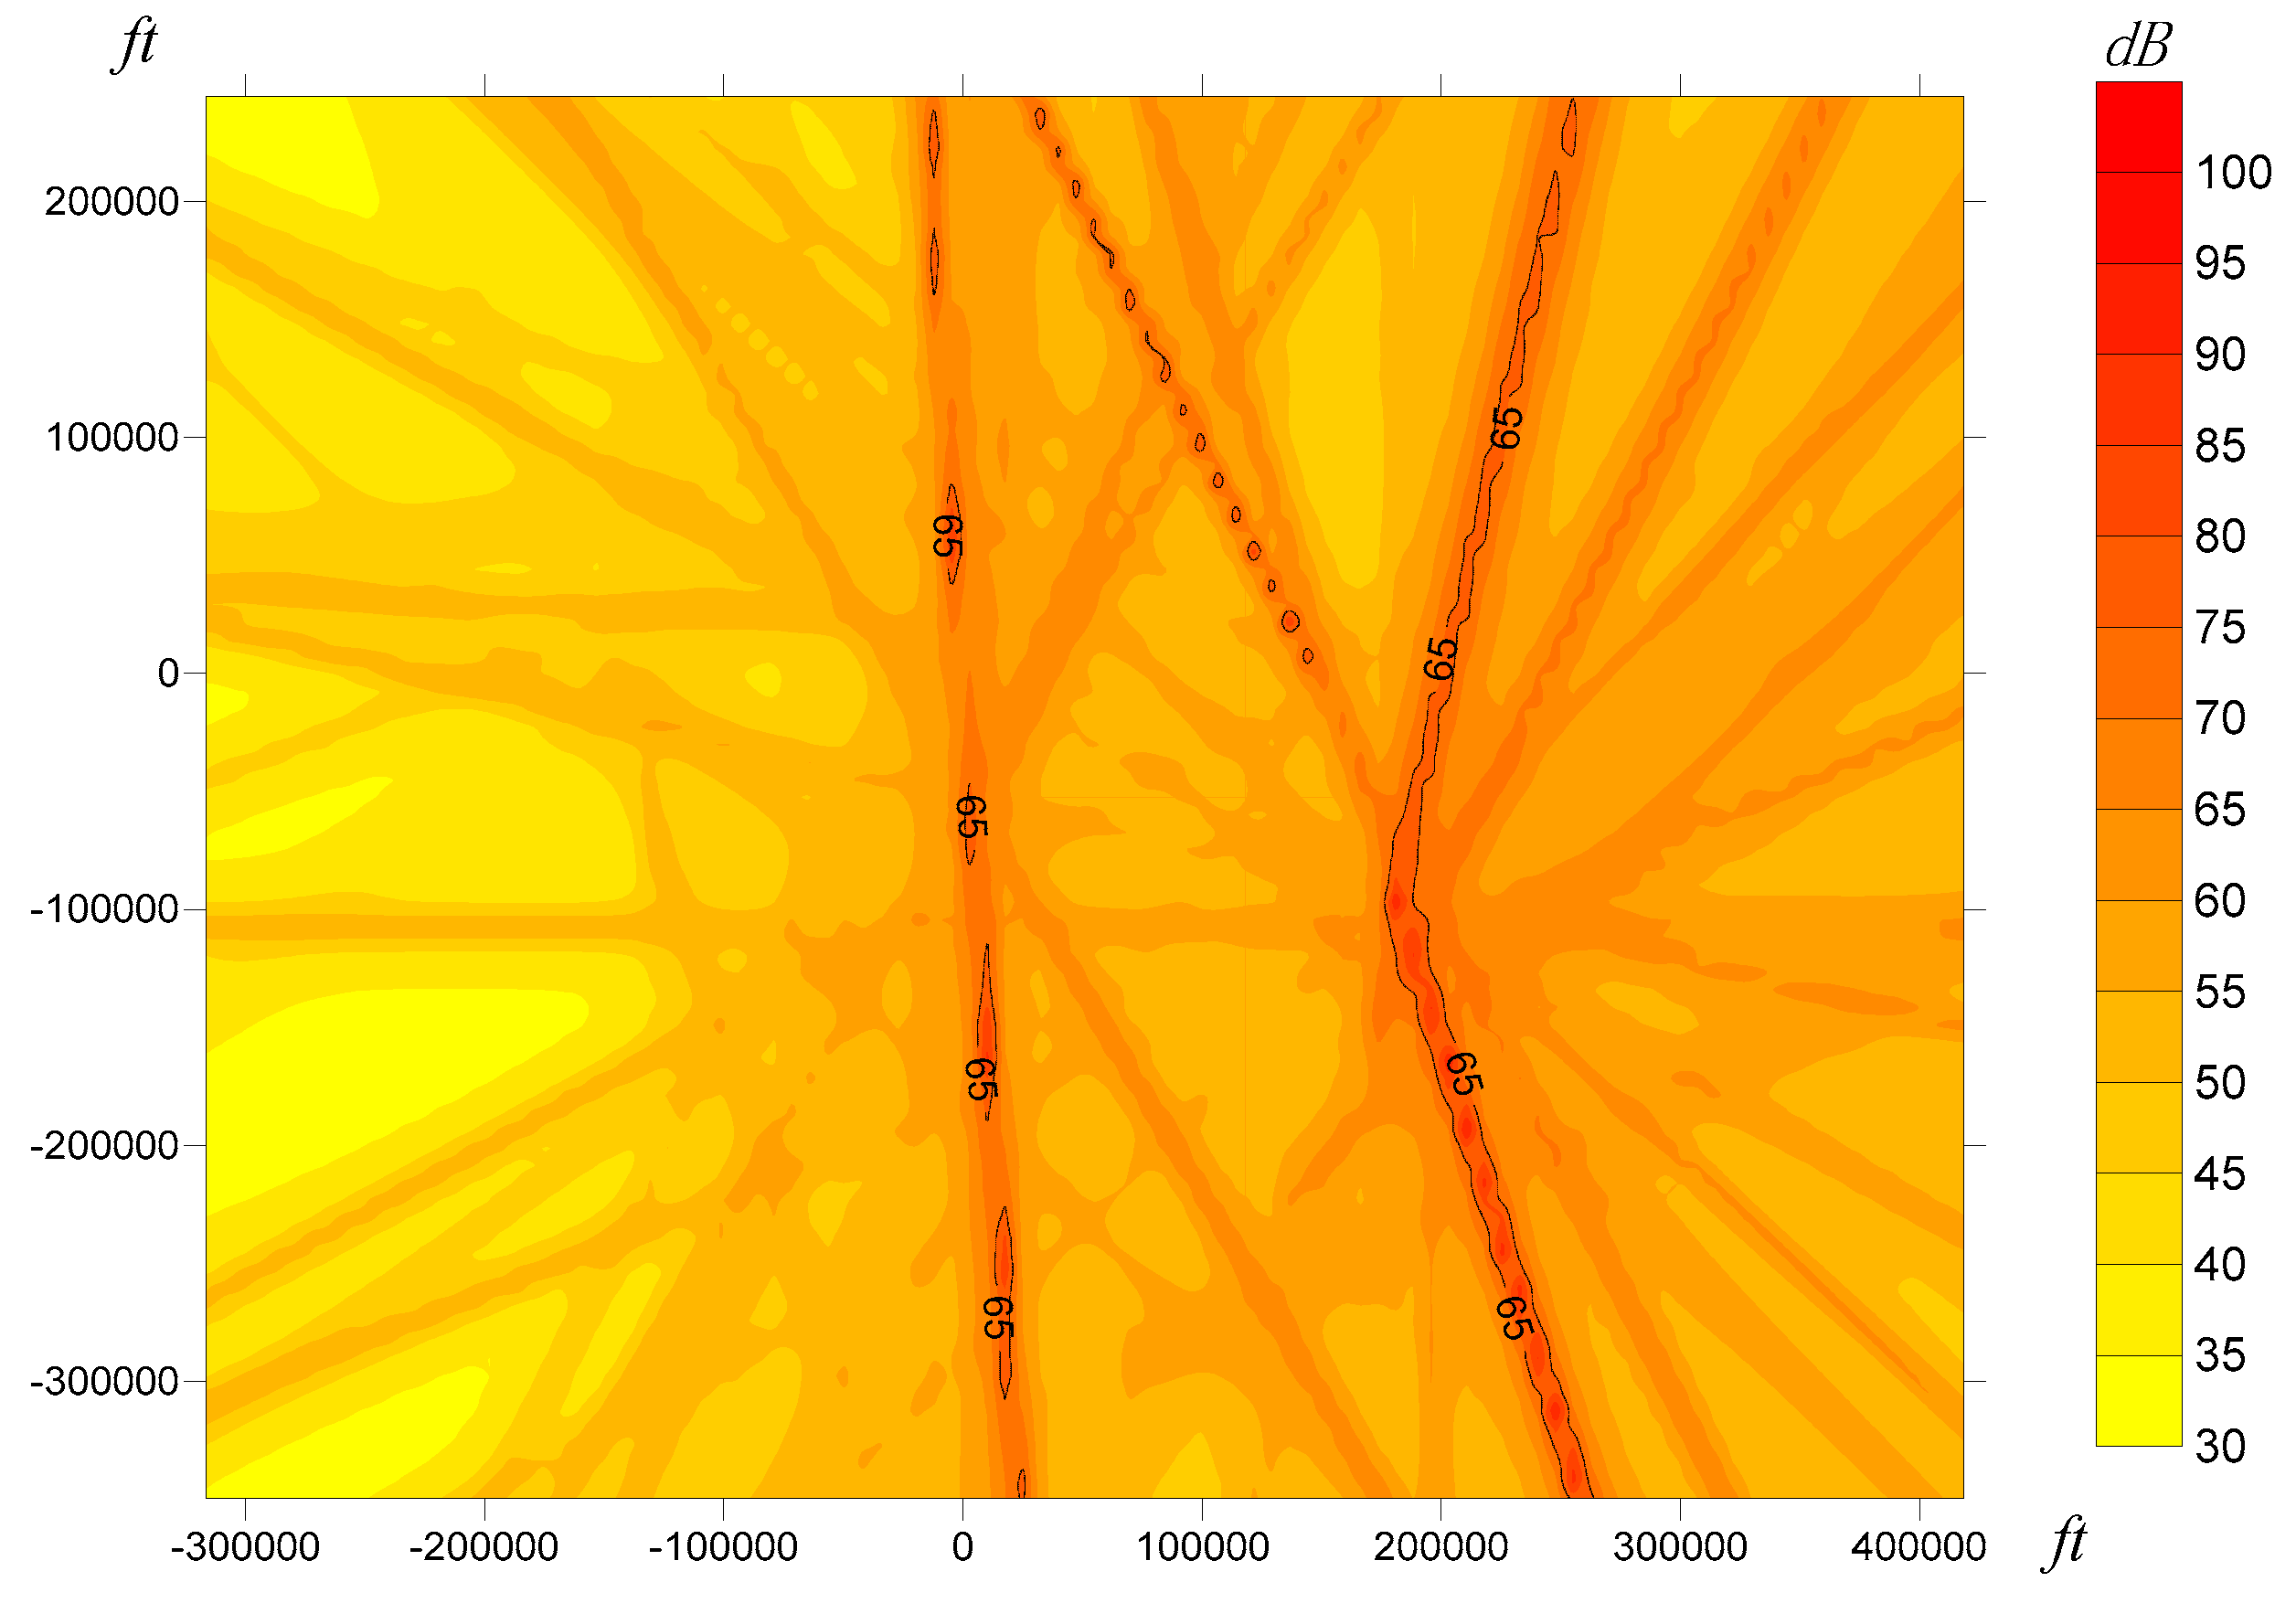
Figure 11 and Figure 12 are noise contour maps of the route network before and after optimization respectively, and the noise coverage area above 65 decibels is obviously reduced. Further analysis shows that the area affected by noise is transferred from the north-central part of Shanghai to the southeast. The noise level at the southeast side of ZSPD is significantly increased, but this area is an uninhabited area along the east coast. Although the downtown area around ZSSS is still affected by noise level above 65 dB, the affected area is obviously reduced.
The number of exposure population affected by noise level above 65 dB before and after optimization are decreased from 4.181 million to 3.283 million, and the decrement is 21.5%, and the exposure population affected by noise below 55 dB is increased by 68.66% (the noise level below 55 dB is considered as a comfortable living environment), as shown in Table 4.
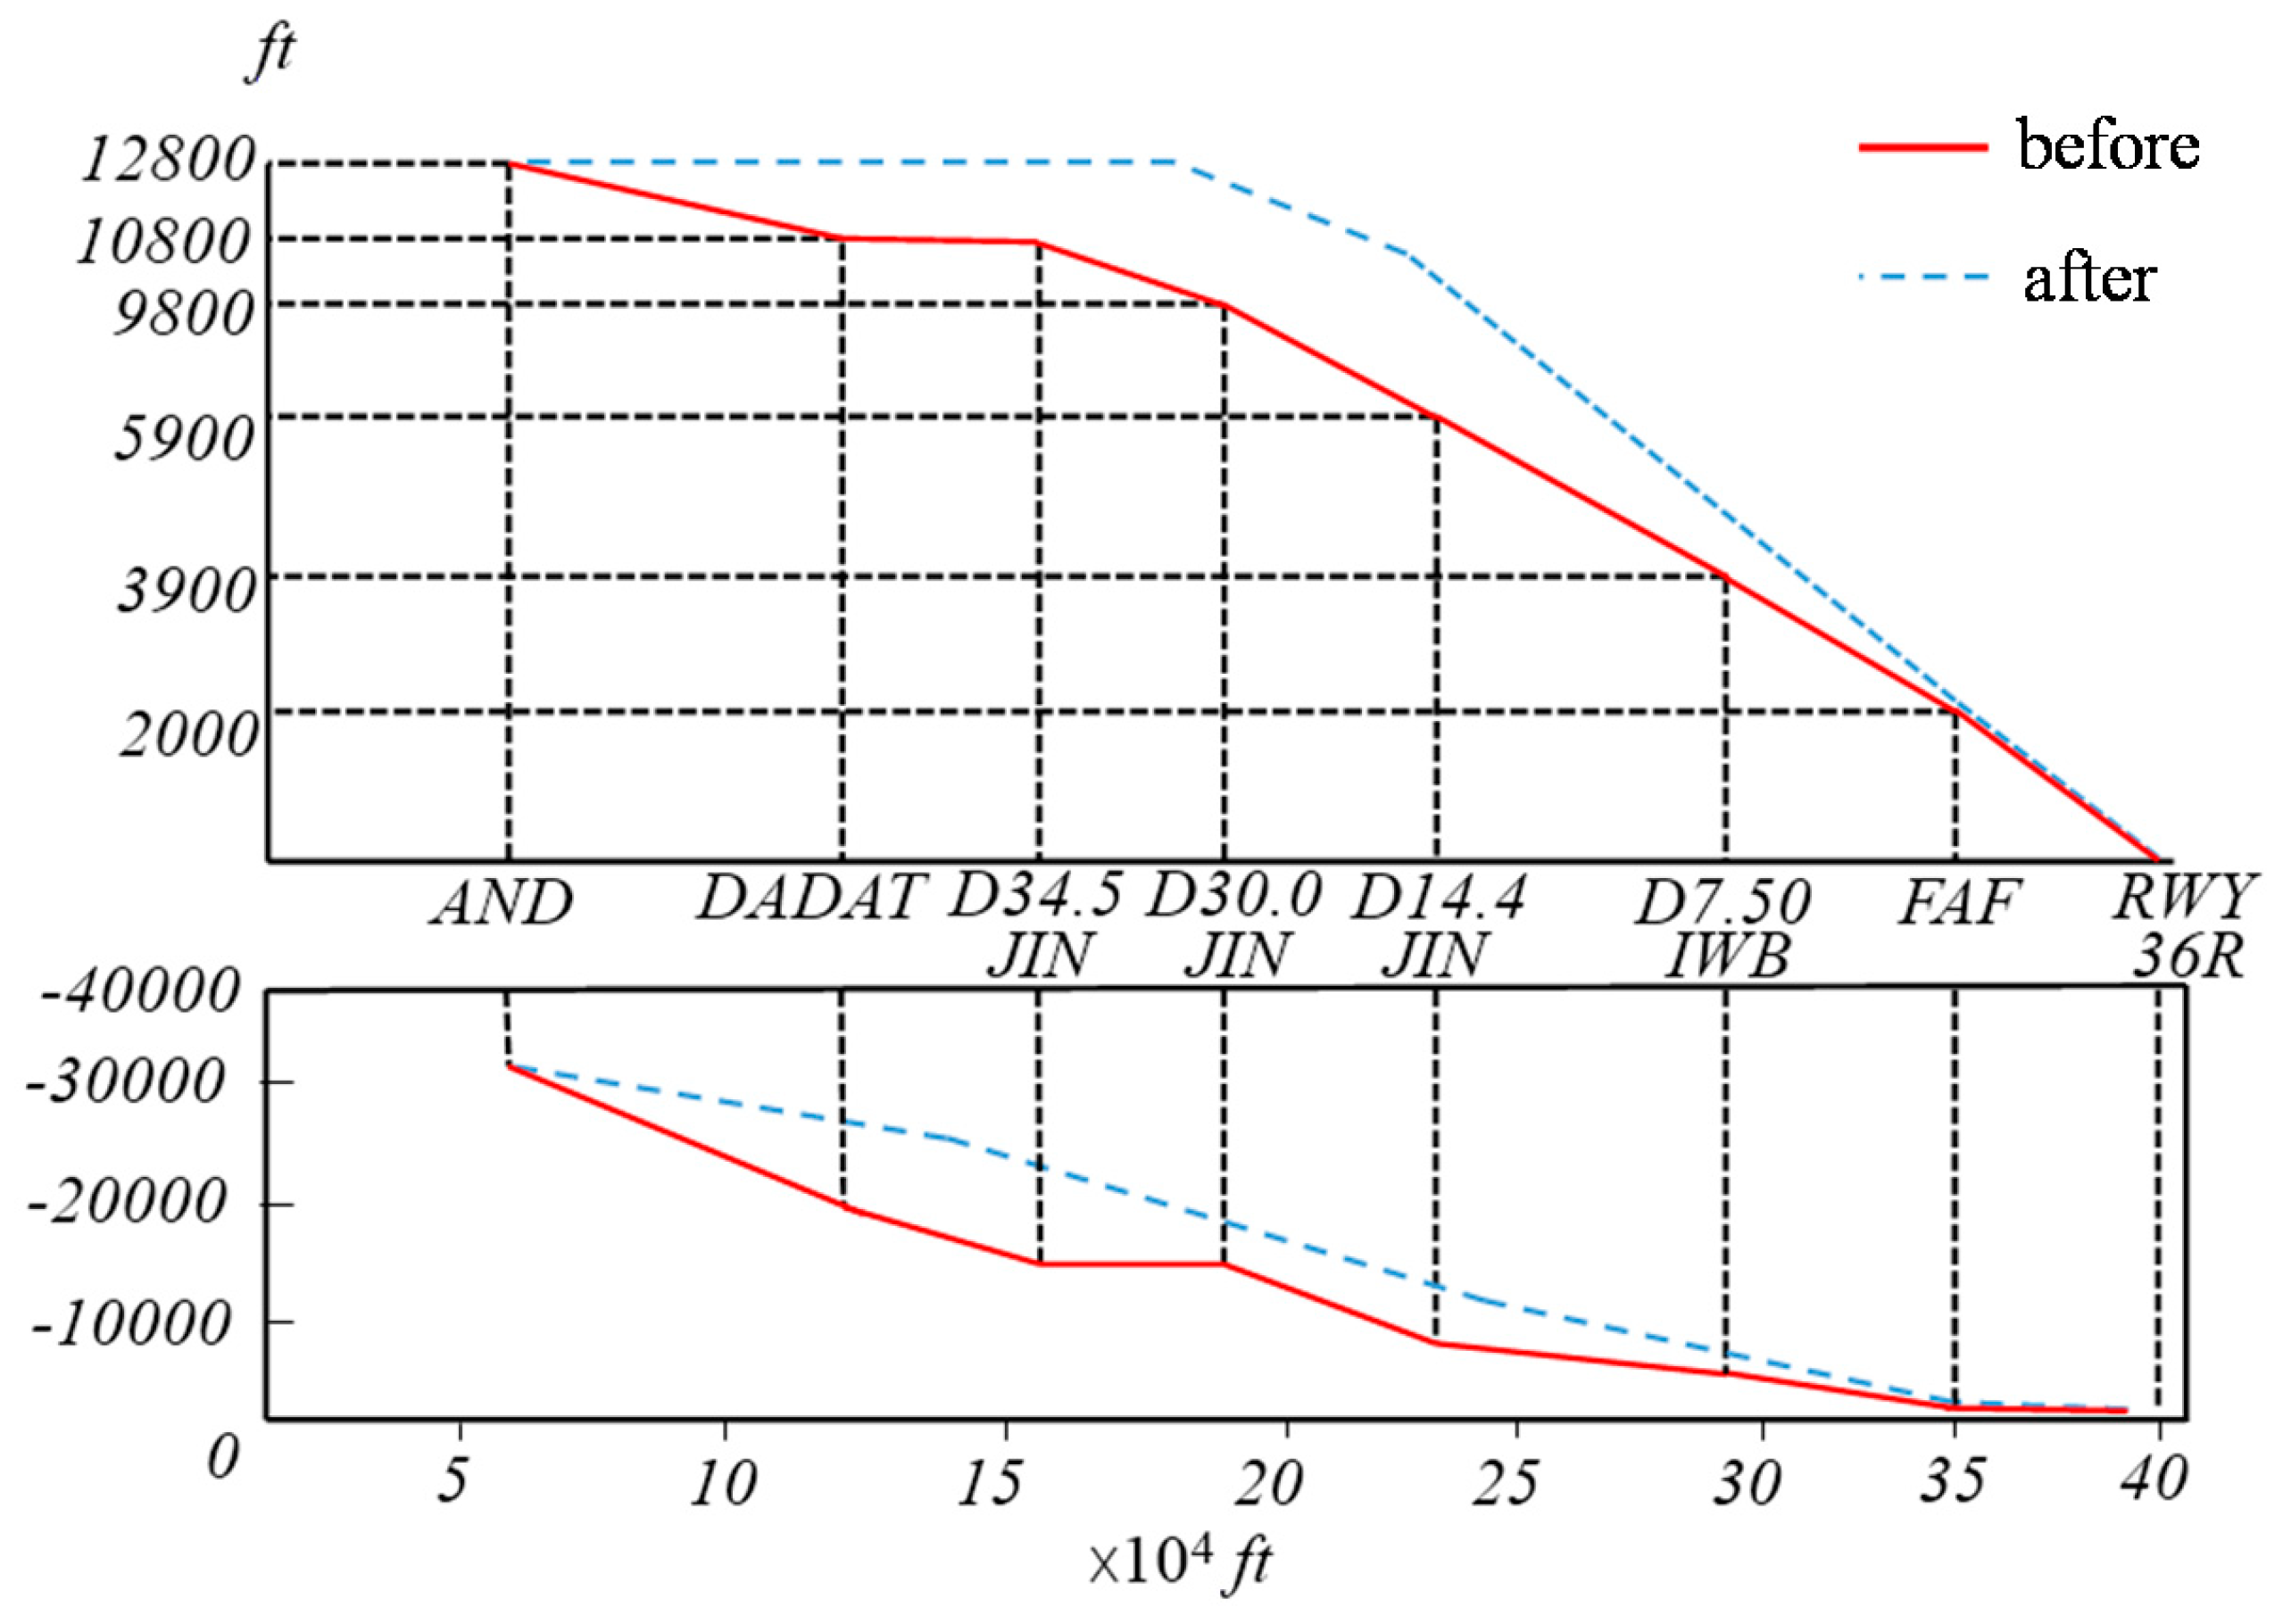
The route optimization results are illustrated by taking ZSSS-AND-1A as an example. By comparing the routes before and after the optimization, the changes of route height and node can be intuitively seen, as shown in Figure 13. In the horizontal profile, compared with current route, the optimized route was offset, and the two routes were completely different. In the vertical profile, the optimized route maintains more high altitude before the final approach fix (FAF) and descends at a larger angle. The optimized route after FAF coincides with the path before optimization.
The changes of air emissions, the exposure population affected by noise level greater than 65 dB, fuel consumption and route length ZSSS-AND-1A are shown in Table 5.
As seen in the Table 5, multi-objective optimization can not only reduce air emission and noise level, but also shorten the route length and reduce fuel consumption.
5. Conclusions
In order to reduce the environmental impact of pollution and noise, this paper researched the optimization method of terminal area route network by searching the optimal aircraft 3D trajectory. The main research contributions are as follows:
(1) This paper modeled the environment evaluation model by considering the aircraft performance model, and took the emissions as air pollution evaluation indicator and exposure population as noise evaluation indicator.
(2) The priority evaluation index system of the terminal area route network planning is established to determine the airspace resources using priority of the route. The evaluation index is chosen by analyzing the physical and operational characteristics of the terminal area and the AHP method is used to calculate the indicator weights.
(3) This paper established a multi-objective terminal area route network model to reduce the environmental impact by using the construction method of route segmentation construction and considering constrains about the aircraft performance, safety and operational rule.
(4) The numerical case study took the Shanghai terminal area as example, the optimal results is calculated by applying the NSGA-II algorithm. The results showed that the optimization method can reduce environmental impact and improve the operational efficiency by comparing with the current route network.
This paper studies the problem of route network planning in the terminal area. The method proposed in this paper can help flight procedure designer to plan and optimize the route network structure of terminal area. The uncertainty in the route planning is not considering in this paper such as meteorological conditions, navigation errors, wind and etc. which will be carried out in the future work.
Author Contributions
Conceptualization, Y.T.; methodology, Y.T.; software, B.Y.; validation, R.Y.; formal analysis, L.W.; investigation, B.Y.; data curation, Ru.Y.; writing—original draft preparation, Y.T. and R.Y.; writing—review and editing, L.W. and D.X.; visualization, B.Y.; supervision, L.W.; funding acquisition, Y.T. An earlier version of this paper was presented at the International Conference on 2017 IEEE/SICE International Symposium on System Integration (SII).
Funding
This research was funded by the National Natural Science Foundation of China, grant number 61671237, and China Postdoctoral Science Foundation, grant number 2018M632308.
Conflicts of Interest
The authors declare no conflict of interest.
Data Availability
The data used to support the findings of this study are available from the corresponding author upon request.
References
- Carlucci, F.; Cirà, A.; Coccorese, P. Measuring and explaining airport efficiency and sustainability: Evidence from italy. Sustainability 2018, 10, 400. [Google Scholar] [CrossRef]
- Laís, F.; Mariana, T.G.; Etienne, D. Health effects of pollution on the residential population near a Brazilian airport: A perspective based on literature review. J. Transp. Health 2019, 14, 1–11. [Google Scholar]
- Grampella, M.; Martini, G.; Scotti, D. The factors affecting pollution and noise environmental costs of the current aircraft fleet: An econometric analysis. Transp. Res. Part A Policy Pract. 2016, 92, 310–325. [Google Scholar] [CrossRef]
- Stell, L. Prediction of Top of Descent Location for Idle-Thrust Descents; NATS 9th USA/Europe Air Traffic Management R&D Seminar: Berlin, Germany, 2011; pp. 1–10. [Google Scholar]
- Mitchell, D.; Ekstrand, H.; Prats, X. An environmental assessment of air traffic speed constraints in the departure phase of flight: A case study at Gothenburg Landvetter Airport, Sweden. Transp. Res. Part D Transp. Environ. 2012, 17, 610–618. [Google Scholar] [CrossRef]
- Wang, C.; Wang, F. Multi-objective Intelligent Optimization of Noise Abatement Departure Trajectory. J. Southwest Jiaotong Univ. 2013, 48, 147–153. [Google Scholar]
- Muller, D.; Uday, P.; Maris, K.B. Evaluation of the Potential Environmental Benefits of RNAV/RNP Arrival Procedures. In Proceedings of the 11th AIAA Aviation Technology, Integration and Operations (ATIO) Conference, Virginia Beach, VA, USA, 20–22 November 2011; pp. 1–18. [Google Scholar]
- Hartjes, S.; Visser, H.G.; Hebly, S.J. Optimization of RNAV noise and emission abatement departure procedures. In Proceedings of the 9th AIAA Aviation Technology, Integration and Operations Conference (ATIO) and Aircraft Noise and Emissions Reduction Symposium (ANERS), Hilton Head, SC, USA, 21–23 September 2009; p. 6953. [Google Scholar]
- Braakenburg, M.; Hartjes, S.; Visser, H. Development of a multi-event trajectory optimization tool for noise-optimized approach route design. In Proceedings of the 11th AIAA Aviation Technology, Integration, and Operations (ATIO) Conference, including the AIAA Balloon Systems Conference and 19th AIAA Lighter-Than, Virginia Beach, VA, USA, 20–22 September 2011; p. 6929. [Google Scholar]
- Dougui, N.E.; Delahaye, D.; Puechmorel, S. Light propagation algorithm for aircraft trajectory planning. In Proceedings of the American Control Conference (ACC), San Francisco, CA, USA, 29 June–1 July 2011; pp. 2143–2147. [Google Scholar]
- Dougui, N.E.; Delahaye, D.; Puechmorel, S. A light-propagation mode for aircraft trajectory planning. J. Glob. Optim. 2013, 56, 873. [Google Scholar] [CrossRef]
- Richter, M.; Bittner, M.; Rieck, R.M. A Realistic Flight Path Parameterization for Calculation of Noise Minimal Trajectories using Bi-level Optimal Control. In Proceedings of the AIAA Guidance, Navigation and Control Conference, National Harbor, MD, USA, 13–17 January 2014; p. 1294. [Google Scholar]
- Li, J.; Chen, N.Y.; Sridhar, B. Simple Tool for Aircraft Noise-Reduction Route Design. In Proceedings of the 15th AIAA Aviation Technology, Integration and Operations Conference, Dallas, TX, USA, 22–26 June 2015; p. 2598. [Google Scholar]
- Li, J.; Sridhar, B.; Xue, M. AIRNOISE: A Tool for Preliminary Noise-Abatement Terminal Approach Route Design. In Proceedings of the 16th AIAA Aviation Technology, Integration and Operations Conference, Washington, DC, USA, 13–17 June 2016; p. 3905. [Google Scholar]
- Taghizadehj, S.A.; Shafabakhsh, G.H.; Aghayan, I. Evaluation of aircraft emission at Imam Khomeini International Airportand Mehrabad International Airport. Int. J. Environ. Sci. Technol. 2019, 34, 49–56. [Google Scholar]
- Xue, M.; Atkins, E.M. Terminal area trajectory optimization using simulated annealing. In Proceedings of the 44th AIAA Aerospace Sciences Meeting and Exhibit, Reno, NV, USA, 9–12 January 2006; p. 1473. [Google Scholar]
- Wang, C.; He, C.N.; Liu, H.Z. 3D Optimization Method for Terminal Arrival and Departure Route Network. Sci. Technol. Eng. 2014, 14, 81–85. [Google Scholar]
- Wang, C.; He, C.N. Three-Dimensional Planning of Arrival and Departure Route Network Based on Improved Ant-Colony Algorithm. Trans. Nanjing Univ. Aeronaut Astronaut. 2015, 32, 654–664. [Google Scholar]
- He, C.N.; Wang, C.; Jiang, Y.Q. 3D Optimization for Arrival and Departure Route Network Based on Improved A Algorithm. Aeronaut Comput. Tech. 2014, 44, 45–47. [Google Scholar]
- Liu, H.Z.; Wang, C. Optimization for Arrival and Departure Route Network under Hazardous Weather. Sci. Technol. Eng. 2014, 14, 83–89. [Google Scholar]
- Zhou, J. Optimization of arrival and departure routes in Terminal Area. In Proceedings of the 6th International Conference on Research in Air Transportation, Istanbul, Turkey, 26–30 May 2014. [Google Scholar]
- Sidiropoulos, S.; Majumdar, A.; Han, K. A framework for the classification and prioritization of arrival and departure routes in Multi-Airport Systems Terminal Manoeuvring Areas. In Proceedings of the 15th AIAA Aviation Technology, Integration and Operations Conference, Dallas, TX, USA, 22–26 June 2015; p. 3031. [Google Scholar]
- Kim, B.; Clarke, J.P. Modeing and optimization of terminal area utilization by assigning arrival and departure fixes. In Proceedings of the Guidance, Navigation, and Control (GNC) Conference, Boston, MA, USA, 19–22 August 2013; p. 5256. [Google Scholar]
- Man, L.; Daniel, D.; Pierre, M. Conflict-free Arrival and Departure Trajectory Planning for Parallel Runway with Advanced Point-Merge System. Transp. Res. Part C Emerg. Echnologies 2018, 95, 207–227. [Google Scholar]
- Sidiropoulos, S.; Majumdar, A.; Han, K. A framework for the optimization of terminal airspace operations in Multi-Airport Systems. Transp. Res. Part B Methodol. 2018, 110, 160–187. [Google Scholar] [CrossRef]
- ICAO. Doc8168, Procedures for Air Navigation Services; ICAO: Montreal, QC, Canada, 2006. [Google Scholar]
- Ministry of Ecology and Environment the People’s Republic of China. National Standard of People’s Republic of China, Measurement of Aircraft Noise Around Airport, GB9661-88; Ministry of Ecology and Environment the People’s Republic of China: Beijing, China, 1988; pp. 4–5.
- ICAO. Doc9911, Recommended Method for Computing Noise Contours Around Airports; ICAO: Montreal, QC, Canada, 2011. [Google Scholar]
- ICAO. Doc4444, Air Traffic Management; ICAO: Montreal, QC, Canada, 2007. [Google Scholar]
- Eurocontol Experimental Center. Mode Accuracy Summary Report for the Base of Aircraft Data (BADA) REVISION 3.11; EEC: Bretigny, France, 2012. [Google Scholar]
- Kalyanmoy, D.; Amrit, P.; Sameer, A. A Fast and Elitist Multi objective Genetic Algorithm: NSGA-II. IEEE Trans. Evol. Comput. 2002, 6, 182–197. [Google Scholar]
Figure 1.
Cartesian coordinate system.

Figure 2.
The protection zone of terminal area routes.

Figure 3.
The ladder class times of routes network environment influences.

Figure 4.
Selection of the flight candidate points.

Figure 5.
Horizontal route candidate extension method.

Figure 6.
Vertical route candidate extension method.

Figure 7.
Total number of passengers served by Shanghai Pudong international airport (ZSPD) and Shanghai Hongqiao international airport (ZSSS) over the years.
Figure 7.
Total number of passengers served by Shanghai Pudong international airport (ZSPD) and Shanghai Hongqiao international airport (ZSSS) over the years.

Figure 8.
The trend of normalized emission during population evolution.

Figure 9.
The emissions of terminal area route.

Figure 10.
Trend of population amount affected by noise above 65 dB in the evolution.

Figure 11.
Noise contour map of route network before optimization.

Figure 12.
Noise contour map of route network after optimization.

Figure 13.
The approach profile before and after optimization.


Table 1.
Names and codes of terminal routes.
| Name | Code | Name | Code |
|---|---|---|---|
| ZSPD-AND-11A | ZSPD-AND-22D | ||
| ZSPD-BK-11A | ZSPD-BOLEX-22D | ||
| ZSPD-DUMET-21A | ZSPD-NXD-22D | ||
| ZSPD-MATNU-21A | ZSPD-ODULO-26D | ||
| ZSPD-SASAN-11A | ZSPD-PIKAS-22D | ||
| ZSSS-AND-1A | ZSSS-AND-2D | ||
| ZSSS-DUMET-PUD-1A | ZSSS-LAMEN-2D | ||
| ZSSS-SASAN-1A | ZSSS-PONAB-3D |
Table 2.
The priority evaluation index judgment matrix of route planning.
| A | Weight | ||||||||
|---|---|---|---|---|---|---|---|---|---|
| B1 | 1 | 1/7 | 1/4 | 1/2 | 1/4 | 1/3 | 1/6 | 1/5 | 0.0274 |
| B2 | 7 | 1 | 5 | 6 | 4 | 5 | 3 | 2 | 0.3198 |
| B3 | 2 | 1/6 | 1 | 3 | 1/3 | 1/4 | 1/4 | 1/4 | 0.0518 |
| B4 | 4 | 1/4 | 1/3 | 1 | 1/2 | 1/2 | 1/5 | 1/6 | 0.0522 |
| B5 | 3 | 1/5 | 3 | 3 | 1 | 2 | 1/2 | 1/3 | 0.0986 |
| B6 | 6 | 1/3 | 4 | 2 | 1/2 | 1 | 1/2 | 1/2 | 0.1076 |
| B7 | 1 | 1/5 | 4 | 5 | 2 | 3 | 1 | 2 | 0.1674 |
| B8 | 5 | 1/2 | 4 | 6 | 3 | 2 | 1/2 | 1 | 0.1751 |
1, , .
Table 3.
Weight coefficient of terminal routes.
| Number | Priority | Weight Coefficient | Number | Priority | Weight Coefficient |
|---|---|---|---|---|---|
| 1 | 0.1581 | 9 | 0.0624 | ||
| 2 | 0.1567 | 10 | 0.0522 | ||
| 3 | 0.0843 | 11 | 0.0503 | ||
| 4 | 0.0802 | 12 | 0.0478 | ||
| 5 | 0.0764 | 13 | 0.0451 | ||
| 6 | 0.0742 | 14 | 0.0417 | ||
| 7 | 0.0736 | 15 | 0.0273 | ||
| 8 | 0.0660 | 16 | 0.0261 |
Table 4.
Population affected by each decibel range.
| Noise Value (dB) | Before Optimization (104) | After Optimization (104) |
|---|---|---|
| 0~45 | 7.6 | 10.7 |
| 45~55 | 477.2 | 807.1 |
| 55~65 | 1526.2 | 1273.1 |
| 65~75 | 349.2 | 283.2 |
| 75~85 | 42.6 | 43.6 |
| > 85 | 26.3 | 11.5 |
Table 5.
Comparison of results before and after ZSSS-AND-1A optimization.
| Pollutant Emission (kg) | Affected Population (104) | Fuel Consumption (kg) | Length of Route (km) | ||||
|---|---|---|---|---|---|---|---|
| NOx | HC | CO | TSP | (>65 dB) | |||
| Before | 1388.2 | 24.2 | 365 | 7 | 37.6 | 96,380.6 | 285.4 |
| After | 951.4 | 16.8 | 256.9 | 4.9 | 22.2 | 38,040.7 | 224.9 |
© 2019 by the authors. Licensee MDPI, Basel, Switzerland. This article is an open access article distributed under the terms and conditions of the Creative Commons Attribution (CC BY) license (http://creativecommons.org/licenses/by/4.0/).
Share and Cite
MDPI and ACS Style
Tian, Y.; Wan, L.; Ye, B.; Yin, R.; Xing, D. Optimization Method for Reducing the Air Pollutant Emission and Aviation Noise of Arrival in Terminal Area. Sustainability 2019, 11, 4715. https://0-doi-org.brum.beds.ac.uk/10.3390/su11174715
AMA Style
Tian Y, Wan L, Ye B, Yin R, Xing D. Optimization Method for Reducing the Air Pollutant Emission and Aviation Noise of Arrival in Terminal Area. Sustainability. 2019; 11(17):4715. https://0-doi-org.brum.beds.ac.uk/10.3390/su11174715
Chicago/Turabian StyleTian, Yong, Lili Wan, Bojia Ye, Runze Yin, and Dawei Xing. 2019. "Optimization Method for Reducing the Air Pollutant Emission and Aviation Noise of Arrival in Terminal Area" Sustainability 11, no. 17: 4715. https://0-doi-org.brum.beds.ac.uk/10.3390/su11174715
Note that from the first issue of 2016, this journal uses article numbers instead of page numbers. See further details here.