Article

A Study on the Coordinative Green Development of Tourist Experience and Commercialization of Tourism at Cultural Heritage Sites

1
School of Tourism Sciences, Beijing International Studies University, Beijing 100024, China
2
Research Center of Beijing Tourism Development, Beijing 100024, China
3
W. A. Franke College of Business, Norther Arizona University, Flagstaff, AZ 86011, USA
*
Author to whom correspondence should be addressed.
Sustainability 2019, 11(17), 4732; https://0-doi-org.brum.beds.ac.uk/10.3390/su11174732
Submission received: 17 July 2019 / Revised: 16 August 2019 / Accepted: 27 August 2019 / Published: 30 August 2019
(This article belongs to the Section Tourism, Culture, and Heritage)

Abstract

:
Tourism at China’s cultural heritage sites has developed rapidly in recent years. These sites have encountered many challenging problems such as poor tourist experience, over-commercialization, and loss of cultural authenticity. This study took the coordinative green development of tourist experience and commercialization of tourism (CGDTECT) at cultural heritage sites as the research objective, using two UNESCO World Heritage Sites—the Ancient City of Pingyao and West Lake Cultural Landscape of Hangzhou—and the Confucius Temple in the historic district of Nanjing as case studies. As such, we attempted to construct an indicator system for CGDTECT at cultural heritage sites. We adopted a fuzzy comprehensive evaluation method and importance-performance analysis (IPA) method to analyze the importance and performance of CGDTECT from a tourist’s perspective. Our findings show that tourists thought the coordinative green development and experience at the three cultural heritage sites were more important; they were basically satisfied with CGDTECT at the three case studies, so a continuous promotion strategy could be taken. The findings of this study can provide scientific theoretical guidance and practical reference for CGDTECT at cultural heritage sites, and contribute to the scientific protection of cultural heritage sites and the sustainable development of tourism.

1. Introduction

Cultural heritage has high cultural, economic, artistic, and educational value, to name a few. It possesses the characteristics of authenticity, vividness, inheritance, and nationality [1,2]. Cultural heritage is viewed as the carrier of cultural genes and national memories and is of great significance in promoting diversity and sustainable development of human culture [3]. According to the statistics of the United Nations Educational Science and Cultural Organization (UNESCO), the World Heritage List consists of 1121 World Heritage Sites, including 869 cultural sites, 213 natural sites, and 39 mixed sites as of August 2019. The cultural landscape inheritance was considered in the World Heritage List in 1992 [4]. Among the various cultural heritage sites in China, 37 are World Cultural Heritage sites, including five Cultural Landscape Heritage sites and four Mixed Heritage sites. Rightfully, scientific protection and rational utilization of cultural heritage have become an issue of great interest and concern. In addition, tourism development is increasingly used in the active elicitation of memories, the dissemination of values, and the inheritance of cultural heritage.
The development of tourism promotes rapid socioeconomic development of heritage sites and the protection of heritage resources [5,6]. Cultural tourism has recently been reaffirmed by the United Nations World Tourism Organization as an important part of international tourism consumption, accounting for more than 39% of the total number of visitors [7]. Cultural heritage is an important carrier for the development of cultural tourism. Many cultural heritage sites have become popular tourist destinations at home and abroad, such as the Palace and Park of Versailles, Chartres Cathedral, Darjeeling Himalayan Railway, Historic Centre of Rome, West Lake, and others. However, the increasing consumption demand of heritage tourism and the economic interest of heritage sites have exerted immense pressure on the prominent impairment of universal value [8], over-commercialization [9], serious waste [10], deterioration of ecological environment and environmental capacity overload [11], damage to the quality of heritage landscape resources [12], and the like. As a result, many heritage sites have received warnings from the World Heritage Committee of UNESCO of the potential loss of their UNESCO heritage sites status [13]. How to achieve the effective protection and rational utilization of cultural heritage through tourism has become an important research topic for the sustainable development of cultural heritage sites [14,15].
The core of developing cultural heritage tourism is the tourist experience [16], which is based on the authenticity of cultural products. That is, cultural products should conform to the cultural, ecological, economic, and social environment of heritage sites, and reflect the authenticity of cultural heritage, the inheritance of cultural venation, the uniqueness of regional style, and the harmony of the overall environment. To meet the increasing demand for sightseeing and interactive experience, tourism developers have introduced the theory of experience economy into the tourism industry, pointing out the importance of consumer experience and perception to economic activities [17], emphasizing that commercial development is an important way to enhance tourist experience [18]. However, under-commercial development will affect the sustainable economic development of cultural heritage sites [19] while over-commercial development will lead to the loss of the authenticity of local cultural heritage [20], thus having negative effects on the protection of cultural heritage and the sustainable development of the local social economy. Wong and Mckercher [21] argued that over-commercialization and over-emphasizing experience would cause discomfort to tourists in a day tour, and the government should formulate relevant policy standards and appropriate subsidies to help find a balance between the two. Therefore, how to balance the relationship between tourist experience and commercialization of tourism in cultural heritage sites has become a challenging problem [22].
Therefore, taking the Ancient City of Pingyao, a World Cultural Heritage site, West Lake of Hangzhou, a World Cultural Landscape site, and Nanjing Confucius Temple, a historical and cultural street block in Nanjing, as case studies, this paper attempts to construct an indicator system for coordinative green development of tourist experience and commercialization of tourism (CGDTECT) at cultural heritage sites. It uses the methods of fuzzy comprehensive evaluation and importance-performance analysis to assess the importance and satisfaction of tourists at three case studies and identify the influencing factors of tourist satisfaction. The goal was the in-depth study of CGDTECT at cultural heritage sites. On the one hand, this research will enrich the theory of tourism geography and cultural heritage protection and utilization from the perspective of green development, construct the theory of CGDTECT at cultural heritage sites, and augment the lack of research on green development of tourism. On the other hand, studying CGDTECT at cultural heritage sites will help the government agencies and institutions evaluate the level of CGDTECT from the tourist perspective, examine the factors affecting tourist satisfaction, and put forward the path and plan of coordinative green development. It provides policymakers with ideas for formulating effective policies to scientifically protect cultural heritage and at the same time enhance the quality of tourist experience.

2. Literature Review
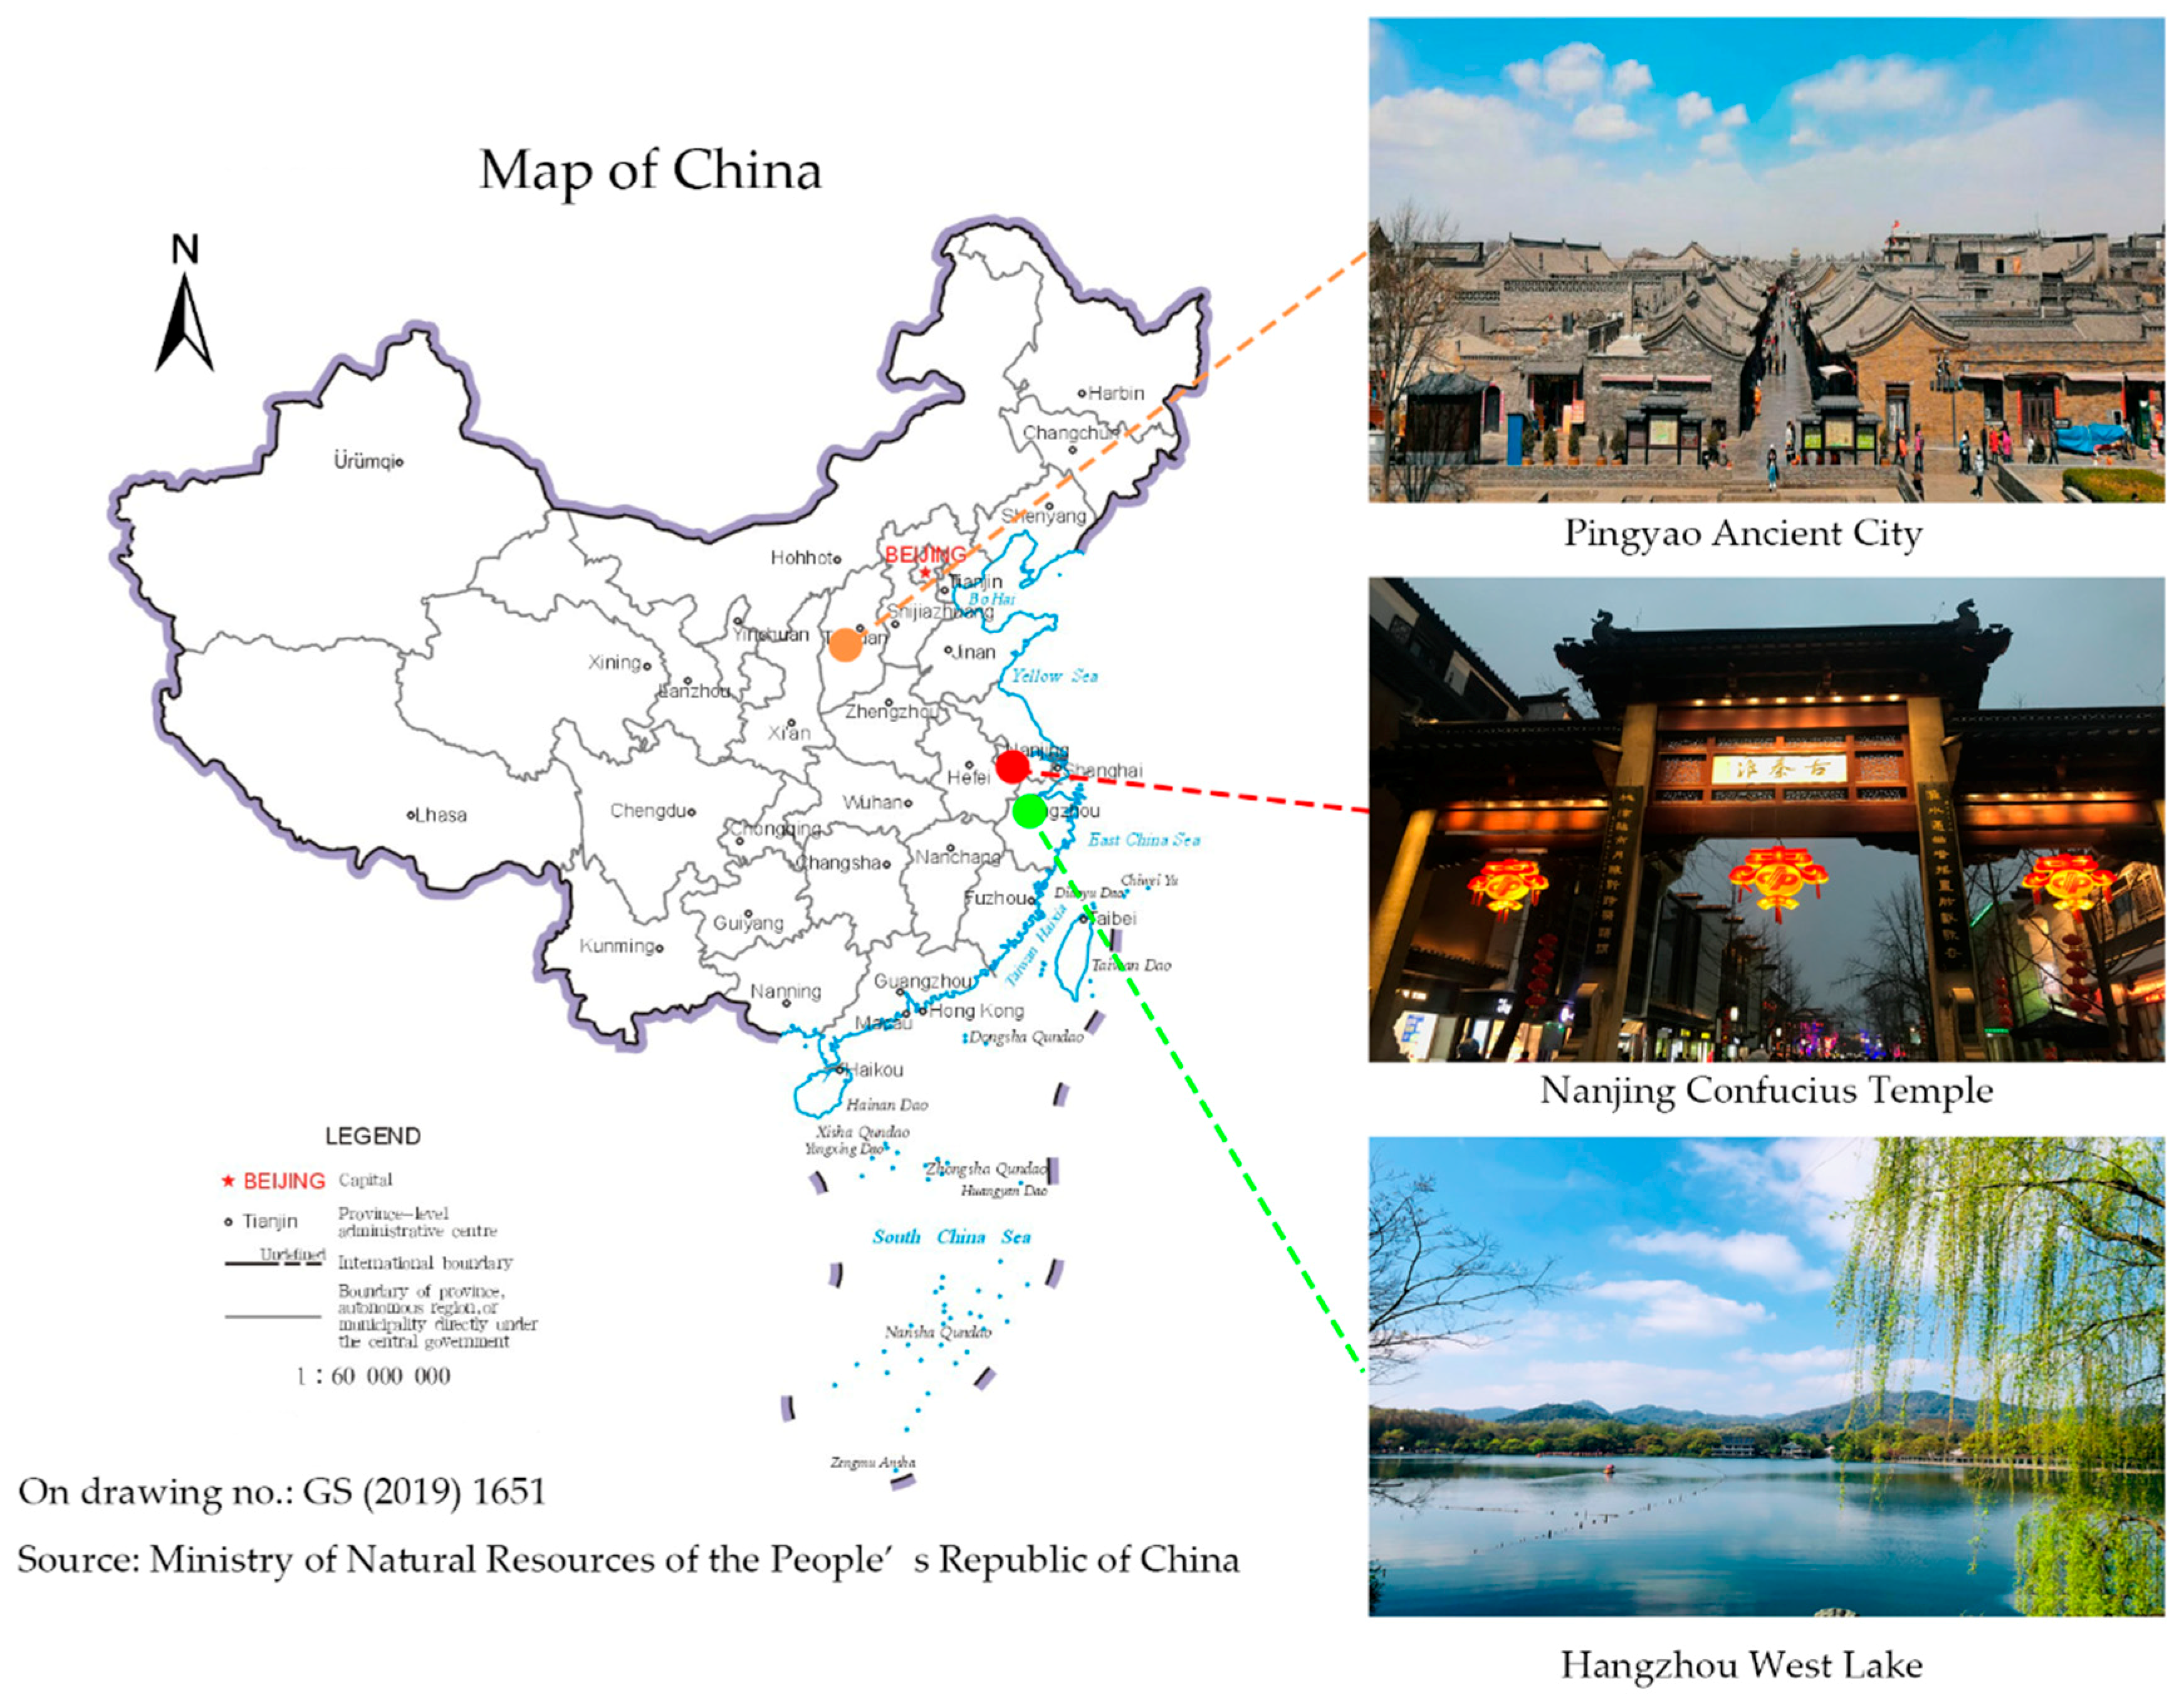
Currently, limited studies have touched on issues relating to the experience and commercialization of tourism at cultural heritage sites. Halewood and Hannam adopted qualitative methods to discuss how the main participants construct the concepts of authenticity and commercialization by organizing specific types of pirate heritage tourism [20]. Stroma explored the authenticity and commercialization of cultural heritage tourism through long-term research of more than 10 years (1989–2000) [22]. He used qualitative methods to study the commercial operation of ancient town scenic spots from the perspective of the tourist experience [23]. Liu adopted qualitative methods to discuss the dilemma of commercialization and authenticity of tourism development at cultural heritage sites, noting that scientific and rational tourism development not only helped the development and extension of authenticity but also enhanced the protection of cultural heritage [24]. Zhong adopted factor analysis and cluster analysis to explore the attitude of cultural experiencers, shopping enthusiasts, sightseeing and leisure travelers, and multiple-activities tourists towards commercialization of tourism [25]. Zatori et al. showed that tourist experience includes four dimensions—emotional, mental, flow-like, and social experience-involvement—and explored the one-way causal effect among customized tourism services, environment experience, tourism experience, authenticity, and unforgettable memory [26]. In general, previous studies on cultural heritage tourism sites have mainly focused on the positive and negative impacts of commercialization on the tourist experience [19], the relationship between commercialization and authenticity [22], the factors affecting tourist experience [27], commercial control [28], but not the coordinative development of tourist experience and commercialization of tourism. Qualitative method is the main method used to study tourist experience and commercialization of tourism at the cultural heritage sites. This paper synthetically combined qualitative and quantitative methods to explore the path of CGDTECT at the cultural heritage sites, which is the first uniqueness of this paper.
Green development, which emphasizes the coordinated development of economic growth, ecological environment protection, and social progress [29,30], is the popular proposition of world development of the current era [31]. Essentially, green development has become an important concept and an effective way of sustainable development of tourism destinations. It is believed that promoting green development of tourism is an important topic by many current tourism researchers [32,33]. Many scholars have begun to pay attention to ecological compensation for the green development of tourism [34] and the construction of the green development model of tourism [35]. Tang et al. [36] systematically reviewed the green development of the tourism industry in terms of its research process, methods, and contents. Additionally, some authors have integrated the concept of green development into the sustainable development of heritage tourist sites. Their main results provide evidence that green development of tourism can effectively manage, protect, and utilize the relevant natural resources in the wilderness of protected areas [37] and contribute to the protection and restoration of local cultural and environmental heritage as well as the development of tourism activities and economic recovery [38]. These scholars introduced the concept of green development into tourism research, which not only enriched the connotation of sustainable development of tourism but also provided an effective development mode for sustainable development of tourism. However, there remains a lack of applications of green development concept to the coordinative development of tourist experience and commercialization of tourism at cultural heritage sites. This paper was an attempt to fill this gap, introducing the green development concept to study CGDTECT at the cultural heritage sites, which is another uniqueness of this paper.
It is worth mentioning that the importance-performance analysis (IPA) method has been widely used in tourism research, such as tourism destination [39], cultural heritage sites [40], parks and protected areas [41], leisure resorts [42], and various forms of tourism [43]. However, the IPA method has gradually shown congenital defects [44,45,46]. Based on the three-factor theory [47], fuzzy set theory [48], combination of partial correlation analysis and natural logarithmic transformation [49], acceptable change framework constraints [50], SWOT analysis (S, strengths; W, weaknesses; O, opportunities; T, threats) [51], technology-organization-environment framework [52], and fuzzy c-means algorithm [53], many scholars have attempted to refine the traditional IPA method. Therefore, this paper modifies the traditional IPA method using a fuzzy comprehensive evaluation method to evaluate and analyze the level and influencing factors of CGDTECT at the cultural heritage sites, which is the third uniqueness of this paper.

3. Case Studies

The Ancient City of Pingyao, a World Cultural Heritage site, West Lake of Hangzhou, a World Cultural Landscape Heritage site, and Confucius Temple of Nanjing, a historical and cultural street block, have been selected as the case studies. Figure 1 shows the geographic location and representative landscape pictures at the three cultural heritage sites. The Ancient City of Pingyao was listed on the World Cultural Heritage List in 1997. Pingyao Ancient City is an outstanding example of ancient Chinese cities in the Ming and Qing dynasties. It is known as one of the four most well-preserved ancient cities in China. West Lake of Hangzhou found its way onto the World Cultural Landscape Heritage List in 2011. As the World Heritage Committee commented, “Hangzhou West Lake Cultural Landscape is an outstanding example of cultural landscape.” It demonstrates the aesthetic ideas of Chinese landscapes and has a far-reaching impact on the landscape design of China or even around the world. It best reflects the core value of Chinese traditional culture aesthetics. Nanjing Confucius Temple is the first institution of higher education in China and one of the four major Confucian Temples in China. It was the cultural hub in ancient China. It is not only the cultural center of Nanjing during the Ming and Qing dynasties but also the first batch of historical and cultural street blocks in Jiangsu Province.
Table 1 lists brand acquisition and tourism development in these three case studies. Unfortunately, a process of rapid tourism development has resulted in pressure and threat of poor tourist experience and over-commercialization at these scenic spots [13,54,55]. This paper, therefore, choose Pingyao Ancient City, Hangzhou West Lake, and Nanjing Confucius Temple as case studies to try to shed some light on potential ways to alleviate these pressure and challenges.

4. Methodology and Data

In this section, the steps for determining appropriate indicators for evaluating CGDTECT at cultural heritage sites, determining the weight of the evaluation indicators, fuzzy comprehensive evaluation method, and the IPA method were described in turn. The data sources of this paper were depicted last.

4.1. Determining the Appropriate Indicators for Evaluating CGDTECT at Cultural Heritage Sites

(1) Determining the appropriate evaluation indicators. First, we reviewed the literature on tourist experience and commercialization of tourism at cultural heritage sites to identify and obtain potential representing indicators. Second, based on the principles of objectivity, scientificity, representativeness, and quantification, we preliminarily determined evaluation indicators according to the tourism development status of the three case studies. Third, 20 experts who engaged in cultural heritage, ecology, geography, tourism sustainable development, and other fields were invited to form an advisory group; we designed questionnaires for the experts based on items that were related to the research questions. Fourth, we carried out two rounds of consultations with the experts and adopted their suggestions to determine the appropriate indicators for CGDTECT.
(2) A questionnaire survey based on the chosen indicators and the tourism development status of the three case studies was designed that contains three sections. The first and second sections, respectively, attempted to capture the importance of tourism and satisfaction of tourists for CGDTECT. The indicators were evaluated by the respondents using the Likert scale and the important choices were “very important”, “important”, “unclear”, “unimportant”, and “very unimportant”. The satisfaction choices were “very satisfied”, “satisfied”, “unclear”, “dissatisfied”, and “very dissatisfied”. The levels of importance and satisfaction were assigned values of 5, 4, 3, 2, and 1, respectively. The third section was the survey of demographic attributes, including gender, age, degree of education, source of origin of tourists, occupation, income, and travel frequency. Finally, the research team carried out a sampling survey in Pingyao Ancient City, Hangzhou West Lake, and Nanjing Confucius Temple. The sampling process is a non-comprehensive survey. According to the principle of randomization, the research team selected samples at the case studies and made estimates and inferences for all the research objects.
(3) Extraction of common factors of the indicators using principal component analysis. The data collected were organized using SPSS19.0 and the common factors of the indicators were extracted by principal component analysis (more details are discussed below in Section 4.2). First, in order for each indicator to accurately represent the data collected in the questionnaire, we eliminated indicators with commonality less than 0.4 from the common factor variance table. Second, the number of common factors and the number of loads of each indicator on its factor level were determined by interpreting the total variance table and rotating component matrix table. Third, the extracted common factors were then named and classified. Three common factors and specific indicators are shown in Table 2. The chosen indicators were organized at the factor level and indicator level in the table. The factor level comprises experience, commercialization, and coordinative green development. The indicator layer of experience is composed of seven indicators, C11–C17. The indicator layer of commercialization comprises two indicators, C21 and C22. The indicator layer of coordinative green development is made up of six indicators, C31–C36.

4.2. Determining the Weight of the Evaluation Indicators

The principal component analysis (PCA) is very useful in simplifying the number of variables. With its help, we can narrow down to several representative comprehensive indicators to reasonably, objectively, and scientifically describe the basic constructs (factors) in the indicator hierarchy [69]. We used it to extract the common factors and determine the weight of the indicators that contribute to the common factors. The specific steps are as follows:
(1) Factor analysis feasibility test. Bartlett’s test of sphericity and Kaiser-Meyer-Olkin (KMO) measure of sampling adequacy were used to test whether PCA can help reduce the dimensionality of the indicators in the collected data. If the p-value of the Bartlett test statistic is close to 0, less than the chosen 0.05 of significant level, the null hypothesis that the correlation matrix of the indicators being an identity matrix can be rejected. It is then concluded that the original indicators are suitable for factor analysis. We also assessed whether the indicators were suitable for principal component analysis according to the value of the KMO statistics, which measures the proportion of variance in our variables that might be caused by underlying factors, using the rule of thumb stated in Table 3.
(2) Extraction of common factors. To accurately represent the data collected through the questionnaire, the indicators with a degree of commonality less than 0.4 were excluded from the common factor variance table. Then, the degree that each indicator can explain the total variance of the original variable was analyzed. Based on the principle that the eigenvalue of the extracted common factors must be greater than one, the common factors were extracted and the eigenvalues of each common factor were determined.
(3) Determination of the factor load matrix. The weights at the common factor layer were calculated by load variance and the three corresponding factor layers were named. The rotating component matrix table was obtained by orthogonalization of maximum variance and the load number of each indicator on its factor layer was obtained.
(4) Determination of the weight. First, the coefficients of each indicator in different principal components were determined. The formula used was Q = m n 1 \ 2 , where m is the load number of each indicator in the rotating component matrix and n is the eigenvalue of each indicator corresponding to the factor layer. Second, using variance contribution rate, we determined the indicator coefficients of each indicator in the comprehensive model. All indicators could be represented by common factors and could be regarded as weighted by the contribution rate of rotational variance of the three principal components. The formula used was   P i = j = 1 j = 3 Q i j × C j j = 1 j = 3 C j , where i indexes the indicators, j indexes the principal component, Q denotes the coefficient of the indicators in different principal components, and C denotes the variance contribution rate of the principal components. Third, the indicator coefficients were normalized, and the set of weight of each indicator on the overall satisfaction of tourists was obtained (see Table 2).

4.3. Fuzzy Comprehensive Evaluation Method

The fuzzy comprehensive evaluation method has great advantages in dealing with qualitative, uncertain, and imperfect information [70]. The indicators for tourist satisfaction are generally vague and it is quite difficult to describe them quantitatively. This article, therefore, used the method of the fuzzy comprehensive evaluation to evaluate the level of tourist satisfaction. The main steps used to construct the evaluation scores are as follows, with their actual implementation illustrated in details in Section 4 below:
Step 1: Determine the factor set U, evaluation set V, and the row vector W of the weights for each factor according to Table 2;
Step 2: Establish the proportions of various evaluation levels of each indicator and construct the comprehensive evaluation matrix R and the fuzzy set;
Step 3: The fuzzy comprehensive evaluation set B was then obtained from the comprehensive evaluation matrix R as:
B = WR
Step 4: The comprehensive evaluation score E was calculated from the fuzzy comprehensive evaluation set B and the column vector of measurement scale H as:
E = BH
where H = (5, 4, 3, 2, 1) T was the column vector of Likert scales for the five attributes of “very satisfied”, “satisfied”, “unclear”, “dissatisfied”, and “very dissatisfied”.

4.4. Importance-Performance Analysis (IPA) Method

The IPA is prevalent in tourism research [71,72,73]. This paper used the IPA method to assess and analyze the importance and performance (measured by the satisfaction level) of tourist experience and commercialization of tourism at cultural heritage sites. The main steps are as follows: First, the importance (I) score of each indicator was calculated and the performance (P) score of satisfaction of each indicator was calculated by the fuzzy comprehensive evaluation method according to the results of the questionnaire survey described above. Second, the boundaries of the IPA quadrant distribution chart were determined. Third, the average values of the importance and performance of the indicators were computed and the intersection points of the two average values were used as the origin in the IPA quadrant distribution chart, in which the horizontal axis corresponded to the importance attribute and the vertical axis corresponded to the performance attribute (measured by the level of satisfaction). Fourth, the IPA quadrant distribution chart was divided into four quadrants based on the vertical intersection coordinate axis of the intersection point determined in the third step and the 15 indicators were plotted at the corresponding positions in the four quadrants. We then interpreted and explained each indicator of the four quadrants and put forward corresponding optimization countermeasures.

4.5. Data Sources

The data in this paper were collected through questionnaires and in-depth interviews. First, a research team was set up, consisting of five experts from the fields of cultural heritage, heritage tourism and green development, 15 graduate students majoring in tourism management and 5 undergraduates majoring in tourism management. Second, a pilot survey was administered online with 50 questionnaires and revision to the initial questionnaire was carried out to arrive at the final version of the questionnaire. Third, a total of 500 questionnaires were distributed in Hangzhou West Lake and Nanjing Confucius Temple from July 10 to 15, 2017 and in Pingyao Ancient City from November 17 to 19, 2017. All of the questionnaires were collected back. After eliminating the invalid questionnaires, we were left with 448 valid questionnaires, representing an overall response rate of 89.6%. Fourth, the research team conducted in-depth interviews with tourism enterprises and tourists in Pingyao Ancient City, Hangzhou West Lake, and Nanjing Confucius Temple to obtain additional first-hand data. Fifth, the validity and reliability of the questionnaires were tested. The results showed a KMO = 0.903 > 0.9 and the p-value of Bartlett spherical test = 0.000 < 0.01, illustrating good validity of the sample. Cronbach alpha coefficient = 0.868 > 0.8 indicated good reliability of the questionnaire.

5. Results and Analyses

In this section, the attributes of the sample are analyzed first. The performance on tourist satisfaction and the importance of tourism to CGDTECT are examined next. The IPA quadrant distribution is used to analyze the performance and importance of CGDTECT last.

5.1. Sample Description

As shown in Table 4, slightly more females participated in the study (57.8% vs. 42.2%). The age of the majority of the respondents ranged from 18 to 30 years (74.1%). Most of the occupations of the participants of the survey were students (51.8%) and ordinary employees of enterprises (19.2%). Regarding travel budgets, most (46.2%) spent less than 1500 yuan or approximately US$224. The majority of the respondents had a specialist or undergraduate degree (74.1%), followed by a high school degree and below (14.5%), a master’s degree (10.0%), and a doctorate (1.3%). The majority of the respondents traveled less than twice a year (53.8%), indicating that the frequency of travel is low. The sources of origin of the tourist of the three cultural heritage sites were mainly the adjacent provinces and provinces where the heritage sites were located. Generally, Beijing, as the political, economic, and cultural center of China, was the major source of tourists of cultural heritage tourism. Tourists of Pingyao Ancient City came mainly from Shanxi, Beijing, and Hebei provinces; tourists of Nanjing Confucius Temple originate mainly from Jiangsu and Beijing; tourists of Hangzhou West Lake were mainly from Jiangsu, Beijing, and Zhejiang provinces.

5.2. Satisfaction Analysis

First, a set of fuzzy comprehensive performance evaluation was constructed; second, the evaluation results were analyzed at the factor layer and indicator layer; finally, the influencing factors of tourist satisfaction regarding CGDTECT were examined.

5.2.1. Constructing Fuzzy Comprehensive Satisfaction Evaluation Set

Step 1: Determine the factor set U, evaluation set V, and the row vector W of the weights for each factor
Based on the results in Table 2, we set up the factor set for experience Uexp = {C11, C12, C13, C14, C15, C16, C17}. Likewise, other factor set Ucom can be identified for commercialization and Ucoo for coordinative green development.
The evaluation set V = {5, 4, 3, 2, 1} is constructed based on the five-point Likert scales.
We obtain the row vector of weights of the seven indicators for the experience factor from Table 2. as Wexp = (0.155, 0.166, 0.164, 0.065, 0.132, 0.157, 0.161) and use it to measure the relative degree of importance in their contribution to the fuzzy set of the experience factor. Likewise, the row vectors of weights for the commercialization and coordinative green development factors are Wcom = (0.544, 0.456) and Wcoo = (0.255, 0.154, 0.130, 0.154, 0.163, 0.144), respectively.
Step 2: Establish the proportions of various evaluation levels of each indicator and construct the comprehensive evaluation matrix R and the fuzzy set
The valid and usable number of questionnaires for each indicator is first obtained and the proportions for the five satisfaction levels are calculated (see Table 5).
From Table 5, we know that the proportions of the five levels of satisfaction of the experiential indicators are as follows: RC11 = (0.011, 0.125, 0.181, 0.522, 0.161), RC12 = (0.007, 0.125, 0.219, 0.448, 0.201), RC13 = (0.002, 0.125, 0.192, 0.520, 0.161), RC14 = (0.020, 0.121, 0.216, 0.449, 0.194), RC15 = (0.004, 0.123, 0.306, 0.442, 0.125), RC16 = (0.004, 0.094, 0.221, 0.487, 0.194), and RC17 = (0.002, 0.109, 0.273, 0.444, 0.172). Using them to construct the comprehensive evaluation matrix R for tourist experience, we have:
R exp = [ 0.011 , 0.125 , 0.181 , 0.522 , 0.161 0.007 , 0.125 , 0.219 , 0.448 , 0.201 0.002 , 0.125 , 0.192 , 0.520 , 0.161 0.020 , 0.121 , 0.216 , 0.449 , 0.194 0.004 , 0.123 , 0.306 , 0.442 , 0.125 0.004 , 0.094 , 0.221 , 0.487 , 0.194 0.002 , 0.109 , 0.273 , 0.444 , 0.172 ]
Step 3: Compute the fuzzy comprehensive evaluation set B from the comprehensive evaluation matrix R
According to the comprehensive evaluation matrix R, the indicator-level of fuzzy comprehensive evaluation set for the experience factor is Bexp = WexpRexp = (0.006, 0.117, 0.229, 0.476, 0.172). Likewise, the indicator-level of fuzzy comprehensive evaluation set for the commercialization and coordinative green development factors are, respectively, Bcom = (0.110, 0.273, 0.227, 0.284, 0.106) and Bcoo = (0.020, 0.108, 0.333, 0.385, 0.154).
The factor-level comprehensive evaluation matrix R is constructed from the three fuzzy comprehensive evaluation sets Bexp, Bcom, and Bcoo as:
R = [ B exp B com B coo ] = [ 0.006 , 0.006 , 0.229 , 0.476 , 0.172 0.110 , 0.273 , 0.227 , 0.284 , 0.106 0.020 , 0.108 , 0.333 , 0.385 , 0.154 ]
From Table 2, we obtain the weights for the importance of the factors and construct the row vector of factor importance W= (0.448, 0.160, 0.392). We then compute the factor-level fuzzy comprehensive evaluation set B = WR = (0.028, 0.138, 0.269, 0.410, 0.154).
Step 4: Calculate the comprehensive evaluation score E from the fuzzy comprehensive evaluation set B and the column vector of measurement scale H
The comprehensive evaluation scores for the three factors of experience, commercialization, and coordinative green development as well as the overall score are calculated by de-fuzzification.
Eexp = BexpH = 3.691
Ecom = BcomH = 3.003
Ecoo =BcooH = 3.545
E = BH = 3.521

5.2.2. Analysis of the Evaluation Results

The overall satisfaction value is E = 3.521, around the “neutral” level, which indicates that tourist satisfaction can be further improved. The degrees of satisfaction of the three factors rank in descending order as experience, coordinative green development, and commercialization.
Following the same idea in the construction of the comprehensive evaluation score, the mean evaluation score of each indicator can be calculated by de-fuzzification using a unit weight of one, i.e., Wind = 1, for each indicator. For example, the mean value for the diversity of cultural products (C11) is EC11 = BC11H = WindRC11H = (0.011, 0.125, 0.181, 0.522, 0.161) H = 3.697 and the mean value for the authenticity of cultural products (C12) is EC12 = BC12H = WindRC12H = (0.007, 0.125, 0.219, 0.448, 0.201) H = 3.711. The mean value of satisfaction evaluation of other indicators can be computed likewise and the results are presented in Table 6.
The tourist satisfaction on experience. The comprehensive evaluation score of tourist satisfaction on experience is the highest (3.691), slightly higher than that of the overall satisfaction (3.521). We can see from Table 6 that the mean comprehensive evaluation scores of the indicators that make up for the experience factor are all around the “satisfied” level and the indicators ranked in descending order of the mean comprehensive evaluation score values are C16, C13, C12, C11, C14, C17, and C15. A visitor to the Confucius Temple in Nanjing said, “The local tourism culture products are mainly buildings and night scenery light that lack characteristics, with a relatively shallow experience.” Another visitor in Pingyao commented, “The scenic spot should improve public service facilities.” We can see that although all the mean evaluation values of the experiential indicators have reached the “satisfied” level, there are many tourists who feel that there is still room for improvement concerning the local tourism experience, product characteristics, public service facilities.
The tourist satisfaction of commercialization. Visitor satisfaction with commercialization is the lowest at 3.003, which does not reach the overall satisfaction level of 3.521. Among them, the mean satisfaction values of C21 (“Too low degree of commercialization”) and C22 (“Too high degree of commercialization”) are 3.483 and 2.429, respectively. Tourists are more receptive to the commercialization of cultural heritage sites, but there is great dissatisfaction with the over-commercialization, fearing that the local community may not be able to control the degree and direction of commercialization, which may affect the protection, inheritance, and sustainable use of cultural heritage.
The tourist satisfaction of coordinative green development. Visitors’ satisfaction with coordinative green development has a comprehensive evaluation score of 3.545, slightly higher than the overall satisfaction value of 3.521. Among them, C32, C35, and C36 are higher than the overall value, while C31, C33, and C34 are lower. One of the hostel owners of the West Lake commented, “Coordinative green development is not bad, but I am afraid that most tourism enterprises will be reluctant to participate due to the long breakeven period.” Most tourists and tour operators are more satisfied with the economic benefits brought about by coordinative green development while fewer are satisfied with its social and cultural benefits.
Among the fifteen indicators, ten indicators reach the overall performance level, accounting for 66.7% of the total number of indicators. The majority of indicators belong to the experiential factor, accounting for 46.7% of the total number of indicators. Indicators with the lowest score of satisfactions are C22, C31, and C34.

5.2.3. Influencing Factors Analysis

Correlation analysis is a method to analyze the degree of a linear relationship between two variables by calculating the correlation coefficient between two variables. However, due to the influence of the additional factors, the Pearson correlation coefficient cannot truly reflect the degree of linearity between two variables. Partial correlation analysis controls for other variables that may have an impact on the linear correlation between the two variables [74]. Therefore, the partial correlation coefficient was used to analyze the degree of influence of each evaluation indicator on tourists’ overall satisfaction. Usually, the correlation intensity between variables is judged by the following rule of thumb: absolute values between 0.8 and 1 imply very strong correlation; absolute values between 0.5 and 0.8 imply strong correlation; absolute values between 0.3 and 0.5 imply weak correlation; absolute values between 0.0 and 0.3 imply very weak correlation or non-correlation. The results in Table 6 show that the correlation coefficients of C11, C13–C17, C22, C31, and C32 are between 0.3–0.5, which are weakly correlated with the overall satisfaction of tourists, while those of C12, C21, and C33–C36 are between 0.5–0.8, implying a strong correlation with the overall satisfaction of tourists.

5.3. Importance Analysis

Regarding the importance of the indicators, we analyzed and computed the mean and standard deviation of the evaluation scores on the importance and presented the results in Table 7. At the factor layer, the mean values of importance from high to low are experience (4.192), coordinative green development (3.954), and commercialization (2.670). This shows that participants in the survey thought that tourist experience was more important than tourism commercialization. At the same time, they thought that it was important to coordinate the green development of tourist experience and tourism commercialization.
As can be seen from Table 7, at the indicator layer that affects satisfaction, the indicators with importance mean value that is greater than the overall mean (3.605) are: C11 (4.290), C12 (4.266), C13 (4.083), C14 (4.165), C15 (4.208), C16 (4.232), C17 (4.098), C31 (4.011), C32 (4.085), C33 (3.614), C34 (3.754), C35 (4.136), and C36 (4.123), accounting for 86.67% of all indicators. It indicates that tourists have high expectations for the attributes captured by these indicators, which capture the experience and coordinative green development. The mean values of the importance of C21 and C22 are relatively low, at 2.998 and 2.342, respectively. This implies that tourists, in general, feel that too high and too low degree of commercialization of tourism at the cultural heritage sites are not really that important. This also indicates that many tourists have a weak perception of the degree of commercialization of tourism. They do not have a negative perception of over-tourism and over-commercialization, nor do they realize that the low degree of commercialization may hinder the socioeconomic development of the cultural heritage sites.

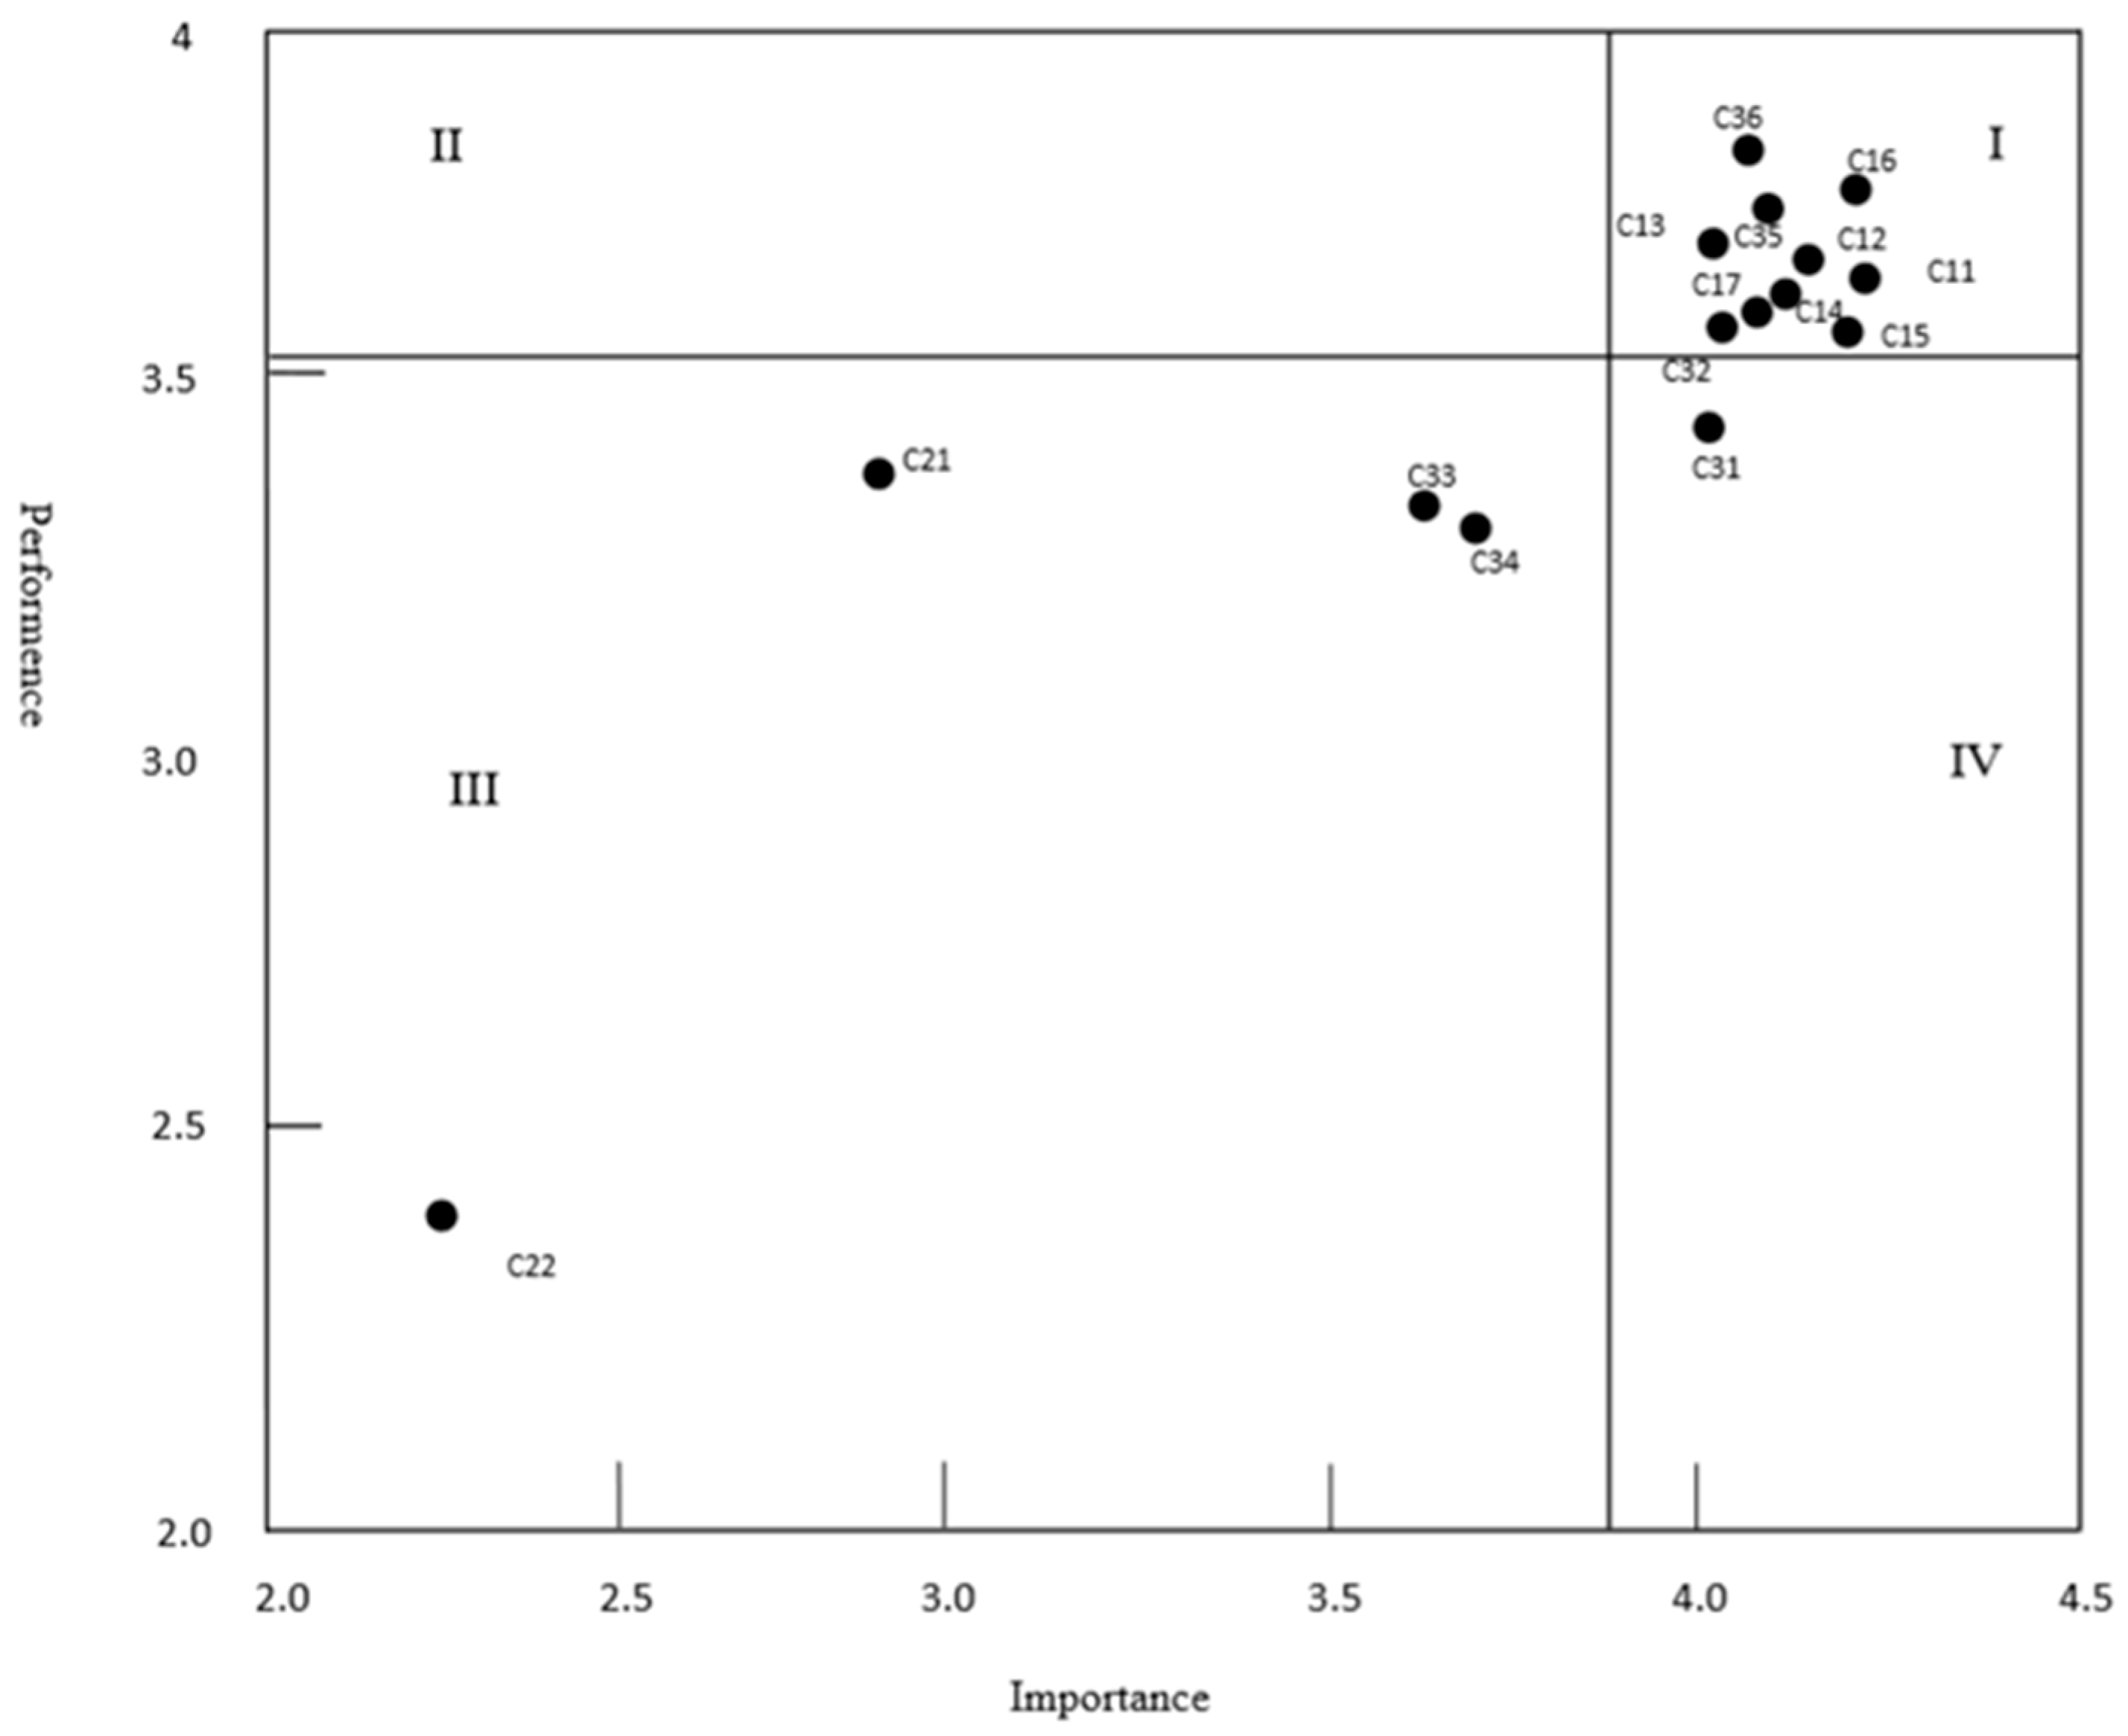
5.4. Importance-Performance Analysis

IPA quadrant distribution in Figure 2 was used to analyze the potential discrepancy between the sense of the importance of tourism and the degree of satisfaction of tourists at the indicator layer.
(1) Quadrant I (high importance–high performance). Figure 2 shows that ten indicators fall in Quadrant I, and there is still room for further improvement. These indicators are: C11, C12, C13, C14, C15, C16, C17, C21, C35, and C36. Tourists feel that these ten indicators are very important in CGDTECT and are satisfied with their performance, measured by their level of satisfaction. This implies that the resource investment in the experience of cultural products, public service facilities, management, and construction are efficient. However, the mean values of these performance indicators are all below 4.0, indicating that these items only meet the basic satisfactory needs of tourists, but not quite the “very satisfied” level. Therefore, tourism developers and managers of the cultural heritage sites could continue to adopt strategies to enhance the experience and create high-quality cultural products in the future, strive to strike a better balance between tourist experience and tourism commercialization, and pay more attention to the role of coordinative green development in local economy, society, and culture.
(2) Quadrant II (low importance–high performance). Interestingly, no indicator falls in Quadrant II. Indicators in this quadrant are of low importance, but tourists are highly satisfied. Therefore, the relevant management departments and operators of the cultural heritage sites could adopt appropriate expansion strategies and create some products, services, and activities that tourists do not feel as very important but will pleasantly surprise them, such as a more humanized design of public service facilities to further enhance tourists’ satisfaction.
(3) Quadrant III (low importance–low performance). Four indicators fall in Quadrant III: C21, C22, C33, and C34. This shows that tourists feel that too low or too high degree of commercialization and the role of coordinative green development in eliminating ticket economy and mitigating over-commercialization of cultural heritage resources are neither important nor satisfied. Governments and tourism managers of these cultural heritage sites could adopt active development strategies, strengthen the control of tourism commercialization, and fully realize the role of coordinative green development in eliminating ticket economy and slowing the over-commercialization of resources to change tourists’ attitudes.
(4) Quadrant IV (high importance–low performance). There is only one indicator, the degree of coordinative green development (C31), in Quadrant IV. It shows that tourists think that CGDTECT at the cultural heritage sites is very important, but the satisfaction level of tourists on this aspect is low. Governments and tourism managers could adopt key improvement strategies, raise awareness of green coordinative development, and enhance the experience of tourists without destroying the authenticity of cultural heritage while promoting CGDTECT at the cultural heritage sites.

6. Conclusions

Whether tourist experience and commercialization of tourism at the cultural heritage sites can be developed in a green and coordinated way relies heavily on the protection and inheritance of cultural heritage value, high-quality development of tourism, and the improvement of the tourist experience. Taking Pingyao Ancient City of World Cultural Heritage, Hangzhou West Lake of World Cultural Landscape, and Nanjing Confucius Temple of Historic and Cultural Block as examples, this paper constructed a system of indicators to evaluate coordinative green development of tourist experience and commercialization of tourism at cultural heritage sites. We used Delphi, questionnaire investigation, principal component analysis, fuzzy comprehensive evaluation, and importance-performance analysis to analyze the importance and satisfaction of tourists on the CGDTECT at the cultural heritage sites, in order to explore the CGDTECT at the cultural heritage sites in depth. The major conclusions that we arrived at are as follows:
(1) Tourists were basically satisfied with the coordinative green development of experience and commercialization of tourism in Pingyao ancient city, Hangzhou West Lake, and Nanjing Confucius Temple, but there is still much room for improvement. The main influencing indicators affecting tourist satisfaction are the indicators for coordinative green development. Enhancing tourist experience is an effective way to promote the coordinative green development of cultural heritage protection and development, the good tourist experience is based on the protection of the authenticity of cultural heritage. Cultural heritage plays an important role in tourism, so coordinating the relationship between tourism stakeholders is of vital importance to enhance the tourist experience, promote the protection of cultural heritage, and coordinative green development of tourism in cultural heritage sites.
(2) For the importance of experience, commercialization and coordinative green development of tourism at the three cultural heritage sites, tourists ranked them in order: experience, coordinative green development, and commercialization. The improvement of tourist experience needs moderate commercial development and the process of tourism commercialization is actually a process of repeated games between different stakeholders, the result of which is that each interest subject compromises with each other and achieves a dynamic balance. Therefore, the selection of appropriate forms of tourism commercialization, the rational layout of tourist information centers and other commercial facilities, the formulation of control mechanism of tourism commercialization, and the construction of appropriate benefit distribution and compensation mechanism are conducive to the balance of interest subjects, and ultimately promote the coordinative green development of cultural heritage sites.
(3) IPA quadrant distribution chart shows that there are ten indicators, which belong mainly to the experience and coordinative green development factors, that fall in the high importance–high performance Quadrant I. But the performance scores are less than 4.0; hence, continuous promotion strategies could be adopted. There is no indicator in the low importance–high performance Quadrant II; it is, however, quite easy to surprise tourists with appropriate development strategies. Four indicators, which belong mainly to the commercialization factor, fall in the low importance–low performance Quadrant III; hence, active expansion strategies could be adopted. One indicator, the degree of coordinative green development, falls in the high importance–low performance Quadrant IV, indicating that relevant organizations of the scenic spots have an inadequate understanding of green coordinative development and insufficient investment in resources to affect the satisfaction of tourists and key improvement strategies could be adopted. Through the comprehensive analysis of the importance and satisfaction of tourists on the CGDTECT at the cultural heritage sites, we can have a more profound and clear understanding of the relationship between experience, commercialization, and coordinative green development, so as to put forward more targeted green development measures. The research results can provide scientific theoretical guidance and practical reference for effort in promoting coordinative green development of tourists experience and commercialization of tourism at the cultural heritage sites. They can also inform the scientific protection of the cultural heritage sites and the green development of tourism.

7. Limitations and Future Research

Exploring the coordinative green development of tourist experience and commercialization of tourism at cultural heritage sites is important for their protection and sustained utilization. We applied qualitative and quantitative research methods to three types of cultural heritage sites in China. There are some limitations to our results and conclusions. First, the main target of our survey is the tourist. However, the perspective of other stakeholders, e.g., indigenous inhabitants, local tourism practitioners, tourism operators, and so on, should also be taken into consideration in future studies. In addition, the proportion of students in this survey is relatively large; future research should try to balance out survey participants to capture tourists of different ages and occupations. Second, cultural heritage sites make up a complex socio-economic system. Many factors affect the coordinative green development of tourist experience and commercialization of tourism at these sites. How do all these factors work together in such a complex socioeconomic system will need to be studied in depth. The indicator system developed for this paper does not cover a comprehensive set of indicators. Future research can further improve the assessment of cultural heritage tourism from multiple perspectives and levels and transform the indicator system into effective strategies for the development and marketing of cultural tourism products. Third, we used literature analysis, Delphi method, questionnaire survey, statistical analysis, principal component analysis, fuzzy comprehensive evaluation, and IPA analysis, in our study. However, a more complex and complete methodology that combines quantitative methods and qualitative methods using in-depth interviews, more solidly grounded theory, structural equation model, and so on, is worth exploring. Last but not least, our results rely heavily on the geopolitical and cultural background of the mainly domestic tourists at the studied cultural heritage sites. The usual caveat applies when trying to draw lessons from our study to cultural heritage sites located in different countries and locations.

Author Contributions

Conceptualization, C.T.; Data curation, Q.Z.; Formal analysis, Q.Z.; Funding acquisition, C.T.; Investigation, C.T. and Q.Z.; Methodology, C.T. and P.N.; Project administration, C.T.; Supervision, P.N.; Writing – original draft, C.T. and Q.Z.; Writing – review and editing, Q.Z. and P.N.

Funding

This research was funded by the Humanity and Social Science Foundation of the Ministry of Education in China (No.18YJA630102), the Beijing Social Science Fund (No.18JDGLB015), and Top-notch Young Higher Level Teaching Team Building Support Plan in Beijing Municipal Universities (No. CIT and TCD201704067).

Acknowledgments

We thank Wang Xiao Di, Yi Yu Guo and the undergraduates major in human geography and urban and rural planning from grade 2017 and 2016 of Beijing International Studies University for their assistance in administering the questionnaire.

Conflicts of Interest

The authors declare no conflict of interest.

References

  1. Alazaizeha, M.M.; Hallo, J.C.; Backman, S.J.; Norman, W.C.; Vogel, M.A. Value orientations and heritage tourism management at Petra archaeological park, Jordan. Tour. Manag. 2016, 57, 149–158. [Google Scholar] [CrossRef]
  2. Robertson, M. Àite Dachaidh: Re-connecting people with place—Island landscapes and intangible heritage. Int. J. Herit. Stud. 2009, 15, 153–162. [Google Scholar] [CrossRef]
  3. Tan, S.K.; Tan, S.H.; Kok, Y.S.; Choon, S.W. Sense of place and sustainability of intangible cultural heritage—The case of George Town and Melaka. Tour. Manag. 2018, 67, 376–387. [Google Scholar] [CrossRef]
  4. UNESCO World Heritage Committee. Operational guidelines for the implementation of the World Heritage Convention. Parisfr. World Herit. Cent. 28 December 2007. Available online: https://whc.unesco.org/en/guidelines (accessed on 30 August 2019).
  5. Tang, C.C. Evaluation of the tourism prosperity index and its promotion for heritage sites in China. Resour. Sci. 2013, 35, 2344–2351. [Google Scholar]
  6. Wang, Z.; Yang, Z.; Wall, G.; Xu, X.; Han, F.; Du, X.; Liu, Q. Is it better for a tourist destination to be a World Heritage Site? Visitors’ perspectives on the inscription of Kanas on the World Heritage List in China. J. Nat. Conserv. 2015, 23, 19–26. [Google Scholar] [CrossRef]
  7. Richards, G. Cultural tourism: A review of recent research and trends. J. Hospital. Tour. Manag. 2018, 36, 12–21. [Google Scholar] [CrossRef]
  8. Khairi, N.D.M.; Ismail, H.N.; Jaafar, S.M.R.S. Tourist behaviour through consumption in Melaka World Heritage Site. Curr. Issues Tour. 2019, 22, 582–600. [Google Scholar] [CrossRef]
  9. Mitchell, C.J.A.; Waal, S.B.D. Revisiting the model of creative destruction: St. Jacobs, Ontario, a decade later. J. Rural Stud. 2009, 25, 156–167. [Google Scholar] [CrossRef]
  10. Srijuntrapun, P. Appropriate participatory food waste management in the world heritage site, the historic city of Ayutthaya. Kasetsart J. Soc. Sci. 2018, 39, 381–386. [Google Scholar] [CrossRef]
  11. Cigna, F.; Tapete, D.; Lee, K. Geological hazards in the UNESCO world heritage sites of the UK: From the global to the local scale perspective. Earth Sci. Rev. 2018, 176, 166–194. [Google Scholar] [CrossRef]
  12. Gillespie. World heritage protection and the human right to development: Reconciling competing or complimentary narratives using a human rights-based approach (HRBA)? Sustainability 2013, 5, 3159–3171. [Google Scholar] [CrossRef]
  13. Dong, X.W.; Cheng, S.K. Tourist experience satisfaction in world heritage sites based on the theory of tourism consumption technology applied to West Lake and Mount Jianglang, China. Resour. Sci. 2015, 37, 1578–1587. [Google Scholar]
  14. Wen, X.; Mills, J.; Guidi, G.; Rodríguez-Gonzálvez, P.; Barsanti, S.G.; González-Aguilera, D. Geoinformatics for the conservation and promotion of cultural heritage in support of the UN sustainable development goals. Isprs J. Photogramm. Remote Sens. 2018, 142, 389–406. [Google Scholar]
  15. Oikonomopoulou, E.; Delegou, E.T.; Sayas, J.; Moropoulou, A. An innovative approach to the protection of cultural heritage: The case of cultural routes in Chios Island, Greece. J. Archaeol. Sci. Rep. 2018, 14, 742–757. [Google Scholar] [CrossRef]
  16. Poria, Y.; Butler, R.; Airey, D. The core of heritage tourism. Ann. Tour. Res. 2003, 30, 238–254. [Google Scholar] [CrossRef] [Green Version]
  17. Chang, S. Experience economy in the hospitality and tourism context. Tour. Manag. Perspect. 2018, 27, 83–90. [Google Scholar] [CrossRef]
  18. Wang, N. Rethinking Authenticity in Tourism Experience. Ann. Tour. Res. 1999, 26, 349–370. [Google Scholar] [CrossRef]
  19. Walpole, M.; Goodwin, H. Local economic impacts of dragon tourism in Indonesia. Ann. Tour. Res. 2000, 27, 559–576. [Google Scholar] [CrossRef]
  20. Halewood, C.; Hannam, K. Viking heritage tourism: Authenticity and commodification. Ann. Tour. Res. 2001, 28, 565–580. [Google Scholar] [CrossRef]
  21. Wong, C.U.I.; Mckercher, B. Day tour itineraries: Searching for the balance between commercial needs and experiential desires. Tour. Manag. 2012, 33, 1360–1372. [Google Scholar] [CrossRef]
  22. Stroma, C. Beyond authenticity and commodification. Ann. Tour. Res. 2007, 34, 943–960. [Google Scholar]
  23. He, Y.J. Study on commercial operation of ancient town scenic spots under tourism experience. Tour. Overv. 2013, 1, 168–169. [Google Scholar]
  24. Liu, M. Study on cultural heritage tourism development of commercialization and authenticity dilemma. Jiangsu Commer. Forum 2015, 32, 13–15. [Google Scholar]
  25. Zhong, S.Q. A Study on the commercialization of tourism in the historical and cultural district of Nanjing Confucius Temple. Nanjing Univ. Nanjing Prov. 2017. [Google Scholar]
  26. Zatori, A.; Smith, M.K.; Puczko, L. Experience-involvement, memorability and authenticity: The service provider’s effect on tourist experience. Tour. Manag. 2018, 67, 111–126. [Google Scholar] [CrossRef]
  27. Kim, J.H. The antecedents of memorable tourism experiences: The development of a scale to measure the destination attributes associated with memorable experiences. Tour. Manag. 2014, 44, 34–45. [Google Scholar] [CrossRef]
  28. Xu, K.S.; Yan, T.; Zhu, X. Commodification of Chinese heritage villages. Ann. Tour. Res. 2013, 40, 412–427. [Google Scholar] [CrossRef]
  29. Tang, C.C.; Wu, X.F.; Zheng, Q.Q.; et al. Ecological security evaluations of the tourism industry in Ecological Conservation Development Areas: A case study of Beijing’s ECDA. J. Clean. Prod. 2018, 197, 999–1010. [Google Scholar] [CrossRef]
  30. Yang, Y.; Liu, Y. Progress in China’s sustainable development research: Contribution of Chinese geographers. J. Geogr. Sci. 2016, 26, 1176–1196. [Google Scholar] [CrossRef]
  31. Wang, M.; Zhao, H.; Cui, J.; Fan, D.; Lv, B.; Wang, G.; Li, Z. Evaluating green development level of nine cities within the Pearl River Delta, China. J. Clean. Prod. 2018, 174, 315–323. [Google Scholar] [CrossRef]
  32. Ma, Y.; Liu, J. The core value and promotion strategy of tourism eco-efficiency under the background of green development. Tour. Trib. 2016, 31, 1–3. [Google Scholar]
  33. Zhong, L.S.; Zeng, Y.X. New thesis of green development concept for China’s tourism industry. Tour. Trib. 2016, 31, 1–3. [Google Scholar]
  34. Xiao, J.H.; Wang, M.; Yu, Q.D. Study on the ecological compensation standards of green development of island tourism—A case study of Putuo Golden Triangle in Zhoushan Islands. Resour. Environ. Yangtze Basin 2016, 25, 1247–1255. [Google Scholar]
  35. Law, A.; Lacy, T.D.; Lipman, G.; Jiang, M. Transitioning to a green economy: The case of tourism in Bali, Indonesia. J. Clean. Prod. 2016, 111, 295–305. [Google Scholar] [CrossRef]
  36. Tang, C.C.; Zheng, Q.Q.; Qin, N.N. A Review of green development in the tourism industry. J. Resour. Ecol. 2017, 8, 449–459. [Google Scholar]
  37. Eagles, P.F.J. Trends in outdoor recreation, leisure and tourism. Ann. Tour. Res. 2002, 29, 876–878. [Google Scholar] [CrossRef]
  38. Ryan, C.; Gu, H.M. Constructionism and culture in research: Understandings of the fourth Buddhist Festival, Wutaishan, China. Tour. Manag. 2010, 31, 167–178. [Google Scholar] [CrossRef]
  39. Breiter, D.; Milman, A. Attendees’ needs and service priorities in a large convention center: Application of the importance-performance theory. Tour. Manag. 2006, 27, 1364–1370. [Google Scholar] [CrossRef]
  40. Cai, C.Y.; Luo, P.C.; Tang, C.C.; Zhang, X.Y. An Evaluation of tourists’ satisfaction degree of folk house world heritages based on IPA analysis: A case study of Yongding Hakka earth building in Fujian province, China. Resour. Sci. 2011, 33, 1374–1381. [Google Scholar]
  41. Taplin, R.H. Competitive importance-performance analysis of an Australian wildlife park. Tour. Manag. 2012, 33, 29–37. [Google Scholar] [CrossRef]
  42. Guadagnolo, F. The importance-performance analysis: An evaluation and marketing tool. J. Park Recreat. Adm. 1985, 14, 43–54. [Google Scholar]
  43. Huang, F.H.; Ye, Y.J.; Kao, C.H. Developing a novel intuitionistic fuzzy importance–performance analysis for evaluating corporate social responsibility in sport tourism event. Expert Syst. Appl. 2015, 42, 6530–6538. [Google Scholar] [CrossRef]
  44. Azzopardi, E.; Nash, R. A critical evaluation of importance-performance analysis. Tour. Manag. 2013, 35, 222–233. [Google Scholar] [CrossRef]
  45. Lai, I.K.W.; Hitchcock, M. Importance-performance analysis in tourism: A framework for researchers. Tour. Manag. 2015, 48, 242–267. [Google Scholar] [CrossRef]
  46. Sever, I. Importance-performance analysis: A valid management tool? Tour. Manag. 2015, 48, 43–53. [Google Scholar] [CrossRef]
  47. Deng, W.J.; Chen, W.C.; Pei, W. Back-propagation neural network based importance–performance analysis for determining critical service attributes. Expert Syst. Appl. 2008, 34, 1115–1125. [Google Scholar] [CrossRef]
  48. Islam, M.S.; Tseng, M.L.; Karia, N.; Lee, C.H. Assessing green supply chain practices in Bangladesh using fuzzy importance and performance approach. Resour. Conserv. Recycl. 2018, 131, 134–145. [Google Scholar] [CrossRef]
  49. Abalo, J.; Varela, J.; Manzano, V. Importance values for Importance–performance analysis: A formula for spreading out values derived from preference rankings. J. Bus. Res. 2007, 60, 115–121. [Google Scholar] [CrossRef]
  50. Frauman, E.; Banks, S. Gateway community resident perceptions of tourism development: Incorporating Importance-Performance Analysis into a limits of acceptable change framework. Tour. Manag. 2011, 32, 128–140. [Google Scholar] [CrossRef]
  51. Phadermrod, B.; Crowder, R.M.; Wills, G.B. Importance-performance analysis based SWOT analysis. Int. J. Inf. Manag. 2019, 44, 194–203. [Google Scholar] [CrossRef]
  52. Trang, S.T.N.; Zander, S.; Bastiaande, V.; Kolbe, L.M. Towards an importance–performance analysis of factors affecting e-business diffusion in the wood industry. J. Clean. Prod. 2016, 11, 121–131. [Google Scholar] [CrossRef]
  53. Ban, O.I.; Ban, A.I.; Tuşe, D.A. Importance–Performance Analysis by fuzzy c-means algorithm. Expert Syst. Appl. 2016, 50, 9–16. [Google Scholar] [CrossRef]
  54. Wang, L.; Xu, C.; Yang, X.X. Authenticity and tourist experience of Pingyao ancient city. Tour. Overv. 2018, 8, 82–83. [Google Scholar]
  55. Wang, Y. Existing problems and optimizing strategies of tourism development in urban cultural districts: A case study of Nanjing Confucius Temple. Jiangsu Commer. Forum 2012, 29, 114–117. [Google Scholar]
  56. Zhang, Q. Discussion on dark tourism and its development from perspective of experience. J. Anhui Agric. Sci. 2010, 50, 437–439. [Google Scholar]
  57. Chhabra, D.; Healy, R.; Sills, E. Staged authenticity and heritage tourism. Ann. Tour. Res. 2003, 30, 702–719. [Google Scholar] [CrossRef]
  58. Li, X.H.; Yang, Z.P.; Liu, X.L. Study on tourism protection and development model of historic and cultural Vvllages: A case study of Maza village in Tuyugou, Turpan. Arid Land Geogr. 2006, 27, 301–306. [Google Scholar]
  59. Sørensen, J.F.; Jensen, F. Value creation and knowledge development in tourism experience encounters. Tour. Manag. 2015, 46, 336–346. [Google Scholar] [CrossRef]
  60. Chu, S.Y. Experiential tourism from the perspective of great aesthetic economy. Jiangsu Commer. Forum 2006, 21, 50–52. [Google Scholar]
  61. Getz, D.; Cheyne, J. Special event motivation and behavior. In: Ryan C. The tourist experience: A new introduction. Lond. Cassell. 1997, 136–154. [Google Scholar]
  62. Ibanez, L.; Moureau, N.; Roussel, S. How do incidental emotions impact pro-environmental behavior? evidence from the dictator game. J. Behav. Exp. Econ. 2017, 66, 150–155. [Google Scholar] [CrossRef]
  63. Davies, E. Shaping tourism trends —The commercial perspective. Tour. Manag. 1987, 8, 102–104. [Google Scholar] [CrossRef]
  64. Zhou, C.S.; Luo, Y. The development strategy of Shenquan Harbor in Huilai county from the view point of modern fishery harbor economic zone. Trop. Geogr. 2005, 25, 33–37. [Google Scholar]
  65. Zhao, W. Comparative study on commercialization of heritage tourism -- taking Lijiang ancient city of China and Lyon old city of France as examples. J. South Cent. Univ. Natl. (Hum. Soc. Sci.) 2016, 57, 110–114. [Google Scholar]
  66. Xiong, L.M.; Li, Y.H. Study on tourism commercialization of Fenghuang Ancient Town. Resour. Dev. Mark. 2012, 28, 285–288. [Google Scholar]
  67. Bao, J.G.; Lin, M.H. Study on control of tourism commercialization in historic town and village. Acta Geogr. Sin. 2014, 79, 268–277. [Google Scholar]
  68. Liu, A.L.; Tu, Q.H.; Liu, M.; Liu, F.C. Evolution characteristics and mechanism of tourism commercialization development in a religious heritage site: A case study of Shaolin Temple Scenic Area. Geogr. Res. 2015, 34, 1781–1794. [Google Scholar]
  69. Yi, C.Q.; Lu, T.X.; Yue, J.M. Discussion on the application of principal component analysis in enterprise development evaluation. J. Xichang Coll. (Nat. Sci. Ed.) 2018, 33, 60–63. [Google Scholar]
  70. Xing, Q.X.; Sun, H.; Guan, B.; Zheng, J.F. The Satisfaction of Free Park visitors in Xi’an based on fuzzy comprehension evaluation. Resour. Sci. 2014, 36, 1645–1651. [Google Scholar]
  71. Boley, B.B.; Gehee, N.G.M.; Hammett, A.L.T. Importance-performance analysis (IPA) of sustainable tourism initiatives: The resident perspective. Tour. Manag. 2017, 58, 66–77. [Google Scholar] [CrossRef]
  72. Ramanathan, R.; Ramanathan, U. A new rational IPA and application to cruise tourism. Ann. Tour. Res. 2016, 61, 264–267. [Google Scholar] [CrossRef] [Green Version]
  73. Wang, X.; Li, X.; Zhen, F.; Zhang, J.H. How smart is your tourist attraction? Measuring tourist preferences of smart tourism attractions via a FCEM-AHP and IPA approach. Tour. Manag. 2016, 54, 309–320. [Google Scholar] [CrossRef]
  74. Xie, Y.Q.; Li, N.P.; Chen, S.Q.; Sun, F.M.; Ni, J.; Zhou, H. Investigation and partial correlation analysis of residential building energy consumption in Changsha city. Gas Heat 2007, 30, 85–88. [Google Scholar]
Figure 1. Case studies.
Sustainability 11 04732 g001
Figure 2. Importance-performance quadrant distribution.
Sustainability 11 04732 g002
Table 1. The brand acquisition and tourism development in the three case studies.
ItemPingyao Ancient City, Shanxi ProvinceHangzhou West Lake, Zhejiang ProvinceNanjing Confucius Temple, Jiangsu Province
Brand acquisitiona. Selected in the second batch of famous historical and cultural cities in China in 1986.
b. Listed on the World Cultural Heritage List in 1997.
c. Awarded the honorary title of “One of the Ten Ancient Cities of China” in 1997.
d. Awarded the title of “National Tourist Postcard” in 2007.
e. Rated as a national 5A tourist attraction in 2015.
a. Selected in the first batch of national key scenic spots in 1982.
b. Selected as one of the top ten scenic spots in China in 1985.
c. Rated as a national 5A tourist attraction in 2007.
d. Listed on the World Cultural Heritage List in 2001.
a. Jiangnan Examination Hall was listed as the provincial key cultural relic’s protection unit in 2002.
b. Rated as a provincial scenic spot in 2003.
c. Awarded the title of “Famous Commercial Street in China” in 2007.
d. Rated as a national 5A Scenic Spot in 2010.
e. Selected in the first batch of historical and cultural street blocks in Jiangsu Province in 2016.
Tourism developmentIn 2017, a total of 12.973 million visitors were received, an increase of 21.97% compared to the same period of the previous year, and the total tourism revenue was 15.546 billion yuan, an increase of 23.72% compared to the same period of the previous year.In 2018, a total of 28.139 million visitors were received; in the first three quarters, 14.081 million visitors were received, an increase of 10.11% over the same the period of previous year, and the total tourism revenue was 23.896 billion yuan, an increase of 10.25% over the same period of the previous year.In 2017, 38.5 million visitors were received. The total tourism revenue of the whole region was 54.46 billion yuan.
Source: Our own elaboration based on the information provided by the UNESCO World Heritage Committee and website.
Table 2. The indicators of coordinative green development of tourist experience and commercialization of tourism (CGDTECT) at cultural heritage sites.
Factor LayerWeightIndicator LayerWeightReferencesAttribute
Experience (B1)0.448 Diversity of cultural products (C11)0.155Zhang (2010) [56]+
Authenticity of cultural products (C12)0.166Chhabra et al. (2003) [57]+
Diversity of experience of cultural products (C13)0.164Li et al. (2006) [58]+
Experience of tourism public service facilities at cultural heritage sites (C14)0.065Sørensen and Jensen (2015) [59]+
Experience of intelligent construction and Management of tourism at cultural heritage sites (C15)0.132Chu (2006) [60]+
The promotional impact of good experience on tourism culture (C16)0.157Getz and Cheyne (1997) [61]+
The promotional impact of good experience on the green development of local communities (C17)0.161Ibanez et al. (2017) [62]+
Commercialization (B2)0.160Too low degree of commercialization (C21)0.544Davies (1987) [63]-
Too high degree of commercialization (C22)0.456Zhou and Luo (2005) [64]-
Coordinative green development
(B3)
0.392Degree of coordinative green development between experience and commercialization (C31)0.255Wong and Mckercher (2012) [21]+
Degree of coordinative green commercialization between authenticity and commercialization (C32)0.154Zhao (2016) [65]+
The role of coordinative green development in eliminating ticket economy in scenic spots (C33)0.130Xiong and Li (2012) [66]+
The role of coordinative green development in mitigating over-commercialization of cultural heritage resources (C34)0.154Bao and Lin (2014) [67]+
The role of coordinative green development in green development of cultural heritage sites (C35)0.163Liu et al. (2015) [68]+
The role of coordinative green development in the green development of local social economy and the protection and inheritance of cultural heritage (C36)0.144Halewood and Hannam (2001) [20]+
Note: + indicated positive indicator, - indicated reverse indicator. Source: Own elaboration.
Table 3. Kaiser-Meyer-Olkin (KMO) metric standard.
Degree of Suitability for Principal Component AnalysisKMO Range
Very suitableKMO > 0.9
Suitable0.8 < KMO < 0.9
General0.7 < KMO < 0.8
Not suitable0.6 < KMO < 0.7
Table 4. Demographics and trip characteristics.
ItemsCategoryPercentageItemsCategoryPercentage
GenderMale42.2%Age<18 years 5.1%
Female57.8% 18–22 years 44.4%
OccupationCorporate executive3.1% 23–30 years 29.7%
Teacher3.6% 31–45 years 14.7%
Civil servant3.6% 46–60 years 5.8%
Ordinary employee of enterprises19.2% > 60 years 0.2%
Student51.8%Degree of educationHigh school and below14.5%
Soldier1.1% Specialist or undergraduate74.1%
Individual household and others17.7% Master10.0%
Monthly income>100,000 yuan3.8% Doctor1.3%
30,000–100,000 yuan5.8%Travel frequency2–3 times a month8.7%
10,000–30,000 yuan8.5% Once a month17.4%
8001–10,000 yuan10.0% Once every three months20.1%
6001–8000 yuan5.0% Once a half-year23.9%
3001–6000 yuan10.0% Once a year11.8%
1501–3000 yuan10.7% Rarely travel18.1%
≤ 1500 yuan46.2%
Source: Our own elaboration.
Table 5. Proportions for the five different degrees of tourist satisfaction.
Factor LayerIndicator LayerVery DissatisfiedDissatisfiedUnclearSatisfiedVery SatisfiedTotal
Experience (B1)Diversity of cultural products (C11)0.0110.1250.1810.5220.1611
Authenticity of cultural products (C12)0.0070.1250.2190.4480.2011
Diversity of experience of cultural products (C13)0.0020.1250.1920.5200.1611
Experience of tourism public service facilities at cultural heritage sites (C14)0.0200.1210.2160.4490.1941
Experience of intelligent construction and Management of tourism at cultural heritage sites (C15)0.0040.1230.3060.4420.1251
The promotional impact of good experience on tourism culture (C16)0.0040.0940.2210.4870.1941
The promotional impact of good experience on the green development of local communities (C17)0.0020.1090.2730.4440.1721
Commercialization (B2)Too low degree of commercialization (C21)0.0490.1520.2270.4110.1611
Too high degree of commercialization (C22)0.1830.4170.2280.1320.0401
Coordinative green development
(B3)
Degree of coordinative green development between experience and commercialization (C31)0.0380.1520.3120.3640.1341
Degree of coordinative green commercialization between authenticity and commercialization (C32)0.0130.1140.3040.4310.1381
The role of coordinative green development in eliminating ticket economy in scenic spots (C33)0.0180.1140.4150.3240.1291
The role of coordinative green development in mitigating over-commercialization of cultural heritage resources (C34)0.0200.1160.3910.3680.1051
The role of coordinative green development in green development of cultural heritage sites (C35)0.0070.0600.3370.4000.1961
The role of coordinative green development in the green development of local social economy and the protection and inheritance of cultural heritage (C36)0.0090.0620.2610.4310.2371
Source: Our own elaboration.
Table 6. The mean of indicator level satisfaction and correlation analysis.
Indicator LayerMean of Satisfaction EvaluationPartial Correlation CoefficientSig.
Diversity of cultural products (C11)3.6970.4220.000
Authenticity of cultural products (C12)3.7110.5480.000
Diversity of experience of cultural products (C13)3.7130.4330.000
Experience of tourism public service facilities at cultural heritage sites (C14)3.6760.3340.000
Experience of intelligent construction and Management of tourism at cultural heritage sites (C15)3.5610.4510.000
The promotional impact of good experience on tourism culture (C16)3.7730.3120.000
The promotional impact of good experience on the green development of local communities (C17)3.6750.3830.000
Too low degree of commercialization (C21)3.4830.6050.000
Too high degree of commercialization (C22)2.4290.3200.000
Degree of coordinative green development between experience and commercialization (C31)3.4040.3910.000
Degree of coordinative green commercialization between authenticity and commercialization (C32)3.5670.3900.000
The role of coordinative green development in eliminating ticket economy in scenic spots (C33)3.4320.5440.000
The role of coordinative green development in mitigating over-commercialization of cultural heritage resources (C34)3.4220.5480.000
The role of coordinative green development in green development of cultural heritage sites (C35)3.7180.5120.000
The role of coordinative green development in the green development of local social economy and the protection and inheritance of cultural heritage (C36)3.8250.5080.000
Source: Own elaboration.
Table 7. The evaluation result on importance at the indicator layer.
Factor LayerIndicator LayerMean of ImportanceStandard Deviation of Importance
Experience (B1)Diversity of cultural products (C11)4.2900.673
Authenticity of cultural products (C12)4.2660.729
Diversity of experience of cultural products (C13)4.0830.825
Experience of tourism public service facilities at cultural heritage sites (C14)4.1650.851
Experience of intelligent construction and Management of tourism at cultural heritage sites (C15)4.2080.782
The promotional impact of good experience on tourism culture (C16)4.2320.733
The promotional impact of good experience on the green development of local communities (C17)4.0980.859
Commercialization (B2)Too low degree of commercialization (C21)2.9981.240
Too high degree of commercialization (C22)2.3421.234
Coordinative green development
(B3)
Degree of coordinative green development between experience and commercialization (C31)4.0110.945
Degree of coordinative green commercialization between authenticity and commercialization (C32)4.0850.871
The role of coordinative green development in eliminating ticket economy in scenic spots (C33)3.6140.949
The role of coordinative green development in mitigating over-commercialization of cultural heritage resources (C34)3.7540.845
The role of coordinative green development in green development of cultural heritage sites (C35)4.1360.804
The role of coordinative green development in the green development of local social economy and the protection and inheritance of cultural heritage (C36)4.1230.809
Source: Own elaboration.

