On the Use of Market-Based Instruments to Reduce Air Pollution in Asia

1
Department of Economics, University of Gothenburg, 40530 Gothenburg, Sweden
2
Environment for Development Initiative, University of Gothenburg, 40530 Gothenburg, Sweden
3
School of Economics, University of Cape Town, Cape Town 7700, South Africa
4
National School of Development, Peking University, Beijing 100871, China
*
Author to whom correspondence should be addressed.
Sustainability 2019, 11(18), 4895; https://0-doi-org.brum.beds.ac.uk/10.3390/su11184895
Submission received: 15 July 2019
/
Revised: 28 August 2019
/
Accepted: 3 September 2019
/
Published: 6 September 2019
(This article belongs to the Special Issue Economics of Environmental Taxes and Green Tax Reforms)
Abstract
:The high rates of economic activity and environmental degradation in Asia demand the implementation of creative and cost-effective environmental policy instruments that provide polluters with more flexibility to find least-cost solutions to pollution reduction. Despite their many theoretical advantages, the use of market-based instruments (MBIs) is a relatively recent phenomenon in Asia, partly due to policymakers being unfamiliar with MBIs and countries lacking the institutional capacity to implement and enforce them. This paper reviews the Asian experience with MBIs intended to reduce air pollution emissions and synthetizes lessons to be drawn and areas for improvement.
Keywords:
marked-based instruments; Asia; developing countries; taxes; subsidies; emission permits; informational policies; energy production; transport; domestic heatingJEL Codes:
Q01; Q48; Q52; Q53; Q581. Introduction
Air pollution is one of the world’s leading health risks. Each year, more than 6.5 million people globally die prematurely from illnesses caused by breathing polluted air. Those illnesses include lung cancer, heart disease, stroke, acute respiratory infections, and chronic obstructive pulmonary diseases such as bronchitis and emphysema (see [1,2,3]). Since the 1990s, exposure to ambient air pollution has grown in most countries and, by 2016, approximately 95% of the world’s population lived in areas that exceeded the Air Quality Guideline for fine particular matter (PM2.5) of the World Health Organization (WHO) [4]. Some of the greatest increases in exposure to ambient air pollution have occurred in the heavily populated, fastest growing regions, including South Asia and East Asia, which host some of the most polluted cities in the world. As shown in Table 1, the population exposed to pollution levels exceeding the WHO guidelines reaches 100% in many Asian countries. Moreover, the mortality attributable to air pollution in China ranks fourth among the leading causes of death and it accounts for approximately 1.36 million deaths per year [5]. South Asia has the second highest premature mortality, where India is the main contributor with approximately 0.65 million per year [6]. Mortality attributable to air pollution is also high in Southeast Asia. In 2015, for instance, Indonesia (the largest economy in the region) experienced approximately 70,000 premature deaths associated with outdoor air pollution and 140,000 associated with indoor air pollution [7]. Moreover, household air pollution from the use of solid fuels for cooking and heating is ranked 8th among risk factors for premature death, with 2.6 million attributable deaths globally in 2016. In India and China, 43% and 30%, respectively, of the population were exposed to household air pollution from solid fuel burning in 2016 [4].
In many Asian countries, the most important contributor to ambient air pollution is coal burning (including coal burning by industry and power plants and coal burning for residential heating). In China, for instance, coal burning accounted for 40% of population-weighted ambient PM2.5 concentrations in 2013. Household solid fuel combustion, of both coal and biomass, is the next greatest contributor to ambient PM2.5 and was responsible for 19% of the mortality attributable to ambient PM2.5 in China 2013. The largest sectorial contributor is the industrial sector, which accounted for approximately 27% of the mortality attributable to ambient PM2.5, including both coal and non-coal emissions [9]. In India, residential biomass burning is the largest individual contributor to ambient air pollution, accounting for approximately 25% of PM2.5-attributable deaths in 2015. Coal combustion from industrial sources and thermal power plants is the second largest contributor, responsible for 15.5% of the mortality attributable to ambient PM2.5 in 2015 [9].
Poor air quality not only affects the world’s growing cities, but also many rural communities, particularly where households continue to rely on solid biomass for cooking and kerosene for lighting. As shown in Table 1, the access to clean cooking devices varies significantly among Asian countries. In Southeast Asia, for instance, more than 45% of people still lack access to clean cookstoves [7]. In urban areas in Asia, the use of cleaner fuels for cooking such as liquefied petroleum gas (LPG) or kerosene is more common. However, the poorest sections of society are often still dependent on low-grade energy resources. Biomass and solid fuels, such as locally-produced coal, are also used for cooking in urban areas in some Asian countries. Increasing the access and usage of clean cookstoves and fuels is not simple, because most low-income households (both in the urban slums and in the rural areas) find that they are unable to purchase superior fuels such as kerosene or LPG, even if these are available. The poorest households often use the most polluting fuels, while wealthier urban communities have moved to LPG or electricity.
Road transportation also causes emissions of volatile organic compounds, carbon monoxide, and fine particulate matter. Air pollution from transport is rising due to the sharp increase in vehicle use, which has offset efforts to make fuels and vehicles cleaner. Low- and middle-income countries in Asia suffer disproportionately from transport-generated pollution due to the use of old and inefficient diesel vehicles and two-stroke engines and a lack of public and active transport networks [7]. Asia has the largest motorcycle fleet in the world, as motorcycles provide the cheapest mode of individual motorized transportation for the expanding working class. Frequent traffic congestion adds another dimension to urban air pollution, since slower moving traffic emits more pollution than when cars move at freeway speeds, resulting in higher emissions per unit of fuel consumed and per km travelled and higher levels of air pollution.
More than half of global energy-related particulate matter emissions come from the residential sector. The regional picture is heavily skewed towards Asia (China and India, in particular), with 80% of the global total. The PM emissions are mainly due to the incomplete combustion of fuels in households, particularly for cooking (bioenergy), heating (bioenergy and coal), and lighting (kerosene). Biomass burning due to forest fires and agricultural waste burning has also been a major concern in Southeast Asia, where transboundary haze events are associated with large forest and peatland fires. The haze from forest fire has deleterious effects on human health, nature, and material property. The incomplete combustion of forest fires causes smoke containing large amounts of toxic gases and fine particulates, which can be transported over great distances. Exposure to haze air pollution can be substantial, as it involves a large number of people over a large region. Haze can also cause transport disruption and accidents due to reduced visibility, which may result in life and economic losses.
Asia is urbanizing fast and over the next 30 years, another 1.1 billion people are expected to be living in cities. In 2010, there were 12 megacities in Asia and by 2025, 21 of the 37 megacities in the world are expected to be in this region [10]. As China’s growth slows and becomes less energy-intensive, India is expected to assume the role of the prime driver of global energy demand. India hosts over one-sixth of the world’s population today, but accounts for only 6% of global energy use. The scope for a rapid increase of India’s energy consumption is clear and, given the importance of coal, biomass, and oil in India’s current energy mix (44%, 24%, and 23% of total energy demand, respectively), there is a risk that the air quality may worsen. Countries in Southeast Asia vary greatly in terms of power systems used but share a prospect of very strong growth in electricity demand over the next few decades. In fact, the region as a whole is projected to triple its power demand by 2040. Moreover, though natural gas is the dominant fuel in power generation in Southeast Asia today, coal is expected to become the number one source of power by 2020 due to the low-cost coal reserves in the region (especially in Indonesia and Vietnam) (see, e.g., [7]).
The inherent tension between the need to improve air quality while the sheer growth in economic activity pushes for large absolute increases in pollutant emissions has become increasingly problematic in recent years. This has increased the demand for more creative and cost-effective approaches than the usual command-and-control (CAC) regulations, such as environmental laws, standards, regulations, and enforcement mechanisms. CAC regulations have also been criticized on grounds of inefficiency and cost-ineffectiveness, among other things. In contrast, market-based instruments (MBIs) provide firms with more flexibility to find least-cost solutions to pollution reduction, which, in turn, can stimulate technological innovation.
Indeed, MBIs have several attractive attributes. First, they promote flexibility in the search for ways to improve resource use and environmental quality, and they create incentives for minimizing the costs of achieving a specified environmental quality target. Second, they “internalize externalities”—i.e., they force firms and individuals to bear the environmental costs of their activities rather than transferring them to others, and thus, they help to improve the functioning of markets. Third, they foster innovation, creating dynamic pressures to make environmental quality improvements cheaper over time. Fourth, environmental taxes and the creation of tradeable permit markets create opportunities for an additional source of government revenues. Finally, MBIs can improve the ways that people actually make decisions (heuristics) by providing consumers and producers with information about markets and the environmental impacts of their actions.
A large number of MBIs varying in form and degree of sophistication and application have therefore emerged in Asia. Among the East Asian countries, China has adopted the largest number of MBIs to deal with its severe air pollution problems. The country has experimented with pilot programs of provincial cap and trade schemes, introduced pollution taxes, and contributed to the development of solar power production and cleaner vehicles through subsidies. In Mongolia, which has a relatively high dependency on coal sources for electricity production and less access to clean cooking technologies (see Table 1), MBIs are still rarely used in air pollution policies, with the exception of subsidies supported by the World Bank and targeted at improving rural households’ heating equipment.
In Southeast Asia, low- and middle-income countries have mainly implemented two kinds of MBIs: taxes and subsidies. Taxes are applied widely across these countries to reduce pollution from transport and the industrial and energy sector, while subsidies are used to promote switching to cleaner fuels and the development of renewable energies. The use of MBIs is a recent phenomenon that is limited to very few sectors. Government officials and lawmakers are still not fully familiar with the effectiveness of MBIs and still prefer to use CAC measures.
South Asian countries have not developed any general approach to managing the environment using MBIs, primarily because of their historical legacy of using bureaucratic control of the behavior of economic agents. In most cases, they have used certification, licensing, and monitoring to promote compliance. Fines, for example, exist to support CAC measures in all of the countries in South Asia, but have not actually been used in many cases. Like in Southeast Asia, the use of MBIs is only a recent phenomenon limited to few sectors since the government officials and lawmakers are not fully familiar with the effectiveness of MBIs in dealing with environmental management and still prefer using CAC-type measures. Nevertheless, tradable permits to control emissions from industry, taxes on fuels and parking, and subsidies to encourage switching to cleaner fuels and improve cooking stoves have slowly emerged.
In this paper, we review the Asian experience with MBIs intended to reduce air pollution emissions. This paper focuses on experiences in developing countries including China, Mongolia, the Philippines, Vietnam, Lao PDR, Cambodia, Thailand, Indonesia, Malaysia, Bangladesh, Sri Lanka, India, and Nepal. Developed countries such as Japan and Singapore that have had long trajectories and histories of environmental management are beyond the scope of this paper. Moreover, this paper focuses on state-based MBIs that require the steering of local governments, for instance, taxes, subsidies, and the regulation of information, which rely on existing markets to be effective, as well as the creation of property rights and tradable credits in areas like emissions control and resource management. Other market smoothing mechanisms that enhance the performance of markets are briefly discussed are beyond the scope of this paper.
This paper is structured as follows. Section 2 describes the overall experience with MBIs in Asia in three key sectors contributing the most to air pollution problems, namely; (i) energy production and industry, (ii) road transportation, and (iii) domestic cooking and heating. Section 3 compares the overall performance of MBIs in Asia with global experiences in order to identify implementation failures, challenges, and remaining questions regarding the application of market-based instruments in Asia. Finally, Section 4 synthetizes the lessons to be drawn from the use of MBIs to control air pollution in Asia and concludes this paper.
2. Market-Based Instruments to Reduce Air Pollution in Asia
In this section, we review the application of MBIs in three main air pollution policy issues: energy production and industrial pollution, air pollution from transport, and air pollution from domestic heating and cooking. This review is based on a systematic review of the literature that allowed us to identify and screen the current knowledge base in terms of peer-reviewed publications. As shown in Table 2, we have identified four types of MBIs that are commonly used to address these policy issues in Asian countries: (1) tradable permits, (2) taxes, fees, or charges, (3) subsidies, and (4) information provision, labels, and voluntary agreements. For each policy issue, we review the implemented MBIs in some of the countries where it is possible to assess the instruments’ efficacy so far.
Regarding MBIs to tackle air pollution from energy production and industries, China, India, and South Korea are the only Asian countries that have implemented tradable permits schemes so far. Subsidies are considerably more common among Asian countries, while taxes, fees, or charges are been only used in China and the Philippines. For example, feed-in tariff schemes have been applied in several Asian countries in order to promote the development of renewable energy technologies. There are also examples of the removal of environmentally harmful subsidies, such as gasoline subsidies. Information provision, labels, and voluntary agreements are also common types of instruments for controlling air pollution. For example, eco-labelling and information disclosure programs have been implemented, although there is a lack of robust empirical research able to isolate and identify the effects of these programs.
To tackle air pollution from the transport sector, the most commonly applied policy instruments are taxes, fees, and charges. For example, various kinds of vehicle and fuel taxes have been implemented. Subsidies are also used in the Asian context, while tradable permits and information provision, labels, and voluntary agreements have not been used at all in the transport sector.
Finally, air pollution from domestic heating and cooking has mainly been addressed through the use of subsidies for, e.g., energy-efficient stoves or improved insulation to reduce heat loss. However, research evaluating the effects of such subsidies is lacking.
2.1. MBIs to Reduce Emissions from Energy and Industrial Production
Since the 1980s, an increasing number of developing countries in Asia embarked on a course of adopting and improving MBIs in attempts to address environmental problems stemming from energy consumption and industrial production. This section describes these countries’ applications of four broad categories of such policy instruments, including tradable permits, taxes and charges, subsidies, and information provision.
2.1.1. Tradable Permits
The use of tradable permit systems for air pollution control is uncommon in Asian countries. However, we have observed an emergence of tradable permit systems in China, India, and South Korea, which together contributed 36% of the world’s total carbon emissions in 2015.
Since 2011, China has been pushing forward with cap-and-trade for carbon emissions. In October 2011, the Notice on the Implementation of Carbon Trading Pilots promulgated that seven provinces and cities were going to launch carbon trading pilots (e.g., Beijing, Chongqing, Guangdong, Hubei, Shanghai, Shenzhen, and Tianjin). Subsequently in November, the 12th Five Year Plan for Greenhouse Gases Abatement was released. It pledged to “carry out carbon emission trading pilots” and to “develop China’s national carbon market”. Local-level pilots were expected to scale up and evolve into a national carbon trading market. Initial allocations and subsequent transactions of emission permits were performed online through the carbon emission registration e-platform established by each pilot market. Among the seven pilot markets, Guangdong, Shenzhen, and Hubei auctioned off emission permits, whereas other markets allocated permits free of charge as per the grandfathering approach. In the seven pilots altogether, 115 million tons of emission permits had been traded by 30 June 2017 (i.e., approximately 4.5% of the emissions of the companies involved in carbon trading). The Hubei pilot market has been the most active, having sold a total of 40.5 million tons of permits by 30 June 2017.
Quantitative research [11] on the seven pilot markets in China finds that they had different emission reduction achievements. In 2015, Hubei Province reduced carbon emissions by approximately 59.5 million tons in the wake of the pilot market. Shenzhen and Guangdong jointly contributed a reduction of 37.1 million tons of carbon in the same year. Nevertheless, the Tianjin market has yet to induce a significant reduction of carbon emission. Interestingly, sharp increases in trading volume before the compliance period show that companies still treat carbon emission trading as a means of compliance rather than as an investment approach. Because carbon markets are still in an early stage of development, companies’ views of carbon permits will evolve with the development and maturing of the carbon market. Moreover, a fair amount of heterogeneity in prices has been observed among the seven ETS pilots. The overall price from June 2013 to June 2017 was CNY 30 per ton (approximately USD 4.76); the highest prices were found in Beijing and Shenzhen (CNY 50 and CNY 47 per ton, respectively) and the lowest in Chongqing (CNY 20 per ton). The heterogeneity in prices points to the potential gains of cross-provincial trade as a means to reduce the overall costs of achieving CO2 emission reduction targets.
India has implemented two energy certification schemes, the Renewable Energy Certification [12] mechanism implemented in 2011 and the Perform, Achieve and Trade (PAT) for the Enhanced Energy Efficiency Programme in 2012. REC is a national-level policy instrument for promoting renewable power generation through renewable purchase obligations on the energy distributor. This can be in terms of actual purchase of renewable energy power or by way of tradable green certificates where the environmental attributes associated with RE generation are traded separately from energy generation. The renewable energy certificates can be sold and purchased through the energy exchanges. Evidence suggests that REC trading sessions over the period 2011–2012 were encouraging and built up industry support in the REC mechanism. However, the market has yet to attain traction to ensure an optimal market clearing price. This can be attributed to the limited number of players, low transaction volume, and infrequent trading, which has led to a willow market [13].
The PAT scheme is a market-based mechanism aimed to enhance the cost effectiveness of improvements in energy efficiency in energy intensive industries (such as thermal power plants, fertilizer, cement, pulp and paper, textiles, chlor-alkali, iron, steel, and aluminum) through certification of tradable energy savings. The Bureau of Energy Efficiency (BEE) was established as the regulatory institution responsible for energy efficiency improvements. The PAT scheme involves identification of the highest energy consumers within each of the selected sectors, referred to as designated consumers (DCs). (The target for each DC is defined as a percentage reduction from a self-declared baseline submitted by DCs and approved by designated energy auditors [14]. To calculate the percentage reduction, DCs are benchmarked against the best-performing plant within the sector. The best performing plant would receive the lowest target and others will be assigned with proportional values [14].) BEE issues Energy Saving Certificates (ESCerts) to DCs based on reductions in consumption. DCs that do not meet the targets are required to either buy ESCerts to meet targets or pay penalties. The ESCerts are tradable and bankable in a market. The monitoring and verification of claimed energy savings are conducted by accredited designated independent energy auditors. Ex-post evaluations of PAT performance (see, e.g., [15]) suggest, however, that the targets are not strict enough to add energy efficiency activities beyond business-as-usual and that the primary reason behind energy efficiency measures by the DCs appears to be rising energy prices. Thus, these cannot be considered additional as they would have occurred in the absence of the PAT scheme as well. On the positive side, PAT has increased awareness around energy efficiency, and has provided a platform that could help generate the exchange of knowledge that could further lead to the adoption of technologies in the future.
Turning to South Korea, the country’s national emissions trading scheme (KETS) was officially launched in January 2015 in an effort to fulfil the country’s pledge in the Copenhagen Accord, which committed the country to a 30% reduction in carbon emissions by 2020 relative to the business-as-usually (BAU) scenario. The scheme consists of three phases: 2015–2017, 2018–2020, and 2021–2025. In the first phase, over 500 firms in the industrial, energy, transport, building, aviation and waste disposal were enrolled. Participating firms jointly accounted for 68% of the country’s total emissions. KETS is a cap-and-trade scheme that specified a ceiling of approximately 573 million tons of CO2 equivalents (Mt CO2-eq) in 2015. In the first phase, all emission permits were allocated free of charge, and 5% of the permits were reserved for market stabilization measures. In the subsequent two phases, the emission permits were going to be partly auctioned off (3% in the second phase and over 10% in the third phase). Non-compliant firms incur a penalty for excessive emissions at a rate no higher than three times the average price of emission permits in that year or USD 89 per ton of CO2-eq [14].
The first year of the KETS (2015) was regarded “inactive,” as the total trading volume was less than 0.3% of the total emission permits. The average price was approximately 10 USD per ton of CO2-eq, yet varied slightly by type of permits (i.e., emission permits or offset credits) and trading platform [14].
2.1.2. Taxes, Fees, and Charges
China, Thailand, and the Philippines have implemented various types of taxes, fees, and charges to encourage environmentally-friendly actions and curb air pollution associated with energy consumption and industrial production. For example, the Philippine government currently applies various fees and charges based on the quantity of emissions. Following Section 14 of the Clean Air Act, revenues from these charges are deposited into a special account reserved for national initiatives related to air pollution management [16]. Thailand has introduced a tax on gasoline in order to reduce consumption, and uses part of the tax revenues to subsidize ethanol-blended gasoline (gasohol) [17]. However, from a life-cycle point of view, whether fuel ethanol is indeed climate-friendly remains much debated [18,19].
Since the outset of China’s market-oriented reforms (known as the reform and opening-up) in the late 1970s, China has been promoting a pollution charge system according to the polluter pays principle. Since 2003, pollutant charges have been imposed on any amount of emissions. This is widely regarded as a radical and stringent reform because of its lower levy threshold, strengthened enforcement, and strict provisions on the usage of the levied pollution charges. In the meantime, the charge rates have been subject to heated debate. The charge rates for sulfur dioxide (SO2) and nitrogen oxides (NOx) were much lower compared with their respective abatement costs, which has considerably undermined the efficacy of pollution charges [20].
Further, The Environmental Tax Law of the People’s Republic of China, approved by the National People’s Congress in 2016, stipulated that the country’s environmental tax in force since 1 January 2018 would replace pollution charges. The purpose of the new law was to rectify a problem that existed when local environmental bureaus were responsible for collecting pollution charges. Those stakeholders were motivated to shelter corporations from pollution charges, because the corporations are important contributors of tax revenues (see, e.g., [21]). This was widely considered an important reason for the weak enforcement of pollution charges. The newly approved environmental tax solves this problem [22], because now the revenues from the environmental tax go entirely to local governments. This incentivizes increased enforcement.
2.1.3. Subsidies
Many Asian developing countries, e.g., Bangladesh, China, Indonesia, and Thailand, have been harnessing subsidy-related policies to mitigate adverse environmental impacts of energy and industrial sectors. Feed-in tariff schemes and the removal of environmentally harmful subsidies are the most commonly implemented types of policies.
Feed-in tariff schemes have been implemented in several Asian countries to promote the development of renewable energy technologies. For example, Thailand was one of the first Asian countries to implement a feed-in tariff program, with streamlined interconnection regulations and avoided-cost tariffs adopted by the Thai government in 2002 and technology-specific renewable energy premium tariffs in 2006 (see, e.g., [23]). The program is called Adder because it adds additional payments to renewable energy generators on top of the normal prices that power producers receive when selling electricity to power utilities. Adder is implemented through Thailand’s three electric utilities, which purchase electricity from renewable electricity generators. Adder rates are distinguished by technology type, installed capacity, contracted capacity, and project location and are paid for 10 (in the case of wind and solar projects) or seven years (for other renewables) starting once the project begins selling electricity to the grid. The Adder program is financed through a pass-through mechanism to all electric power customers as a component of a quarterly-adjusted automatic fuel price volatility adjustment tariff known as the Ft charge. The Ft charge appears as a line item on all customers’ monthly electricity bills.
Feed-in tariff schemes have also been implemented in Indonesia, the Philippines, Malaysia, India, and China [24]. In Indonesia, feed-in tariffs have been offered for electricity generated by biomass, hydropower, municipal solid waste, and landfill gas since June 2012. The Ministry of Energy and Mineral Resources in Indonesia has also indicated their interest in setting up feed-in tariff schemes for energy generated by solar photovoltaic and wind-farm systems. The Philippines has implemented feed-in tariffs through the Renewable Energy Act, which requires that a feed-in tariff scheme be set up for wind, solar, ocean, hydropower, and biomass energy. Its implementation, however, has suffered significant delays; it was not until July 2012 that the first feed-in tariff rates were confirmed. The Philippines government has issued a document titled Guidelines for the Selection Process of Renewable Energy Projects under the Feed-in Tariff System and the Award of Certificate for Feed-in Tariff Eligibility, which lays down the selection basis for renewable energy projects. In India, feed-in tariffs for wind, solar photovoltaic, solar thermal, wind, biogas, small-scale hydropower, and biomass energy have been offered since 2013. The Indian government has set up power purchase tariffs for solar photovoltaic and solar thermal systems. In Malaysia, electricity distributors are obliged to purchase renewable energy generated by feed-in tariff-approved holders at the feed-in tariff rate for a specified period of time. The scheme is operated by the Sustainable Energy Development Authority (SEDA), which adopts the regularly applied Levelized Cost of Energy (LCOE) metric to ensure that tariffs reflect the true investment and operational cost of the technology used [25]. In 2011, the Notice on Improving the Pricing Policy for Grids’ Purchase of Solar Photovoltaic Power was issued, which ushered in China’s first feed-in tariff policy for solar power. The policy stipulates that the feed-in tariff for grids built before 31 December 2011 will be CNY 1.15 per kWh, whereas the feed-in tariff for grids built afterward will be CNY 1 per kWh. The feed-in tariffs have been altered several times to take into account the geographically uneven distribution of solar resources and the development of the country’s solar power industry [26].
Another example of a subsidy-related policy is the removal of environmentally harmful subsidies. For example, until recently, a large proportion of the Indonesian national budget was dedicated to fuel and electricity subsidies. Since the mid-2000s, the government of Indonesia has introduced subsidy reforms and in November 2014, the government initiated a fuel subsidy reform that started to remove the subsidy on gasoline [27]. It is estimated that fossil fuel subsidy removal could reduce CO2 emissions in 2015 in Indonesia by 5–7% and the reduction is projected to reach almost 9% by 2030.
The reform of the Indian diesel subsidy provides another example. In India, energy sources have historically been subsidized in order to reduce the price of electricity and petroleum products. Diesel is the most consumed petroleum product in the country, accounting for 44% of the total consumption in 2012–2013, which made the diesel subsidy expenditure the highest of all fuel subsidy expenditures [28]. However, the benefits of the diesel subsidy were mainly received by high-income households. Furthermore, with an increasing demand for energy sources, as a result of the increasing population, India’s fuel subsidy expenditure has increased significantly each year [29]. Therefore, over the years, India’s government has formed several committees with the purpose of providing recommendations for pricing policy reforms, all of which have recommended decontrolling of diesel pricing in India and reducing or eliminating subsidies [28]. All the attempts have failed or have been reversed following political opposition. In 2013, it was therefore announced that, rather than removing the whole diesel subsidy directly, the reform would involve a substantial initial price increase for bulk consumers alone (mainly the state-owned railways), and, for all others, small (less than 1 US cent per liter) monthly price increases until the subsidy was eliminated. The purpose of using incremental price increases was to ensure political feasibility and limit economic disruptions. This strategy worked; although there was initial political opposition, it was not strong enough to derail the program. The price increase for bulk consumers resulted in an immediate significant reduction in diesel demand [28], and the elimination of the subsidy for all consumers was gradually achieved within two years.
2.1.4. Information Provision, Labels, and Voluntary Agreements
Information provision, labels, and voluntary agreements are common types of instruments for controlling air pollution. For example, various eco-labelling and information disclosure programs have been implemented in India, China, and Thailand. However, there is a lack of robust empirical research able to isolate and identify the effects of these programs.
One milestone development of China’s environmental disclosure is the enactment of the Green Securities Policy [30] in 2008. The policy requires listed companies in 14 highly polluting industries (These industries are mostly energy and manufacturing sectors that produce thermal power, oil, coal, other minerals, iron and steel, aluminum, other metal products, cement, other building materials, chemicals, pharmaceuticals, textiles, leather products, and other light industrial products.) that trade a shares on the Shanghai Stock Exchange (SSE) and the Shenzhen Stock Exchange (SZSE) to report certain environmental information to the public. The scope of environmental disclosure is generally defined as “important environmental issues likely to have significant impacts on stock prices” and is further specified by three legislative documents: (1) Instructing Opinions on How to Enhance Environmental Protection Monitoring and Management of Listed Companies, (2) Guidelines on Environmental Information Disclosure of Listed Companies on Shanghai Stock Exchange, and (3) A Guide on Listed Companies’ Environmental Information Disclosure. In addition, the Green Securities Policy includes a Green initial public offering (IPO) component, which subjects obligated companies to a mandatory environmental inspection before making their initial public offerings, or before they can qualify for refinancing.
China also implemented the Green Watch Programme in 1999 (see, e.g., [31]). This program rates participating firms’ environmental performance on a five-step scale and disseminates the results to the public. The rating system’s principal criterion is whether a firm successfully restricts the concentration and total amount of pollution in discharge below a number of air pollutant standards.
Both of China’s programs have been found to have achieved some measurable success. For instance, [32] find that firms covered by Green Watch improve their environmental performance more than non-covered firms. Bad performers improve more than good performers, and moderately noncompliant firms improve more than firms that are significantly out of compliance. The reasons for these responses can be that the incentive for improvement that the Green Watch generates is stronger for firms with poor ratings than those with good ratings, and that the abatement costs for moderately noncompliant firms to achieve compliance are lower than for firms that are significantly out of compliance. Regarding the effects of the Green Securities Policy, Wang and Bernell [30] find that the environmental disclosure level by Chinese listed companies in highly polluting industries trading A-shares does not appear to have increased significantly since the launch of the Green Securities Policy in 2008. One possible reason for this is that the environmental disclosure requirements under the Green Securities Policy are legally weak, i.e., they are based on self-reporting, which means that companies choose what to disclose and how to discuss the information. Thus, the information reported seemed very limited, and the quality and consistency of different firms’ environmental disclosure vary greatly.
2.2. MBIs to Reduce Emissions from Transportation
This section outlines market-based approaches intended to tackle air pollution from transport.
2.2.1. Taxes, Fees, and Charges
China has been levying a vehicle purchase tax since 2001 (The Interim Regulation of the People’s Republic of China on Vehicle Purchase Taxes, issued 1 January 2001, stipulated that any individual or organization who obtains “vehicles for self-use by means of purchase, import, self-production, bequest, award or by any other means” [33] will be obliged to pay the vehicle purchase tax. “Vehicles” refers to “automobiles, motorcycles, trolley buses, trailers and agricultural vehicles” [33]). The tax rate is 10% of the taxable price, which is typically the transaction price excluding VAT for a domestically manufactured vehicle or the import value with the addition of the customs duty and the consumption tax for an imported vehicle [33]. Taxpayers are required to “file a tax return within 60 days after the date of purchase” [34]. In order to encourage the use of vehicles with a small engine displacement, China also introduced a reduced tax rate for passenger vehicles with an engine displacement below 1.6 L from 12 January 2009 to 31 December 2009. This regulation was extended due to its efficacy, although there have been swings in the preferential tax rate. As shown in Figure 1, the introduction of the tax reduction policy in 2009 likely constituted a strong stimulation of the passenger vehicle market. The annual sales of passenger vehicles in that year almost doubled from the level in 2008. However, one needs to be cautious in inferring a causal relationship between the observed changes in tax reduction and vehicle sales.
In 2002, the State of Karnataka in India imposed a “Green Tax” on vehicles older than 15 years (since initial registration) to reduce urban air pollution. In 2003, the State of Tamil Nadu imposed a similar tax on vehicles over 15 years of age and on three wheelers older than three years. Maharashtra State has also adopted a similar green tax payable on a five-year basis, and the tax rate ranges from Rs.2000 (USD 28) for two wheelers to Rs.3500 (USD 49) for diesel vehicles [36]. These were primarily designed to curb vehicular air pollution in cities. In 2011, the State of Rajasthan did the same for vehicles older than seven years. Although these are significant initiatives in terms of discouraging the use of older cars and reducing emissions into the air, the tax rates are limited in size. In addition, the overall impacts of these policies are dependent on relative prices and the availability of alternative transportation within their urban areas. None of the major cities in India, except Delhi (in the recent past), have invested heavily in developing alternative public transportation systems, and thus, the green taxes did not have a noticeable impact on air pollution [36].
The Philippine government has been charging for usage of motor vehicles as a means to reduce transport emissions. Under Section 13 of the Clean Air Act, 7.5% of the annual collection of motor vehicle users’ charges will be deposited in a special vehicle pollution control fund as a part of the air quality control action plan. Moreover, taxes have been imposed on leaded gasoline to promote the transition from leaded to unleaded gasoline in an effort to improve air quality. Thanks to this product charge, leaded gasoline was eliminated in Metro Manila by 2000 and nationwide by 2001 [37].
The Thai government sought to phase out the two-stroke engine motorcycle, which produce high-hydrocarbon emissions because of incomplete combustion. Together with more stringent motorcycle standards, differentiation in the excise tax for two-stroke versus four-stroke motorcycles was introduced in 2001. According to this policy, “the excise tax for a two-stroke engine motorcycle became 5 percent while that for a four-stroke engine motorcycle remained at 3 percent” [38]. The policy may have contributed to the phasing out of two-stroke engine motorcycles since 2007. In addition, eco-friendly cars are promoted using a differentiation in excise tax. Hence, the sale of eco-friendly cars that run on gasohol has increased rapidly.
Given the huge number of vehicles in urban areas, big cities in Vietnam have levied taxes on motorcycles based on emission ranking. For example, Ho Chi Minh City has been charging users of motorcycles and similar two-wheeled vehicles (from 700,000 to 23,500,000 Vietnam dong or VND (1 USD = 22,800 VND in early 2018)), light automobiles (from 700,000 to 44,700,000 VND), and heavy automobiles (from 3,300,000 VND to 110,200,000 VND) emission fees. An ex-ante impact assessment suggests a reduction in greenhouse gases of 2.3–7.5%, which equals 3 to 9 million tons of saved CO2 emissions, depending on the rates of emission fee or environmental tax [39]. Moreover, gasoline and oil users are obliged to pay environmental taxes, according to the Law on Environmental Protection Tax. However, the implementation of these environmental taxes has been slow due to ambiguities in the guidelines and poor coordination between the tax collection agencies and the Ministry of Natural Resources and Environment [40]. In 2017, the Vietnamese government proposed an amendment to the law on environmental protection that suggested more than doubling the current tax on gasoline. There were plenty of public debates on the impacts of the tax increase. However, no research evidence on these impacts is available at this moment.
2.2.2. Subsidies
Since 2001, China has been the world’s largest vehicle market in terms of annual sales. The country has initiated several programs intended to promote the development of new energy vehicles (NEVs) in light of the need to address increasingly severe air pollution and potential energy shortages (see Table 3). NEVs refer to battery electric vehicles (BEV), plug-in hybrid electric vehicles (PHEV), and fuel cell electric vehicles (FCEV). Compared with conventional oil-driven vehicles, NEVs are expected to emit less air pollution.
The surge of the industry went hand-in-hand with active legislation. In 2001, the National High-Tech Development Program (863 Program) for Electric Vehicles was launched, laying a solid foundation for the future development of NEVs by financing R&D activities concerning key technologies [35]. The Automobile Industry Development Policy released in 2004 accentuated the importance of developing energy-saving, environmentally-friendly, and sustainable technologies for vehicles. The Measures for Optimizing the Automobile Industrial Structure and Promoting Vehicles Using Clean Energy and Electric Vehicles released in 2005 specified targets for the development of NEVs in China. It was planned that the proportion of electric cars purchased relative to total car purchases was going to reach 5% in 2010 and 50% in 2030.
2.3. MBIs to Reduce Emissions from Domestic Cooking and Heating
The above two sections provide a survey of a diverse array of market-based approaches that help mitigate air pollution in the energy, industrial, and transport sectors in developing regions of Asia. For air pollution from household cooking and heating, however, applications of market-based countermeasures in these regions are mostly confined to subsidies.
Indonesia’s Kerosene to LPG Conversion Program, initiated in 2007 and lasting until 2012, aimed to provide incentives for households to switch from kerosene to LPG. The government subsidized the conversion to LPG by providing free stoves, LPG cylinders, and a first consignment of LPG. The program was limited in terms of scaling up potential. Approximately 40% of households in Indonesia still rely on biomass fuel for cooking, and the conversion program mainly targeted kerosene users. Spillover to biomass users was observed, but the scale was trivial [42]. Moreover, LPG is unaffordable for many households in an archipelago country like Indonesia. Despite these limitations, the program managed to provide LPG as a main cooking fuel to 27 million households in 2010, approximately five times as many as in 2007.
The Indonesia Domestic Biogas Program (IDBP), which was launched in 2009 and had led to the building of 11,250 biogas digesters by 2013, aimed at improving waste management, reducing GHG emission in the livestock and dairy sector, and reducing indoor air pollution from firewood-based cooking. The program provided a flat amount of US$220 per digester, while the household paid 60–80% of the investment cost. Using a difference-in-difference method, [43] estimated that the likelihood of reporting good air quality in the kitchen is 21–24 percentage points higher for the biogas digester user group than for the control groups, showing a clear improvement in indoor air quality. However, there is no clear evidence that owning a digester improves any health outcomes of household members.
At the Mongolian household level, air pollution in Ulaanbaatar is largely caused by families living in yurts (traditional Mongolian tents, locally known as ger), who mostly rely on coal and fuelwood for heating. As part of the Clean Air Project in Mongolia, in 2009, the U.S. Government’s Millennium Challenge Account (MCA) implemented the ger stoves program providing a subsidy that covered 90% of the market price of ger stoves, making them generally affordable. For instance, a subsidized household had to pay only US$20 for the cheapest model of energy-efficient stove, or approximately one-tenth of the market price. As a follow-up to the ger stoves program, the Ulaanbaatar Clean Air Project funded by the World Bank extended the ger stove subsidy program. The World Bank and the Mongolian government each contributed 50% of the budget. Moreover, blanket-like insulation layers for gers were designed by the United Nations Development Program and produced locally in Mongolia. This type of insulation helps reduce heat loss and, thereby, result in a 50% reduction in fuel consumption. Mongolian households were also provided a subsidy of 5 million MNT (US$3,500) by the Building Energy Efficiency Project (BEEP) to build energy-efficient dwellings. The program was complemented with long-term mortgage loans [44].
Despite its promising potential and abundance, renewable energy remains relatively expensive compared with traditional fuel. Mongolia successfully implemented its “100,000 solar homes” program in 2004–2008, targeting rural nomadic households that did not have access to electricity at all. As a pilot program, the National Renewable Energy Centre (NREC) and the Municipality Air Quality Office (MAQO) helped 21 ger households in five districts of the city to install solar panels in the beginning of the heating season of 2011. According to interviews conducted with 15 households that installed a solar heater, the overall cost of the system was considered unaffordable without subsidies. In the NREC program, the cost of a typical solar heater for a 50–60 m2 ger was 7.5 million MNT (US$5350). This was comparatively expensive for households and would require 8–10 years to recover the cost through energy savings. The NREC program provided households with a considerable subsidy that covered 70% of the system’s total cost. Also, the government reduces night electricity tariffs by 50% for households who installed the renewable energy systems. In an additional pilot project, ger households were provided with discount vouchers by the Clean Air Foundation to be used for cleaner fossil fuel purchases, which continue to be less competitive in terms of price, despite strong governmental efforts.
The Vietnam Biogas Program was founded in 2003 by SNV (the Netherlands) and the Vietnam Ministry of Agricultural and Rural Development. By 2017, the program had constructed 158,500 domestic biogas digesters, providing clean cooking fuel for more than 790,000 rural households across 55 provinces of Vietnam. While assessments of various benefits of the program are available [12], impacts of health benefits from switching from fuelwood or charcoal to biogas in cooking have not been estimated.
Cambodia, Laos PDR, and Vietnam have implemented improved cookstove programs with the aims of increasing efficiency in using biomass fuel for cooking, reducing indoor health pollution, saving cooking costs, and reducing GHG emissions. Improved cookstoves have been distributed to 3.6 million households in Cambodia, more than 100,000 in Laos PDR, and approximately 45,000 in Vietnam [45,46], often through subsidy-based and NGO-driven approaches. Subsidy was used mainly for designing, training, awareness-raising campaigns, and demonstration. These programs plan to gain revenues from carbon finance.
Turning to India, the Pradhan Mantri Ujjwala Yojana (PMUY, or Rural Cooking Gas Connection) scheme was launched in 2016. It provides subsidies for women below the poverty line to obtain LPG (liquefied petroleum gas) connections. The subsidy rate is Rs.1600 (USD 23) per connection, or approximately half of the full price. This ambitious scheme had a massive budget of Rs.800 billion (USD 12 billion) over a 3-year period (2016–2018). The scheme initially aimed to distribute 50 million LPG connections, and has recently expanded its scope to 80 million households. It had distributed over 30 million connections by 2017 [47].
3. Performance of MBIs in Asia
Energy and industry: Regarding MBIs targeting emissions from energy production and industry directly, tradable permit schemes are in place to control CO2 and SO2 emissions in China, while taxes have been used to control NOX and SO2 emissions. Regarding CO2 emissions, as described above, in 2011, China designated seven provinces and cities as regional pilot projects in carbon emission trading. The evidence so far points to low volumes of emission trading, showing that the markets are not liquid enough yet and that expansion of the coverage of these programs to non-energy-intensive sectors and cross-provincial trade could lead to large increases in the cost effectiveness of this instrument. Indeed, international experience with trading markets has shown that the number of participants included in a trading program is a key factor affecting the efficiency of the program (see, e.g., [48]). Under the current design, the emission trading program in China covers only energy-intensive sectors. However, for Beijing, Shanghai, and Shenzhen, where energy-intensive sectors account for a low share, it is difficult to see an active market with limited coverage, particularly when trading across provinces is not allowed. If environmental damages do not depend on localization of emissions (as in the case of CO2 emissions) and monitoring costs are not disproportionate, trading programs should include as many sources as possible. First, with a larger number of participants, the differences in abatement costs increases among firms, which hence increases the benefits of trading. Second, the risk of market power in the permit market is reduced with a larger number of participants. Flexibility also allows for a broader set of compliance alternatives to be considered in terms of timing and spatial coverage. If the Chinese authorities do not work out the current weaknesses in design, the success of the trading program will remain quite limited. Obvious additional recommendations to improve the performance of this instrument are to reduce transaction costs by improving the data system and public access to data. International evidence has also shown that a lack of requirements from the government to approve transactions makes trading easier and keeps transaction costs relatively low [49]. Furthermore, it is important that the government provides clear rules well in advance of the first compliance period, hence providing participants with certainty and increasing their ability to make plans [48].
The performance of the Perform, Achieve and Trade (PAT) scheme in India indicates that the targets are not strict enough to be additional; this can be compared to the first phase of the European Union Emissions Trading Scheme EU ETS, which resulted in significant overallocation of CO2 allowances. This was primarily due to the lack of emissions data and setting of low emission caps. Over-allocation of allowances caused the price of allowances to fall to zero. However, once having obtained better information regarding the emission reduction potential during Phase 1, tighter caps were established under Phase 2. Despite limited trading, Phase 1 succeeded in setting up the infrastructure for trading, monitoring, reporting, and verification. Thus, a clear recommendation is to increase the stringency of PAT targets, which should take into account the impacts of rising energy prices on energy efficiency measures. The targets must be re-evaluated periodically to account for measures that are only implemented above and beyond the business-as-usual scenarios. This is essential in order to prevent over allocation of the certificates and to ensure that trading of certificates does occur.
The basic reason why cap-and-trade programs have not achieved much appears to be that governments are unwilling to take the risk of high prices, so they set loose caps. As a result, the level of environmental ambition is low, often with zero prices, so that the cap-and-trade program has no environmental effects. In order to avoid low and volatile allowance prices in the future, the literature suggests solutions such as combining the emission cap with a price collar that can provide both upper and lower bounds on allowance prices [50]. The idea is that the price ceiling thus imposed will insure governments against a price spike and thus embolden them to be more ambitious about pollution reduction. But this begs the question of why it then makes sense to use a complicated cap-and-trade scheme rather than a tax, to begin with.
Taxes, charges, and subsidy cuts typically deliver better environmental outcomes, which may likely stem from their potential to incentivize enforcement actions. In many developing countries, environmental regulations can only be weakly or selectively enforced due to interventions of vested interests, as enforcing environmental regulations usually depletes the tax base (such as industrial profits) of local governments. A pollution tax or charge would rectify this drawback to some extent, since financial benefits would then accrue to government bodies from enforcing a pollution charge or tax. This reasoning remains valid for other types of environmentally-related market-based policies. For example, China’s pilot carbon markets functioned better in Hubei, Guangdong, and Shenzhen, where emission permits were allowed to be auctioned by authorities. In contrast, other pilots mostly allocate carbon emission permits free of charge. This has perhaps undermined authorities’ motivation to adopt more restrictive emissions ceilings, which may be responsible for the limited achievements of the country’s continuing efforts in carbon emissions trading. A major advantage of fuel taxes is that they can be collected at just a few points and require no new administrative machinery. Where pollution monitoring and enforcement capability is weak, taxes can be quite effective in reducing pollution.
Within the energy and industrial sectors, feed-in tariffs have been used in several Asian countries, e.g., China, India, Indonesia, Malaysia, Mongolia, and the Philippines, to promote the development of renewable energy. In most countries, the introduction of dedicated agencies to coordinate installations and the roll-out of feed-in tariffs have led to a significant and prompt growth in the corresponding technologies. In China, the total energy supply from renewable energy grew approximately 12% from the year 2000 to 2010, substituting 293 million tons of coal equivalents by the end of that period [51]. Studies reviewing the implementation of feed-in tariffs in Asia have found that the design of feed-in tariffs differs across countries, which explains the differences in success. For instance, feed-in tariffs in Thailand and Malaysia are deemed as successful, while in countries such as the Philippines and Indonesia, the policy has been less effective because it is heavily dependent on the political scenario in the respective country, which has created uncertainties for potential investors. In addition, investors cannot estimate their profits due to the lack of important criteria such as rates, periods of payment, and decreases in the feed-in tariffs over time (degression rate). The overall evidence indicates, however, that feed-in tariffs in Asian countries have been set high enough to attract private investment in diverse forms of renewable energy and that the programs have been able to induce an impressive amount of investments in renewable energy. Nevertheless, the programs could benefit from stronger regulatory frameworks and it would also be relevant to evaluate whether the feed-in tariffs are set at a socially optimal level. In particular, the lack of a program cap in combination with a deadline has resulted in a greater than expected number of applications, raising concerns about the costs of this policy. Reaction to this concern has resulted in more red tape and a bottleneck for application processing, which has slowed down market expansion. It is important to consider the fact that feed-in tariff schemes (at the household level) mainly tend to benefit individuals with higher incomes, whereas lower-income individuals tend to be excluded from the schemes.
One lesson that can be drawn from our evidence base is that fixed-rate uniform subsidies often feature low cost effectiveness. The fixed rate uniform feed-in tariff guarantees a predetermined uniform price that all suppliers receive for the energy they generate, and there is no price competition in the system. It is not easy to set the subsidy rates at the right levels, as the actual cost of renewable energy production is usually withheld by producers as private information.
In OECD countries, environmental information on and transparency of products and production processes, especially in the form of third-party logos, labels, standards, and product information, are increasingly governing the sustainability of value chains. In China, this kind of informational governance of value chains is only present in export chains or chains led by multinational companies and rarely in value chains where production and consumption are largely limited to the domestic market and developing countries. Even with respect to value chains that commonly raise citizen-consumer concerns, such as food products, informational governance in domestic value chains is largely absent. This is partly a result of limited consumer requests for environmental labels and the large distrust of Chinese consumers in national environmental labelling and information systems [52]. Informational policies that collect and disseminate information about firms’ environmental performance have also been used to incentivize reductions of pollution from the energy and industrial sectors but have not yet been implemented in other sectors. These programs have been touted as a means of circumventing perhaps the most daunting obstacle to pollution control in developing countries: weak environmental regulatory institutions and rampant non-compliance with mandatory regulations. Evidence suggests that informational policies, such as the Green Watch Program in China, drove significant reductions in pollution among dirty firms, but not among cleaner ones. This result conforms to evaluations of similar disclosure programs to control water pollution in Asia, such as PROPER in Indonesia and India’s Green Rating Project. Moreover, evidence from the Green Securities Policy indicates that voluntary approaches might not work if the regulatory and non-regulatory pressures for improved environmental performance are weak.
Transport: ERIA [53] estimated the effects of subsidy removal in Malaysia, Indonesia, Thailand, China, and India (five countries that are currently embarking on energy reforms by removing energy subsidies). In line with the international evidence, their findings suggest that the effects of subsidy removal will depend on country-specific characteristics, but that it will have an overall positive effect. For instance, removing petroleum or gas subsidies (or both) in Malaysia will improve economic efficiency and increase real GDP by up to almost 1% in the short term. The immediate impact will be, however, that the budget deficit will be greatly reduced after removing the government-funded petroleum subsidy. For Thailand, the removal of fossil fuel subsidies, with reallocation to households and the government budget, is projected to have a small impact on the country’s GDP in the short term. Accordingly, policymakers do not need to be concerned when deciding whether to implement the reforms. For India, the government wants to remove subsidies for LPG, as LPG is used as the primary cooking fuel by urban and rural households, as well as commercial establishments. However, the LPG subsidy seems to benefit the rich more than the poor, as most of the subsidy share goes to benefiting urban dwellers (69% share of the LPG subsidy). The study’s findings suggest that a removal of the LPG subsidy would have little impact on the rate of economic growth. Thus, this supports the removal of the energy subsidy if the government wishes to pursue it. Finally, for China, the country’s total energy subsidies in 2010 accounted for 4.7% of GDP. The coal subsidy was the highest, accounting for approximately 2% of total GDP, followed by the electricity subsidy, which accounted for 0.73% of total GDP. The study suggests that removing energy subsidies in China’s iron and steel industry will induce costs and thus require technological innovation for higher energy efficiency through aggressive policy support. However, the study expects the overall effects of subsidy removal to be positive as it will correct negative environmental externalities and improve social welfare in China.
Comprehensive pricing to manage transport demand is also technically feasible, but difficulties in securing the high level of community support it requires have prevented its implementation. For instance, road pricing has rarely been used as an instrument to reduce vehicle usage in Asia. The cities of Dubai and Tehran have introduced limited versions of congestion pricing, while in Singapore (the most prominent Asian example in this regard), the electronic road pricing scheme has reduced congestion and the traffic has become better spread out during the day. Moreover, the decrease in peak-hour traffic volumes and the increased use of public transportation have contributed to vehicle emission reductions and improved air quality [54]. One feature of Singapore’s road pricing scheme that has contributed to its success is that the management of the scheme was merged into one authority, which enabled the integrated design of public transportation, road demand management, land use, and highway improvements. It has also enabled a combined development of long-term transportation strategies and provided a more rapid decision-making process. A gradual implementation of policies has contributed to maintaining public support and enabling the possibility of adjusting and learning from the implemented policies. Furthermore, it has been important to ensure that people understand how the system works and to make it easy to use, which Singapore solved by engaging the public throughout the whole planning phase and making information about the scheme easily available.
Domestic Cooking and Heating: Regarding policies to control household pollution, the most common sources of household air pollution in developed countries are wood and coal combustion in heating stoves, small boilers, and open fireplaces. The combustion is often inefficient and emission controls lacking, which results in health-damaging levels of household air pollution [55]. To reduce household air pollution, policymakers have provided various incentives to encourage fuel switching and improvements of combustion technology. Other measures have included educational campaigns and labelling of approved stoves, boilers, and fireplaces [55].
Evidence has shown that the level of and volatility in fuel prices across countries need to be considered when implementing policy instruments to control indoor air pollution. For instance, if electricity prices are high or volatile, people may be reluctant to switch from solid fuels to electricity, as the costs for cooking and heating then may rise. Furthermore, in areas where electricity access is poor and unreliable, a switch from wood or coal burning to electrical heating may not even be feasible [56]. There are also potential fairness concerns that need to be considered to ensure public acceptance. Even with financial help, such as a subsidy, the poorest households may still not be able to afford fuel switching or improvements of their combustion appliance. Hence, the subsidy may only be useful for middle- and high-income households, which may be perceived as unfair. Even if policies for fuel switching are designed to ensure that the poorest households have access to the subsidies, it is difficult to prevent them from selling it to others rather than using it themselves [57]. However, there are also examples where subsidy leakages have been reduced. In India, for example, a major policy change in the fuel subsidy administration has enabled direct bank transfers to verified beneficiaries, rather than subsidy payments to the retailers. Estimates indicate that this policy change has reduced subsidy leakages significantly [58].
In the case of Asia, the Mongolian and Nepalese experiences with improved cooking systems to reduce carbon emissions and improve indoor air pollution using capital subsidies for adoption and Bangladesh’s experiment with promoting biogas in rural areas indicate that for poor and small-sized households, the availability of technology is not enough. It would be instrumental to lend additional support to suppliers of the aforementioned environmentally-friendly houses, stoves, insulation materials, solar panels, clean fuels, etc., via facilitated loans, tax exemptions, and assistance in marketing and capacity-building as a means to accelerate technological innovations toward reduced costs. In addition, these programs need to be expanded and extended so as to enhance the achievements and cost savings. Also, more attention needs to be drawn to the popularization of “energy saving habits” among ger households [59]. Last, but not least, a major concern is whether these programs would be viable in the long run due to the lack of sustainable funding sources (as they critically rely on heavy subsidies from the government and donors).
Factors Affecting the Overall Performance of MBIs in Asian Countries. Strong regulatory and enforcement mechanisms and strong institutions are required for MBIs to function effectively. Otherwise, MBIs may not provide sufficient incentives to ensure a high degree of compliance. The enforcement of MBIs depends not only on the technical ability to detect violations, but also on the legal ability to deal with them once detected, including the implementation of effective sanctions. In some countries, detected violators are not always sanctioned. There are several reasons for this, ranging from weak institutions to enforce sanctions due to lack of resources, corruption, or simply long, tedious, and costly legal procedures.
Political acceptance also affects the implementation of MBIs. When an MBI is introduced (or a fuel subsidy is reduced), the stakeholders range from powerful interests (such as oil producers) to poor taxi drivers. The public’s perception of the fairness of a policy, including its effect on income distribution, is important to its political acceptance. An additional concern involves competitiveness and unemployment. For instance, environmental taxes often increase domestic production costs and consequently lead to reduced competitiveness of exports and increased competitiveness of imports. In the short run, job losses and other national adjustments can be expected.
Therefore, policy makers must thus consider the impact of MBIs on sensitive groups such as low-income households or pollution-intensive, trade-exposed businesses. Lower tax rates or exemptions are sometimes put into place to limit impacts on such groups. An alternative is recycling the revenues to those who are most affected. For instance, environmental tax revenues can be used to reduce labor taxes or subsidize public transit (since the poorest people are less likely to own cars). Shifting the tax burden from labor to environmental objectives may contribute to an increase in employment, investment gains, and a more efficient economy, along with an environmental improvement, which could counterbalance the competitiveness and equity issues and increase the political acceptance of environmental taxes.
Political acceptance has also been found to be strengthened when there is a public understanding of the environmental problem and its impacts through, for instance, information campaigns and when the taxes are implemented gradually. Environmental taxes also encourage consumers to shift consumption to less environmentally damaging alternatives, which, in turn, encourage firms to shift towards more environmentally-friendly production technologies.
There is no doubt that, despite their theoretical advantages, MBIs have been used far less frequently than command-and-control policies in Asian countries. Perhaps one of the most significant barriers that have prevented the implementation of MBIs in the past was finding a political process that favored the introduction of market regulations in environmental management. However, the political process has gradually become more receptive to MBIs over the last decade. Currently, many donors and advisors are promoting the use of MBIs as the key to more effective environmental protection in economies in transition and developing countries. However, financial and institutional constraints have turned out to be main barriers, which may make the use of this environmental policy more problematic than in developed countries. Indeed, according to [60], the lack of use of economic instruments in Asia is due mainly to institutional deficiencies and only rarely to technical constraints. Many agencies have been reluctant to propose more sophisticated market-based instruments such as tradable permits in the belief that they are too complex to administer. Less complex instruments, such as emission charges, are often structured only to achieve regulatory levels, thus failing to provide incentives for continuous improvement. Incentives such as tax and tariff waivers for the implementation of cleaner production are opposed by financial agencies, which are loath to forego any source of revenue. Government policy should tackle these constraints in a systematic manner, progressing from simple to more complex policy instruments as the agencies gain greater experience. As shown in this review article, many Asian countries have, however, begun to make more use of economic instruments, although often still in combination with command-and-control regulations.
Environmental regulatory frameworks undoubtedly vary widely within the region, which might affect the feasibility of implementing MBIs in some countries. A few Asian countries, such as Japan and Singapore, have a strong environmental regulatory infrastructure. However, other countries lack even the rudiments of an operational national environmental regulatory framework, while many are in the middle of this continuum. Basic environmental laws are unevenly enforced, and weak and under-resourced institutions generate inefficient policies that make achieving environmental goals costly. Whatever the level of a country’s environmental performance goals is, when environmental policy is unevenly and inconsistently applied, unclear and uncertain messages concerning performance expectations arise, causing higher levels of malfeasance and erosion of benefits for leading firms. An important first step to influencing basic economic decision making, therefore, is a national environmental regulatory system that provides clear performance expectations that are consistently enforced. Local agencies have their own agendas and priorities that are not necessarily in line with those of corresponding national agencies, and large employers are often sheltered from regulatory demand by local authorities due to their significant contributions to local employment and tax revenues. Also, there is a need to focus more attention on enforcement issues, because enforcements remain weak due to legal, institutional, and capacity limitations. Challenges in this area include, in particular, reducing overlapping authorities, training core staff, raising awareness of the regulated communities, attracting and allocating necessary funds, and, most importantly, reducing opportunities for corruption.
4. Conclusions and Lessons Learned
From the review of Asian experiences with MBIs to control air pollution, we learn that there are strong reasons to believe that Asian countries can benefit from the additional flexibility that MBIs confer over more inflexible regulations. In addition to the usual advantages of MBIs, taxes can be levied at a few concentrated points in the production change, e.g., at petroleum refineries or coal mines, and yet strongly influence fuel consumption and pollution throughout the economy. In many countries in developing Asia that lack a strong regulatory apparatus, taxes can help mitigate pollution that would otherwise go unchecked. The same is even more true for reductions in subsidies to polluting fuels, since the quantity response tends to be greater when prices are low. The major obstacle to the use of taxes and other MBIs is that they make the costs of pollution control transparent and thus easily evoke political opposition. For this reason, the use of revenues from MBIs should be seen to be fair and equitable, especially if their use involves abrupt changes in prices. Hybrid instruments and the appropriate use of revenue can make the use of MBIs feasible.
The experience with MBIs has also shown that cap-and-trade or tradeable permit schemes are much less likely to be environmentally effective in a variety of circumstances than taxes or fees (from which revenues may be recycled). There are two major reasons for the vulnerability of cap-and-trade schemes. The first is that, unlike taxes, they do not complement other instruments; they substitute for them. Thus, as noted in the last IPCC assessment report [61], they tend to become irrelevant when more than one level of government or agency is involved in regulation, and coordination between them is imperfect. The second is that while they provide certainty about the quantity of pollution, they leave the price of pollution control to the market. When policymakers are unwilling to risk high costs of pollution control, as is commonly the case, they tend to set loose caps, thus reducing the environmental effect of regulation.
All in all, studies on taxes, charges, and subsidy cuts in Asia have found corroborating evidence of their environmental efficacy. This finding suggests that polluters in these countries are highly responsive to price signals. In fact, this tendency can be consistently discerned from other types of instruments. For instance, subsidies to renewable energy are mostly found to be able to induce the sector’s rapid expansion. Furthermore, the Asian experiences with MBIs compare quite favorably with all of the early U.S. and European MBIs that, in spite of being launched long before the Asian MBIs, have roughly the same number and type of flaws related to the design and implementation of the schemes, such as over-allocation and lack of development of markets for trading of emission permits, tax rates that are too low, and generous subsidies to renewables that have been proven financially unsustainable a few years after their implementation. Thus, one might say that Asian countries are very capable of implementing MBIs, even if much work remains before the design is really satisfactory. Considering the urgency of improving the environment in many of these countries, it is important to use the whole range of potential instruments.
Additionally, experimentation with MBIs would be advisable to reduce emissions from transportation. Taking a cue from the case of fuel price hikes (due to a global rise in the prices of petroleum products), it can be seen that vehicle owners did switch to alternative fuels. This means that if prices of polluting fuels are raised using taxes, the transport sector will gradually become cleaner. Since a major cause of air pollution in cities in Asia is vehicular air pollution, it is urgent that the transport sector become cleaner, which requires that incentives are properly placed.
The aforementioned cases show that policy reforms are possible, even the removal of harmful subsidies when, e.g., a well-designed communication strategy emphasizes the benefits of subsidy removal on fiscal stability and the introduction of complementary measures mitigates the effects of reforms on the poor, facilitating the political economy of the reforms. Similarly, the case of Singapore shows how to succeed in implementing and maintaining a congestion pricing scheme. Regarding the low levels of existing environmental taxes, the refunding of emissions taxes could also help to increase the relative stringency of existing taxes and increase the extent of the incentives to technological development.
Finally, when writing this paper, it became clear that there is a systematic lack of evaluation of MBIs in place in Asia. Learning more about the performance of existing instruments and the factors that have facilitated or prevented their implementation can help to correct and improve their design. Governments in the region could develop platforms that inform the design of these market-based incentives through the promotion of learning and knowledge sharing. This can be done by undertaking appropriate special cross-country studies. Governments can also act as a platform for knowledge and encourage better practices through seminars, symposia, and other forums. Important aspects where more in-depth knowledge is needed include the actual effects of implementation of MBIs on environmental protection and political economy considerations in designing market-based mechanisms that can facilitate their implementation. The possible impact of these approaches in reducing governments’ fiscal burdens could also be the subject of future inquiries.
Author Contributions
Conceptualization, J.C. and G.K.; Data curation, J.C. and J.X.; Formal analysis, J.C.; Investigation, J.C. and J.X.; Project administration, G.K.; Writing—original draft, J.C.; Writing—review & editing, G.K. and J.X.
Funding
Asian Development Bank: TA-9093 “Scaling up private sector participation and use of market-based approaches for environmental management”.
Acknowledgments
This paper benefitted from input by colleagues at the Environment for Development Initiative (EfD) in China, Vietnam and India. We are particularly grateful to Zhaoyang Liu, Eswaran Somanathan, Pham Khanh Nam, Enamul Haque, Lina Trosvik, Leonard Le Roux and Jimmy Karlsson for valuable inputs, discussions and comments.
Conflicts of Interest
The authors declare no conflict of interest.
References
- WHO. Global Urban Ambient Air Pollution Database. 2016. Available online: http://www.who.int/airpollution/data/cities/en/ (accessed on 28 February 2018).
- Demographia. World Urban Areas—13th Annual Edition: 2017:04. 2017. Available online: https://web.archive.org/web/20170517065701/http://www.demographia.com/db-worldua.pdf (accessed on 28 February 2018).
- World Bank. World Bank Country and Lending Groups (Updated June 2017). 2018. Available online: https://datahelpdesk.worldbank.org/knowledgebase/articles/906519-world-bank-country-and-lending-groups (accessed on 28 February 2018).
- Health Effects Institute. State of Global Air 2018; Special Report; Health Effects Institute: Boston, MA, USA, 2018. [Google Scholar]
- Yang, G.; Wang, Y.; Zeng, Y.; Gao, G.F.; Liang, X.; Zhou, M.; Wan, X.; Yu, S.; Jiang, Y.; Naghavi, M.; et al. Rapid health transition in China, 1990–2010: Findings from the Global Burden of Disease Study 2010. Lancet 2013, 381, 1987–2015. [Google Scholar] [CrossRef]
- Lelieveld, J.; Evans, J.S.; Fnais, M.; Giannadaki, D.; Pozzer, A. The contribution of outdoor air pollution sources to premature mortality on a global scale. Nature 2015, 525, 367. [Google Scholar] [CrossRef]
- OECD/IEA. Energy and Air Pollution: World Energy Outlook Special Report 2016; International Energy Agency: Paris, France, 2016. [Google Scholar]
- GBD MAPS Working Group. Summary for Policy Makers. Burden of Disease Attributable to Major Air Pollution Sources in India; Special Report 21; Health Effects Institute: Boston, MA, USA, 2018. [Google Scholar]
- World Development Indicators. 2017. Available online: https://databank.worldbank.org/reports.aspx?source=world-development-indicators# (accessed on 20 February 2018).
- Asian Development Bank (ADB). Competitive Cities in the 21st Century: Cluster-Based Local Economic Development. 2011. Available online: http://hdl.handle.net/11540/118 (accessed on 20 February 2018).
- Chen, X.; Xu, J. Carbon Trading Scheme in the People’s Republic of China: Evaluating the Performance of Seven Pilot Projects. Asian Dev. Rev. 2018, 35, 131–152. [Google Scholar] [CrossRef]
- Sajor, E.E.; Resurreccion, B.P.; Rakshit, S.K. Bio-Innovation and Poverty Alleviation: Case Studies from Asia; SAGE Publications: New Delhi, India, 2014. [Google Scholar]
- Kumar, R.; Agarwala, A. A sustainable energy efficiency solution in power plant by implementation of perform, achieve and trade (PAT) mechanism. Open J. Energy Effic. 2013, 2, 154. [Google Scholar] [CrossRef]
- Bhandari, D.; Shrimali, G. The perform, achieve and trade scheme in India: An effectiveness analysis. Renew. Sustain. Energy Rev. 2018, 81, 1286–1295. [Google Scholar] [CrossRef]
- Suk, S.; Lee, S.Y.; Jeong, Y.S. The Korean emissions trading scheme: Business perspectives on the early years of operations. Clim. Policy 2017, 18, 715–728. [Google Scholar] [CrossRef]
- Anderson, R.C. Incentive-Based Policies for Environmental Management in Developing Countries; Resources for the Future: Washington, DC, USA, 2002. [Google Scholar]
- Kumar, S.; Shrestha, P.; Salam, P.A. A review of biofuel policies in the major biofuel producing countries of ASEAN: Production, targets, policy drivers and impacts. Renew. Sustain. Energy Rev. 2013, 26, 822–836. [Google Scholar] [CrossRef]
- Nguyen, T.L.T.; Gheewala, S.H.; Garivait, S. Fossil energy savings and GHG mitigation potentials of ethanol as a gasoline substitute in Thailand. Energy Policy 2007, 35, 5195–5205. [Google Scholar] [CrossRef]
- Prapaspongsa, T.; Gheewala, S.H. Risks of indirect land use impacts and greenhouse gas consequences: An assessment of Thailand’s bioethanol policy. J. Clean. Prod. 2016, 134, 563–573. [Google Scholar] [CrossRef]
- Wang, H. Pollution regulation and abatement efforts: Evidence from China. Ecol. Econ. 2002, 41, 85–94. [Google Scholar] [CrossRef]
- Dasgupta, S.; Laplante, B.; Mamingi, N.; Wang, H. Inspections, pollution prices, and environmental performance: Evidence from China. Ecol. Econ. 2001, 36, 487–498. [Google Scholar] [CrossRef]
- Ge, C.; Long, F.; Ren, Y.J.; Yang, Q.J. Analysis on the environmental protection tax law based on the concept of green development. Environ. Prot. 2017, 45, 14–18. (In Chinese) [Google Scholar] [CrossRef]
- Tongsopit, S.; Greacen, C. An assessment of Thailand’s feed-in tariff program. Renew. Energy 2013, 60, 439–445. [Google Scholar] [CrossRef]
- Huenteler, J. International support for feed-in tariffs in developing countries—A review and analysis of proposed mechanisms. Renew. Sustain. Energy Rev. 2014, 39, 857–873. [Google Scholar] [CrossRef]
- Wong, S.L.; Ngadi, N.; Abdullah, T.A.T.; Inuwa, I.M. Recent advances of feed-in tariff in Malaysia. Renew. Sustain. Energy Rev. 2015, 41, 42–52. [Google Scholar] [CrossRef]
- Winston & Strawn. Feed-in Tariff Handbook for Asian Renewable Energy Systems. 2014. Available online: https://www.winston.com/images/content/9/1/v2/91697/Feed-In-Tariff-Handbook-for-Asian-Renewable-Energy-Systems.pdf (accessed on 25 February 2018).
- Asian Development Bank (ADB). Fossil Fuel Subsidies in Indonesia: Trends, Impacts, and Reforms; Asian Development Bank: Mandaluyong City, Philippines, 2015. [Google Scholar]
- Clarke, K. Diesel subsidy reform in India: Lessons learned. In Global Subsidies Initiative and International Institute for Sustainable Development Report; IISD: Winnipeg, MB, Canada, 2015. [Google Scholar]
- Acharya, R.H.; Sadath, A.C. Implications of energy subsidy reform in India. Energy Policy 2017, 102, 453–462. [Google Scholar] [CrossRef]
- Wang, H.; Bernell, D. Environmental disclosure in China: An examination of the Green Securities Policy. J. Environ. Dev. 2013, 22, 339–369. [Google Scholar] [CrossRef]
- Wang, H.; Bi, J.; Wheeler, D.; Wang, J.; Cao, D.; Lu, G.; Wang, Y. Environmental performance rating and disclosure: China’s Green Watch program. J. Environ. Manag. 2004, 71, 123–133. [Google Scholar] [CrossRef]
- Jin, Y.; Wheeler, D.; Wang, H. Environmental Performance Rating and Disclosure: An Empirical Investigation of China’s Green Watch Program; The World Bank: Washington, DC, USA, 2010. [Google Scholar]
- State Council. Interim Regulation of the People’s Republic of China on Vehicle Purchase Taxes (In Chinese). 2000. Available online: http://www.gov.cn/banshi/2005-08/19/content_24868.htm (accessed on 5 March 2018).
- State Administration of Taxation. Measures for the Administration of the Collection of Vehicle Purchase Tax (In Chinese). 2014. Available online: http://www.chinatax.gov.cn/n810341/n810755/c1417741/content.html (accessed on 5 March 2018).
- China Auto. An introduction to Shanghai Shen-Li, a R & D team for the 863 key project of electric vehicles. China Auto 2005, 16–17. [Google Scholar]
- Gupta, M.; Bandyopadhyay, K.R.; Singh, S.K. Measuring effectiveness of carbon tax on Indian road passenger transport: A system dynamics approach. Energy Econ. 2019, 81, 341–345. [Google Scholar] [CrossRef]
- Abrera, M.V. The Use of Economic Instruments in Natural Resource Management in the Philippines. In Proceedings of the Forum-Workshop on Economic Instruments Applied in Environmental and Natural Resource Management in Southeast Asia, Bali, Indonesia, 26–28 September 2011. [Google Scholar]
- Tularak, P. The Use of Economic Instruments in Natural Resource Management in Thailand. In Proceedings of the Forum-Workshop on Economic Instruments Applied in Environmental and Natural Resource Management in Southeast Asia, Bali, Indonesia, 26–28 September 2011. [Google Scholar]
- Johannes, S.; Olearius, A. Environmental Taxation in Viet Nam. 2011. Available online: http://www.greenfiscalpolicy.org/wp-content/uploads/2013/08/Environmental-Taxation-in-Vietnam.pdf (accessed on 6 March 2018).
- Nguyen, T.N. Using Economic Instruments for Urban Environment Management in Vietnam: Issues and Challenges. China Rep. 2017, 53, 386–399. [Google Scholar]
- Li, J.; Zhan, J. Policy changes and policy instruments selection of China’s new energy vehicle industry. China Popul. Resour. Environ. 2017, 27, 198–208. (In Chinese) [Google Scholar] [CrossRef]
- World Bank. Health impacts of indoor air pollution. In EAP Clean Stove Initiative Knowledge Exchange Series; Report Number 70100; The World Bank: Washington, DC, USA, 2012. [Google Scholar]
- Bedi, A.; Sparrow, R.; Tasciotti, L. Impact Evaluation of Netherlands Supported Programmes in the Area of Energy and Development Cooperation in Indonesia; Policy and Operations Evaluation Department: The Hague, The Netherlands, 2013. [Google Scholar]
- UNEP (United Nations Development Programme). Terminal Evaluation Report: Energy Efficiency in New Construction in the Residential and Commercial Buildings Sector in Mongolia. 2014. Available online: https://erc.undp.org/evaluation/evaluations/detail/7298 (accessed on 3 January 2018).
- SNV (Netherlands Development Organisation). Annual Report 2015. 2015. Available online: http://www.snv.org/public/cms/sites/default/files/explore/download/snv_corporate_annual_report_2015_0.pdf (accessed on 10 March 2018).
- Hanh, N.; Eije, S.V. Market Study. In Biomass Advanced Cookstove in Vietnam; SNV: The Hague, The Netherlands, 2016. [Google Scholar]
- Aggarwal, S.; Kumar, S.; Tiwari, M.K. Decision support system for Pradhan Mantri Ujjwala Yojana. Energy Policy 2018, 118, 455–461. [Google Scholar] [CrossRef]
- Schmalensee, R.; Stavins, R. Lessons learned from three decades of experience with cap and trade. Rev. Environ. Econ. Policy 2017, 11, 59–79. [Google Scholar] [CrossRef]
- EEA. Environmental Taxation and EU Environmental Policies; EEA Report No 17/2016; EEA: Copenhagen, Denmark, 2016; ISBN 978-92-9213-755-7. [Google Scholar]
- Borenstein, S.; Bushnell, J.; Wolak, F.A.; Zaragoza-Watkins, M. Expecting the Unexpected: Emissions Uncertainty and Environmental Market Design; Working Paper 20999; National Bureau of Economic Research (NBER): Cambridge, MA, USA, 2015. [Google Scholar]
- Ming, Z.; Ximei, L.; Na, L.; Song, X. Overall review of renewable energy tariff policy in China: Evolution, implementation, problems and countermeasures. Renew. Sustain. Energy Rev. 2013, 25, 260–271. [Google Scholar] [CrossRef] [Green Version]
- Zheng, Y.; Zheng, H.; Ye, X. Using Machine Learning in Environmental Tax Reform Assessment for Sustainable Development: A Case Study of Hubei Province, China. Sustainability 2016, 8, 1124. [Google Scholar] [CrossRef]
- ERIA (Economic Research Institute for ASEAN and East Asia). Institutional Policy and Economic Impacts of Energy Subsidies Removal in East Asia; ERIA Research Project Reports; ERIA: Jakarta, Indonesia, 2017. [Google Scholar]
- Wang, Y.; Song, S.; Qiu, S.; Lu, L.; Ma, Y.; Li, X.; Hu, Y. Study on International Practices for Low Emission Zone And Congestion Charging; Working Paper; World Resources Institute: Washington, DC, USA, 2017. [Google Scholar]
- Chafe, Z.; Brauer, M.; Héroux, M.E.; Klimont, Z.; Lanki, T.; Salonen, R.O.; Smith, K.R. Residential Heating with Wood and Coal: Health Impacts and Policy Options in Europe and North America; World Health Organization (WHO): Copenhagen, Denmark, 2015. [Google Scholar]
- Barría, R.M. Indoor air pollution by particulate matter from wood fuel: An unresolved problem. Environ. Pollut. Clim. Chang. 2016, 1, 2. [Google Scholar] [CrossRef]
- Troncoso, K.; da Silva, A.S. LPG fuel subsidies in Latin America and the use of solid fuels to cook. Energy Policy 2017, 107, 188–196. [Google Scholar] [CrossRef]
- Barnwal, P. Curbing Leakage in Public Programs: Evidence from India’s Direct Benefit Transfer Policy; Working Paper; International Growth Centre: London, England, 2017; Reference Number: E-89111-INC-1. [Google Scholar]
- Tsevegjav, B. Assessment of Urban air Pollution Abatement Policy implementation vis-a-vis the Role of Household Energy Use in Ger Areas of Mongolia. Master’s Thesis, University of Twente, Enschede, The Netherlands, 2013. [Google Scholar]
- Asian Development Bank (ADB). Market-Based Approaches for Managing the Asian Environment: A Review; Asian Development Bank: Mandaluyong City, Metro Manila, The Philippines, 2008. [Google Scholar]
- Somanathan, E.; Sterner, T.; Sugiyama, T.; Chimanikire, D.; Dubash, N.K.; Essandoh-Yeddu, J.K.; Fifita, S.; Goulder, L.; Jaffe, A.; Labandeira, X.; et al. National and Sub-national Policies and Institutions. In Climate Change 2014: Mitigation of Climate Change; Contribution of Working Group III to the Fifth Assessment Report of the Intergovernmental Panel on Climate Change; Edenhofer, O., Pichs-Madruga, R., Sokona, Y., Farahani, E., Kadner, S., Seyboth, K., Adler, A., Baum, I., Brunner, S., Eickemeier, P., Eds.; Cambridge University Press: Cambridge, UK, 2014. [Google Scholar]
Figure 1.
Sales of passenger vehicles in China: 2008–2017. Data source: [35].
Figure 1.
Sales of passenger vehicles in China: 2008–2017. Data source: [35].


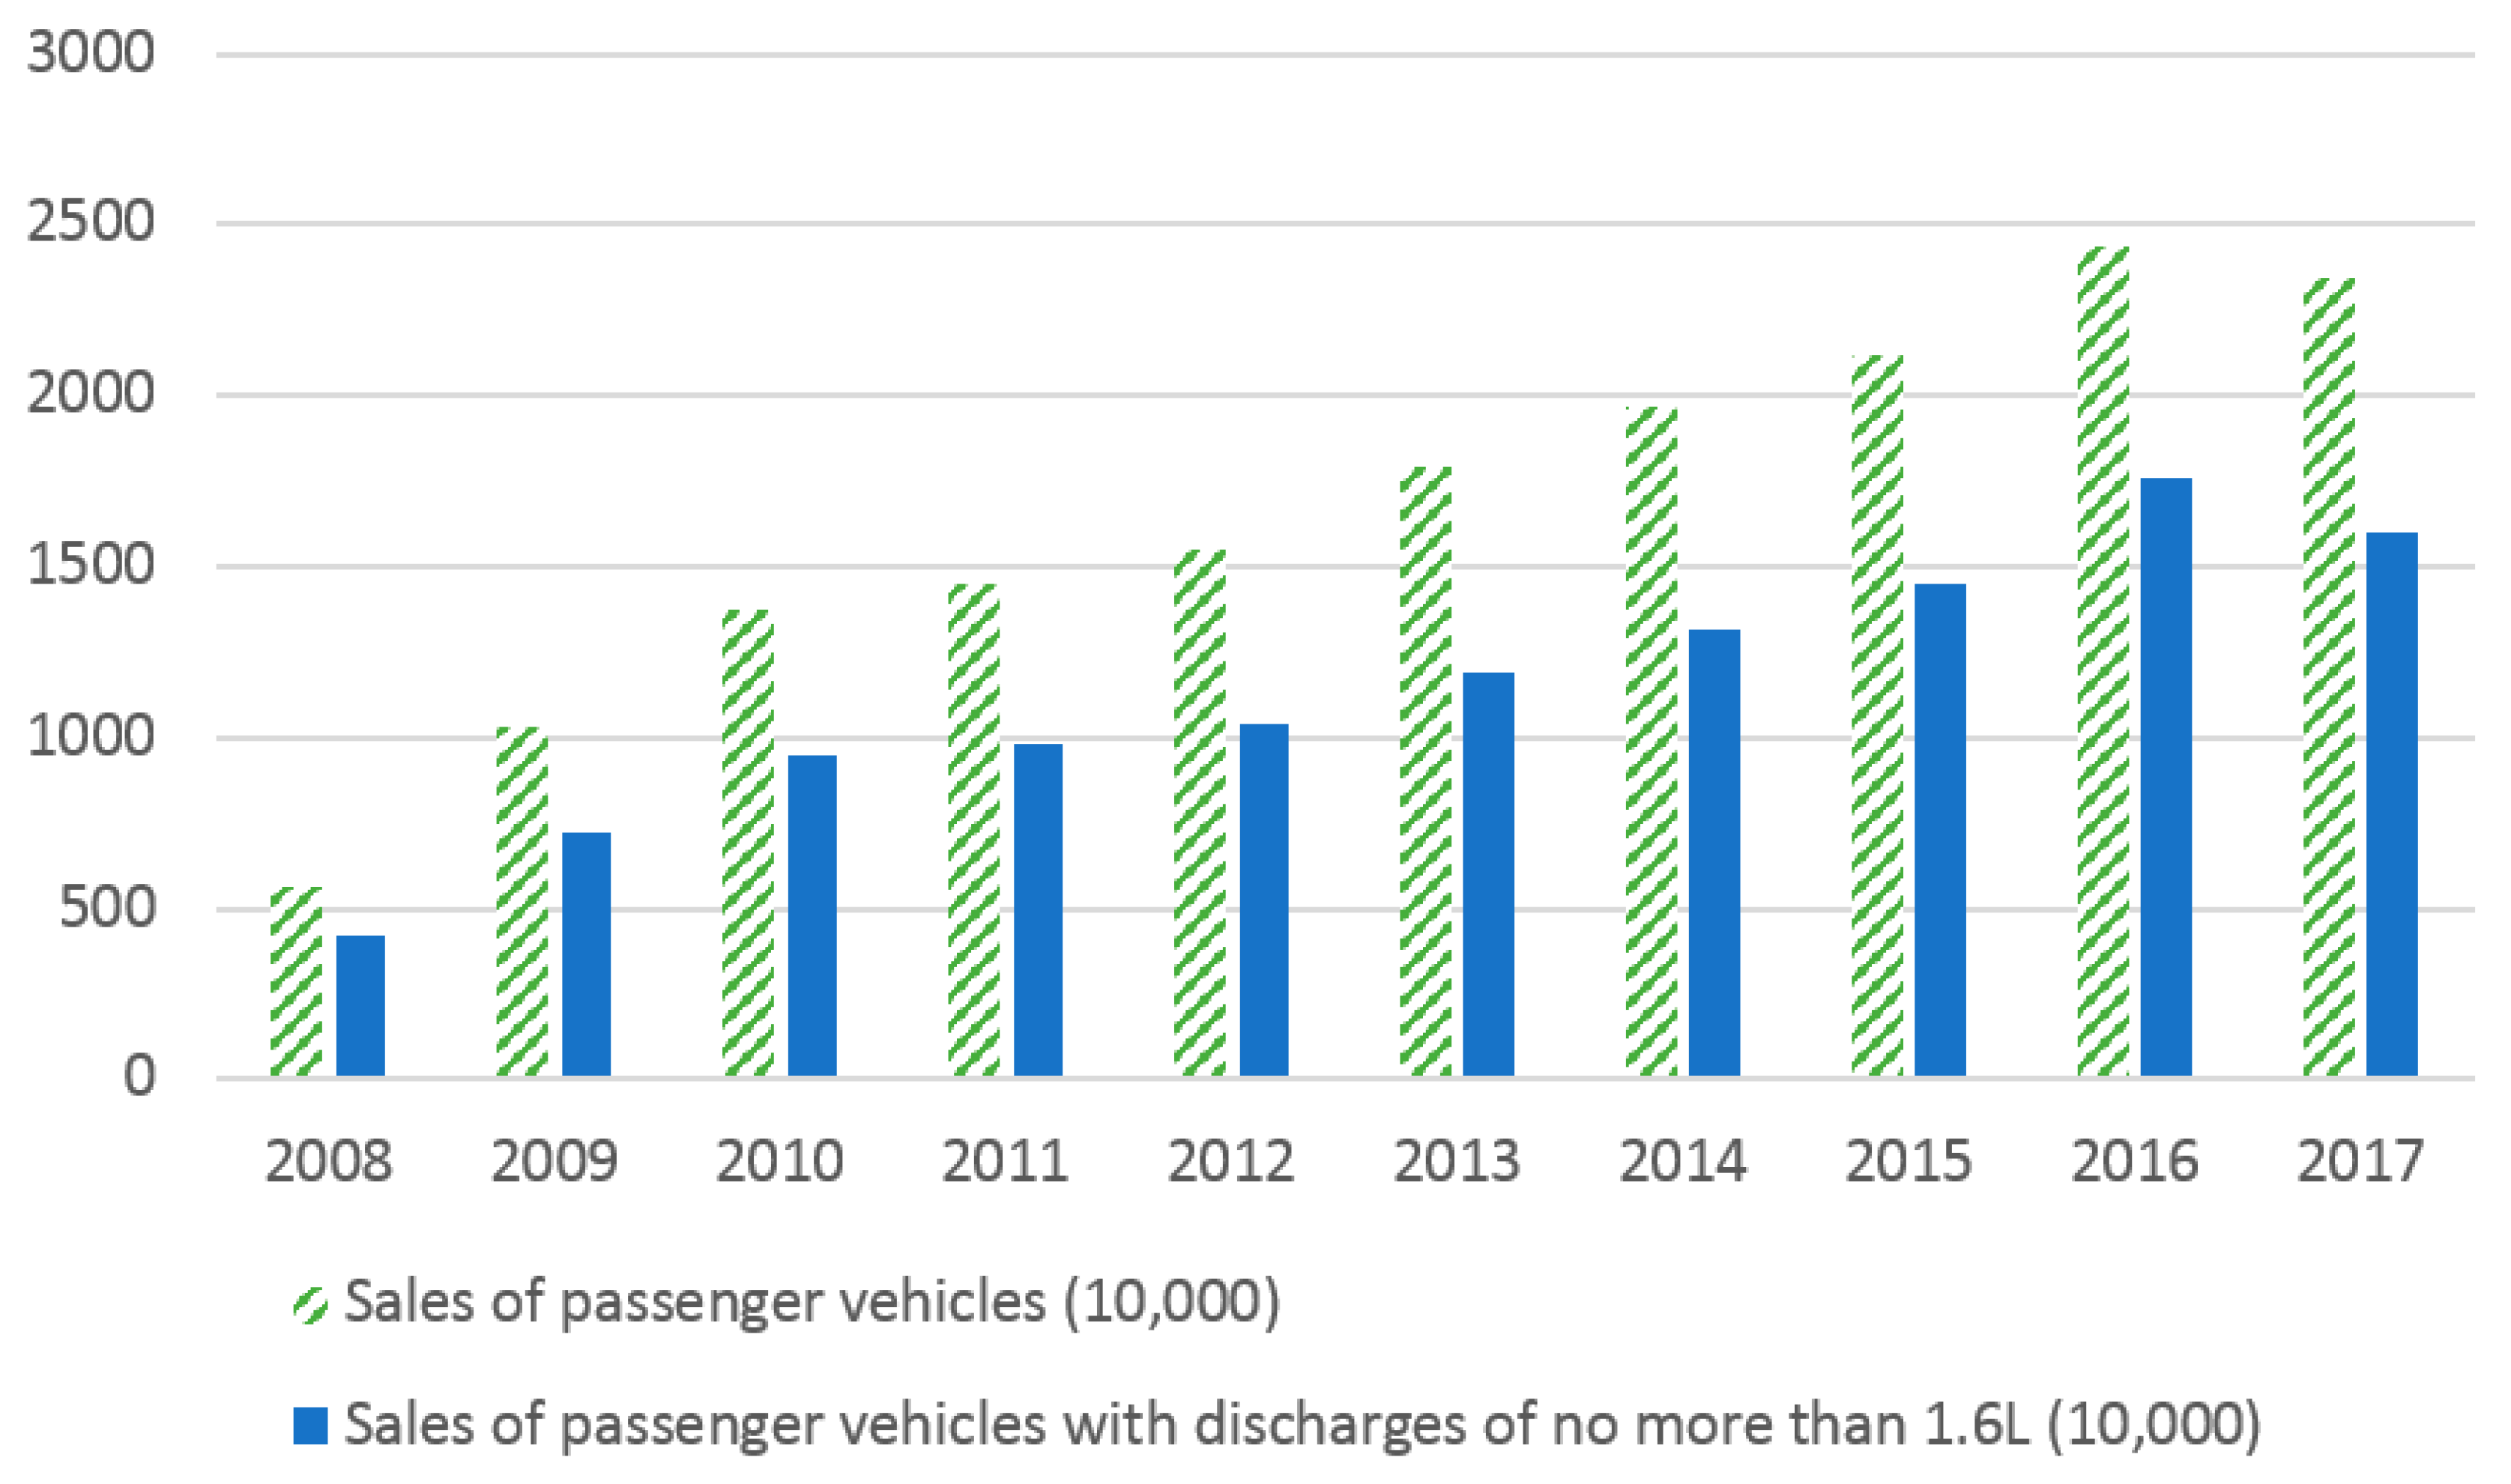
Table 1.
Environmental indicators in Asian countries.
| Country | Indicator | ||||
|---|---|---|---|---|---|
| Access to Clean Fuels or Technologies for Cooking (% Population) | Electricity Production from Coal Sources (% Total) | CO2 Emissions (Metric Tons Per Capita 2014) | PM2.5, Mean Annual Exposure (μg/m3 in 2015) | % Population Exposed to Levels Exceeding WHO PM2.5 Guideline | |
| East Asia | |||||
| China | 57.2 | 72.6 | 7.5 | 58 | 100 |
| Mongolia | 31.9 | 92.3 | 7.1 | 24 | 91.7 |
| South Korea | 96.7 | 43.1 | 11.6 | 28.2 | 100 |
| Southeast Asia | |||||
| Cambodia | 13.4 | 28.2 | 0.4 | 29 | 100 |
| Indonesia | 56.6 | 52.7 | 1.8 | 15 | 88.9 |
| Lao PDR | 4.57 | ---- | 0.3 | 33 | 100 |
| Malaysia | 99.9 | 37.9 | 8.0 | 16 | 86.9 |
| Philippines | 44.8 | 42.8 | 1.1 | 23 | 100 |
| Thailand | 75.9 | 21.6 | 4.6 | 26 | 100 |
| Vietnam | 50.9 | 24.5 | 1.8 | 28 | 100 |
| South Asia | |||||
| Bangladesh | 10.1 | 2.0 | 0.5 | 89 | 100 |
| Bhutan | 68.0 | ---- | 1.3 | 56 | 99.8 |
| India | 34.2 | 75.0 | 1.7 | 74 | 100 |
| Nepal | 26.1 | 0 | 0.3 | 75 | 100 |
| Pakistan | 44.8 | 0.2 | 0.9 | 65 | 100 |
| Sri Lanka | 19.3 | 25.7 | 0.9 | 30 | 100 |
| Developed Countries | |||||
| OECD | 98.5 | 32.2 | 9.5 | 15 | 65.8 |
Source: [8]. PM, particular matter; WHO, World Health Organization.
Table 2.
Overview of current use of market-based instruments (MBIs) for air pollution in Asia.
| MBI | Energy Production and Industrial Pollution | Transport | Domestic Cooking and Heating |
|---|---|---|---|
| Tradable permits | China, India, and South Korea | ||
| Taxes, fees, or charges | China, Philippines, and Thailand | Bangladesh, China, India, Lao PDR, Malaysia, Nepal, Philippines, Thailand, and Vietnam | |
| Subsidies | Bangladesh, China, India, Indonesia, Malaysia, Philippines, and Thailand | China, Malaysia, and Thailand | Bangladesh, Cambodia, Indonesia, Laos PDR, Mongolia, Nepal, and Vietnam |
| Information provision, labels, and voluntary agreements | China, India, Indonesia, Malaysia, Philippines, and Thailand |
Table 3.
Major new energy vehicle (NEV) policies, 2009–2016. [41]
Table 3.
Major new energy vehicle (NEV) policies, 2009–2016. [41]
| Time | Policy | Core Provisions |
|---|---|---|
| 2009 | NEV Pilot Program (Ten Cities, Thousand Vehicles Program) | Pilot cities subsidized to meet higher targets for the development of NEVs in public transport |
| 2010 | Notice on Pilot Subsidies for Private Purchases of NEVs | Subsidies for private purchases of NEVs |
| 2011 | Notice on Furthering the NEV Pilot Programme | Preferential tax regulations for NEVs |
| 2012 | Interim Measures for the Management of Financial Incentive Funds for the Transformation of Energy Saving Technologies | Promoting the technological development and industrial production of NEVs |
| 2014 | Notice on Exempting the Vehicle Purchase Tax on NEVs | Exemption of the vehicle purchase tax on NEVs from 1 September 2014 to 31 December 2017 |
| 2015 | Implementation Measures for Accelerating the Promotion of NEVs in the Transportation Sector | Lifting restrictions on NEV purchases (such as the license plate quota) |
© 2019 by the authors. Licensee MDPI, Basel, Switzerland. This article is an open access article distributed under the terms and conditions of the Creative Commons Attribution (CC BY) license (http://creativecommons.org/licenses/by/4.0/).
Share and Cite
MDPI and ACS Style
Coria, J.; Köhlin, G.; Xu, J. On the Use of Market-Based Instruments to Reduce Air Pollution in Asia. Sustainability 2019, 11, 4895. https://0-doi-org.brum.beds.ac.uk/10.3390/su11184895
AMA Style
Coria J, Köhlin G, Xu J. On the Use of Market-Based Instruments to Reduce Air Pollution in Asia. Sustainability. 2019; 11(18):4895. https://0-doi-org.brum.beds.ac.uk/10.3390/su11184895
Chicago/Turabian StyleCoria, Jessica, Gunnar Köhlin, and Jintao Xu. 2019. "On the Use of Market-Based Instruments to Reduce Air Pollution in Asia" Sustainability 11, no. 18: 4895. https://0-doi-org.brum.beds.ac.uk/10.3390/su11184895
Note that from the first issue of 2016, this journal uses article numbers instead of page numbers. See further details here.