1. Introduction
In December 2015, the European Commission launched an action plan for the circular economy (CE). The plan consists of a list of actions through which the commission commits to support the transition to the CE, aiming to set “the right regulatory framework” for its development [
1]. It includes various initiatives concerning “each step of the value chain”, namely the stages of production, consumption, waste management, and secondary raw materials.
According to the plan, it is expected that Member States of the EU improve and converge towards the best practices and results regarding CE. To measure the degree of progress in these objectives, detect success factors, and evaluate whether enough actions were undertaken, in 2018, the European Commission prepared a monitoring framework for the CE (MFCE). This statistical tool relies on previously available data related to the four steps of the value chain and the priority areas highlighted in the action plan [
2].
This article aims to discuss the conceptualization underlying the selection and analysis of the metrics proposed by the European Commission to assess progress towards a CE. It is argued that the selected indicators are overly concerned with the Commission’s strategic priorities for material self-sufficiency and recycling, neglecting the more transformative systemic and social dimensions of the concept. This apparent bias in the metrics chosen to measure the degree of progress in the transition towards CE could contribute to distortion of the concept.
The next section presents the methodology and the theoretical approach behind the analysis. The third section examines the conceptualization of the CE underlying the selection of indicators for the MFCE. The fourth section offers an alternative analysis of the first results yielded by the available data, focusing on the trade of recyclable materials and employment. The fifth section discusses and contrasts the results with the existing literature on the subject. The last section summarizes the main conclusions and topics for further research.
2. Methods and Theoretical Approach
As many authors point out [
3,
4,
5,
6,
7], most of the theoretical and practical literature on CE offers an uncritical analysis, focusing on its promotion rather than on the economic and social challenges of its implementation, such as the possible contradictions with the prevailing mode of production and consumption. The central objective of this study was to perform a critical analysis of the conceptualization of the CE assumed by the EU to guide and coordinate European policies on the subject. The MFCE has been conceived as a baseline for measuring the degree of compliance with the European targets of transition towards a CE, and therefore can provide an overview of the components of the concept that are most relevant to the European Commission. Therefore, both the method used, and the sources selected respond to the following double analytical goal:
- (a)
To compare the understanding of CE explicitly incorporated in the EU official documents with the main conceptualizations existing in the academic literature; and
- (b)
To contrast the correspondence of this official understanding of CE with the selection of indicators that integrate the MFCE.
First, a review was carried out regarding the documents of the European Commission and the European Environmental Agency (EEA) that reflect the main guidelines of the European strategy for a CE, which in turn includes the elaboration of the MFCE (
Table 1). These were selected and compiled from the communications and reports that make up the Final Circular Economy Package, the 2018 Circular Economy Package, the EU Action Plan for the Circular Economy, and the previous proposal for the CE, all of which are available on the website of the Directorate-General for Environment of the European Commission. Also, the EEA’s document repository was consulted.
Secondly, a selective review was conducted on the most relevant academic literature devoted to the systematization of the multiple existing definitions of the concept of a CE. Preference was given to studies that applied a systematic approach and analyzed the largest possible number of definitions, as an exhaustive review of the definitions was not part of the scope of this article.
In the third place, other CE measurement initiatives were studied in the search for metrics that could be incorporated to, and are currently missing from, the MFCE. While some work has already been done regarding the development of indicators to quantify the CE [
11,
12,
13], macro-level assessment frameworks are not common outside of China [
13,
14], and in most cases are still at the development and/or proposal stage. In this regard, apart from China’s national CE indicator system [
15], we took into consideration three monitoring framework proposals at the national level in the EU (France, Spain, and the Netherlands) [
16,
17,
18], and a proposal for tracking CE progress at the regional level in Poland [
14]. These were chosen for their relevance as they were developed in EU-28 member countries and rely mainly on metrics at the meso and macroeconomic levels. Especially, the Spanish [
17] and Dutch [
18] proposals were found to be of greatest relevance for sharing a systemic approach to CE analysis.
Finally, the first results of the MFCE were re-examined from a broad CE-specific perspective, attending to environmental and social components that are currently not present in the interpretation provided by the European Commission, which, we argue, is biased by the mainstream economics approach, focusing on market and economic growth and neglecting more ambitious contributions from ecological economics.
3. Defining and Measuring Circular Economy
Even though CE has been gaining prominence in the public and academic debate for many years, there is still a lack of statistical indicators to analyze and monitor the diffusion of this new productive paradigm. Among the reasons that hinder the elaboration of such metrics is the absence of a consensus on the very definition of a CE. As a concept still under development, CE integrates different components that come from multiple sources, such as “sustainable development”, “cradle-to-cradle” (C2C), “functional economy”, “industrial ecology”, “blue economy”, “life cycle thinking”, “eco-design”, and “eco-innovation”, among others [
19,
20,
21].
Several reviews of the recent literature show the multiplicity of definitions currently in use [
22,
23,
24,
25,
26]. To identify a common conceptualization among such diversity, some authors have suggested comprehensive definitions based on a synthesis of the manifold existing ones. For example, [
24] analyzed 114 definitions and developed a coding framework according to three dimensions (core principles, aims, and enabler of CE); [
27] presented a “consensus-based” framework for CE based on 175 explicit definitions of the concept; and [
28] also suggested a systemic typology to synthesize the most common R-imperatives of the CE.
Among the hundreds of diverse conceptualizations, one of the more far-reaching and influential definitions of CE was provided by the Ellen MacArthur Foundation (EMF) [
19] (p. 7):
“[CE is] an industrial system that is restorative or regenerative by intention and design. It replaces the ‘end-of-life’ concept with restoration, shifts towards the use of renewable energy, eliminates the use of toxic chemicals, which impair reuse, and aims for the elimination of waste through the superior design of materials, products, systems, and, within this, business models.”
The basic idea behind this notion is to separate technical materials (plastics, metal, composites, etc.) from the biological ones (food, plants, etc.) and to define specific processes to extend the life of products and/or revalorize them as secondary resources. It is based in the C2C principles, which consider that “waste equals food”, prioritizing resource “up-grading” to resource “down-cycling” [
29]. The proposals that attempt to synthesize the existing definitions capture most of these elements, specifying certain aspects and emphasizing some issues more than others. For example, the conceptualization suggested by [
24] (p. 229) revolves around material cycles:
“[We defined CE] as an economic system that replaces the ‘end-of-life’ concept with reducing, alternatively reusing, recycling and recovering materials in production/distribution and consumption processes. It operates at the micro level (products, companies, consumers), meso level (eco-industrial parks) and macro level (city, region, nation and beyond), with the aim to accomplish sustainable development, thus simultaneously creating environmental quality, economic prosperity and social equity, to the benefit of current and future generations. It is enabled by novel business models and responsible consumers.”
The formulation of [
27] is similar, although it also highlights the notion of closed material and energy loops. The same can be said about the definition “based on the current knowledge” proposed by [
26] (p. 547):
“CE is a sustainable development initiative with the objective of reducing the societal production-consumption systems’ linear material and energy throughput flows by applying materials cycles, renewable and cascade-type energy flows to the linear system.”
These efforts to give coherence to the concept face the challenge that most of the definitions they attempt to synthesize focus only on certain elements of CE and leave other aspects unattended. As pointed out by [
26], CE is an “essentially contested concept”, which involves numerous and diverse stakeholders and interests. In particular, the components of CE that are most frequently ignored are those which imply a profound systemic change and/or contradict the growth imperative of the current linear productive paradigm [
24,
28]. Thus, the concept of CE is often deprived of its environmental and social dimensions, which are precisely those that define the limits within which economic activity can be sustainable. Therefore, the potential contribution of the CE paradigm to sustainability requires avoiding these restrictive and narrow conceptualizations. In particular, it has to include respect of the planet’s natural limits. As the authors of [
7] (p. 39) state in their own definition of CE:
“Circular economy limits the throughput flow to a level that nature tolerates and utilizes ecosystems cycles in economic cycles by respecting their natural reproduction rates.”
The propagation of this conceptual bias is also reflected on the metrics that are generally suggested in the literature for measuring progress towards a CE [
13,
15,
30]. For instance, as a result of a multiple correspondence analysis of 63 different indicators used to assess the CE, [
13] concluded that the most prevailing approach was related to resource and recycling efficiency, waste disposal, and secondary vs. primary use. On the other hand, metrics that inquire into the conservation of value from a systemic perspective are less frequent (longevity, value change and retention, system stability and sharing, among others).
The authors of [
11] compared 15 CE assessment methodologies and found that all the indicators involved were connected either to the use of recyclable resources or to the input of raw materials, while only one addressed value conservation issues, such as material loss and product lifetime reduction. Besides, most of the evaluations were found to be one-dimensional, and did not consider energy utilization and emissions, key systemic variables linked to value conservation and the transportation of products, materials, and waste.
Therefore, the selection of an exhaustive set of indicators to measure CE is hindered by the lack of a theoretical consensus regarding the precise set of elements that make up the concept. In this context, it is worthwhile to study the conceptual framework that underlies the meaning of CE in the EU circular strategy and in the MFCE. While no explicit definition can be found in the EU action plan for the CE, in the two subsequent reports on its implementation or in the MFCE, it is still possible to identify a few direct references to what the European Commission mainly understands as CE.
3.1. European Commission’s Conceptualization of Circular Economy
When seeking to investigate the understanding of a concept, the compilation of written definitions is usually considered the most appropriate method, since it implies a certain degree of deliberation on the part of those who define [
24]. This approach, well suited for working with scientific literature, presents some practical difficulties when applied to an investigation into the comprehension of a concept by a non-academic body or institution, such as the European Commission. Most of the documents produced by this kind of entity are intended for political and informative dissemination, which requires technical complexity but does not necessarily imply scientific accuracy. Definitions of concepts are not always explicit, can differ from those most generally coined by scientific sources, and, on some occasions, may even be inconsistent in time and between different agencies within the same institution.
The case of the European Commission regarding CE is no exception. Despite the numerous documents that make up the European strategy for the CE, plain definitions are scarce and do not usually answer the expected questions “what is a circular economy?” or “how is a circular economy defined?”. Instead, they refer to what happens in a CE, or what would be the outcomes if such an economy were to be achieved.
This is illustrated, for example, in [
8] (p. 2):
“Circular economy systems keep the added value in products for as long as possible and eliminates waste. They keep resources within the economy when a product has reached the end of its life, so that they can be productively used again and again and hence create further value. Transition to a more circular economy requires changes throughout value chains, from product design to new business and market models, from new ways of turning waste into a resource to new modes of consumer behavior. This implies full systemic change, and innovation not only in technologies, but also in organization, society, finance methods and policies.”
That document could be considered the first official statement by the European Commission regarding its decision to go beyond resource efficiency and move towards the more ambitious goal of achieving a CE. A CE is referred to there as (a number of) “systems” that involve a complete transformation in all the production phases, from design to consumption and disposal, but also in finance, society, and public policy. However, this notion of “full systemic change” seems to have lost ground in subsequent communications, shifting to the less disruptive goals of job creation and promotion of competitive advantages and product innovation. At the same time, the rather utopian but concrete objective of eliminating waste has mutated into the imprecise notion of “waste minimizing”. This is reflected in the conceptualization present in [
1] (p. 1):
“The transition to a more circular economy, where the value of products, materials and resources is maintained in the economy for as long as possible, and the generation of waste minimized, is an essential contribution to the EU’s efforts to develop a sustainable, low carbon, resource efficient and competitive economy. (…) The circular economy will boost the EU’s competitiveness by protecting businesses against scarcity of resources and volatile prices, helping to create new business opportunities and innovative, more efficient ways of producing and consuming. It will create local jobs at all skills levels and opportunities for social integration and cohesion. At the same time, it will save energy and help avoid the irreversible damages caused by using up resources at a rate that exceeds the Earth’s capacity to renew them in terms of climate and biodiversity, air, soil, and water pollution.”
Besides the search for explicit definitions, the priorities set out by the commission in the action plan can also provide an approach to its conception with respect to CE. The plan is structured around four aspects of CE linked to the production phase, consumption, waste management, and reuse of resources. It defines five priority sectors to focus the actions: Plastics, food waste, critical raw materials, construction and demolition, and bio-based products, together with horizontal measures concerning innovation and investment.
Regarding the production phase, emphasis is placed on the promotion of eco-design and process efficiency to reduce the use of raw materials and the generation of waste. Matters, such as product reparability, updatability, durability, and recyclability, are mentioned and addressed mainly through the development of new design requirements. As for consumption, proposed actions are linked to ensure the availability of information on the durability and reparability of products (eco-labelling), the promotion of reuse and sharing (collaborative economy), the detection of planned obsolescence practices, the enforcement of the effective application of guarantees, and an emphasis on circular public provision. The internalization of environmental costs through taxing is also mentioned, albeit not addressed by any specific measure.
The initiatives of waste management are based on the logic of waste hierarchy, which establishes the following order of priority: Prevention, preparation for reuse, recycling, energy recovery, and disposal. The low share of recycled materials in the total demand for materials in the EU is intended to be addressed through the construction of a secondary raw materials market. This involves the development of quality standards, harmonization of environmental regulations and standards, and removal of bureaucratic barriers.
Finally, the plan also proposes the development of a monitoring framework to measure progress towards its main objectives. The choice of indicators, though logically limited by the availability of information, offer another approximation to the conceptualization of CE on which the commission relies.
3.2. The Commissions’ Monitoring Framework for the Circular Economy
The MFCE is based on two tables of indicators previously elaborated to assess the progress towards its priority goals on the environment [
31,
32]. The criterion that guided the preparation of the framework was to avoid higher administrative costs, together with “relevance, acceptance, credibility, ease of use and robustness” of data [
2] (p. 5). The MFCE consists of a set of 10 indicators grouped into four stages, related to the priorities pointed out by the Commission in the CE action plan (
Table 2).
The chosen indicators seem to corroborate the idea that the commission shifted away from the notion of transition to CE as a complete systemic change. Besides, the MFCE leaves several of the action plan’s priority issues unaddressed. As noted by [
33], the disregard of key issues related to the use of energy, production (design, remanufacturing, materials change, reuse, resource use reduction), and consumption (repair, sharing) evidences a less ambitious approach to CE. In contrast, metrics are focused on the old perspective of waste reduction and recycling as an alternative source of materials for what basically continues to be the current linear system [
34].
The selection of metrics of the MFCE is consistent with the guidelines expressed in the report “Circular Economy in Europe: Developing the knowledge basis” issued by the European Environmental Agency (EEA). After referring to the broader definition of CE proposed by the EMF, which involves materials, energy, and emissions, the report makes explicit that, however, the focus will be placed “on the material side of the circular economy” [
9] (p. 22). This questionable decision would seem to rest on an even more debatable conceptual justification: The document states that CE “does not fully address preservation of natural capital and prevention of environmental risks to human health and well-being”, but rather these dimensions are considered to be embedded in a wider “green economy perspective” [
9] (p. 31).
3.3. What the MFCE Leaves Out
In this respect, it is worth establishing a contrast with other initiatives of CE assessment schemes, such as the framework developed in China [
15], and the proposals issued in France [
16], Spain [
17], the Netherlands [
18], and, at the regional level, in Poland [
14].
Based on the 3R principles (reduction, reduce, and recycling), China’s national CE indicator system relies on the material flow analysis (MFA) method, complemented by eco-efficiency indicators, such as water and energy use per unit of GDP [
15]. While most of the metrics refer to materials’ recycling and waste generation, the main difference with respect to the MFCE is that the Chinese framework also includes indicators of energy and water use.
The French framework proposal consists of 10 indicators, the most significant of which are those relating to the initial phases of the product cycle (number of eco-label holders and industrial and territorial ecology projects) and to sustainable consumption (car-sharing and household spending in product repair and maintenance). The last two metrics are innovative in terms of recognizing in some way the relevance of measuring the potential change in social practices.
The proposal developed in Spain includes an environmentally broader set of metrics, such as energy efficiency, use of renewable energy and water sources, carbon intensity, waste taxes, and tax incentives for sub-products. The Dutch initiative aims to measure not only the current state of CE but also the policy actions undertaken by the government and the transition dynamics that yielded the observed effects. The transition dynamics are mainly based on the innovation process entailed by the shift to CE [
18]. The indicators are also divided according to their link with inputs (e.g., number of researchers), throughputs (e.g., number of awareness campaigns), outputs (e.g., number of new CE products), and core achievements (e.g., circularity strategies).
Finally, the regional proposal for Poland includes, in addition to metrics related to zero-waste, eco-efficiency, low-carbon, and eco-innovation, a set of socio-economic indicators that are intended to capture different dimensions of prosperity (or lack of it) that can be affected by (or interfere with) the transition to CE (e.g., average life expectancy, unemployment rate, at-risk-of-poverty rate, households with PC/connection to internet, urbanization rates) [
14].
While these four proposals contain some indicators that are not yet developed or available at the EU level, they involve a broader and more systemic approach to CE from which the European framework could benefit greatly. In this regard, the following are some of the key issues identified in the national- and regional-level suggested frameworks that have been left out of the MFCE and whose incorporation is proposed for further discussion.
3.3.1. Earth, Water, Air, and Energy Are Also Valuable Resources
Considering the emphasis on preserving the value of all resources in the conceptualization of CE expressed at the beginning of the EU action plan, it is striking that the MFCE only focuses on materials and neglects land, water, air, and energy. All the more so when in most cases indicators are available in the Eurostat’s database, for example, among those related to the Europe 2020 targets or the sustainable development goals.
These include metrics regarding energy productivity, share of renewable energies, carbon intensity, and built-up land. Greenhouse gas emissions per capita, pollutant emissions from transport, and productivity of artificial land are also available from the Eurostat’s database, while water abstraction, productivity and exploitation indexes are accessible as well (yet not for every EU Member State). The reason behind these omissions cannot be to avoid duplications, as many other multidimensional indicators can be found in several different thematic axes within Eurostat’s database if their scope and definition require so.
The incorporation of the existing metrics about land, water, emissions, and energy in the MFCE could contribute to the dissemination of a broader notion of CE without incurring extra costs. Furthermore, a comprehensive assessment of the level of circularity of the European economy cannot fail to take into account its effects on other territories. In this sense, indicators of the water footprint, land, and emissions should be included in the statistics as well.
3.3.2. An Innovation System for System Innovation
As highlighted in [
18], the socio-institutional and productive change involved in the transition to CE requires the support of an appropriate innovation system. In terms of metrics, this translates into the need to measure not only the environmental and social effects but also the actions and resources set in motion to promote circular innovations. In this sense, efforts should be done to develop indicators, such as the number and share of CE researchers, investments and projects (inputs and throughputs), as well as new CE products, business models, start-ups, and publications (outputs).
The MFCE currently includes a metric about the number of patents related to recycling and secondary raw materials, thus recognizing the relevance of innovation activities for the transition to CE. Yet, the scope of the indicator is again limited to waste treatment and materials, while focusing only on the outputs of the innovation process.
Institutional drivers, such as the regulatory framework and tax structure, are also critical to generate the right incentives and conditions for innovation in CE. Data about current legal enablers and barriers for the transition should be taken into consideration in the assessment, along with taxation to resource extraction and waste generation, and subsidies to R + D + i in CE, sub-products, reuse, and circular activities in general.
3.3.3. Was not CE About Making Things Last Longer?
Products’ lifespan is a key dimension for a system approach to CE, as it depends and impacts on every phase of the value chain and has a direct effect on both the rate of extraction of natural resources and the level of waste generation. Still, metrics concerning this matter are among the least frequent, as pointed out by [
11,
13]. It is therefore vital for a comprehensive MFCE to develop indicators to track the average durability of products, together with its main determinants, such as the extent of eco-design, repair, reuse, and collaborative consumption activities.
3.3.4. Socio-Economic Change Is Not Without Conflict
The general lack of indicators on the socio-economic implications of the shift towards CE [
12,
14] is also noticeable in the MFCE. The role of citizens is present only through the amount of waste generated by their consumption, while the only essentially social variable measured is employment in “circular economy sectors”, disregarding the net effects on total employment and the working conditions of the jobs involved (this discussion will be taken up in depth in the fifth section). Moreover, the choice of metrics regarding the share of circular sectors in the economy are based on the rather voluntarist assumption that growth in such activities necessarily reflects an improvement in the overall levels of competitiveness and innovation. Possible unintended outcomes that have already been pointed out by several studies, such as the rebound effect [
35] or the potential net destruction of jobs [
9], are not taken into consideration.
In this sense, the incorporation of socio-economic indicators, such as those present in the “economic prosperity economy” and “smart economy” dimensions of the proposal by [
14], would be of great interest. Work should also be done on the elaboration of metrics on the qualitative aspects of jobs linked to CE, not only in waste collection, recycling, and repair sectors, but also in the economy as a whole, with a special emphasis on the new type of flexible labor relations associated with the expansion of the so-called collaborative economy [
36].
5. Discussion
CE can be considered as an attempt to operationalize a new sustainable productive paradigm. The elaboration of a MFCE is a valuable contribution in this sense for two main reasons. First of all, because it provides systematic information on the current level of development of CE in the EU. Secondly, it promotes circular objectives by assessing the degree of progress in the selected dimensions, which in turn allows for national governments to set and commit to specific goals and performance targets. This dual purpose gives the MFCE paramount importance in defining the EU’s path towards the CE, as it determines the range of priorities for action. As [
13] points out, the choice of metrics is crucial in the future shaping of a concept that is still in construction. Consequently, any bias in the selection of indicators both reflects and conditions the orientation and ambition of the European CE strategy.
The difficulties to define an appropriate monitoring framework are certainly numerous. In the first place, the choice of the most adequate metrics for each dimension is not always straightforward, as their aim and interpretation regarding the CE principles are often unclear [
12]. Secondly, as noted by [
12,
24,
26,
28], there is a great diversity of CE definitions and still no consensus on the scope of the concept. Third, the required information may not be available, especially as coverage and comparability at the European level is necessary, while resource and time constraints often force many aspects to be neglected. However, this should not imply a reduction in the scope of the concept that is being measured. Limiting the assessment of CE only to some of its components, leaving aside several key elements, could lead to the eventual distortion of its meaning and provide a misguided message to public and private actors.
In this sense, it has been argued that several topics that reflect the more comprehensive, systemic, and global character of CE are currently absent from the MFCE. This is the case of the use of energy, land and water, greenhouse gas emissions, environmental footprints, products lifespan, institutional drivers, and socio-economic implications of the of change towards CE, or the impact of activities linked to eco-design, reuse, and collaborative consumption. The decision to leave these aspects aside and focus solely on the materials dimension of CE is found to be contradictory not only with the critical literature [
3,
4,
7,
24,
26,
33,
34,
36] but also with the mainstream position expressed by the EMF [
19] and the very same priorities set by the European Commission [
1]. In some cases, the required information does not yet exist, which points to the necessity of developing new data sources. In others, metrics are already available, and therefore their exclusion evidences a bias in the conceptualization of CE that underlies the current composition of the MFCE.
In this sense, the absence in the MFCE of actual socio-economic indicators is consistent with an extended lack of acknowledgement of the social implications entailed in the transition to CE, previously noted by several studies, such as [
4,
15,
25,
26,
36]. The authors of [
4] point out that the shift towards CE has mostly been addressed as an issue of technical innovation, industrial systems, economic incentives, and reformulated business models, neglecting its socio-political consequences together with the possibility of exploring other possible “transformative pathways”. In the same vein, it has also been stated that the promotion of the CE within the EU is based on the neoclassical economic theory of the environment [
3], thus depicting society as a set of rational individuals whose main contribution to the CE is to voluntarily minimize their waste production while continuing to maximize their consumption.
The crucial role of political narratives in shaping expectations on the future potential of CE and limiting the choice between the currently available pathways has been highlighted by [
3,
5,
6]. Referring to the EU action plan for the CE, the authors of [
5] (p. 26) note that “the conventional forms of worth to justify a future orientation towards CE are framed through general understandings of, on the one hand, profit maximization and competition (market order) and on the other productivity, efficiency and instrumentality (industrial order)”, while the ecological order of worth remains absent. This would seem to be reflected in the lack in the MFCE of indicators on the environmental impact of the economic activity on land, water, and air/climate. The restricted selection of metrics also evidences a contrast between “idealized visions of the CE” related to “industrial symbiosis” and “products designed for extended lifetimes” [
5], and the “policy reality” focused mainly on “enhanced, post-consumer waste management” [
3,
5].
Besides, the emphasis placed on the growth of intra-European trade in secondary materials mirrors the primacy within government policy commitments of the need to create new markets, together with a growing understanding of the green economy as a source of new business opportunities [
3]. Such a narrative revolting around the notion of free-market as the main driving force for the change towards sustainability is supported in the neoliberal paradigm, which understands nature mainly as a source of resources for the making of economic profit though the application of technology and knowledge [
45]. Thus, the environmental issue of waste generation is reduced to a matter of removing the normative barriers that prevent the commodification of wastes though the creation of a European secondary materials market.
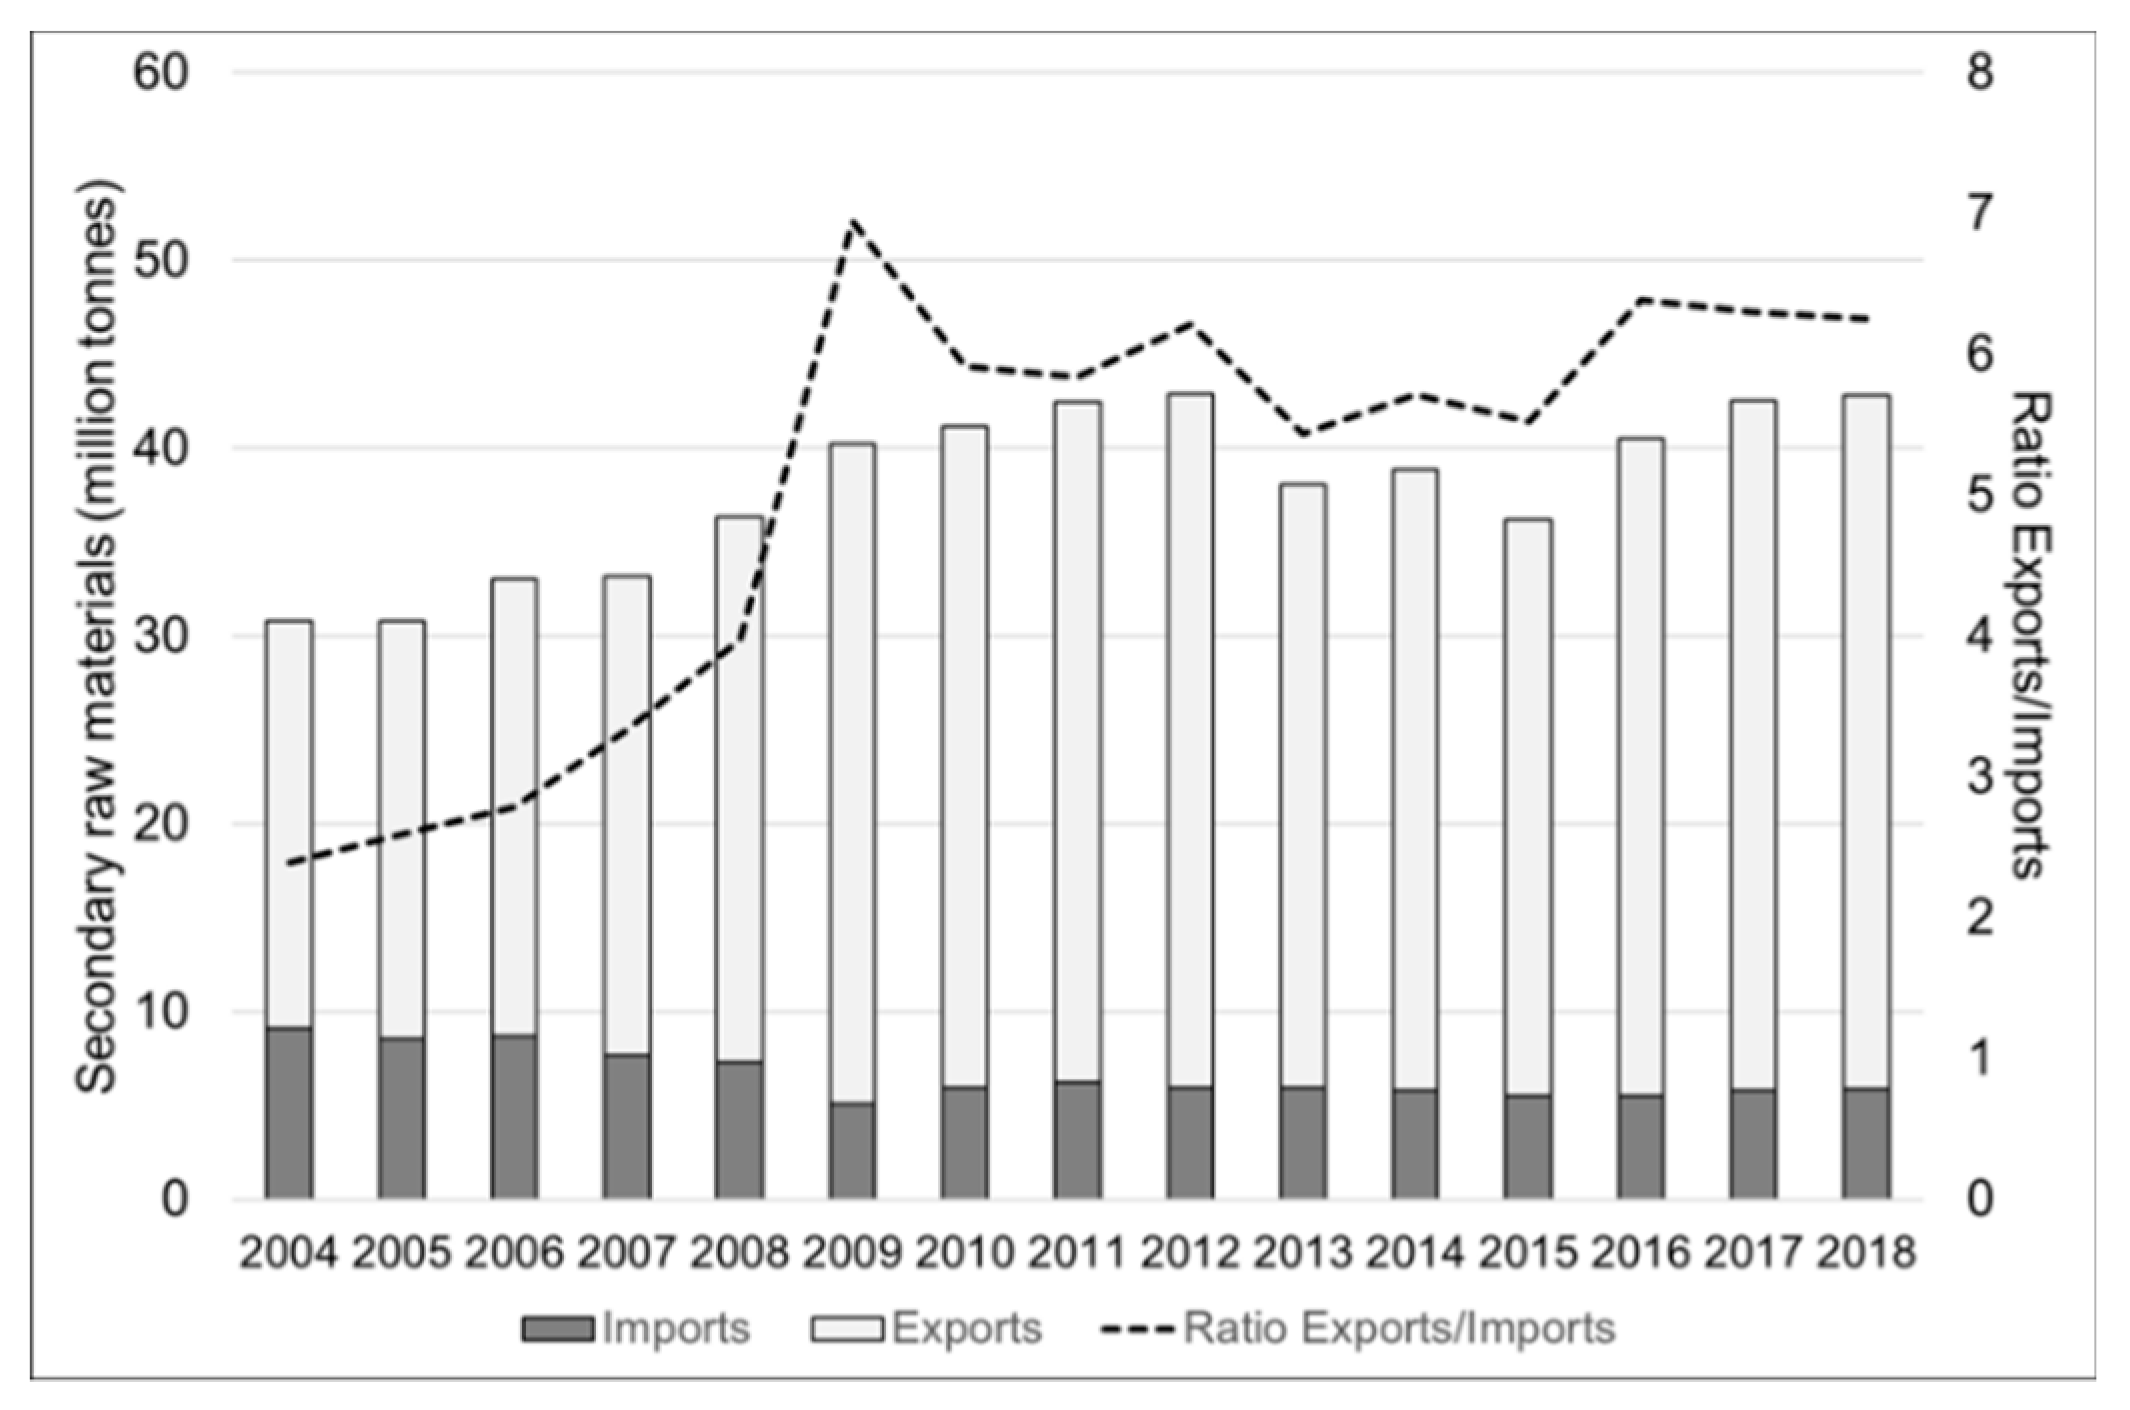
Regarding the interpretation of the available data, the results diverge significantly when the analysis focus on value conservation rather than value added. This applies especially to the analysis of international flows of secondary materials. The increase in the volume of trade in recyclable waste together with the large surplus reflected in the EU aggregate data may not necessarily imply good news from the point of view of value preservation and global sustainability. On the contrary, it could be evidencing a deficit in the capability to retain the value of recyclable materials within EU economies, which has been pointed out by authors like [
3]. Besides, the treatment that the exported secondary materials receive at the destination is unknown, so they may be ending as waste in countries with less strict legislation [
46]. In any case, it should be acknowledged that the environmental impacts of the European economy do not end at the EU border. As [
7] explain, a reported issue regarding spatial systems boundaries is that high eco-efficiencies can be achieved locally though the shift of negative environmental impacts to other territories, by means of exports (waste trade and difficulties in the end-management phases) and imports (disregard of biodiversity in primary resource exporting countries). Moreover, data about trade flows of secondary materials within the EU show that the “dynamic internal market and optimal use of EU recycling capacities” projected by the European Commission [
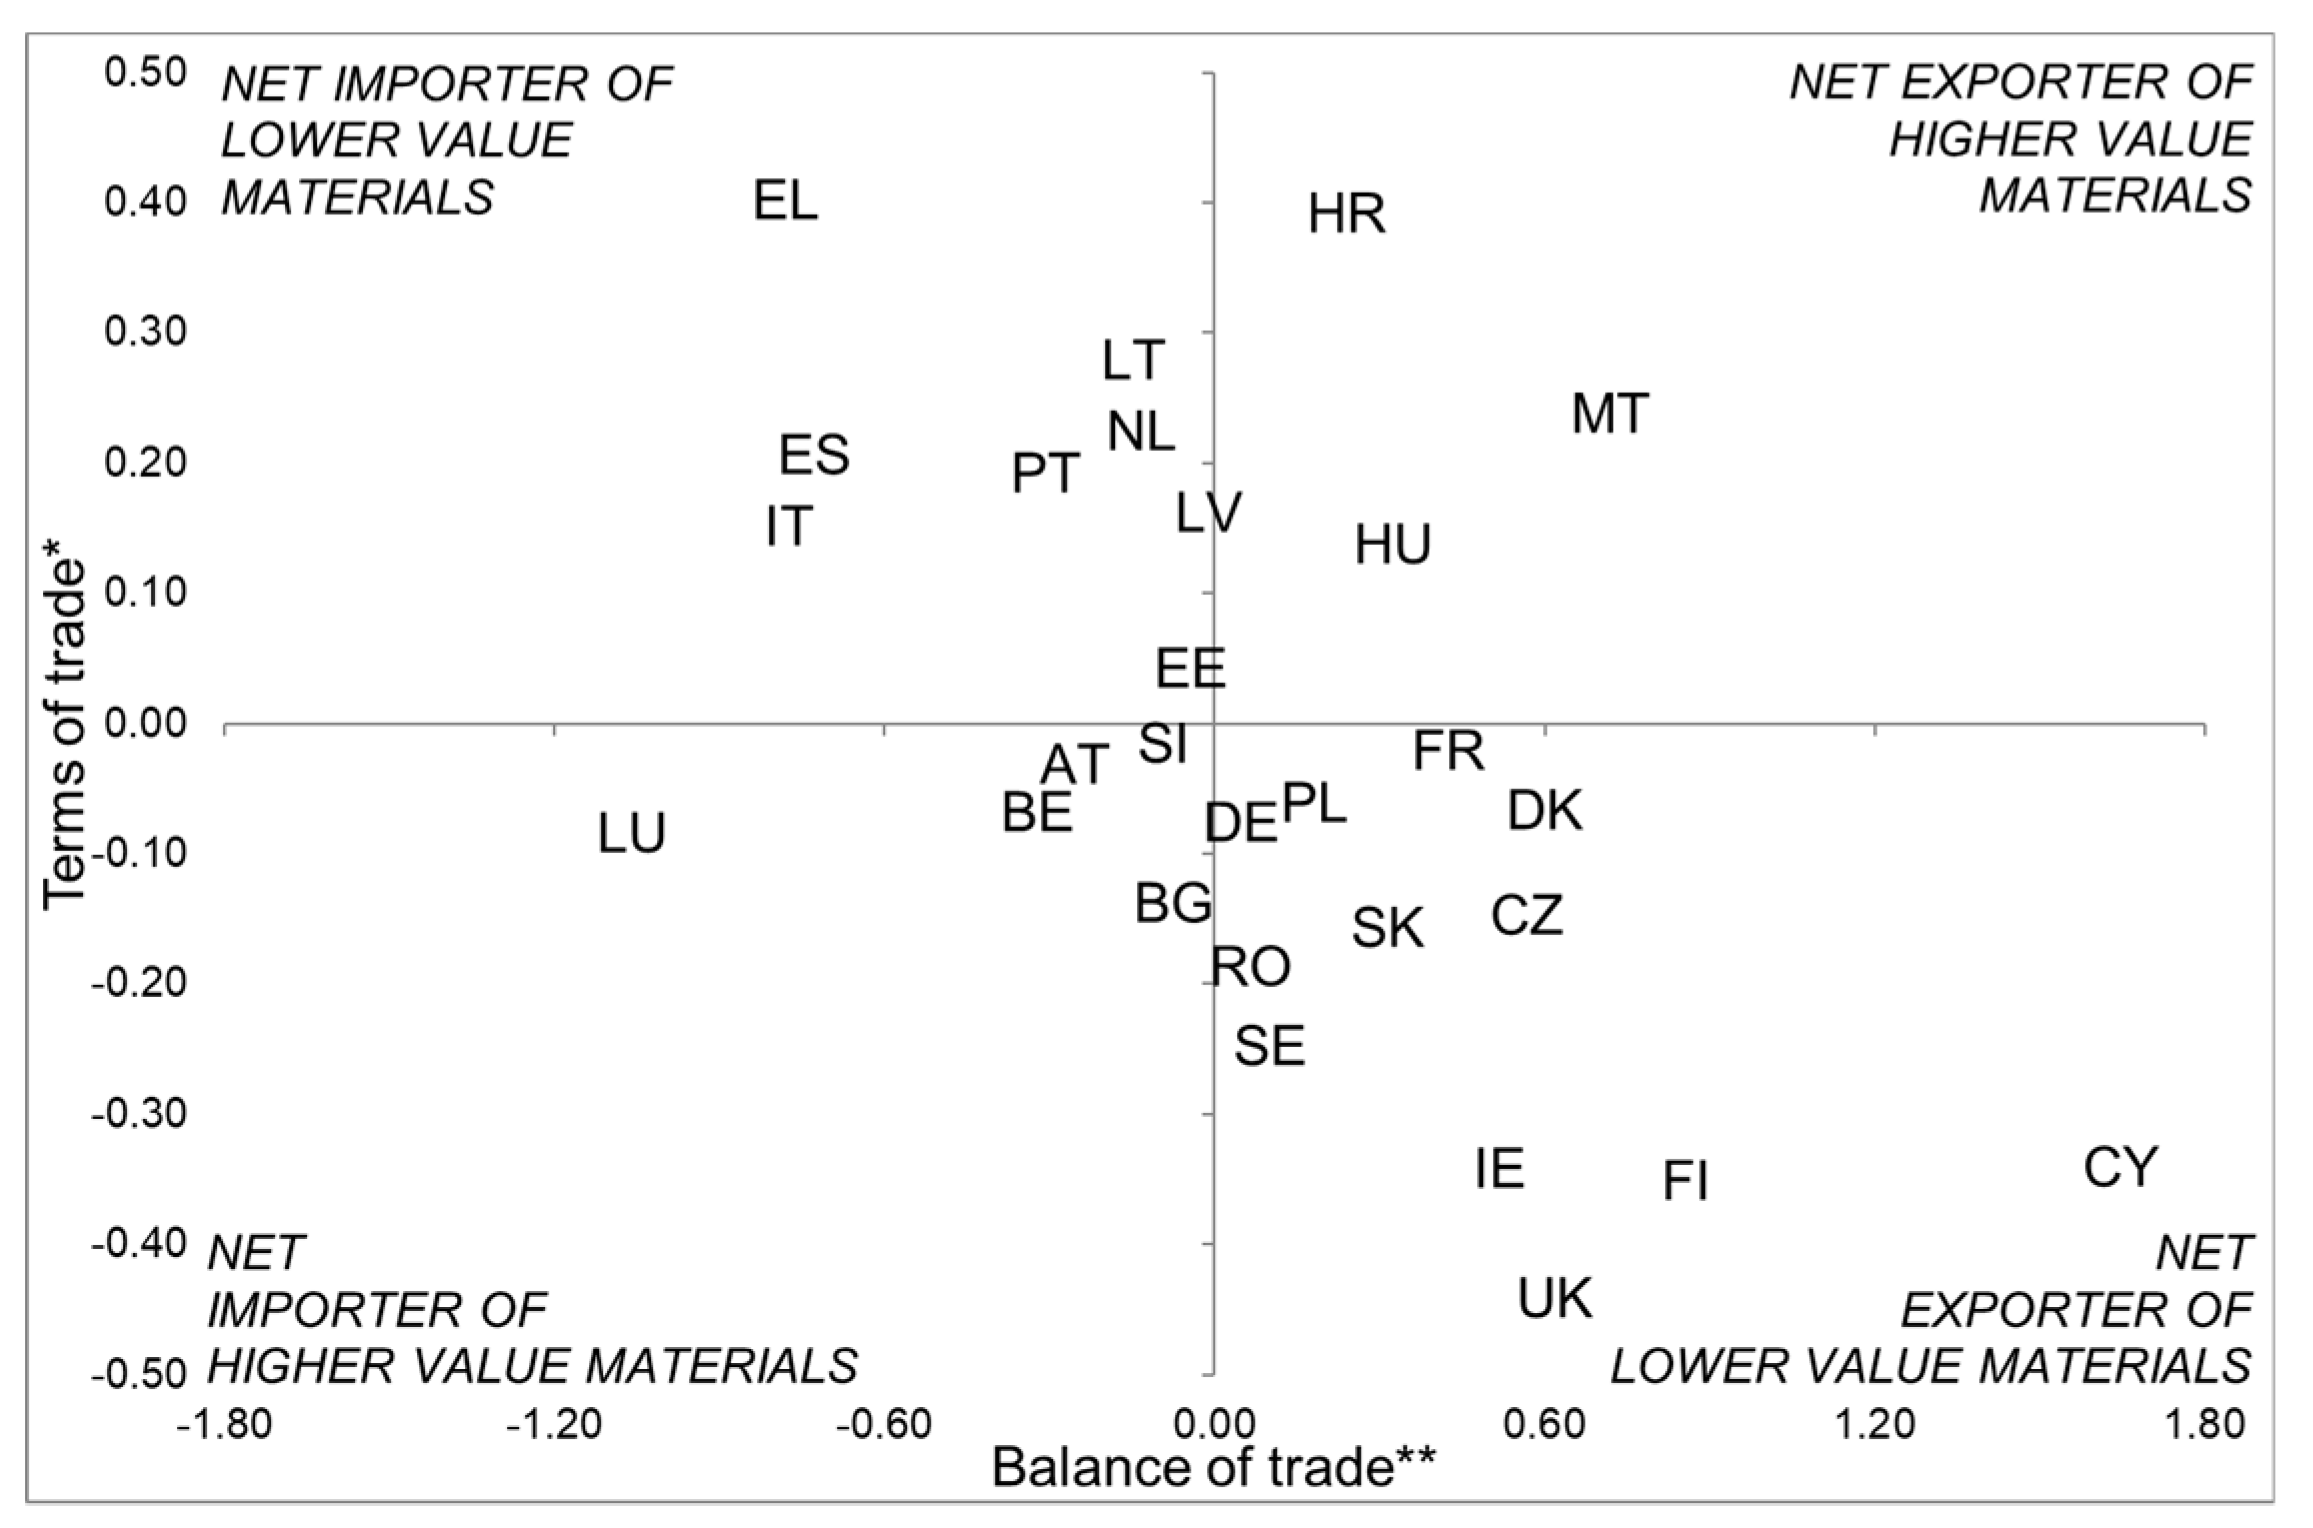
28] (p. 37) may in fact be determining the emergence of winners and losers within European boundaries in terms of value retention and potential environmental impacts.
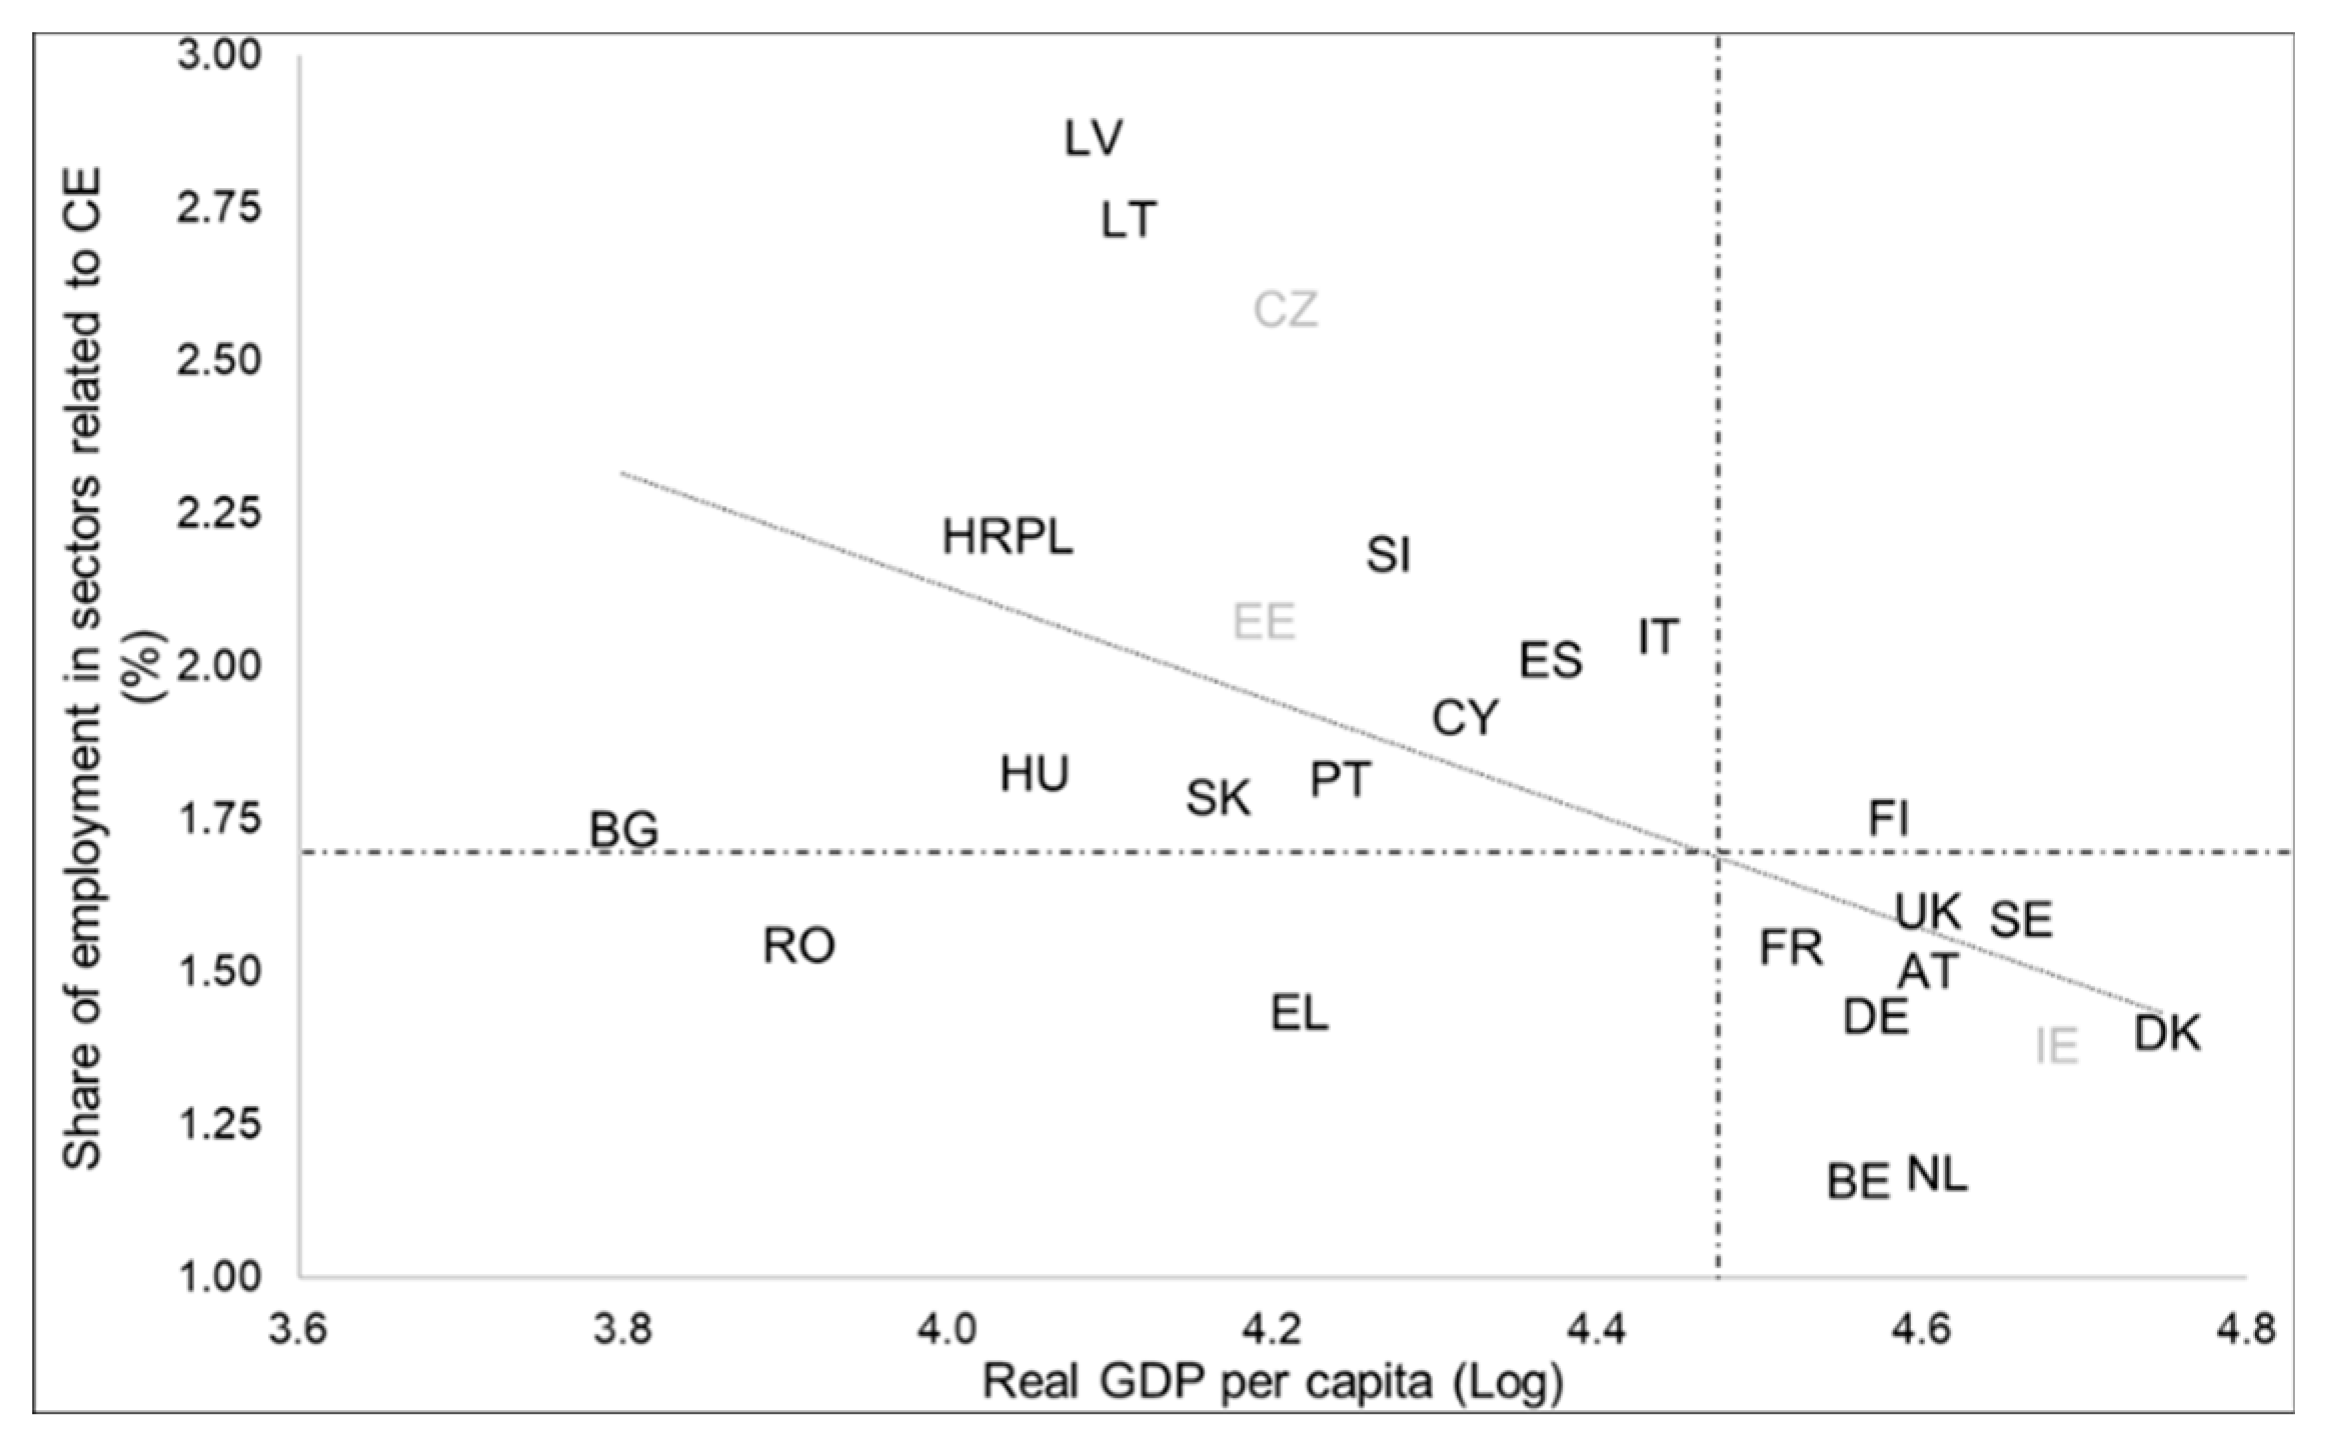
Another controversial aspect of the interpretation of the data has to do with the relationship between CE, economic activity, and employment. In the first place, the identification of CE with the recycling, repair, and reuse sectors is not only reductionist but also misguided. Although these activities are undoubtedly relevant, a proper assessment of the progress made in the transition towards CE needs to consider the diffusion of circular practices throughout the entire productive system and in all the economic activities. Besides, to estimate the real impact of CE-related employment on general well-being, it is crucial to take into consideration the net effect on general employment and the quality of the created jobs, for instance, by comparing wages and working conditions with those in the rest of the economy. Once we assume that labor contributes to the CE by being essentially a renewable source of value, the challenge becomes to provide incentives not only for job creation but also for the improvement of labor conditions on value-preservation activities.
6. Conclusions
This article aimed to reflect critically on the conceptualization behind the European strategy for the CE. To do so, it focused on the theoretical implications behind the choice and interpretation of the indicators proposed by the European Commission to measure progress towards CE in the EU. Although a detailed review of the entire body of documentation on the evolution of the European CE narrative was outside the objectives of this study, the comparative analysis of the main guidelines outlined in the European CE action plan and the metrics selected to form part of the MFCE corroborated some notions previously noted by the critical literature on CE. Several relevant aspects related to the environmental and social dimensions of the concept were found to be missing. At the same time, both the selection of metrics and the understanding of the first results reflect a bias towards the neoclassical environmental approach, which prioritizes growth and markets over reducing the detrimental impacts of economic activity on nature.
The development of a monitoring framework for the transition towards CE represents a unique opportunity to reinforce the most comprehensive and systemic meaning of the concept, in order to assess its real contribution to sustainability. It is therefore recommended to incorporate the indicators on energy, land and water use, and emissions, which are already included in other European policy areas. Also, efforts should be made to develop indicators to track the average durability of products, together with its main determinants, such as the extent of eco-design, repair, reuse, and collaborative consumption activities.
A systemic approach will in turn demand the development of new metrics and incorporation of dimensions, such as the institutional drivers required for transition to CE. This involves, among other things, an assessment of the evolution of legal and fiscal enablers and barriers to CE-related innovation, together with the resources and actions put in motion by UE innovation system to that end.
The lack of critical studies on the socio-economic implications of the shift towards CE promotes the diffusion of “win-win” non-conflict scenarios that lead to what has been depicted as “weak policy instruments and easily co-opted discourses of green capitalism and consumerism” [
4] (p. 90). Therefore, more in-depth research should be done on the effect of the CE on net employment and the qualitative analysis of new jobs and forms of public collaboration and engagement that emerge from the shift of paradigm in production and consumption. Also, the socio-economic consequences of international commerce of recyclable waste should be examined critically, paying special attention to the potential creation of “waste havens” [
46] and the uneven distribution of the social and environmental benefits of CE through the different territories.


