Environmental Assessment of Energy Scenarios for a Low-Carbon Electrical Network in Chile


1
Departamento de Computación e Industrias, Universidad Católica del Maule, Avenida San Miguel 3605, 3460000 Talca, Chile
2
Centro de Investigaciones Energéticas, Medioambientales y Tecnológicas (CIEMAT), Avenida Complutense 40, 28040 Madrid, Spain
3
Centro de Innovación en Ingeniería Aplicada (CIIA), Departamento de Computación e Industrias, Universidad Católica del Maule, Avenida San Miguel 3605, 3460000 Talca, Chile
*
Authors to whom correspondence should be addressed.
Sustainability 2019, 11(18), 5066; https://0-doi-org.brum.beds.ac.uk/10.3390/su11185066
Submission received: 14 August 2019
/
Revised: 9 September 2019
/
Accepted: 12 September 2019
/
Published: 17 September 2019
(This article belongs to the Special Issue Energy Scenario in the Context of Sustainable Development Goals and the Paris Agreement)
Abstract
:Nowadays, establishing clean energy sources is an undeniable need for all territories to reconcile energy and competitiveness objectives with those of security and sustainability. This article shows the main advantages of implementing clean energy sources in the long-term Chilean electrical network. The clean energy considered in this work is based on Renewable Energy (Conventional and Non-Conventional) with the backup of gas or nuclear. Thus, four scenarios are proposed and were simulated for the year 2050, the year assumed for the decommissioning of all coal plants in the country. These scenarios contemplate a high or low penetration of Renewable Energy. Additionally, a reference and realistic scenario for the year 2018 has also been considered to compare to the clean scenarios proposed. The results obtained coincide with the goals of reducing environmental impacts such as global warming emissions and fossil fuel dependence. However, the backup that was chosen for supporting the intermittence of renewable energy may have an important role in the main system considering the expected growth of energy demands in the near future.
1. Introduction
For a long time, energy has played an important role in industry and the economy. Furthermore, electric power is becoming an increasingly essential part of the whole energy. Currently, about 40% of the world’s commercially sold energy has been converted to electric power, and this proportion is increasing [1]. This increase in the demand and consumption of energy and the difficulties that exist to satisfy this demand with clean and reliable energy sources foreshadow a scenario of a global energy crisis. It is important to mention that the clean energy future, or the changing of the energy scenario to tackle global warming, is a compromise that was assumed by the Chilean Government, which is reflected in that Chile will be the host and organizer of the 25th session of the Conference of the Parties (COP25) [2]. Here, the main goal of the country is to get rid of coal and to become carbon neutral by 2050, producing at least 70% clean electric energy by means of Renewable Energy (RE). This was proposed in the recent national plan “Energy Policy 2050” [3] and was confirmed in the “2018–2022 Energy Roadmap” [4]. Furthermore, from an economic point of view, the scope of the national plan has also been to be between the three OECD countries with the lowest electricity generation cost. Nowadays, Chile is in the middle according to global petrol prices [5].
This path also implies that we should leave behind the country’s heavy and external dependence on fossil fuels. In fact, according to the Chilean Energy National Commission [6], in the national energy balance flows of 2017, around 62% of the total energy consumed in the country was imported (28% oil, 22% coal, and 12% gas). From these imports, around 50% (22% coal and 8% gas) was intended to produce electricity. Consequently, the use of clean energy can lead to reduced imports of fossil fuels, which may lead to a significant saving for the country.
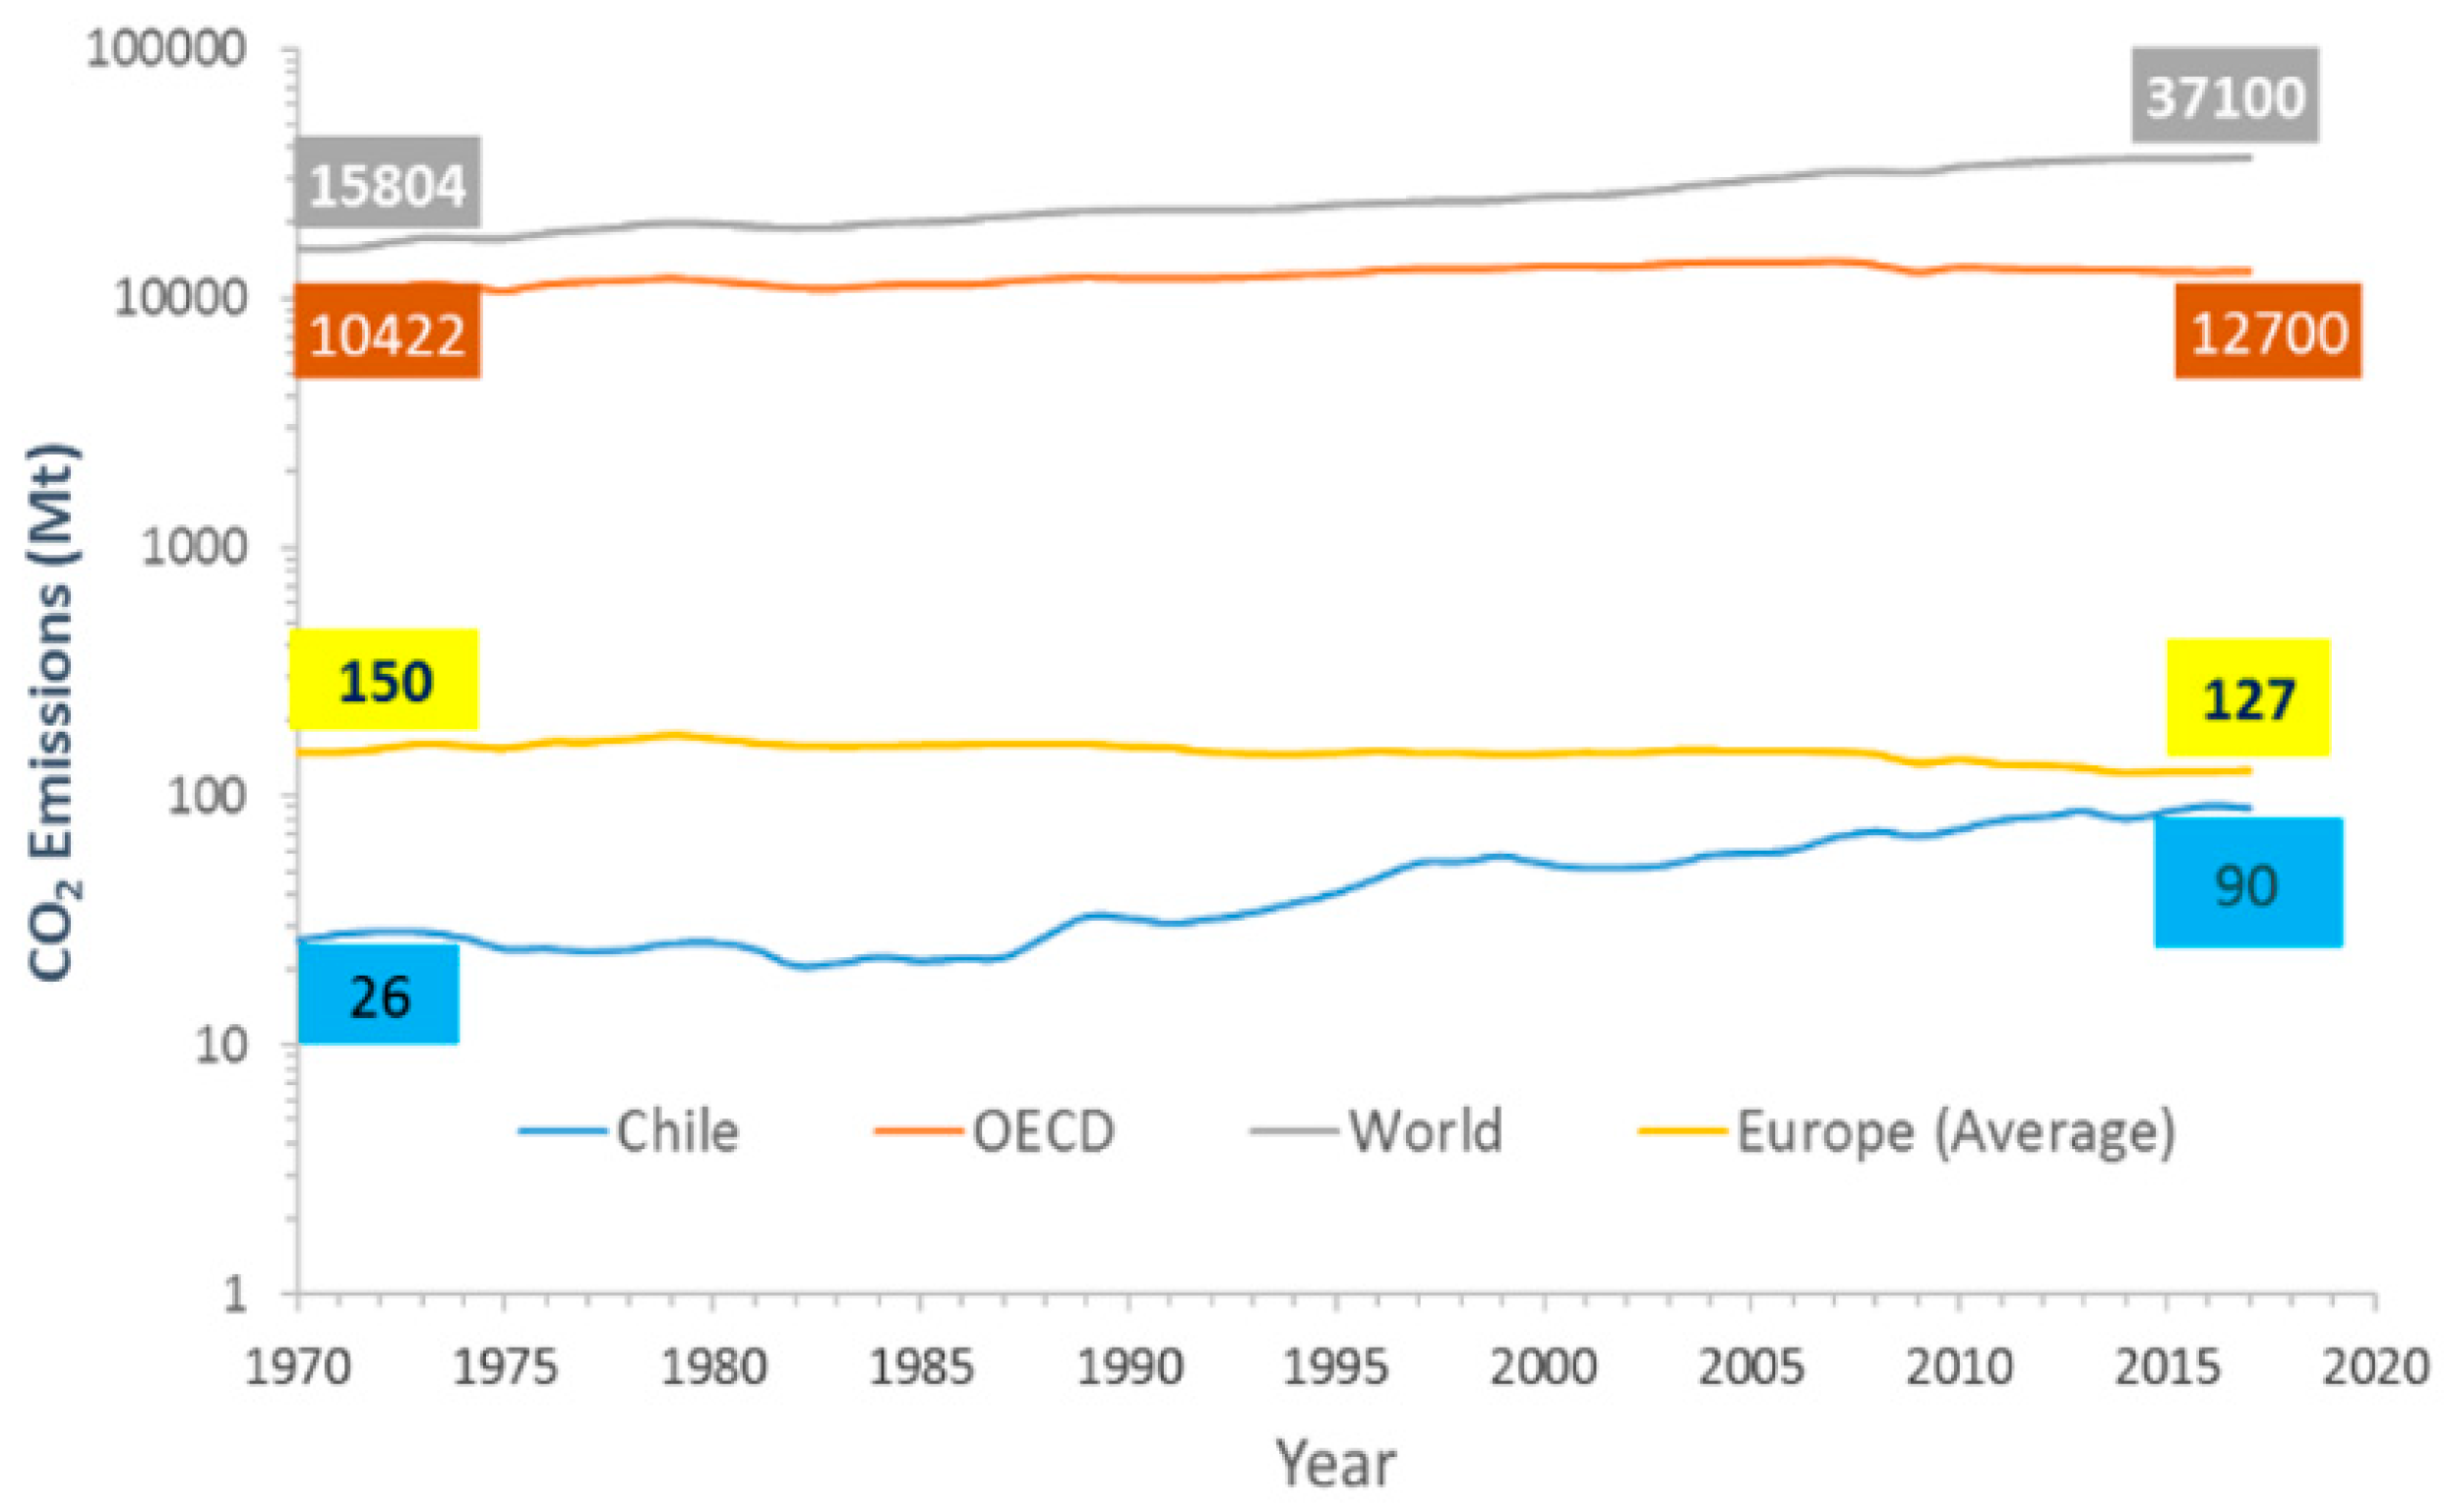
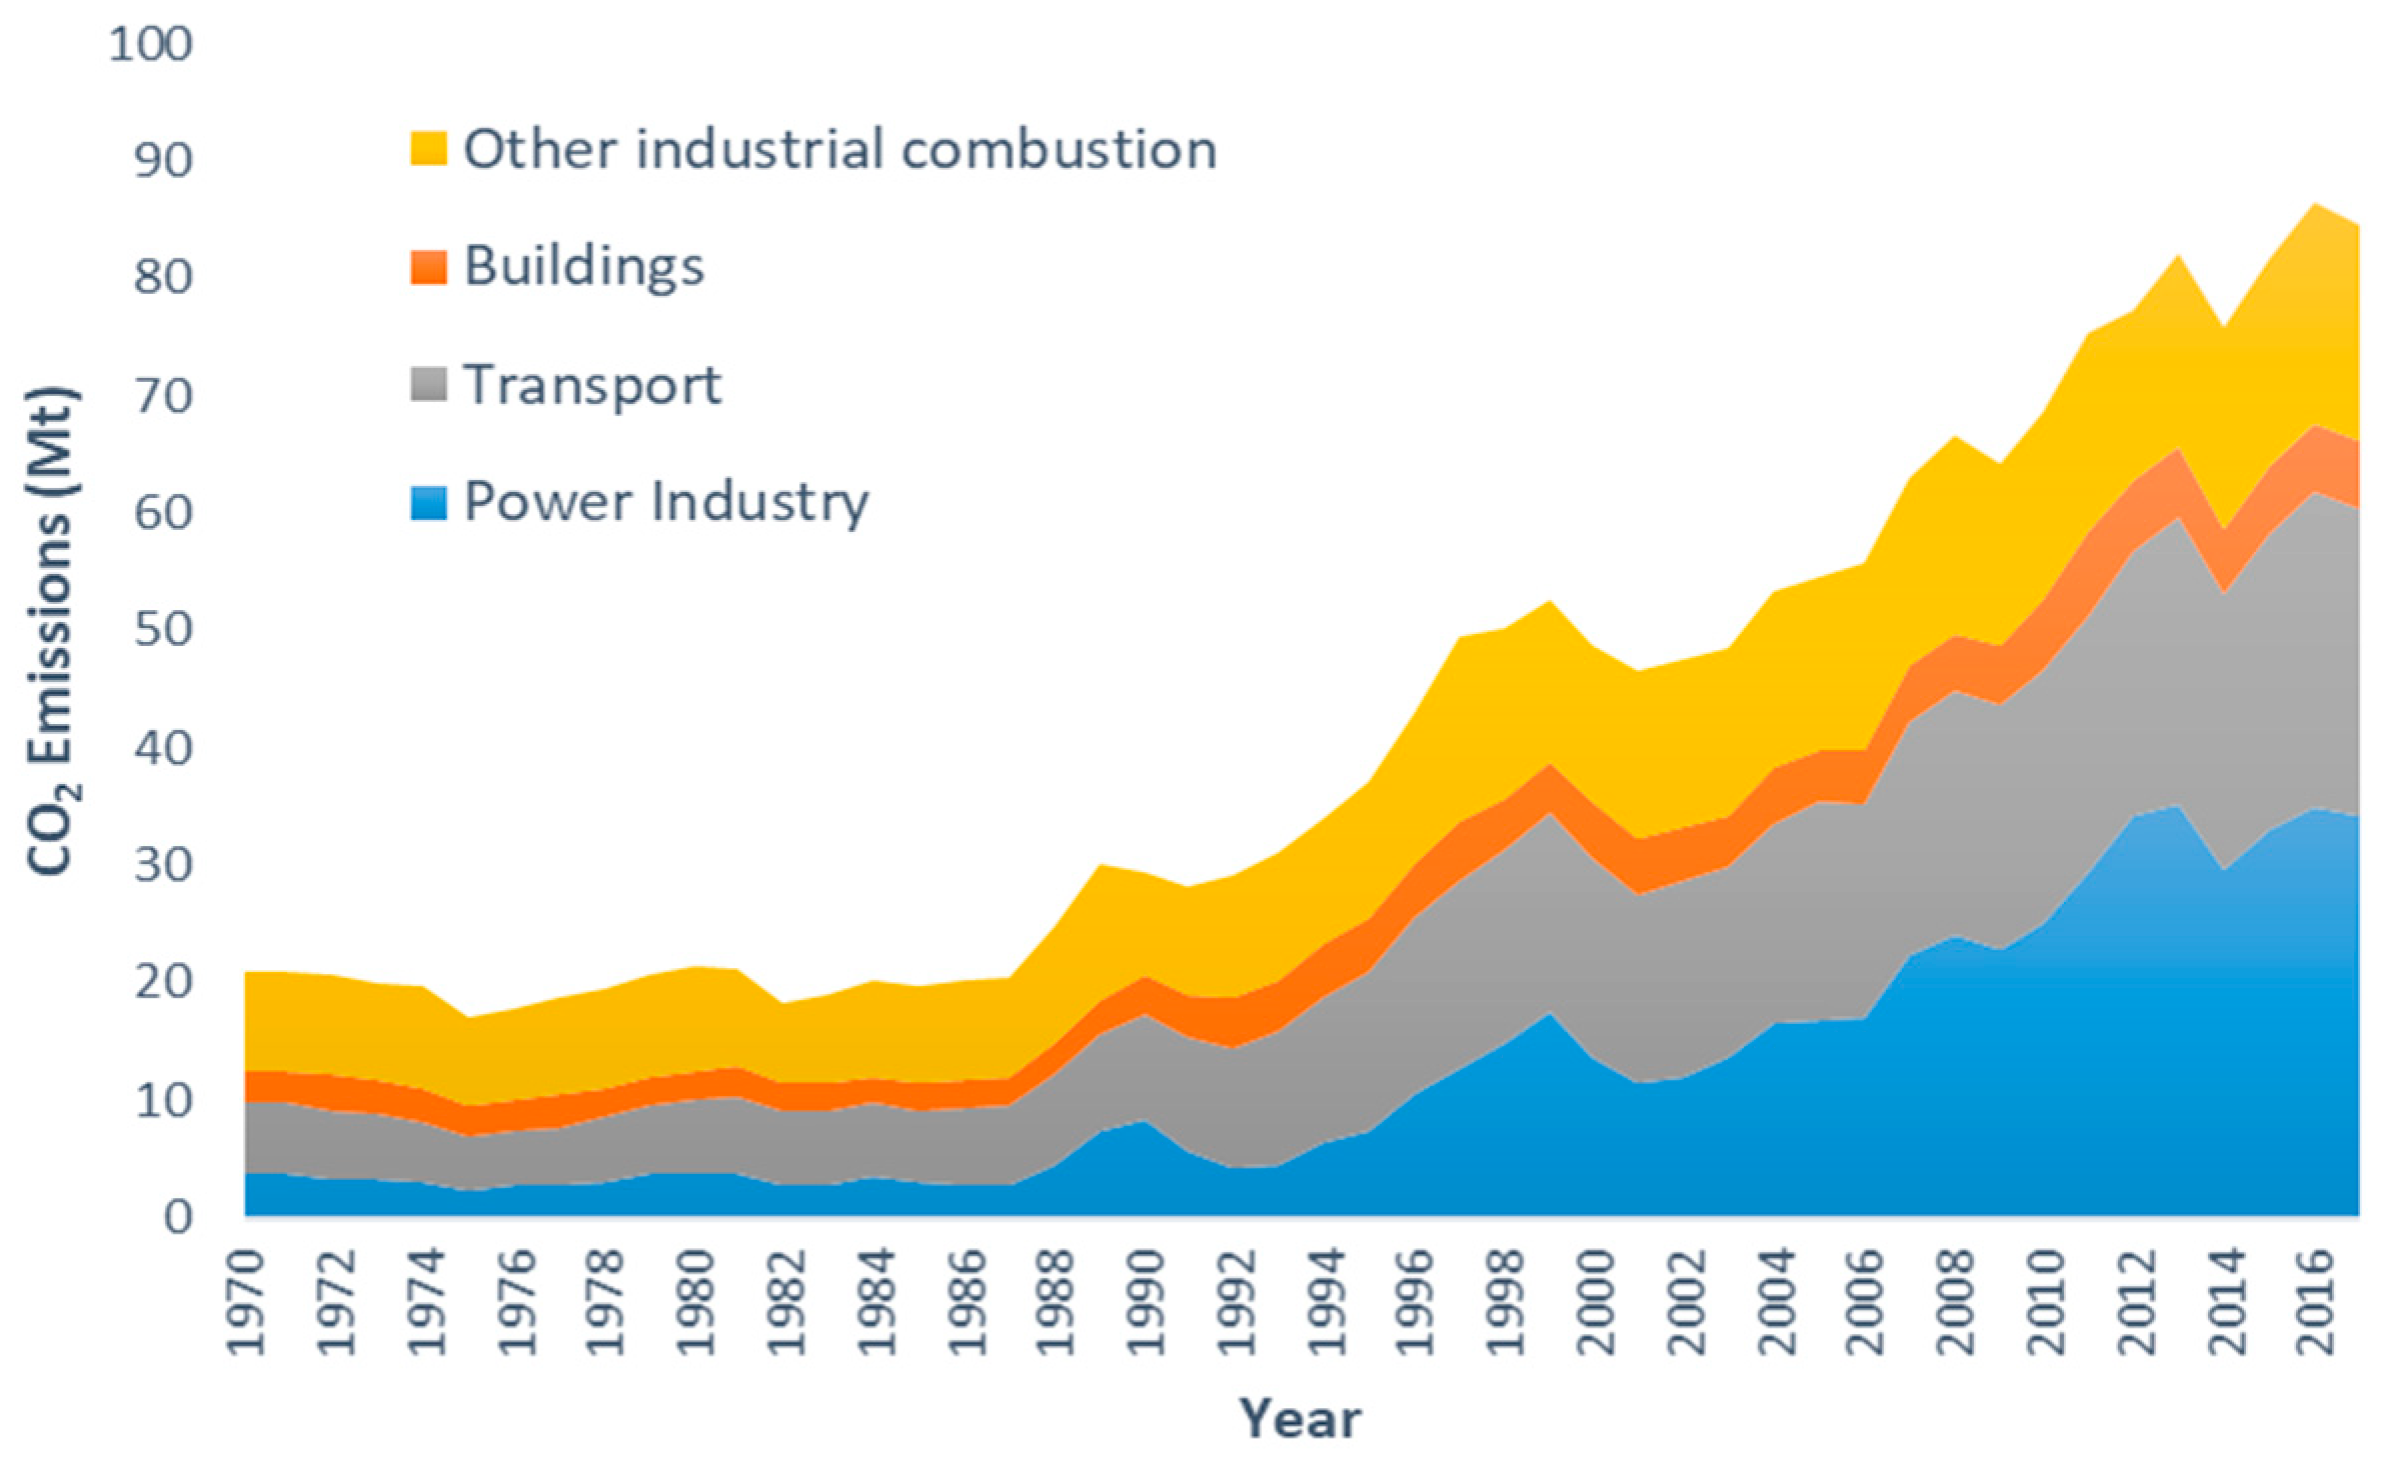
Additionally, governments regulate the environmental impact of electric power and specifically the Greenhouses Gases emissions (GWE). Particularly, the Chilean GWE are low at the worldwide level; indeed, according the Emission Database for Global Atmospheric Research (EDGAR) [7], it represented only 0.25% of what the total world released in 2017. However, it is very vulnerable to climate change. This country complies with seven of the nine vulnerability conditions, which places the country among the 10 nations most affected by this phenomenon, according to the Global Climate Risk Index 2014 report [8]. Figure 1 shows that the country’s emissions have been scaling up to reach 3.5 times the level of 1970, which is the opposite to many developed countries that are members of the OECD or Europe, of which is even slightly reducing its emissions (yellow line). This rise is mainly due to the increase of emissions of the electric power generation industry, which represented around 40% of emissions in 2017, and the increase of the transport industry, which contributed 30% of the emissions. This is shown in Figure 2 in the blue and grey areas, respectively. Furthermore, since the transport sector is one of the government targets to become electrified by 2050 (40% for private and 100% for public transport) [9], it is estimated that the electricity needed would be around three times the production of 2018 [10]. Therefore, the reduction of both the electric and transport industry emissions can be considered as the key for a clean future.
2. Background
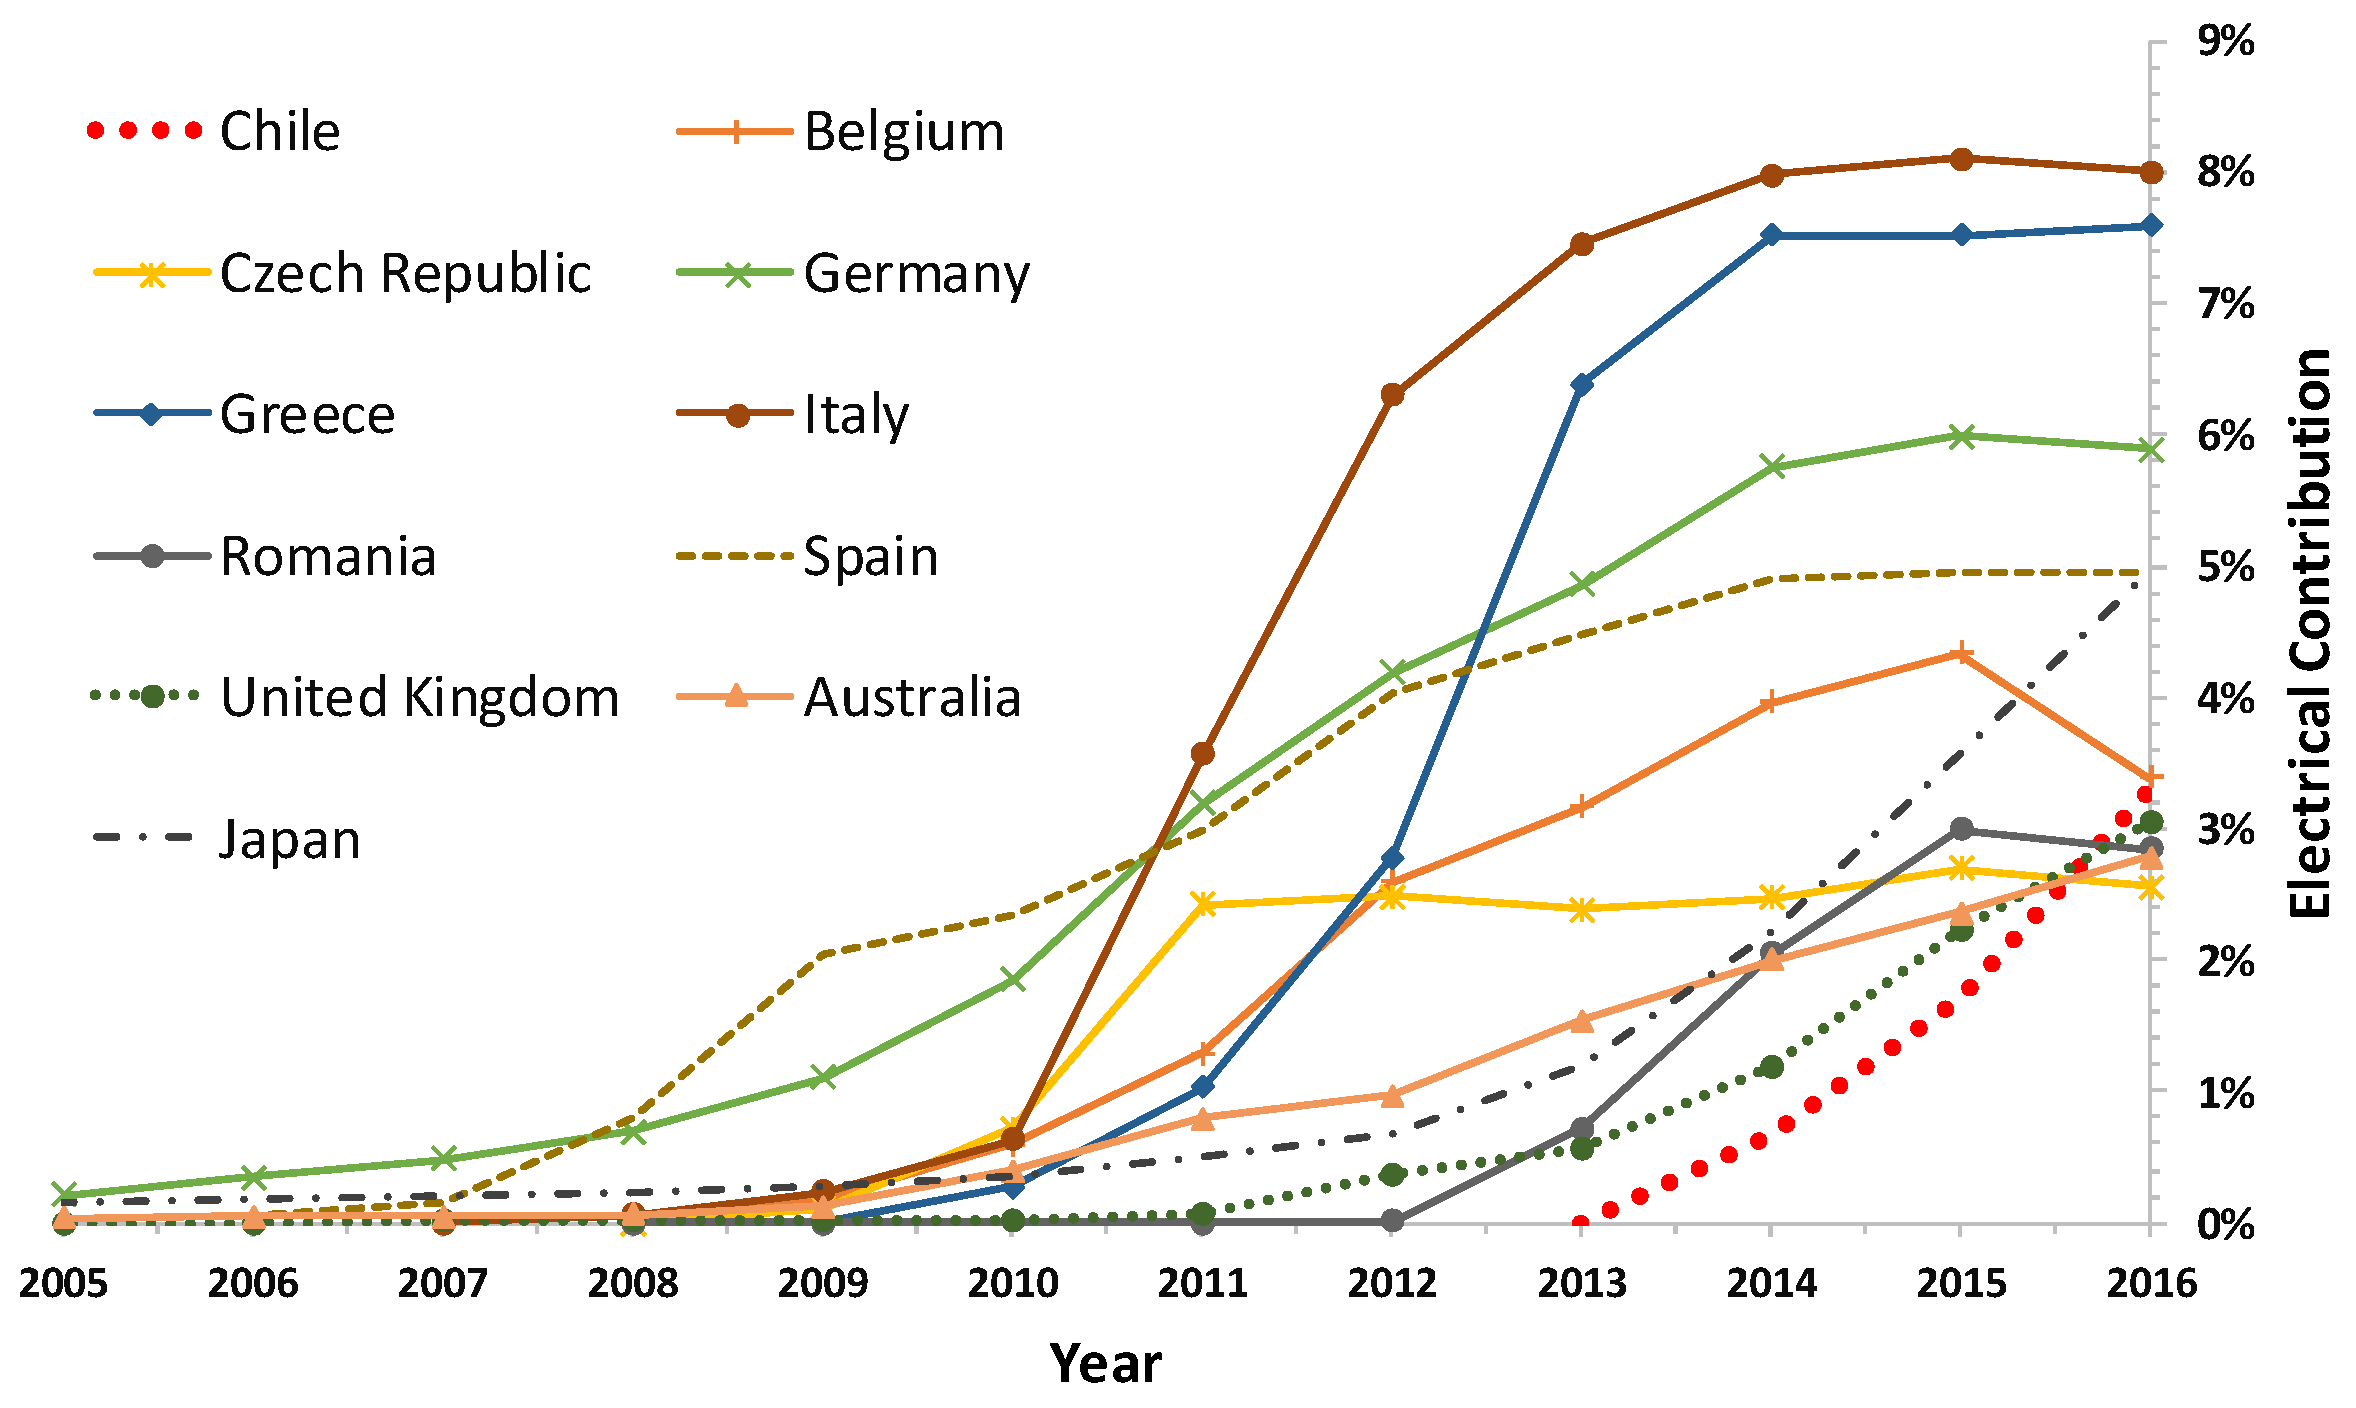
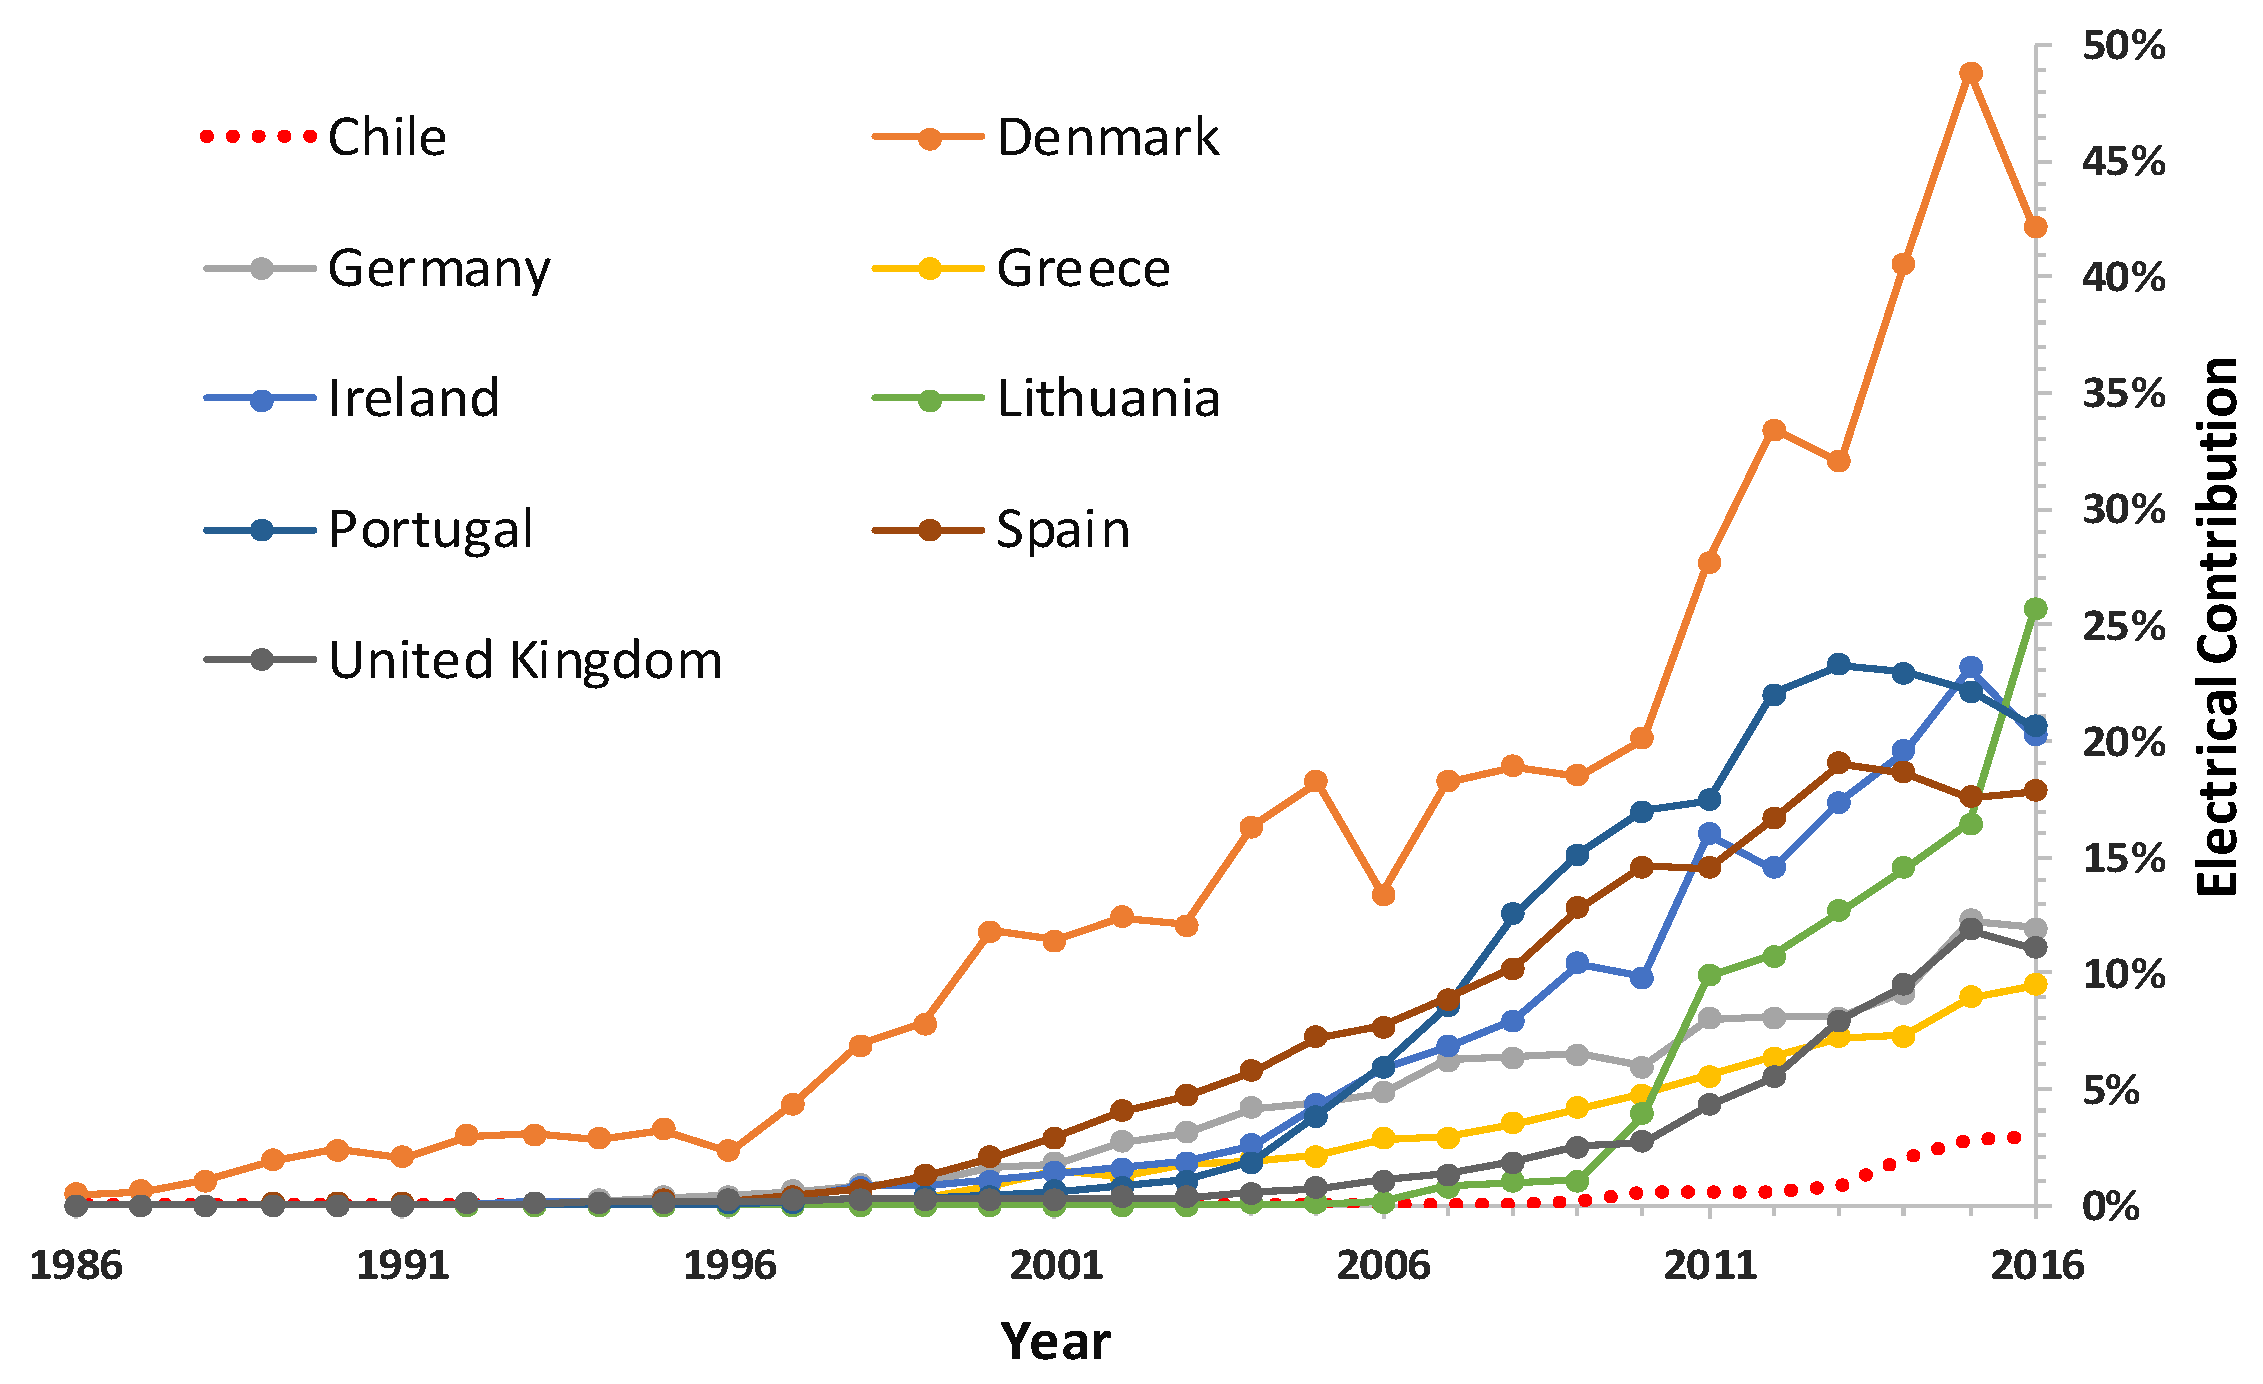
Although clean energies, such as wind, solar, biomass, and geothermal power, are still considered as Non-Conventional Renewable Energy (NCRE) sources, they are showing that they will be part of the conventional sources, therefore the scenario for a low carbon energy system in Chile looks promising in the short/medium term. According to several studies [11,12,13], the solar power potential in the north could supply most of the demand for several decades and in the south, wind and marine current power energy may also be auspicious. In fact, many companies are investing in these technologies with sight of the “sustainable” tag for their products, taking advantage of the well-known decreased investment cost [14,15]. Further, Chilean laws are also helping to deploy them and new grids are being created or interconnected for avoiding energy loses to take the most from renewables [16]. These facts, among others, are pushing for a significant increase of the installed capacity of these types of sources that have been contributing over the last 10 years around the world, such as Figure 3; Figure 4 show for solar and wind, respectively [17,18]. However, an overestimated electric system is a sustainability problem. In fact, countries with larger capacities than requirements tend to lose resources, especially when solar and wind have a big weight in the system without storage capacity [19]. When weather conditions are good enough, the electric output may exceed the demand, creating conditions for selling the electricity at zero or negative prices during a number of hours [20,21]. In deregulate markets, this problem can be considered a financial and operational disadvantage, reducing the interest for investment in these technologies.
Additionally, there is an economic issue to solve before getting rid of fossil fuel by using NCRE. Although a range of studies differ about the dichotomy between a low carbon energy mix and low generation cost, they have been based, mainly, on data taken from the immaturity of wind and solar. In fact, the path to reducing fossil fuels dependence in the past has required the development of strategies that included technologies that lacked reliability or, from an economic point of view, were not competitive as they are nowadays [13]. Therefore, further researches are needed to understand the role of new energy sources, technologies on generation costs, and the reliability of the system. Additionally, the role that will play baseload NCREs, such as geothermal and biomass, need to also be studied [22], although the potential of these sources seems to be low and well understood [10].
Another issue has to be taken into account before the further deployment of the new energy sources. Despite huge investments in renewables, many developed countries are only reducing their direct global warming gases (GWG) baseload electricity emissions by replacing coal with gas, which is the “natural” backup for intermittent sources such as wind and solar power, in cases where no storage capacity is available (dams, batteries, fuel cells, etc.). However, although its contribution to GWG is roughly half that of the coal [23], studies show that leaking problems can lead to discharge that is similar to more GWG than coal [24,25,26]. Other countries that have strongly opted for NCRE, like Germany, Denmark, and the US, are still using coal as a baseload source. In fact, Germany is a case that summarizes the complex scenario that Chile could face. In fact, during the spring of 2017, 40% of Germany’s electricity was provided by coal, despite the 45% installed capacity of wind and solar (90 GW) [27].
To solve the intrinsic dependence that renewable energy without storage has on fossil fuels, new nuclear power plants are expected to be deployed in the next decades which are known as Small Modular Reactors, or also Small and Medium Reactors (SMR), belonging to the Generation IV of this technology [28,29]. The advantages of these new reactors, besides their inherently safe designs, are their capacity of load following [30] and fast and modular construction [31], which is very important when they are part of a mix like the one proposed by Chile. However, although there is no plan to build them in the short–medium term in Chile, its deployment is not restricted and further studies will be needed for the country, most of which will be led by the Chilean Nuclear Energy Commission. It has to be mentioned here that since this source emits very little GWG, it is considered a clean energy source [3]. So, that SMR option will also be included to complete different scenarios that can possibly be deployed by the 2050 horizon.
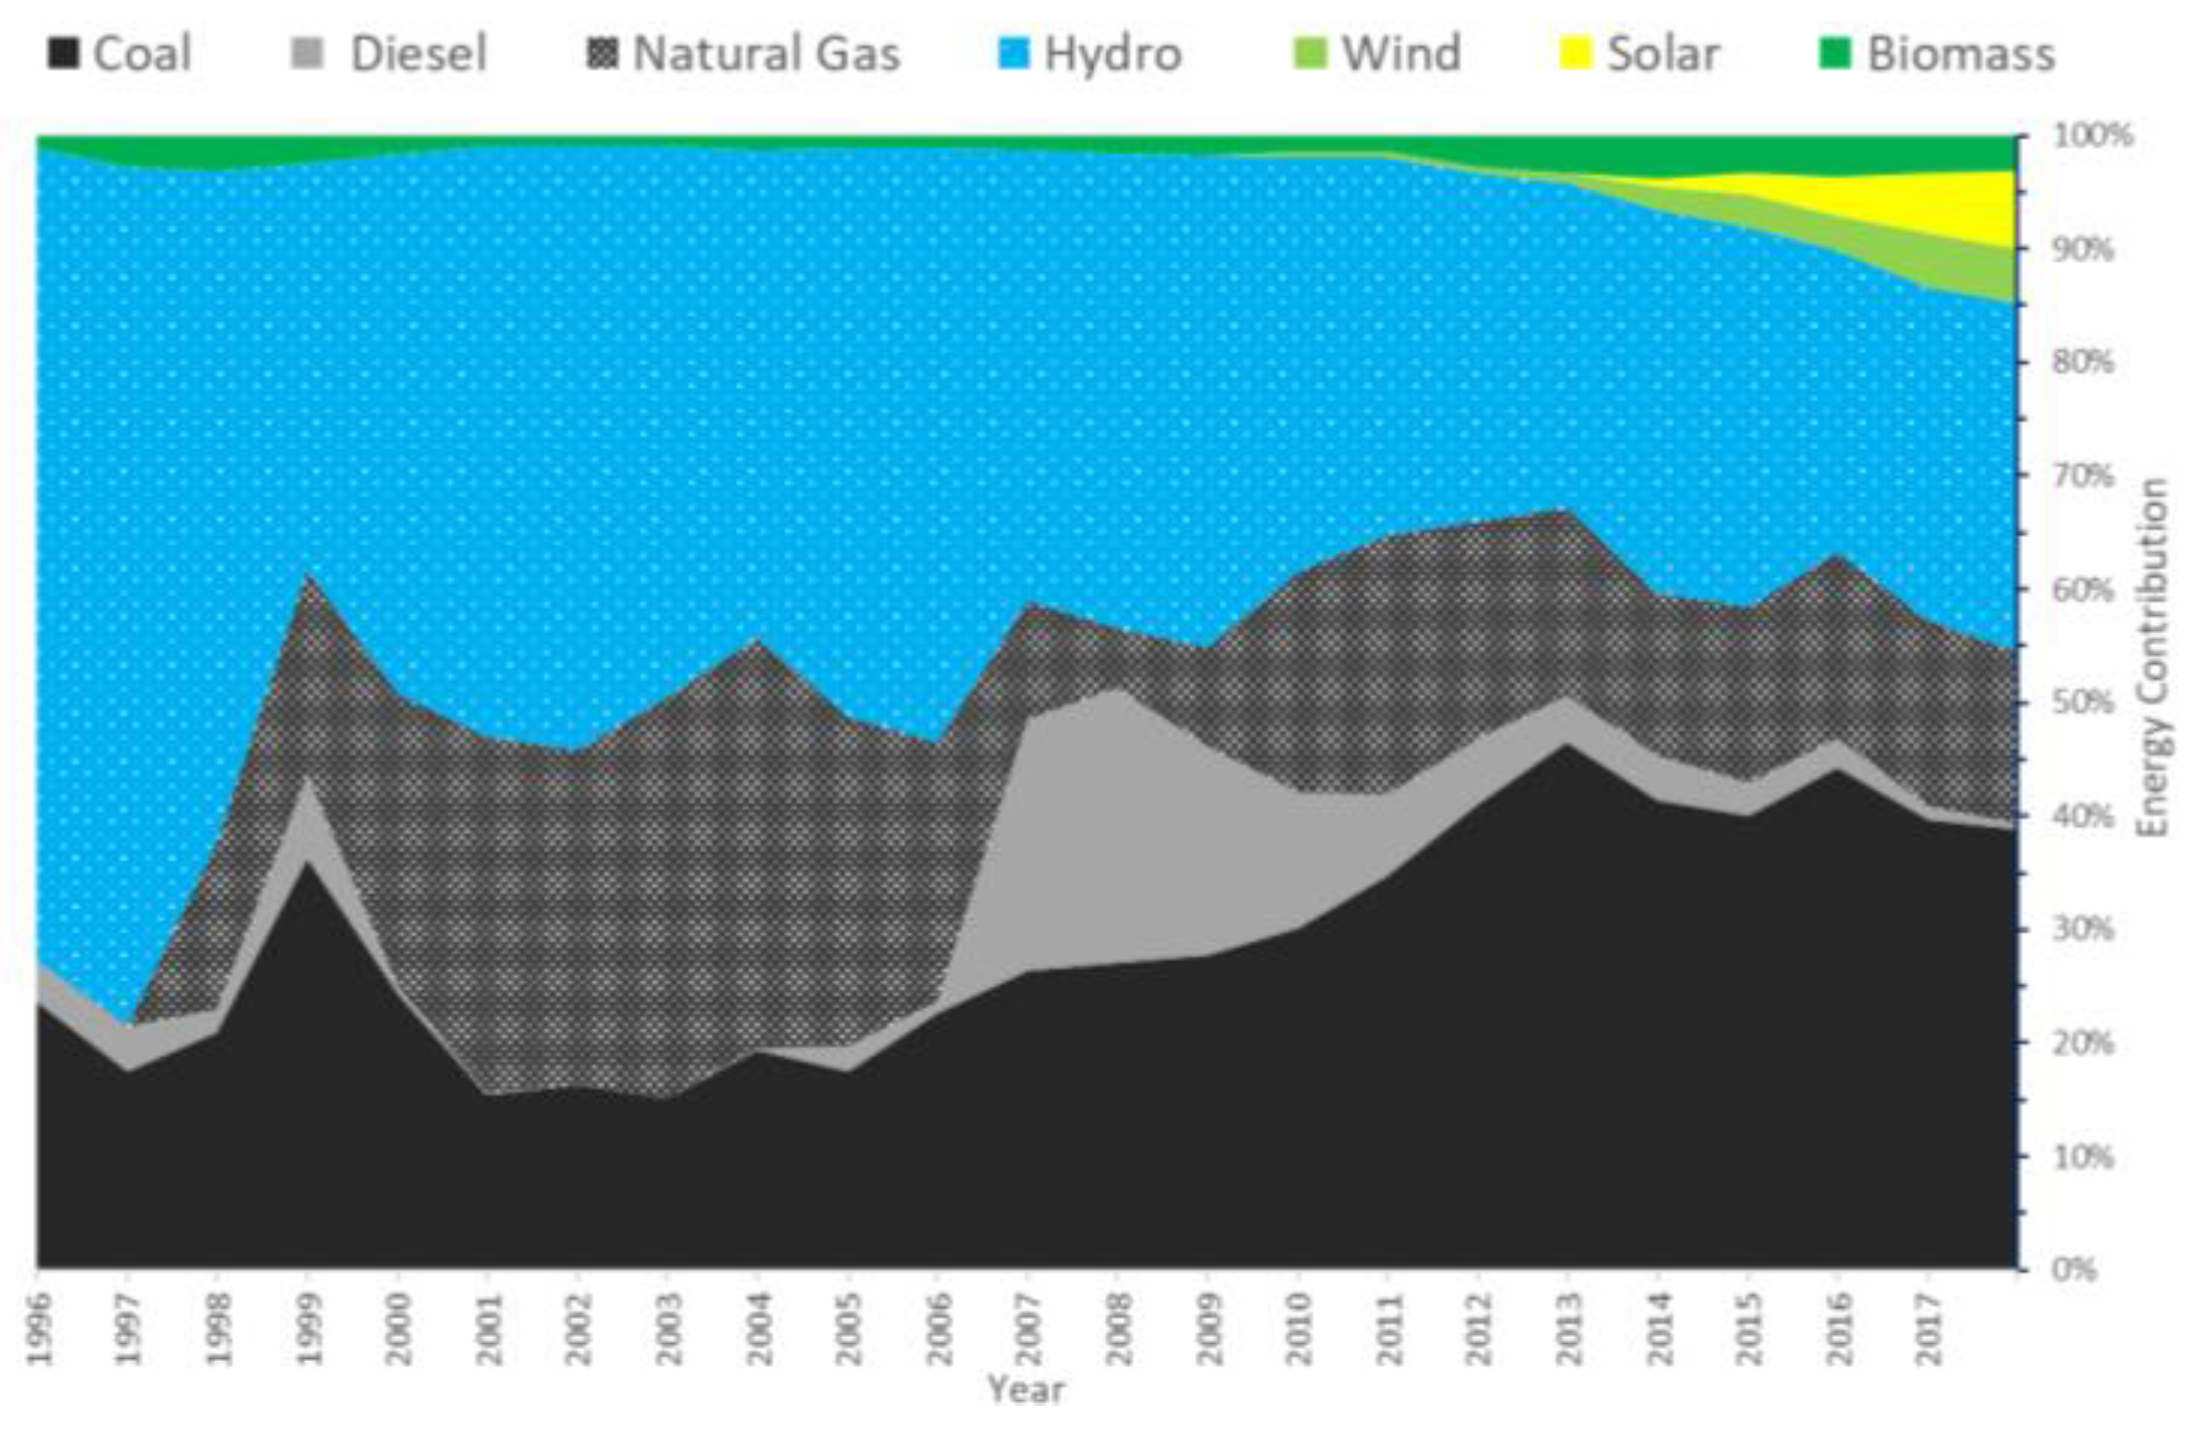
Regarding the Chilean electricity system, the Chilean Energy National Commission of the Ministry of Energy provides valuable data for seeing the context of the current electric mix production [32]. As Figure 5 shows, before this century, hydropower was the main clean energy source; however, it is clear that fossil fuels sources (all presented in grey) have been increasing their contributions along the time to the detriment of hydropower, generating 55% of the electricity in 2018 (with a peak of 67% in the year 2013). Fortunately, the eruption of clean energy sources, such as solar, wind, and biomass, has broken that tendency and they contributed 15% during 2018, although this mix share is not enough to reduce the GWE emissions, which are still increasing (see the blue area in Figure 2). In summary, the information presented in these figures represents the first problem to solve. On one hand, the growth rate of clean energy that is required to compensate for the increase of the electric demand and, on the other hand, the required decommissioning rate of fossil fuels plants to accomplish the environmental goals maintaining the resilience of the system.
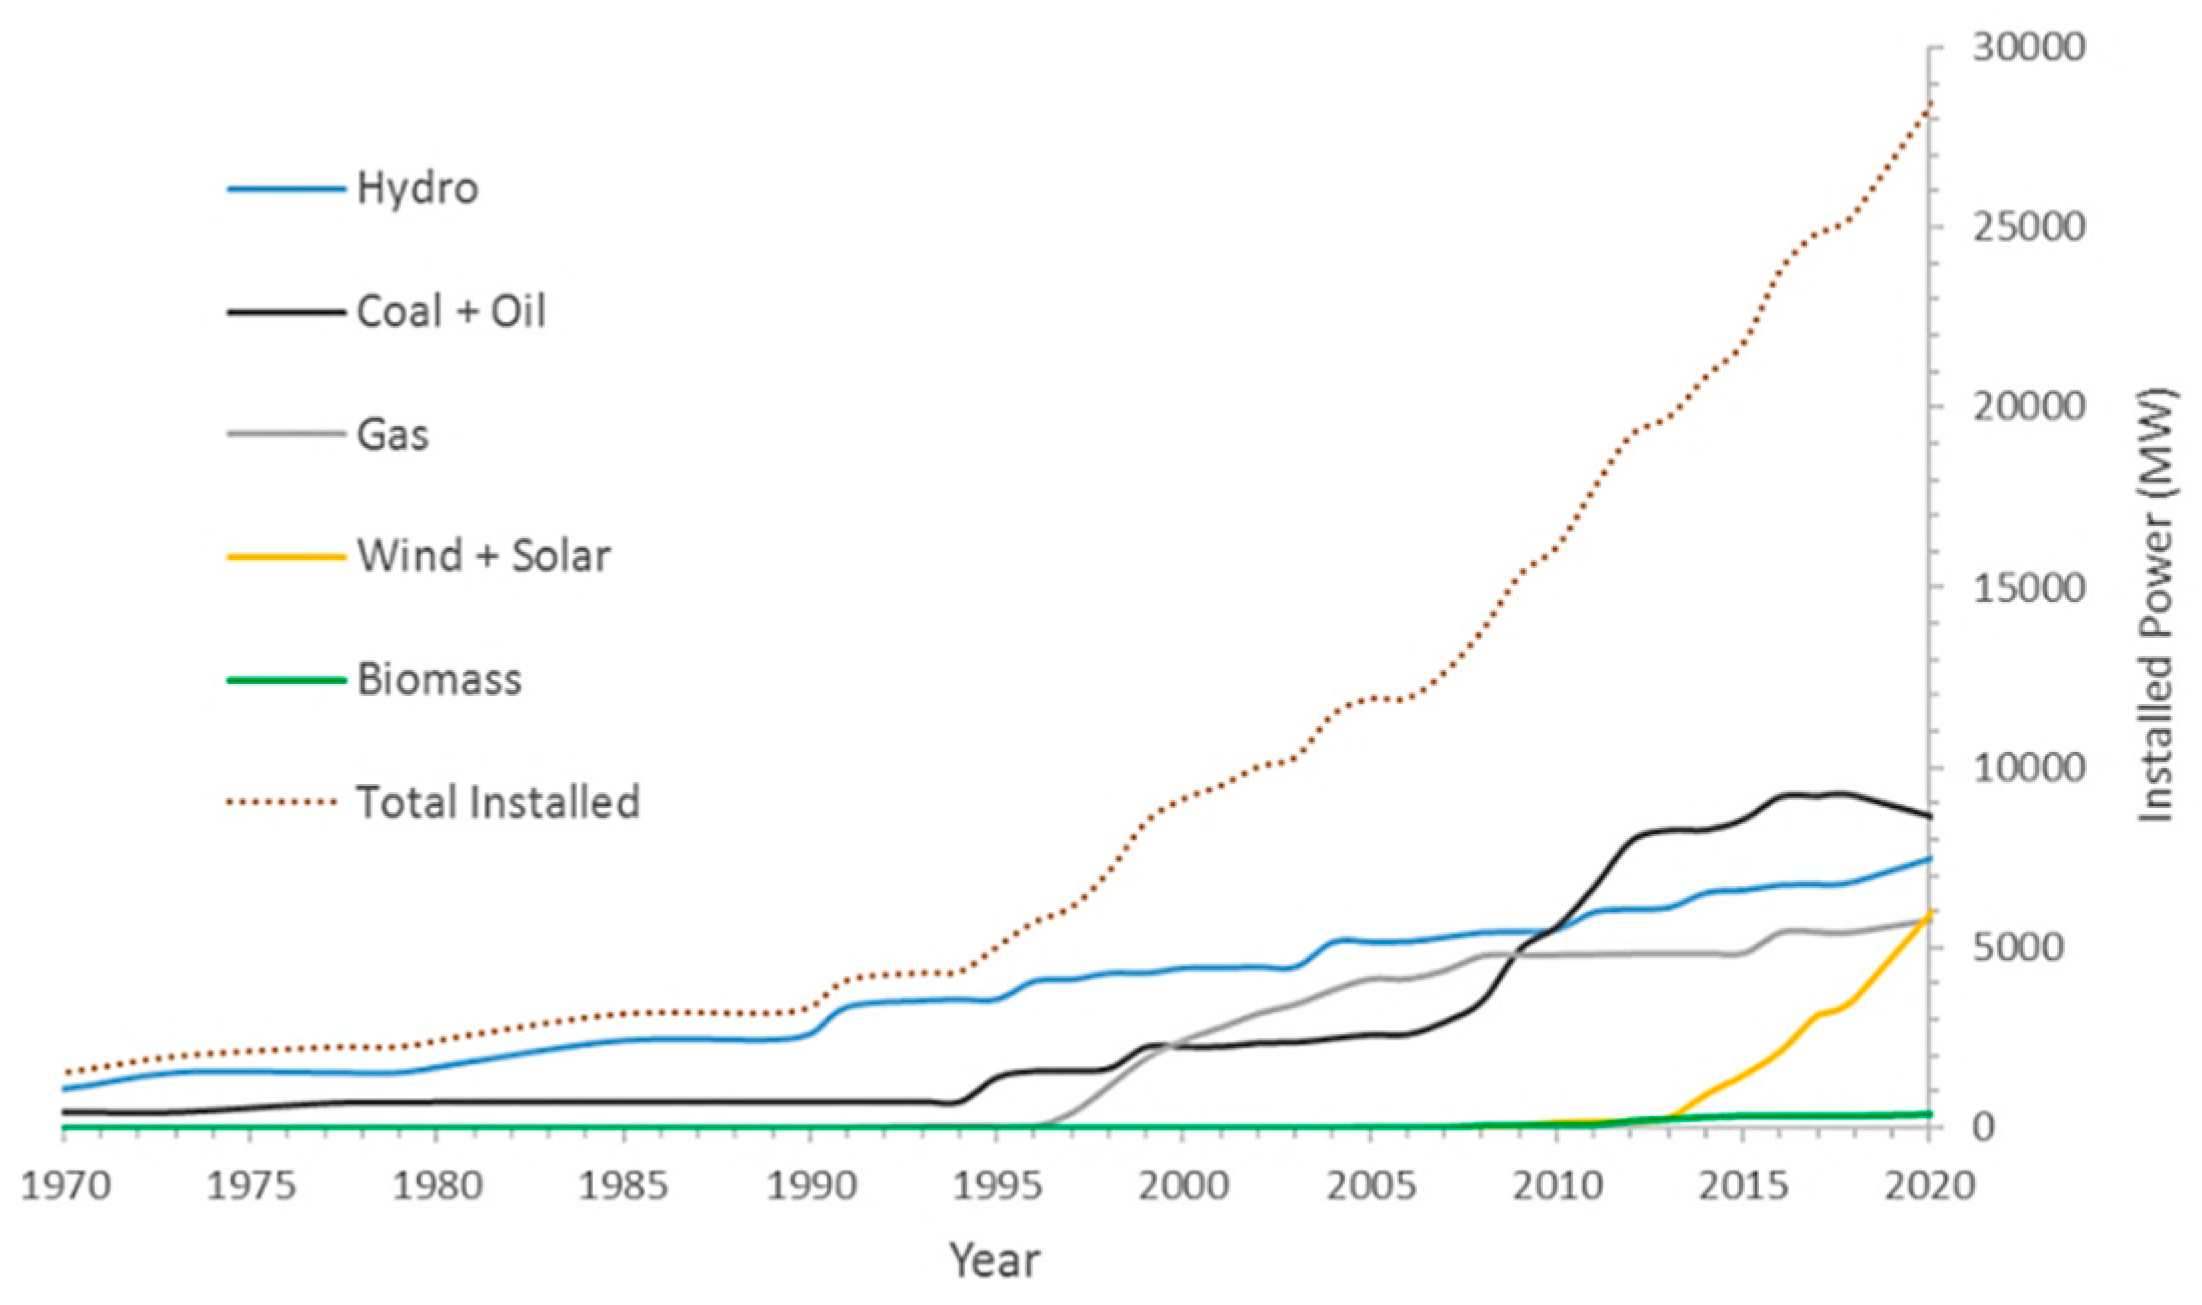
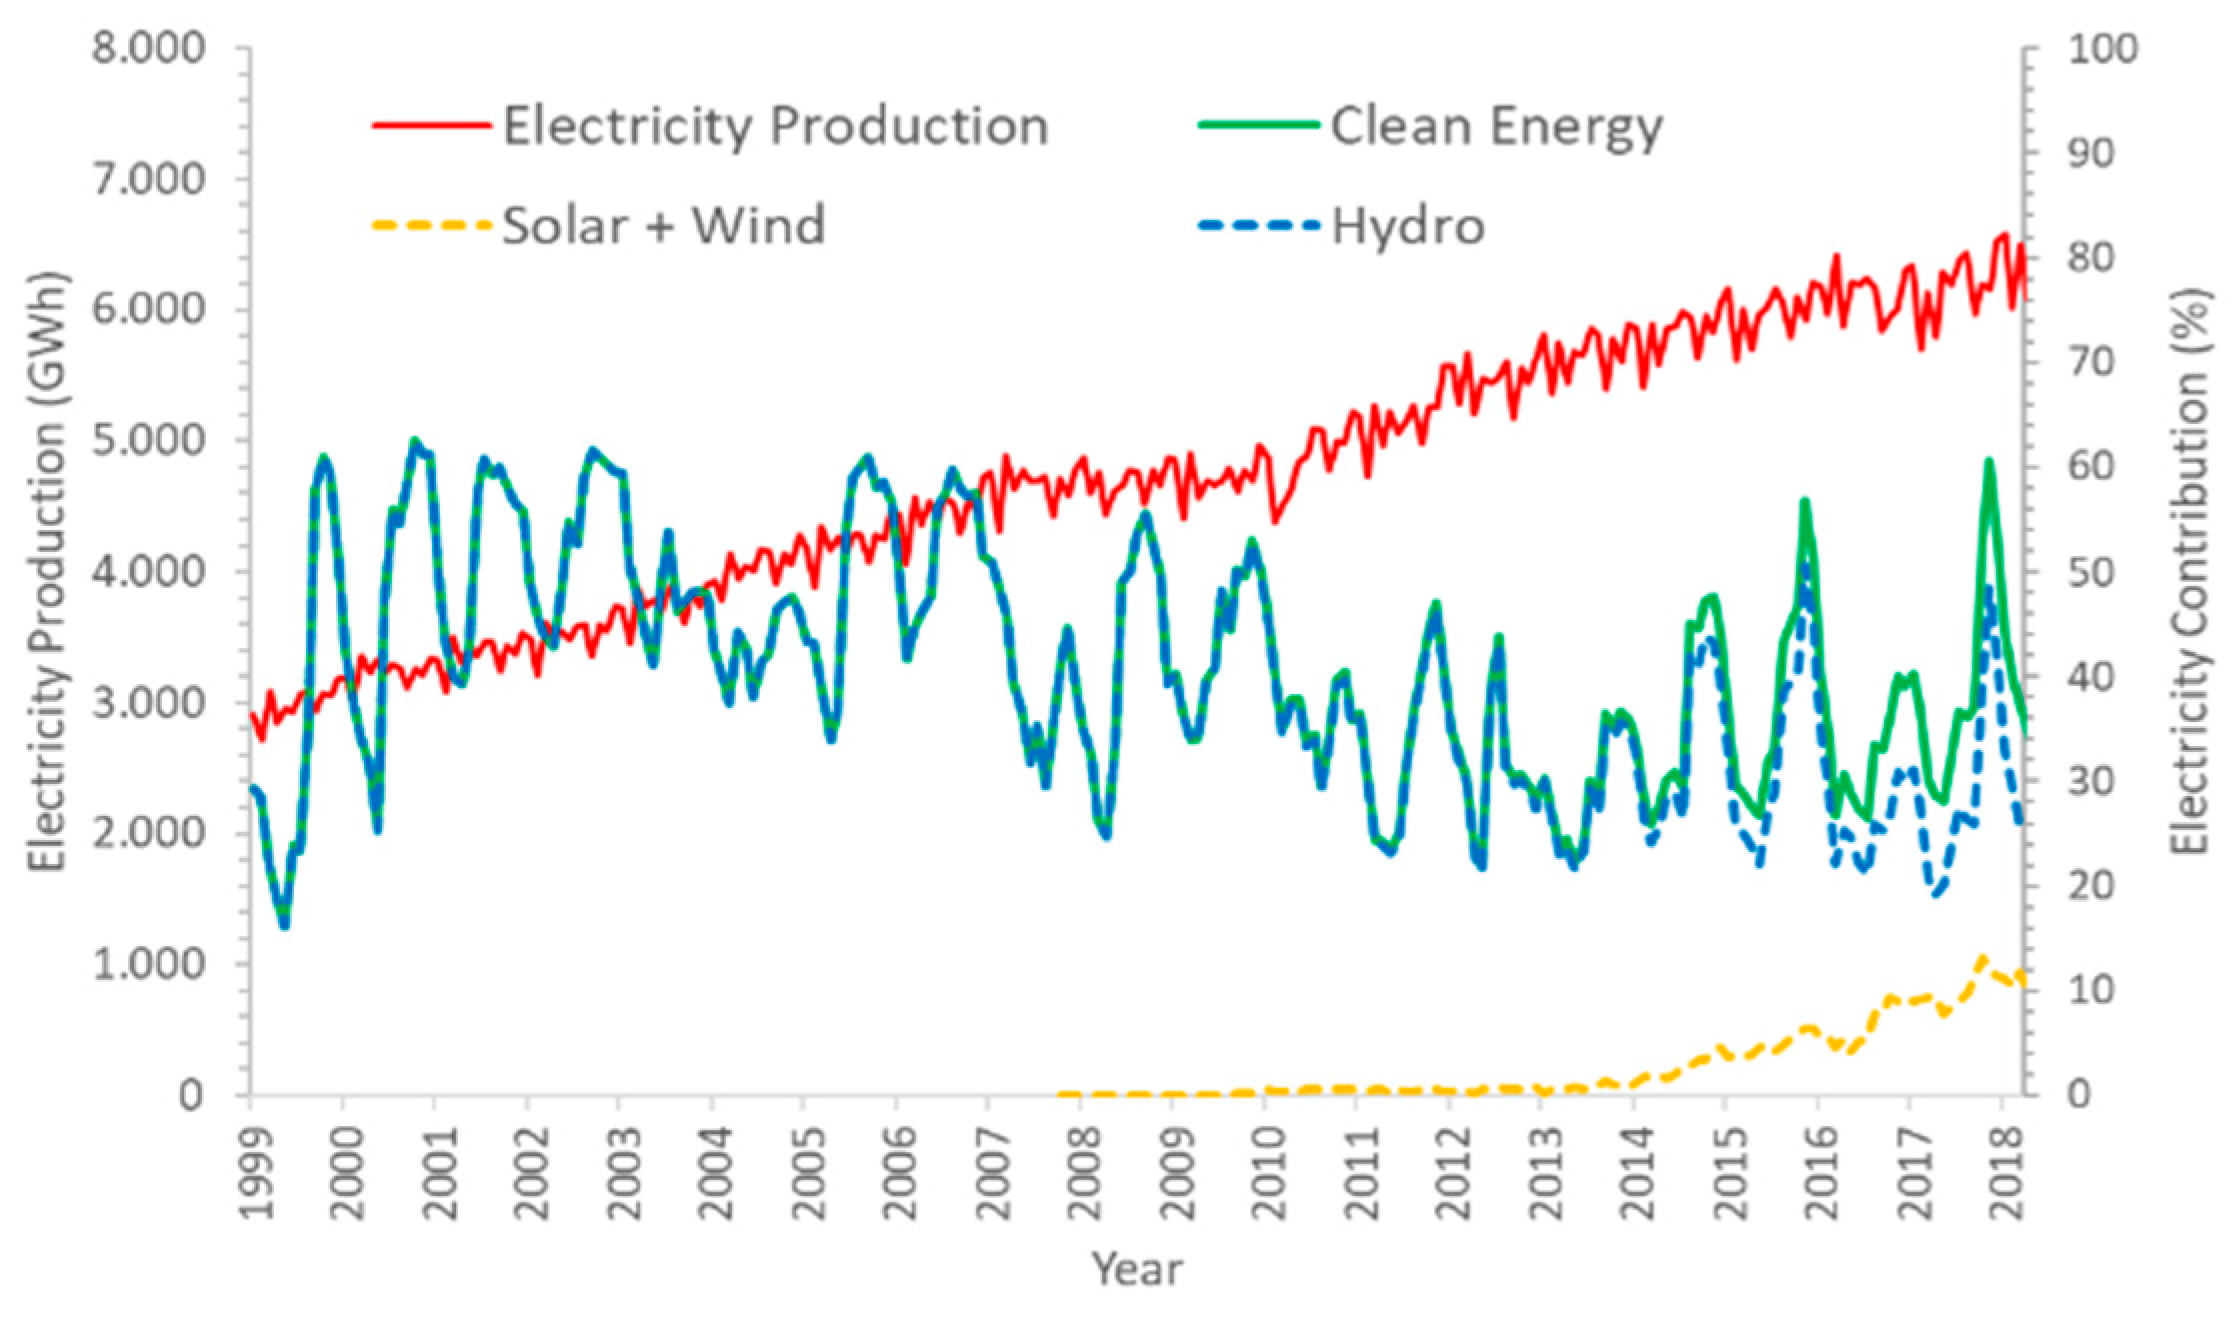
Although the deployment of the NCRE in Chile is just starting, the targets of reaching high levels of penetration of these technologies are not well known. However, international experience (see Figure 3 and Figure 4) shows that the evolution of solar and wind electricity contribution to the total electricity generated undergo similar behaviors. There is a fast exponential increase in many cases and a plateau effect after a few years running. Therefore, according to the data presented for both solar and wind, deployment may not be fast enough to reach the 2050 target. This statement could also be intensified when considering the constant decreasing of the hydropower. As stated previously, hydropower has been a clean energy source in Chile. However, despite the constant increase of its installed capacity, as Figure 6shows with the blue line and Figure 7 shows with the dashed blue line (plotted against the left axis), hydropower generation shows a decreasing trend. This decrease is mainly because its contribution cannot compensate for the increase of the electric demand, which is shown by the red line (plotted against the right axis). Additionally, its behavior is highly dependent on the season. In fact, it is possible to see that hydropower production can drop more than 50% between summer and winter. Nevertheless, both solar and wind, despite their exponential commissioning (yellow line), are slightly backing up the constant decrease of clean energy, gathered in the green line.
It should be noted that Chile, due to its geographical characteristics, has the possibility of generating electricity from all existing renewable sources. On the other hand, this study is the first one that includes renewable mixes along with advanced nuclear technology on a national level. Therefore, this study could be the starting point for further studies related to eradicate fossil fuel from the electrical network and the energy mix. Furthermore, the main goal of the study is to analyze different clean scenarios of the Chilean electrical network by 2050, identifying, analyzing, and quantifying the environmental impact of electricity generation, such as global warming impacts, land use, fossil fuels dependency, and others factors. Additionally, a reference case based on the year 2018 will also be studied to compare the main advantages when applying clean strategies of production.
3. Materials and Methods
All data collected regarding national electricity production comes from the Chilean Energy Commission and its related databases [32]. Thus, the scenarios proposed have taken into account the evolution of electricity and the growing estimations of the Electric network coordinator [16].
The main portion of the study was prepared according to the analysis of the electric generation technologies applying the methodology of Life Cycle Assessment (LCA). The LCA technique is commonly used to analyze the environmental cost and benefits of climate-mitigation options in electricity generation [33]. LCA is a systemic methodology with the main goal of quantifying the potential environmental, described in ISO 14040 [34] and 14044 [35], and expressing the results for 1 kWhe.
To summarize, the LCA consists of four stages [36]:
- Defining the purpose and scope—at this stage, the functional unit, the boundaries of the system, and the basic assumptions of the analysis were established.
- Life Cycle Inventory (LCI)—included inventory of all the data necessary for the LCA analysis.
- The Life Cycle Impact Assessment (LCIA)—consisted of the calculation of the environmental impact category.
- Interpretation of the results.
To perform the LCA analyses, the software SIMAPRO 8 [37] was used. This software was developed by PréConsultants for the Life Cycle Analysis (LCA) to analyze and compare the environmental aspects of a product in a systematic and consistent way, following the recommendations of the ISO 14040/44 standards. SIMAPRO has been run along with ECOINVENT 3, which is a database of consistent and transparent up-to-date Life Cycle Inventory (LCI) [38,39,40]. The Tool for the Reduction and Assessment of Chemical and other Environmental Impacts (TRACI) was used as an environmental impact assessment method. TRACI is a midpoint oriented life cycle impact assessment methodology. It includes classification, characterization, and normalization [41,42].
The function performed by the studied electrical network consists of supplying electricity to the country through the generation of electricity produced by different technologies and sources taking into account the reach of the cradle-to-grave.
For the installed capacity and the use of land impacts, most of the load factor parameters of the energy sources were taken from the Chilean Energy Commission database (due to the particular Chilean conditions) as an average of 5 years of history and calculated as the energy produced divided into the installed power. These values are summarized in Table 1(in parenthesis, those which are not available in the current Chilean mix and taken from the US Energy Information Administration [43] for fully operational Gas, Nuclear, and Geothermal plants). Note that for gas, two values are available: 29%, which is the current load factor in Chile, and 54%, the one that will be used for the proposed scenarios. Additionally, Table 1 shows the use of land per energy source taken from [44], which approximates the land used during resource production, by energy plants, for transport and transmission, and to store waste materials. Only the greatest contributors are taken into account here. This way, hydropower run-on-the-river (ROR), Geothermal, and Biomass are excluded. Note that the Biomass for the Chilean case comes from the forestry industry waste production and no biomass crops are foreseen to be used in the future for electricity generation.
Scenarios Definition
Five scenarios have been proposed to be studied. SC-1 is the reference scenario, which considers a total electricity production of 75 TWh for the year 2018 and it is based on the current Chilean network mix. The next four are proposed for the year 2050 based on the renewable energy potential [11,12,13]. These scenarios reach a total electricity generated up to 225 TWh due mainly to the increases of the electricity demand (three times the current one [16]). SC-2 and SC-3 are based on the National Electrical Coordinator projections [16] and SC-4 and SC-5 are based on tentative projections of the authors, considering historical Chilean and international trends for clean energies [17,18,32].
Table 2 shows a brief description of the scenarios, meanwhile the electrical contribution of each one is shown in Table 3. No scenario considers backup storage directly, such as batteries or pumped storage power plants. However, they can be assumed implicitly in the calculations, since these options would have a very small role in the mix.
4. Results and Discussion
Although the scenarios simulated are, in fact, a simplification of the reality, the current scenario (SC-1) is consistent with other more detailed LCA studies [45,46]. Therefore, it can be assumed that the clean scenarios proposed can be compared to the reality.
As a summary, Table 4 shows the main eco-indicators to show the reduction (or increase) of the indicators per scenario. Each scenario has been compared in percentages to the reference scenario (SC-1). For eco-indicators of human health (carcinogenic, non-carcinogenic, and respiratory effects), clean scenarios are very promising. The maximum impacts of eco-indicators: carcinogenic, non-carcinogenic, and respiratory are 2%, 7.7%, and 0.5%, respectively. These scenarios could lead to a significant reduction of premature deaths and a saving in medical treatments. In addition, the impact of ecotoxicity and eutrophication is drastically reduced in clean scenarios. The reduction of the ecotoxity implies a pollution reduction that affects organisms and their ecosystems. In eutrophication, the mass of Neq is less than 1% with respect to SC-1. This decrease in impact is due to the fact that new scenarios do not consider the use of coal in the generation of energy. Therefore, there are no emissions of NOx and SOx, which react in the atmosphere, producing acid rain, bringing nutrients to masses of water. So, smog and acidification eco-indicators are between 0.9% and 15.6%. Smog refers to ozone which is formed due to the interaction of volatile organic compounds and oxides of nitrogen in the presence of sunlight [47]. Ozone is located in the upper atmosphere and at the ground level of the earth, which has severe effects on sensitivity vegetation and ecosystems, including forests, wildlife, trees, and plants as well as causing human health effects such as skin cancer, cataracts, and serious breathing problem [41,48]. Therefore, a reduction in smog carries a great benefit for the ecosystem and human health. Acidification exceeds 8% in scenarios that consider the use of gas. This is an environmental problem caused by acidified rivers/streams and soil due to anthropogenic air pollutants such as SO2, NH3, and NOx [49,50,51]. Therefore, the decrease in the impact of acidification reduces the mobilization and leaching behavior of heavy metals in soil and exerts adverse impacts on aquatic and terrestrial animals and plants by disturbing the food web. The eco-indicator ozone depletion (ODP) is the relative amount of degradation to the ozone layer caused by trichlorofluoromethane (CCl3F or R-11 or CFC-11) being fixed at an ODP of 1.0. This eco-indicator duplicates its impact in scenarios that consider the use of nuclear energy, since this technology uses refrigerants in its process. However, SC-1 emits just 1 Mg CFC-11 eq, so double is still a negligible amount (global emission de CFC-11 eq = 60 Gg/year [52]). Furthermore, it should be noted that the impact of fuel consumption is assessed on the basis of an increase in the cost of acquiring energy resources in the future as a result of their reduced quality. SC-3 has a minimum resource depletion because this scenario does not consider the use of gas and coal, but nevertheless, biomass is considered. Finally, one of the most important tools nowadays is the Global Warming indicator. This eco-indicator refers to greenhouse gas emissions and expresses the radiative forcing of greenhouse gas emissions, expressed in kilograms of CO2 equivalent [23]. Again, the SC-3 delivers promising results, since its contribution to global warming is almost nil. For all of the above, SC-3 is the scenario that allows the cleanest generation of energy.
To go further with the impacts, three items will be addressed in order to clarify the effects of having clean energy electric systems. The first one is regarding global warming gases, the second is related to fossil fuel dependence, and the final one examines the impacts on the installed capacity and, consequently, the use of land required to deploy the scenarios.
4.1. Global Warming Gases
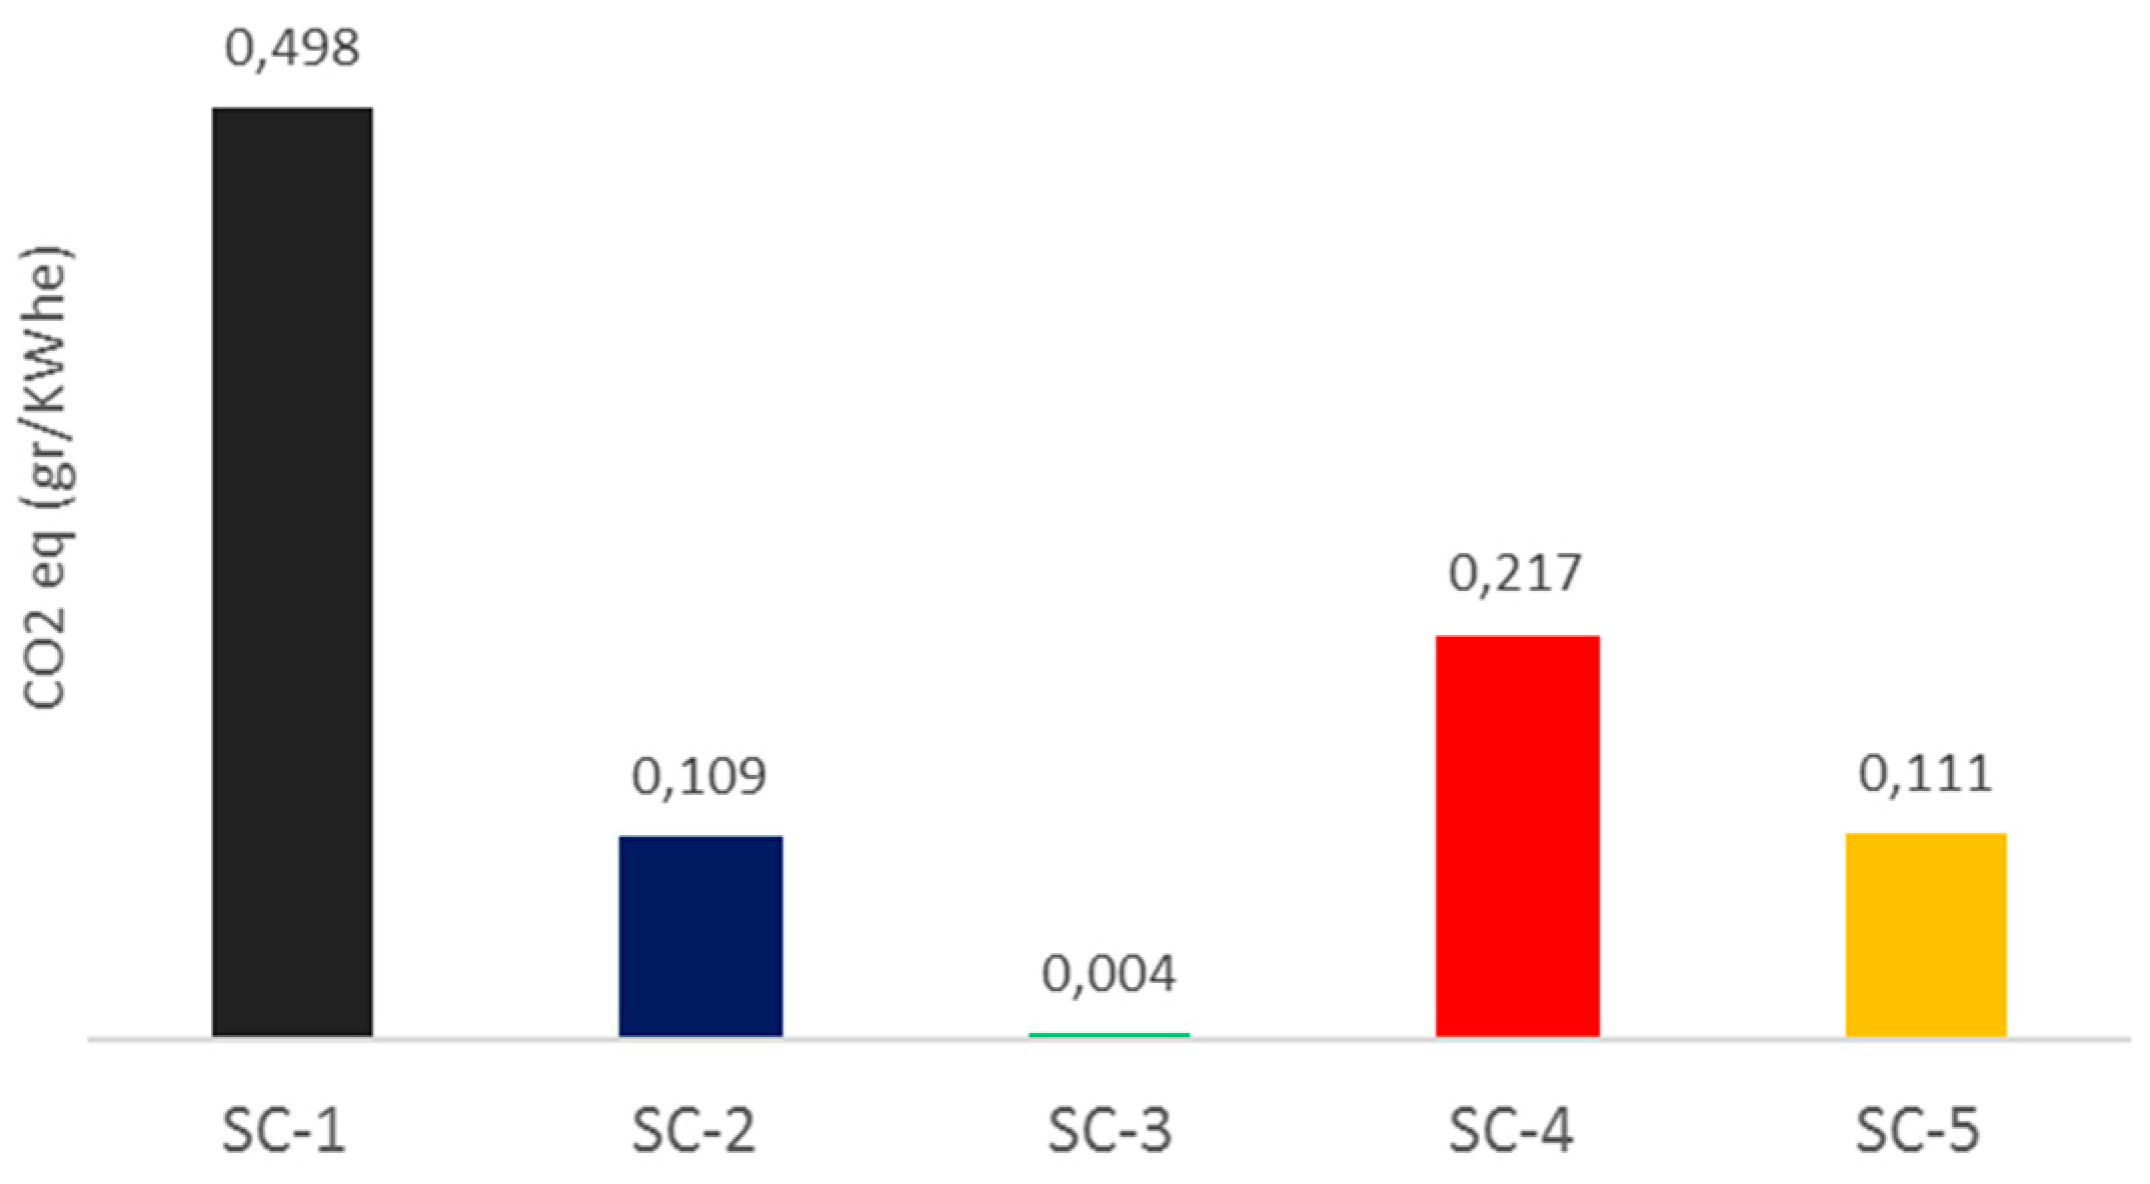
The main goal of the study is to estimate the reduction of the GWG emissions for the four different mix options proposed as clean solutions by 2050. Such as Figure 8 summarizes, the new scenarios drastically reduce the GWG emissions per unit of electricity compared to the reference (SC-1), which emits around 500 g for every kW produced and is in line with other studies [45,46]. This amount comes mainly from the burning of coal, around 83%, followed by gas and oil, which contribute around 15% and 3%, respectively, according to the LCA analysis for the scenario. For this case, the production and transport of these are only small fractions of the GWG releases.
Continuing with Figure 8, both SC-2 and SC-5 reduce the emission up to one fifth, despite that they are different approaches to solving the emissions problem. On the other hand, the worst case of the clean scenarios would be SC-4 (when a low deployment of renewable energy is predicted and gas is the main source of energy). Here, the emissions were halved compared to the reference case (SC-1). Finally, the best case, or cleanest solution, is represented in SC-3, when using a fraction of nuclear energy in a high penetration of renewable energy. Here, emissions are negligible due to the phasing-out of fossil fuels (coal and gas) for electricity generation.
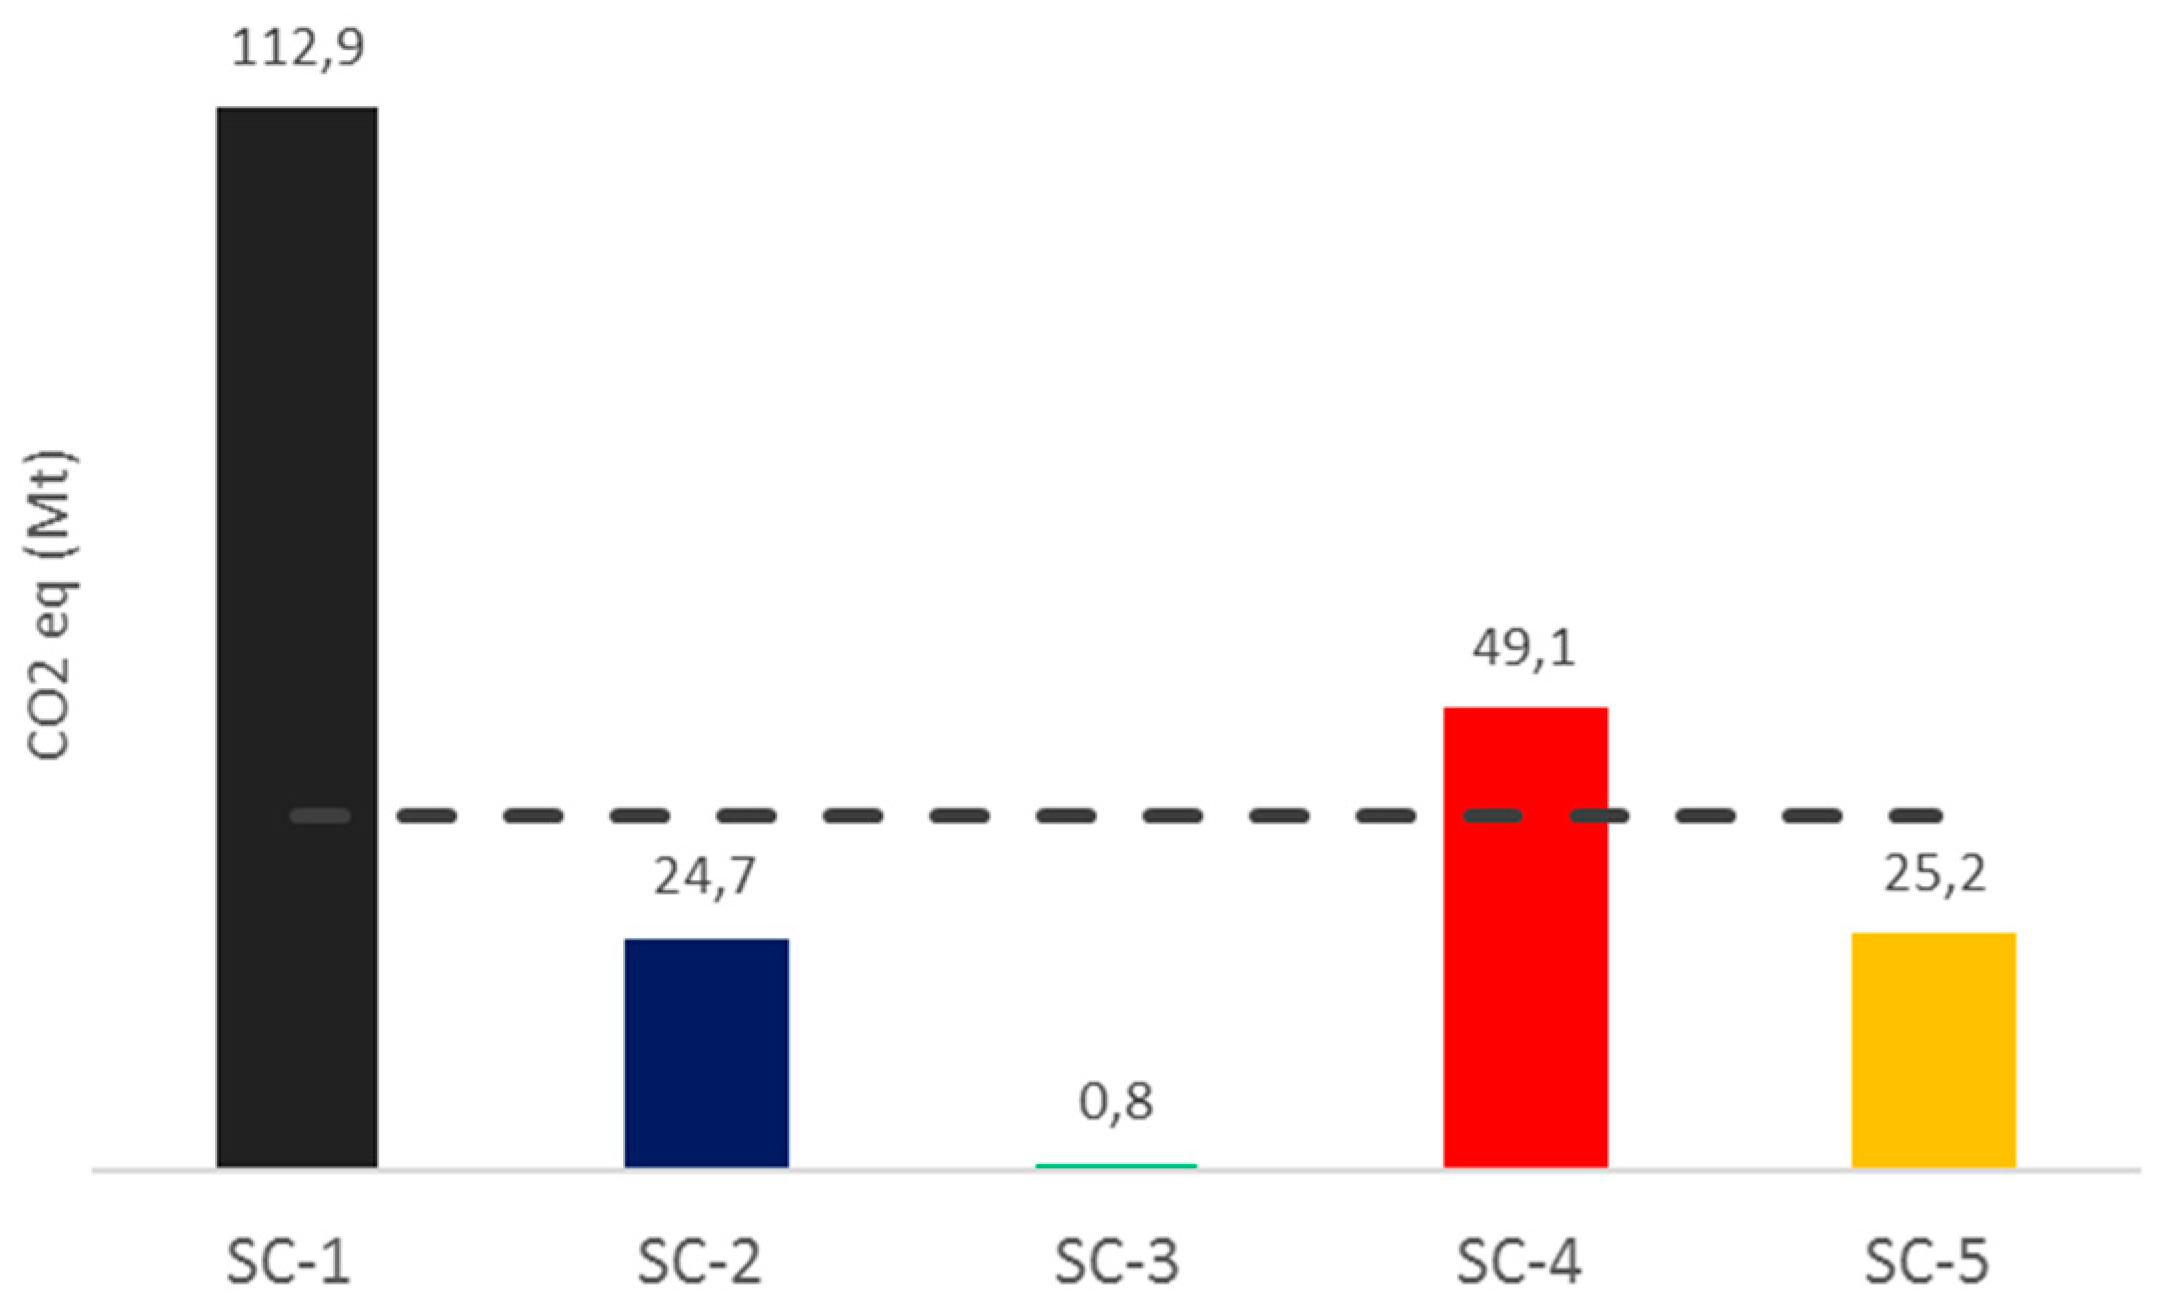
However, the reduction of the GWG emission per unit of energy is a parameter that can be misleading. Although all the scenarios substantially reduce the current emissions (as Figure 8 exposes), the reduction of the total emissions required to be carbon neutral could not be achieved when the energy demand increases. Thus, the values from Figure 8. have been multiplied by the total electricity generated by 2050 (225 TWh), which obtained the total emissions by scenario, which can be seen in Figure 9. It can be seen that the SC-4 emissions are about 30% higher than the current total emissions in 2018 (the dashed black line). The cause is the intensive use of natural gas, which represents 99% of the emissions, according to the LCA analysis. On the other side, SC-2 and SC-5 can, in fact, lead to reaching the main goal of being carbon neutral if the forestry industry size continues the same way [53,54]. On the contrary, when phasing out fossil fuels by means of RE and nuclear (SC-3), Chile could obtain a carbon negative system.
Therefore, the four new electrical networks simulated accomplish the objectives of reducing Global Warming Gases per unit of energy produced; however, when assuming a goal of reduction of the total releases, the fourth scenario (SC-4) (Low penetration of clean sources and 50% gas) may be 40% higher than the amount produced by the current mix in the year 2018 (SC-1). This problem can be solved if 25% of gas is replaced by nuclear (SC-5). In this case, the emissions will be around 25 Mt, which is around 30% of the total Chilean GHG emissions in 2018, and the country may be considered as carbon neutral if the current forestry is maintained.
More promising are those cases of high penetration of Renewable Energy, SC-2 and SC-3. On one hand, when using gas as a backup, greenhouse emissions can be reduced up to 24 Mt of CO2. Here, the scenario could be carbon neutral, the same way as in the previous SC-5. On the other hand, when using 25% of electricity from nuclear instead of gas (SC-3), the emissions are insignificant and the scenario becomes carbon negative due to current forestry. Additionally, this scenario could be helpful in contributing to the eradication of the fossil fuel dependence of the electrical network.
4.2. Fossil Fuel Dependence
It was mentioned before that Chile has a strong dependence on fossil fuels. Indeed, nowadays, more than 60% of the primary energy comes from overseas, where 50% of that is destined to produce electricity. A relevant result that directly shows how fossil fuel dependence can be reduced is the Cumulative Energy Demand [55] given by SIMAPRO. However, although in the study the reduction of fossil fuels in the total energy mix has not been considered, there is a good understanding of how clean electric networks reduce their imports. According to this, Table 5 shows the energy required to generate 1 kWh of electricity by scenario. In fact, clean scenarios significantly reduce the fossil fuel dependency of the reference scenario. The worst case is when using 50% gas (SC-4), in 40% and both SC-2 and SC-5 of around 65%. The relevant case is SC-3, as it has obvious results when no fossil fuels are foreseen to be directly used in the electricity production; here, the reduction is 95%.
In global terms, according to the Energy National Commission data [32], the total energy required for Chile was around 325,000 Tcal for the year 2017, which is equivalent to 32.5 MTOE (Mega tons of oil equivalent). From that energy, around 17.3 MTOE were destined for the electricity produced that year (74 TWh). Assuming that the scenario has not appreciably changed for the year 2018, the energy expected for year 2018 would be around 17.5 MTOE to produce the 75 TWh. This means that by 2050, the energy required to produce the 225 TWh of electricity will be around 52.5 MTOE if SC-1 is used. Extrapolating the results of the Energy from Fossil Fuel column, the significant reduction on fossil fuels resulted when applying clean mixes of electricity generation, as the table also shows. Again, when phasing-out fossil fuels (SC-3) by using renewables and nuclear energy, the demand for fossil fuels is negligible compared to the rest of the scenarios, creating valuable economic savings.
4.3. Impact on the Installed Capacity and Land Use
An interesting outcome with a significant impact on the electricity distribution is the installed capacity needed to satisfy the electricity demand. In this respect, as a direct result of the replacement of coal by means of the deployment of new renewable sources, an increase of the electric systems and thus, the use of land, is foreseen due to their lower energy density [44]. This means that renewable energy requires more installed capacity and consequently more infrastructure and grids to dispatch the electricity and, although these impacts are not quantified in the LCA study, it is possible to give an approximation of the size of the system and the land use needed to satisfy the electricity demand.
For the size of the system, or installed capacity needed, the variable depends mostly on the load (or capacity) factor of the energy sources. For this study, those values were mostly taken from the historic Chilean electricity production, explained in Section 2 and shown in Table 1. Nowadays, as Table 6 shows, the installed capacity of the system is around 2.4 times the electricity demand (calculated as installed power divided by the electricity production). On the other hand, when assuming a high penetration of renewable energy, the installed power is between 20% and 30% more than for a lower deployment of those technologies.
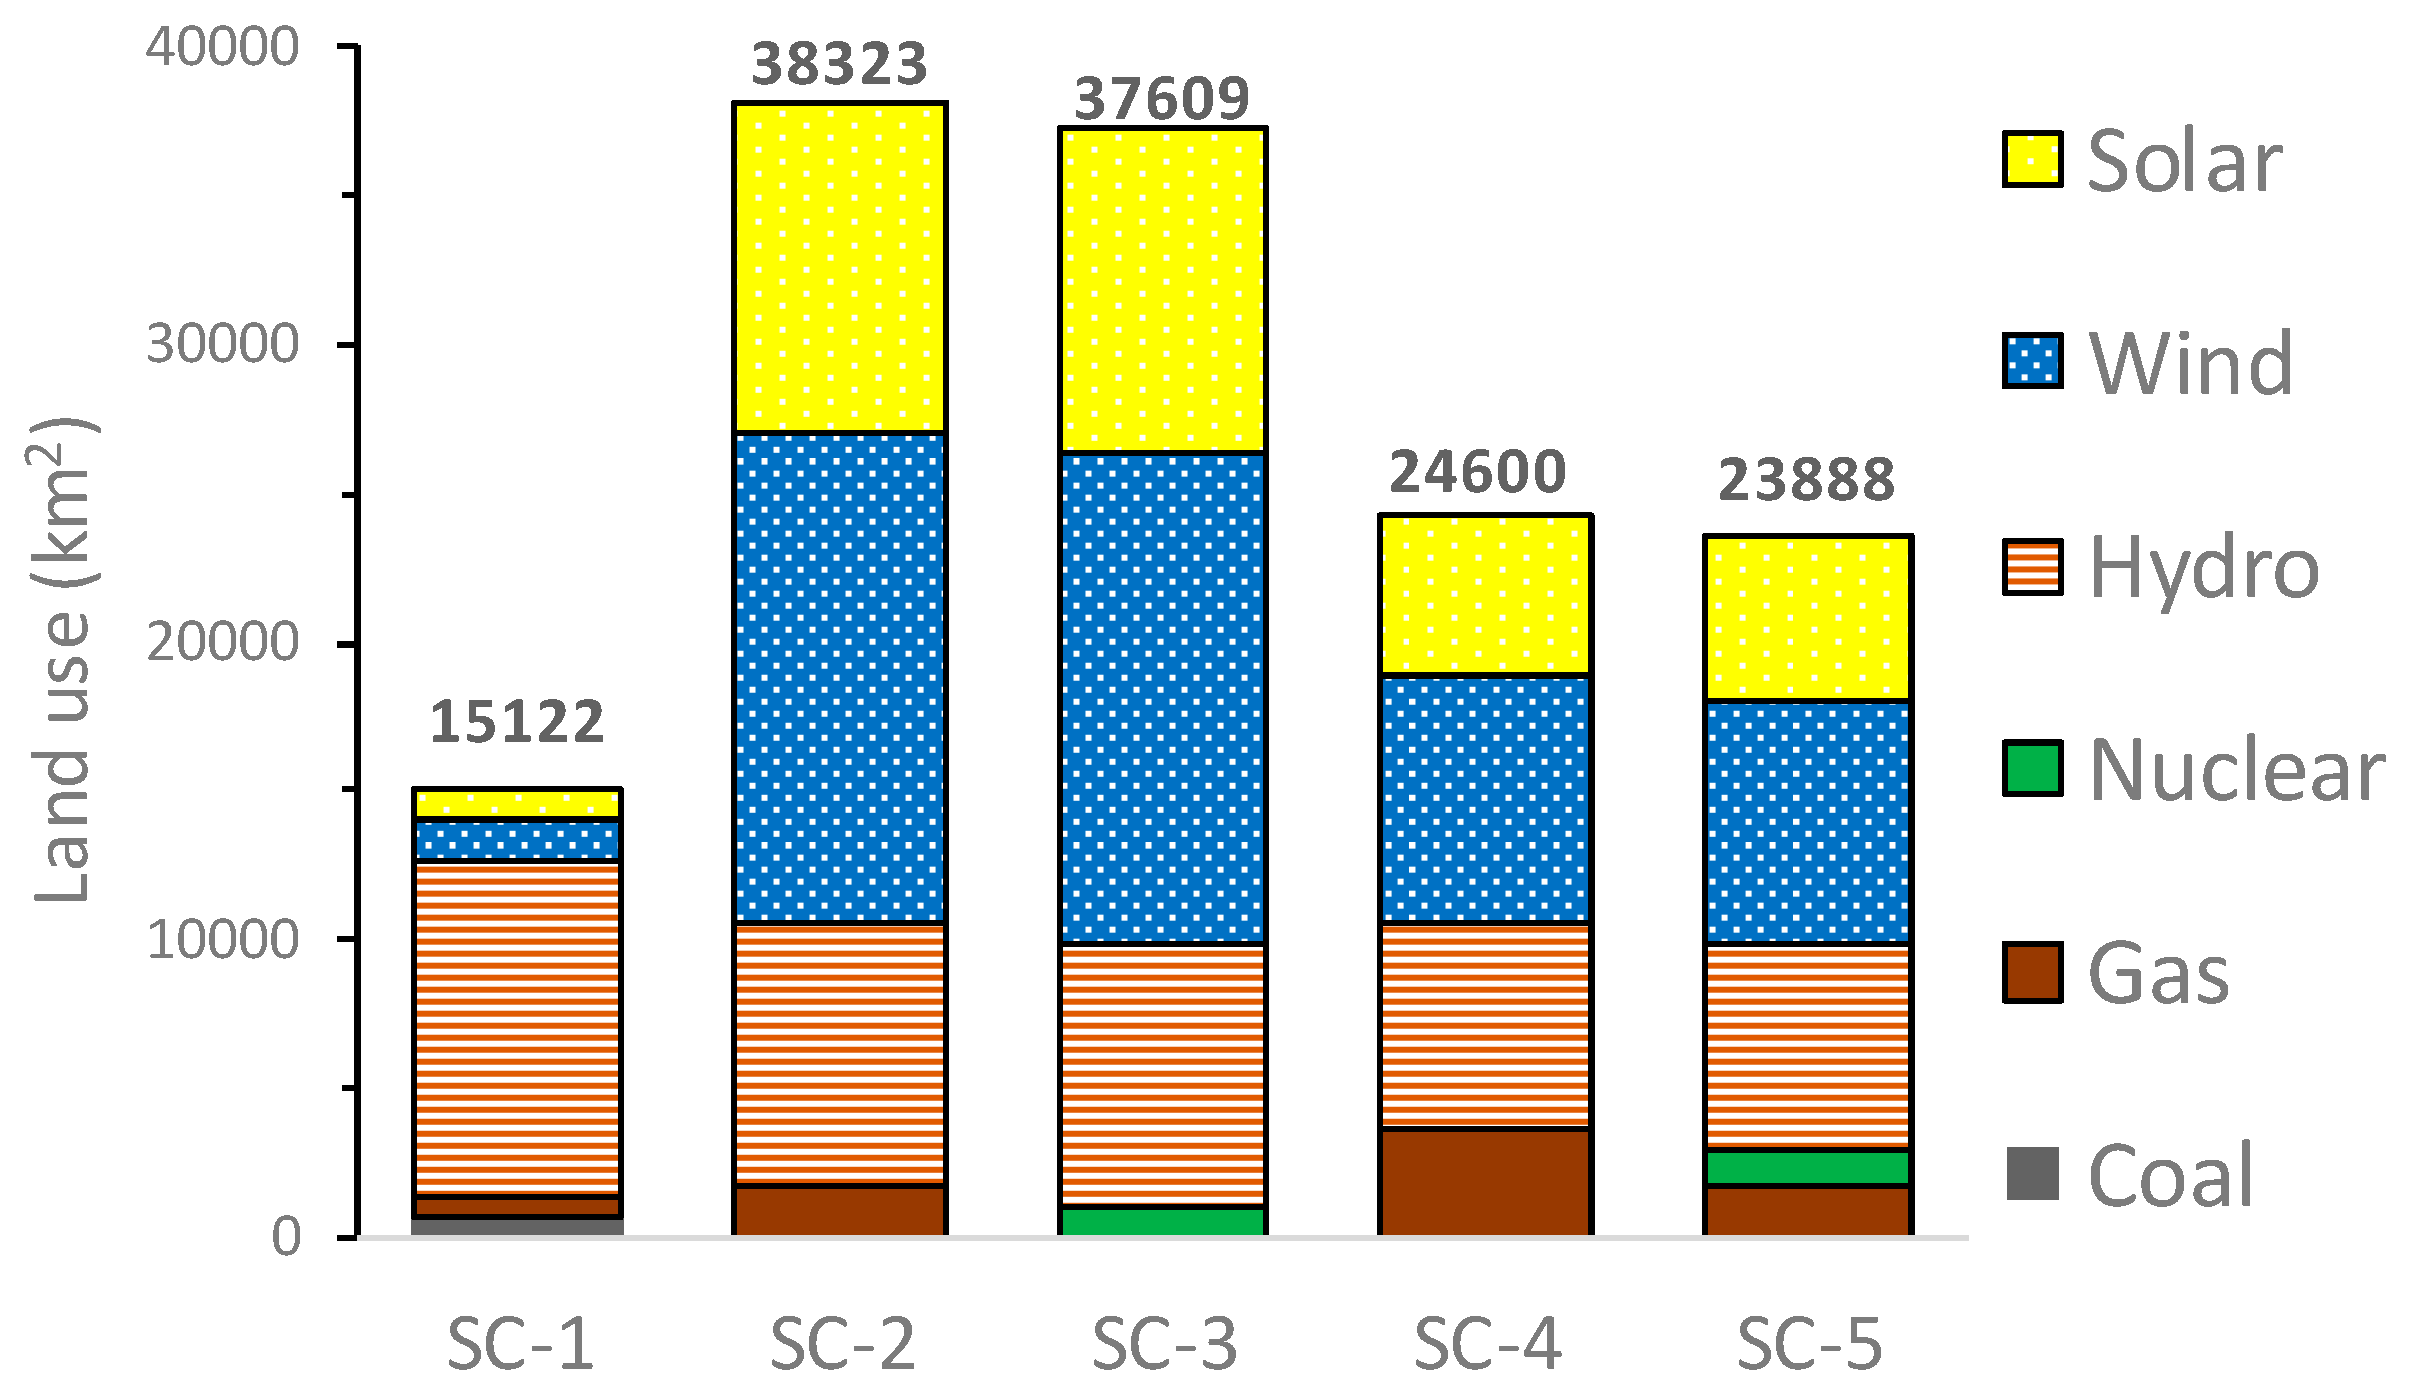
On the other hand, Figure 10 shows a rough estimation of the required area to satisfy the electricity demand by 2050. These values are calculated as a function of the energy source type, their electricity production, load factor, and a conversion factor (area per electricity produced) taken from Table 1. As previously mentioned in Section 2, only the most contributors to the use of land are taken into account and, despite biomass crops having big impacts on land in some countries [56,57], for these simulations, it comes from the forestry industry waste, so no land was considered. Concerning the results, solar, wind, and hydro (reservoir) are the biggest contributors to the use of land. On the contrary, gas, coal, and nuclear are the lowest.
Globally, around 15,000 km2 are predicted to be used if SC-1 continues to 2050 (from the current 5000 km2 in the year 2018). This value is expected to increase around 2.5 times when there is a high deployment of renewable energy (SC-2 and SC-3), which means eight times the current land occupied for energy production. From this area, around 10,000 km2 are needed for solar energy, or around 10% of the Atacama Desert (the most likely and effective place to install this source). On the other hand, for scenarios with a lower renewable energy deployment (SC-4 and SC-5), the required land would be around 1.6 times that needed for SC-1 in 2050 (or five times the same scenario in 2018).
4.4. Results Summary
Aside from the results obtained for the ecological impact of the scenarios shown in Table 4 and given by the LCA analysis by means of eco-indicators, it was found that with the scenarios proposed, they could effectively reduce most of the environmental impacts. Table 7 shows a summary of the scenarios for the three main points addressed, and also of Ecotoxicity, which refers to the effect on living organisms and their non-living (abiotic) environment due to human activities or natural phenomenons. Every percentage is the production of each scenario compared to the reference scenario (SC-1). This means that the lowest contributor would be chosen as the best scenario for each impact (highlighted in blue).
This summary provides useful information to researchers and policymakers when deciding to change their current electric network. This decision will depend on the geopolitical context which, nowadays, is focused on the reduction of global warming. Therefore, if a high penetration of renewable energy is achievable, SC-3 can be recommended for further studies. On the other hand, SC-5 would also be taken into account if a lower renewable energy is predicted.
5. Limitations of the Study
This study presents some limitations regarding the data availability. Due to the lack of information, energy sources, such as concentrated solar and SMR, have been modelled as conventional photovoltaic and Pressure Water Reactor (PWR) technologies, respectively. Nevertheless, updating those systems is expected in future works.
Additionally, the LCA analysis excludes the transportation and distribution of electricity to the suitable voltage of the grid destined for the final users. However, it is expected that in the future, it will be possible to include this information.
As mentioned prior, to calculate the use of land of the scenarios, hydropower ROR, Geothermal, and Biomass are excluded from the total to simplify the model since their contribution is small. Note that no biomass crops are foreseen to be used for electricity generation in Chile.
6. Conclusions
Chile is facing one of the most important steps to control its Global Warming Emissions, the cleaning of its electrical network by new and low carbon emission electric sources. For this reason, the study presented intends to show the main advantages of implementing these kinds of strategies and their impacts on the environment by means of the Life Cycle Analysis, global warming gases, fossil fuel dependence, and land needed to generate the electricity needed in the future.
Principally, four clean electric systems scenarios for the year 2050 were assessed for the Chilean electrical network and compared to the current mix in 2018. By analyzing the results, it can be said that the four new electrical modelled networks simulated accomplish the objectives of reducing the main impacts on the environment per unit of energy produced; however, the increase of electricity expected in the future would give different outcomes between the scenarios for global warming gases and the use of land needed for electricity production.
Regarding the ecological impacts, most of the environmental indicators show that new mixes for the year 2050 are, in fact, cleaner and safer for human health and the environment. When assuming a goal of the reduction of Global Warming Gases, the analysis shows that this can be reached with a high penetration of RE (75% of production). In fact, one scenario could be carbon neutral (when using gas as a backup) and the other becomes carbon negative (when generating 25% of nuclear) due to the absorption of emissions by the current national forestry. Additionally, this last scenario could be helpful in contributing to the eradication of the fossil fuel dependence of the electrical network. The disadvantage of these scenarios is that they would require about 2.5 times more land for electricity production and, consequently, more use of resources.
On the other hand, if a lower RE production is foreseen (50%), total releases may be 40% higher than the amount produced by the current mix in the year 2018 if gas is the main backup (50%). In this context, the problem can be solved if half of this gas is replaced by nuclear. In this case, the country may be considered carbon neutral if the current forestry is maintained. However, the country would still be highly fossil fuel dependent, as it is nowadays.
Finally, this study showed realistic alternatives for the country that can also be carried out by other countries in the region with similar resources and the same goals.
Author Contributions
I.M. conceived the work and performed the simulations; I.H. supervised the work and provided a critical review; I.M., I.H., and H.V. analyzed the data; I.M. and H.V. wrote the manuscript.
Funding
This research received no external funding.
Acknowledgments
The author thanks the Energy System Analysis Unit of Energy group of the Spanish research center CIEMAT for its kindness in receiving and training him during his internship.
Conflicts of Interest
The authors declare no conflict of interest.
References
- Kim, H.; Holme, P. Network Theory Integrated Life Cycle Assessment for an Electric Power System. Sustainability 2015, 7, 10961–10975. [Google Scholar] [CrossRef] [Green Version]
- COP25, Climate Action Depends on All of Us: Time for Action Is Now, 2–13 December, Chile. Gobierno de Chile. 2019. Available online: https://www.cop25.cl/web/ (accessed on 2 July 2019).
- Ministerio de Energía. Energía 2050: Política Energética de Chile. Gobierno de Chile. 2016. Available online: https://www.energia2050.cl (accessed on 15 May 2018).
- Ministerio de Energía, Ruta Energética 2018–2022: Liderando la Modernización con Sello Ciudadano. Gobierno de Chile. 2018. Available online: https://www.cne.cl (accessed on 3 April 2019).
- Global Petrol Prices. Chile Electricity Prices. 2019. Available online: https://www.global petrolprices.com/Chile/electricity_prices/ (accessed on 5 July 2019).
- Comisión Nacional de Energía. Balance nacional de energía. Ministerio de Energía, Gobierno de Chile, Energía abierta. 2019. Available online: http://energiaabierta.cl/visualizaciones/balance-de-energia/ (accessed on 10 July 2019).
- European Commission, Joint Research Centre (JRC)/Netherlands Environmental Assessment Agency (PBL), «Emission Database for Global Atmospheric Research (EDGAR), Release Version 4.3.1». 2016. Available online: http://edgar.jrc.ec.europa.eu/overview.php?v=431 (accessed on 20 June 2019).
- Kreft, S.; Eckstein, D. Global Climate Risk Index 2014: Who Suffers Most from Extreme Weather Events? Weather-Related Loss Events in 2012 and 1993 to 2012; Germanwatch: Bonn, Germany, 2013; ISBN 978-3-943704-14-3. [Google Scholar]
- Ministerio de Energía, Ministerio de Transporte y Telecomunicaciones, Ministerio del Medio Ambiente. Estrategia Nacional de Electromovilidad: Un Camino para los Vehículos Eléctricos. Chile Mejor, Gobierno de Chile. 2018. Available online: http://www.minenergia.cl (accessed on 11 July 2019).
- Seebach, C. El futuro de la electricidad en Chile. Generadoras de Chile. In Proceedings of the 2nd Latin America Energy Summit, Santiago, Chile, 17–18 October 2018; Available online: http://generadoras.cl (accessed on 10 April 2019).
- Jimenez-Estevez, G.; Palma-Behnke, R.; Roman Latorre, R.; Moran, L. Heat and Dust: The Solar Energy Challenge in Chile. IEEE Power Energy Mag. 2015, 13, 71–77. [Google Scholar] [CrossRef]
- Molina, A.; Falvey, M.; Rondanelli, R. A solar radiation database for Chile. Nat. Sci. Rep. 2017, 7. [Google Scholar] [CrossRef] [PubMed]
- Nasirov, S.; Silva, C.; Agostini, C. Investors’ perspectives on barriers to the deployment of renewable energy sources in Chile. Energies 2015, 8, 3794–3814. [Google Scholar] [CrossRef]
- International Renewable Energy Agency (IRENA). Renewable Power Generation Costs in 2017; IRENA: Abu Dhabi, UAE, 2018; ISBN 978-92-9260-040-2. [Google Scholar]
- Martí-Ballester, C.P. Sustainable energy systems and company performance: Does the implementation of sustainable energy systems improve companies’ financial performance? J. Clean. Prod. 2017, 162, S35–S50. [Google Scholar] [CrossRef]
- Finat, C. Sistema Eléctrico Nacional: Los proyectos que debutan este 2019; Revista Electricidad; EDITEC: Puerto Montt, Chile, 2019. [Google Scholar]
- Dudley, B. BP Statistical Review of World Energy, 68th ed.; BP p.l.c.: London, UK, 2019. [Google Scholar]
- Dudley, B. BP Statistical Review of world Energy—June 2017; Excel file; BP p.l.c.: London, UK, 2018. [Google Scholar]
- Forsberg, C.W.; Stack, D.C.; Curtis, D.; Haratyk, G.; Sepulveda, N.A. Converting excess low-price electricity into high-temperature stored heat for industry and high-value electricity production. Electr. J. 2017, 30, 42–52. [Google Scholar] [CrossRef]
- Werber, C. California is getting so much power from solar that wholesale electricity prices are turning negative. Quartz. 2017. Available online: https://qz.com (accessed on 20 June 2019).
- Amelang, S.; Appunn, K. The causes and effects of negative power prices. Retrieved. 5 January 2018. Available online: https://www.cleanenergywire.org (accessed on 1 July 2019).
- Matek, B.; Gawell, K. The benefits of baseload renewables: A misunderstood energy technology. Electr. J. 2015, 28, 101–112. [Google Scholar] [CrossRef]
- Edenhofer, O. Climate Change 2014: Mitigation of Climate Change (V 3); Cambridge University Press: Cambridge, UK, 2015. [Google Scholar]
- Markandya, A.; Wilkinson, P. Electricity generation and health. Lancet 2007, 370, 979–990. [Google Scholar] [CrossRef]
- Howarth, R.W.; Santoro, R.; Ingraffea, A. Methane and the greenhouse-gas footprint of natural gas from shale formations. Clim. Chang. 2011, 106, 679. [Google Scholar] [CrossRef]
- Brandt, A.R.; Heath, G.A.; Cooley, D. Methane leaks from natural gas systems follow extreme distributions. Environ. Sci. Technol. 2016, 50, 12512–12520. [Google Scholar] [CrossRef]
- Micklethwait, R. Germany Is Burning Too Much Coal. Its Reputation as a Leader on Climate Change Is Not Entirely Deserved; Bloomberg: New York, NY, USA, 2017; Available online: https://www.bloomberg.com (accessed on 1 July 2019).
- Pioro, I. Handbook of Generation IV Nuclear Reactors; Woodhead Publishing: Sawston/Cambridge, UK, 2016. [Google Scholar]
- Kok, K.D. Nuclear Engineering Handbook; CRC Press: Boca Raton, FL, USA, 2016. [Google Scholar] [CrossRef]
- Locatelli, G.; Boarin, S.; Pellegrino, F.; Ricotti, M.E. Load following with Small Modular Reactors (SMR): A real options analysis. Energy 2015, 80, 41–54. [Google Scholar] [CrossRef] [Green Version]
- Sovacool, B.K.; Ramana, M.V. Back to the future: Small modular reactors, nuclear fantasies, and symbolic convergence. Sci. Technol. Hum. Values 2015, 40, 96–125. [Google Scholar] [CrossRef]
- Comisión Nacional de Energía. Análisis de precios, Tarifas y Normas Técnica. Ministerio de Energía, Gobierno de Chile. Available online: https://www.cne.cl/estadisticas/electricidad/ (accessed on 15 January 2019).
- Hertwich, E.G.; Gibon, T.; Bouman, E.A.; Arvesen, A.; Suh, S.; Heath, G.A.; Bergesen, J.D.; Ramirez, A.; Vega, M.I.; Shi, L. Integrated life-cycle assessment of electricity-supply scenarios confirms global environmental benefit of low-carbon technologies. Proc. Natl. Acad. Sci. USA 2014, in press. [Google Scholar] [CrossRef]
- ISO 14040:2006. Environmental Management—Life Cycle Assessment—Principles and Framework; ISO: Geneva, Switzerland, 2006. [Google Scholar]
- ISO 14044:2006. Environmental Management—Life Cycle Assessment—Requirements and Guidelines; ISO: Geneva, Switzerland, 2006. [Google Scholar]
- Burchart-Korol, D.; Pustejovska, P.; Blaut, A.; Jursova, S.; Korol, J. Comparative life cycle assessment of current and future electricity generation systems in the Czech Republic and Poland. Int. J. Life Cycle Assess. 2018, 23, 2165–2177. [Google Scholar] [CrossRef] [Green Version]
- Goedkoop, M.; Oele, M.; Leijting, J.; Ponsioen, T.; Meijer, E. SIMAPRO 8; PRé Consultants: Amersfoort, The Netherlands, 2016. [Google Scholar]
- Wernet, G.; Bauer, C.; Steubing, B.; Reinhard, J.; Moreno-Ruiz, E.; Weidema, B. The ecoinvent database version 3 (part I): Overview and methodology. Int. J. Life Cycle Assess. 2016, 21, 1218–1230. [Google Scholar] [CrossRef]
- Steubing, B.; Wernet, G.; Reinhard, J.; Bauer, C.; Moreno-Ruiz, E. The ecoinvent database version 3 (part II): Analyzing LCA results and comparison to version 2. Int. J. Life Cycle Assess. 2016, 21, 1269–1281. [Google Scholar] [CrossRef]
- Frischknecht, R.; Jungbluth, N.; Althaus, H.J.; Doka, G.; Dones, R.; Heck, T.; Hellweg, S.; Hischier, R.; Nemecek, T.; Rebitzer, G.; et al. The ecoinvent database: Overview and methodological framework (7 pp). Int. J. Life Cycle Assess. 2005, 10, 3–9. [Google Scholar] [CrossRef]
- Bare, J.C. TRACI: The Tool for the Reduction and Assessment of Chemical and other environmental Impacts. J. Ind. Ecol. 2002, 6, 49–78. [Google Scholar] [CrossRef]
- Bare, J. TRACI 2.0: The Tool for the Reduction and Assessment of Chemical and other environmental Impacts 2.0. Clean Technol. Environ. Policy 2011, 13, 687–696. [Google Scholar] [CrossRef]
- U.S. Energy Information Administration. Electric Power Monthly; U.S. Energy Information Administration: Washington, DC, USA, 2019. Available online: https://www.eia.gov/electricity/monthly (accessed on 16 July 2019).
- Stevens, L.; Anderson, B.; Cowan, C.; Colton, K.; Johnson, D. The Footprint of Energy: Land Use of US Electricity Production; STRATA: Logan, UT, USA, 2017; Available online: https://www.strata.org/pdf/2017/footprints-full.pdf (accessed on 12 August 2019).
- Vega-Coloma, M.; Zaror, C.A. Environmental impact profile of electricity generation in Chile: A baseline study over two decades. Renew. Sustain. Energy Rev. 2018, 94, 154–167. [Google Scholar] [CrossRef]
- Gaete-Morales, C.; Gallego-Schmid, A.; Stamford, L.; Azapagic, A. Assessing the environmental sustainability of electricity generation in Chile. Sci. Total Environ. 2018, 636, 1155–1170. [Google Scholar] [CrossRef] [Green Version]
- Rani, B.; Singh, U.; Chuhan, A.; Sharma, D.; Maheshwari, R. Photochemical Smog Pollution and its mitigation Measures. J. Adv. Sci. Res. 2011, 2, 28–33. [Google Scholar]
- Park, Y.S.; Egilmez, G. TRACI Impact Assessment of Transportation Manufacturing Nexus in the U.S.: A Supply Chain-Linked Cradle-to-Gate LCA. Environ. Manag. Sustain. Dev. 2015. [Google Scholar] [CrossRef]
- Kim, T.; Chae, C. Environmental impact analysis of acidification and eutrophication due to emissions from the production of concrete. Sustainability 2016, 8, 578. [Google Scholar] [CrossRef]
- Bach, V.; Finkbeiner, M. Approach to qualify decision support maturity of new versus established impact assessment methods—Demonstrated for the categories acidification and eutrophication. Int. J. Life Cycle Assess. 2017, 22, 387–397. [Google Scholar] [CrossRef]
- Lee, S.; Tae, S.; Roh, S.; Kim, T. Green template for life cycle assessment of buildings based on building information modeling: Focus on embodied environmental impact. Sustainability 2015, 7, 16498–16512. [Google Scholar] [CrossRef]
- Montzka, S.A.; Dutton, G.S.; Yu, P.; Ray, E.; Portmann, R.W.; Daniel, J.S.; Kuijpers, L.; Hall, B.; Mondeel, D.; Siso, C.; et al. An unexpected and persistent increase in global emissions of ozone-depleting CFC-11. Nature 2018, 557, 413. [Google Scholar] [CrossRef]
- Casas-Ledón, Y.; Flores, M.; Jiménez, R.; Ronsse, F.; Dewulf, J.; Arteaga-Pérez, L.E. On the environmental and economic issues associated with the forestry residues-to-heat and electricity route in Chile: Sawdust gasification as a case study. Energy 2019, 170, 763–776. [Google Scholar] [CrossRef]
- Nian, V. The carbon neutrality of electricity generation from woody biomass and coal, a critical comparative evaluation. Appl. Energy 2016, 179, 1069–1080. [Google Scholar] [CrossRef]
- Huijbregts, M.A.; Hellweg, S.; Frischknecht, R.; Hendriks, H.W.; Hungerbuhler, K.; Hendriks, A.J. Cumulative energy demand as predictor for the environmental burden of commodity production. Environ. Sci. Technol. 2010, 44, 2189–2196. [Google Scholar] [CrossRef]
- Lambin, E.F.; Meyfroidt, P. Global land use change, economic globalization, and the looming land scarcity. Proc. Natl. Acad. Sci. USA 2011, 108, 3465–3472. [Google Scholar] [CrossRef] [Green Version]
- Nkonya, E.; Mirzabaev, A.; von Braun, J. Economics of land degradation and improvement: An introduction and overview. In Economics of Land Degradation and Improvement–A Global Assessment for Sustainable Development; Nkonya, E., Mirzabaev, A., von Braun, J., Eds.; Springer: Cham, Switzerland, 2016; pp. 1–14. [Google Scholar] [CrossRef]
Figure 1.
Total Greenhouses Gases emissions (GWE) evolution since 1970 to 2017 (authors’ own contribution is based on the Emission Database for Global Atmospheric Research (EDGAR) [2]). An averaged European country is represented by the yellow line.
Figure 1.
Total Greenhouses Gases emissions (GWE) evolution since 1970 to 2017 (authors’ own contribution is based on the Emission Database for Global Atmospheric Research (EDGAR) [2]). An averaged European country is represented by the yellow line.

Figure 2.
Total Chilean GWG (global warming gases) per year by industrial sector (authors’ own contribution is based on EDGAR [2]).
Figure 2.
Total Chilean GWG (global warming gases) per year by industrial sector (authors’ own contribution is based on EDGAR [2]).

Figure 3.
Percentage electricity contribution by solar power (authors’ own contribution based on [17,18]).

Figure 4.
Percentage electricity contribution by wind power (authors’ own contribution based on [17,18]).

Figure 5.
Evolution of the electric contribution per energy source (authors’ own contribution is based on [32]).
Figure 5.
Evolution of the electric contribution per energy source (authors’ own contribution is based on [32]).

Figure 6.
Evolution of the installed capacity in Chile (authors’ own contribution is based on [32]).
Figure 6.
Evolution of the installed capacity in Chile (authors’ own contribution is based on [32]).

Figure 7.
Clean energy contribution versus electric production (authors’ own contribution is based on [32]).
Figure 7.
Clean energy contribution versus electric production (authors’ own contribution is based on [32]).

Figure 8.
Emissions per kWh by 2050 by scenario.

Figure 9.
Total Chilean emissions by 2050.

Figure 10.
Total land used for the main contributor by scenario for the year 2050. For SC-1 in the year 2018, the land use would be close to 5000 km2.
Figure 10.
Total land used for the main contributor by scenario for the year 2050. For SC-1 in the year 2018, the land use would be close to 5000 km2.


Table 1.
Load factors and land use by energy source (authors’ own contribution is based on [32,43,44]).
| Source | Load Factor (%) | Land Use (km2/GW) |
|---|---|---|
| Biomass | 54% | - |
| Coal | 70% | 49 |
| Wind | 27% | 283 |
| Natural Gas | 29% (54%) 1 | 50 |
| Hydro Reservoir | 38% | 1276 |
| Hydro ROR 2 | 42% | - |
| Solar | 25% | 176 |
| Geothermal | (75%) | - |
| Nuclear | (92%) | 51 |
1 Including liquefied natural gas (LNG); 2 Run-on-the-river, including mini Hydro.
Table 2.
Description of the scenarios proposed for the Chilean Electric Network (authors’ own contribution is based on [16,32]).
| Scenario | Description |
|---|---|
| SC-1 | The Chilean electric mix in the year 2018 is called the Reference scenario. In this scenario, a simplified mix is assessed to estimate the main indicators to improve in the year 2050. |
| SC-2 | High penetration of Renewable Energy (RE). Around 75% of the electricity is renewable and the other 25% is provided by gas. |
| SC-3 | High penetration of RE. This is a phase-out of fossil fuels for electricity production. Here, as well as SC-2, around 75% of the electricity is renewable and the other 25% is provided by nuclear. |
| SC-4 | Low penetration of RE. This scenario considers that the 70% of renewable energy is not possible to achieve due to factors such as the decrease of the hydropower contribution and difficulties for deploying solar and wind power. Therefore, the total renewable energy is up to 50% and the rest is provided by gas. |
| SC-5 | Low penetration of RE. In this scenario, as in the previous SC-4, renewable energy reaches only 50% of the electricity required. However, the remaining 50% is shared by 25% gas and 25% nuclear. |
Table 3.
Scenarios proposed and electricity contribution by technology.
| Technology | SC-1 | SC-2 | SC-3 | SC-4 | SC-5 |
|---|---|---|---|---|---|
| Hydro (ROR) | 17% | 13% | 13% | 10% | 10% |
| Hydro (Reservoir) | 13% | 10% | 10% | 8% | 8% |
| Biomass | 3% | 3% | 3% | 3% | 3% |
| Geothermic | 0% | 9% | 9% | 9% | 9% |
| Wind | 5% | 20% | 20% | 10% | 10% |
| Solar | 5% | 20% | 20% | 10% | 10% |
| Nuclear | 0% | 0% | 25% | 0% | 25% |
| Gas | 16% | 25% | 0% | 50% | 25% |
| Coal | 40% | 0% | 0% | 0% | 0% |
| Oil | 1% | 0% | 0% | 0% | 0% |
| Total | 100% | 100% | 100% | 100% | 100% |
Table 4.
Main impacts on the eco-indicators for clean scenarios compared to the reference scenario.
| Eco-Indicators | Unit | SC-1 | SC-2 | SC-3 | SC-4 | SC-5 |
|---|---|---|---|---|---|---|
| Ozone depletion | kg CFC-11 eq | 100% | 39.7% | 198.1% | 79.3% | 237.6% |
| Global Warming | kg CO2 eq | 100% | 21.9% | 0.7% | 43.5% | 22.3% |
| Smog | kg O3 eq | 100% | 13.4% | 11.4% | 15.6% | 13.6% |
| Acidification | kg SO2 eq | 100% | 8.2% | 0.9% | 15.7% | 8.4% |
| Eutrophication | kg N eq | 100% | 0.3% | 0.8% | 0.5% | 1.0% |
| Carcinogenic | CTUh * | 100% | 0.6% | 1.6% | 1.0% | 2.0% |
| Non-carcinogenic | CTUh * | 100% | 1.6% | 6.1% | 3.2% | 7.7% |
| Respiratory effects | kg PM2.5 eq | 100% | 0.3% | 0.1% | 0.5% | 0.4% |
| Ecotoxicity | CTUe ** | 100% | 1.4% | 2.3% | 2.7% | 3.6% |
| Fossil fuel depletion | MJ surplus | 100% | 99.0% | 0.9% | 197.9% | 99.8% |
* CTUh: Comparative Toxic Units (humans); ** CTUe: Comparative Toxic Units (ecotoxicity).
Table 5.
Cumulative energy demand for fossil fuels (MJ) and total energy demand (MTOE) for the scenarios.
Table 5.
Cumulative energy demand for fossil fuels (MJ) and total energy demand (MTOE) for the scenarios.
| Scenario | Energy from Fossil Fuel (MJ) | Total Energy Demand (MTOE 1) |
|---|---|---|
| SC-1 | 6.3 | 52.5 |
| SC-2 | 2.2 | 18.3 |
| SC-3 | 0.3 | 2.5 |
| SC-4 | 4.0 | 33.3 |
| SC-5 | 2.1 | 17.5 |
1 MTOE = 100,000 Tcal.
Table 6.
Ratio between installed capacity and mean electricity demand for the scenarios proposed.
| Scenario | Electricity (TWh) | Installed Power (GW) | Ratio (Electricity/Capacity) |
|---|---|---|---|
| SC-1 | 75 (225) | 20.6 (61.7) | 2.4 |
| SC-2 | 225 | 71.3 | 2.8 |
| SC-3 | 225 | 66.4 | 2.6 |
| SC-4 | 225 | 59.9 | 2.3 |
| SC-5 | 225 | 55.0 | 2.1 |
Table 7.
Summary of the scenarios by impact factor (from low to high).
| Impact | SC-1 | SC-2 | SC-3 | SC-4 | SC-5 |
|---|---|---|---|---|---|
| Global warming gases | 100% | 22% | 1% | 43% | 22% |
| Fossil fuel dependence | 100% | 35% | 5% | 63% | 33% |
| Ecotoxicity | 100% | 1.4% | 2.3% | 2.7% | 3.6% |
| Land use | 100% | 253% | 249% | 163% | 158% |
© 2019 by the authors. Licensee MDPI, Basel, Switzerland. This article is an open access article distributed under the terms and conditions of the Creative Commons Attribution (CC BY) license (http://creativecommons.org/licenses/by/4.0/).
Share and Cite
MDPI and ACS Style
Merino, I.; Herrera, I.; Valdés, H. Environmental Assessment of Energy Scenarios for a Low-Carbon Electrical Network in Chile. Sustainability 2019, 11, 5066. https://0-doi-org.brum.beds.ac.uk/10.3390/su11185066
AMA Style
Merino I, Herrera I, Valdés H. Environmental Assessment of Energy Scenarios for a Low-Carbon Electrical Network in Chile. Sustainability. 2019; 11(18):5066. https://0-doi-org.brum.beds.ac.uk/10.3390/su11185066
Chicago/Turabian StyleMerino, Ivan, Israel Herrera, and Hugo Valdés. 2019. "Environmental Assessment of Energy Scenarios for a Low-Carbon Electrical Network in Chile" Sustainability 11, no. 18: 5066. https://0-doi-org.brum.beds.ac.uk/10.3390/su11185066
Note that from the first issue of 2016, this journal uses article numbers instead of page numbers. See further details here.