A Critical Review of Policies on Pedestrian Safety and a Case Study of New Zealand


Department of Civil and Environmental Engineering, The University of Auckland, Private Bag 92019, Auckland 1142, New Zealand
*
Author to whom correspondence should be addressed.
Sustainability 2019, 11(19), 5274; https://0-doi-org.brum.beds.ac.uk/10.3390/su11195274
Submission received: 30 August 2019
/
Revised: 18 September 2019
/
Accepted: 18 September 2019
/
Published: 25 September 2019
(This article belongs to the Special Issue Pedestrian Safety and Sustainable Transportation)
Abstract
:Vulnerable road users contribute to nearly half of road deaths globally. In New Zealand, this group accounts for 26% of road deaths, which includes 8% of pedestrian crashes. This paper provides a critical review of the road safety policies from the pedestrian’s viewpoint for some of the best performing countries and discusses their effectiveness for the future. A case study is conducted for New Zealand to identify factors contributing to the pedestrian crashes and investigate the impact of the road safety policies on pedestrian crash trends. The policies are predominantly well informed by evidence-based approaches contributing to an overall reduction in the number of road crashes. However, little attention has been paid on pedestrian behaviour related to crashes. Finally, the paper makes recommendations for improving pedestrian safety to enable better safety outcomes that are closer to vision zero.
1. Introduction
With economic growth and increased urbanisation, many countries are experiencing transport-related problems as inherited transport infrastructure is unable to cope with increasing travel demand. These problems include an increased likelihood of crashes and severity of injury for unprotected road users, particularly pedestrians, due to their inherent vulnerability. A high proportion of pedestrian fatality is evident on a global scale, accounting for 22% of all road traffic deaths [1].
Insight can be gained from experiences of countries that have achieved the lowest number of road death such as Sweden and the Netherlands. Consequently, many countries are adopting and implementing a “Vision Zero” strategy [2,3,4].
New Zealand faces significant pedestrian safety-related issues as pedestrian crash trends have increased in recent years, even though the Safe System approach was introduced in 2010 as a national road safety strategy [5]. The vision outcome targeted a safe road system, which is increasingly free of death and serious injury. It recognised that people make mistakes and are vulnerable in a crash. It was expected to reduce the price paid for a mistake so that crashes do not result in loss of life or limb. There is a lack of evidence-based research that focuses on vulnerable road user behaviour in comparison to driver behaviour. Research evidence is required for policymakers to develop effective performance measures [5,6,7]. With many urban and land use initiatives promoting and encouraging increased walking trips, increased pedestrian movements in car-centric cities will lead to an increasing proportion of pedestrian-related crashes unless specific action plans are put in place to protect this group.
The specific objectives of this paper are as follows:
- analyse historical data of pedestrian crashes in New Zealand;
- compare pedestrian safety performance with best performing OECD countries;
- identify factors contributing to pedestrian safety between countries analysed;
- conduct a critical review of the road safety policies from the pedestrian’s viewpoint for some of the best performing countries in comparison to New Zealand.
This paper is organised into six sections. Section 2 provides a discussion on the main factors contributing to pedestrian safety, followed by a critical review of policies related to road/pedestrian safety, including Vision Zero and Safe System approach in Section 3. The research approach developed for this study is explained in Section 4. Section 5 presents a comparative analysis of pedestrian crashes and policies on road and pedestrian safety in New Zealand and some of the best-performing countries. Section 6 presents analysis of historical data of pedestrian crashes in New Zealand followed by discussion and recommendations in Section 7. Finally, some conclusions are drawn in the last section.
2. Factors Contributing to Pedestrian Safety
2.1. Built-In Environment
Pedestrian crash risk is multi-factored. Crashes vary significantly by location and time, complicated further by their statistical rareness and largely randomness in relation to being able to predict an occurrence. Urban cores commonly comprise mix-land use, diversity of trip purposes, and dispersed walking trip linkages [8]. The main urban road, which is usually classified as an arterial road or collector road, dominates the concentration of pedestrians and vehicle volumes. Zegeer and Bushell [9] explain that the number of pedestrian crashes is more likely to occur in areas with a higher population and road crossing movements. Pedestrians’ risk of death in these zones is 10 times higher than car occupants [10]. In fact, Jacobsen [11] remarked that vehicle–pedestrian crashes are less likely when the number of cycling or walking in particular areas increased. In an environment that prioritised pedestrians rather than vehicular modes, such as self-explaining roads or mixed-use shared spaces, a road function can influence road users’ manoeuvres and safety outcomes. These environments, if appropriately implemented, can create a safe, user-friendly place for vulnerable road users to dominate the primary space function, resulting in fewer crash events [12,13]. However, a key issue is that self-explaining roads or shared space roads cannot be implemented on all road types, especially arterial and collector roads when high through movement is prioritised.
2.2. Pedestrian Characteristics
There is evidence that elderly road user groups have a higher fatality rate in traffic environments than average road users. Additionally, the consequences of injuries to the elderly can be more severe [14,15]. Several countries reported that half of the road toll was among this group, and the proportion was relatively high in urban areas [16]. In addition, due to the increased number of the ageing population worldwide, a challenge of road safety policies is to ensure safer mobility of the elderly.
Road users who are alcohol-impaired is another group that shows a disproportionately high share in road crashes [17] in the USA indicated that almost 48% of crashes in 2015 were pedestrian fatalities that involved some alcohol-impairment from both drivers and pedestrians. The trend is similar in Sweden, where pedestrians with alcohol involvement showed a higher crash risk, and this constituted between 39% and 60% of pedestrian crashes [18]. Charlton and Starkey (2013) in New Zealand indicated that alcohol consumption resulted in cognitive impairment such as visual attention, vigilance, and driving tasks when a BAC level reaches 0.08% [19].
Distraction by electronic devices using mobile phones or music players among road users does not currently present as a primary contributing factor to pedestrian crashes. This is most likely due to under-reporting problems due to the difficulty of obtaining real causality factors. However, an upward trend in mobile phone use while driving poses a higher likelihood of crashes [20,21]. In New Zealand, mobile phone use remains an issue with 60% of drivers admitting using cell phones while driving, despite hand-held mobile phones being banned since 2009 [16].
2.3. Pedestrian Behaviour
Pedestrians and vehicle interactions are common at road crossings where sharing the right of way creates a greater potential of conflict and, therefore, a higher risk of crash involvement. In most cases, the casualty can be examined from road rule compliance. Studies indicate that the lack of adherence to the traffic regulations from both drivers and pedestrians is one of the critical factors associated with pedestrian crashes [22,23,24,25,26]. King et al. [25] reported that the relative risk of non-compliance crossing was eight times higher than in legal crossings at signalised intersections. Collisions from road rule violation may aggravate the situation, particularly when involved with high-speed vehicles. Várhelyi [26] stated that only one in four drivers would lower their speeds or brake when they are encountering pedestrians who are on or about to step onto the zebra crossing, and most of them did not prepare to reduce speed for unexpected situations. Pedestrians are unprotected road users and as such are significantly more likely to sustain greater injury severity with increased relative vehicle conflict speeds.
The provision of controlled pedestrian crossings is believed to enhance the safety and mobility of pedestrians, but it does not always guarantee road user’s (pedestrian and driver) compliance. Studies reveal the counterintuitive evidence that the presence of pedestrian crossing facilities is found not to be significant and seems to create a false sense of safety in some situations [27,28]. Pedestrians are more likely to be impatient when the waiting time increases [23,27,29,30,31] or crossing during the red signal phase seems easy [32]. Non-compliance behaviour is, therefore, considered as one of the key factors associated with increased crash risk.
3. Policies Related to Road/Pedestrian Safety
3.1. Vision Zero
Vision Zero was first introduced by the Swedish Parliament in 1997 under an ethical imperative that “No one will be killed or seriously injured within the road transport system.” While it is accepted that humans can make mistakes, the core concept is a biomechanical tolerance of a human body. Crash severity needs to be addressed through the design of a more forgiving transport system in a way that minimises the forces on humans, thereby preventing or reducing human injury. The main change is shifted away from a traditional traffic safety system toward the adoption of an approach where responsibilities are shared between system designers and road users. The system designer has the ultimate responsibility for the transport design and operation, whereas the road user needs to follow traffic laws and rules. If the road user fails to obey these rules, the system designer is required to take a further step to improve infrastructure design to be more forgiving, thereby reducing the severity of traffic injury and especially the probability of fatal injury. The Swedish Vision Zero had an initial general target to halve the number of fatalities and decrease serious injuries by one quarter between 2007 and 2020. This strategy resulted in a successful reduction in fatalities. In 1997 when Sweden launched Vision Zero, the fatality rate was 6.1 killed/100,000 inhabitants. In 2015, the fatality rate was 2.6 killed/100,000 inhabitants, the number of road deaths has decreased by 57%, which represents an average annual decrease of 3%. [33]. This, however, primarily resulted from improved safety of the vehicle fleets and infrastructure design and operation with notably reduced traffic operating speeds [16]. In addition, a renewed commitment to Vision Zero was released in 2016, and this updated policy highlighted the need for infrastructure design, maintenance, and operation improvements specifically targeted at vulnerable road users. Speed limit investigations in built-up areas are targeted primarily at the safety of pedestrians and cyclists [34].
Vision Zero is said to be driven by an ethical and human value that will not be compromised by economic aspects or cost-benefit analysis [35]. Adopting Vision Zero requires innovative investment approaches into re-engineering and/or operation of the inherited road transport system and a commitment from the government is an essential step in implementing this strategy. The challenge is how to appropriately engage society in implementing the required change in investment priorities and user behaviour within the complex transport system. The Swedish Vision Zero strategy that many countries have since also adopted or considered adopting has been successful despite the strategy not clearly articulating specific strategy content [35,36].
3.2. Safe System Approach
In New Zealand, a Safe System approach was introduced in “Safer Journeys” as a national road safety strategy in 2010. The Safe System principles focus on creating a safe transport system for road users to reduce the consequences of crashes by recognising human fallibility and their vulnerability. System designers and system users must share responsibility. All four pillars of the system including roads and roadsides, speeds, vehicles, and road users need to be strengthened [7]. However, Safer Journeys does not have a general target reduction. Instead, it uses performance indicators for a specific group of activities. The implementation and progress are monitored through a series of action plans periodically from 2011 to 2020. Table 1 summarises the core activities in the New Zealand Safer Journeys for this period.
Safe Road Use, the Safer Journeys pillars, specifically targets user behaviour of young drivers, impaired drivers, and motorcyclists through enforcement and education campaigns. This is explained by targeting improved user performance as drivers who are skilled, alert and able-bodied are more likely to comply with road rules [7]. Interestingly, driver behaviour change has had a greater role in meeting outcomes from the action plans compared to pedestrians. This pillar does not include pedestrian safety or behaviour as a high concern, and a few core activities have focused on this group. A possible reason may relate to the majority of road crashes that are dominated by vehicle drivers or occupants, and this remains a critical factor in regulating strategic plans, whilst other road users being a minority are often overlooked.
Viewing other Safe System pillars, Safe Speed and Safe Roads and Roadsides, New Zealand policy tends to focus on improving high crash risk location factors, particularly on rural roads. The pillars, Safe Speed, aims to minimize the impact of vehicle speed as a causal factor to make a crash survivable. Speed reduction is targeted by influencing road user behaviour through reduced speed limits, speed enforcement, and speed calming (i.e., chicanes, speed humps, planted side islands, or roundabouts). In recent years, reducing speeds has been an increasing priority, especially around school zones and other residential zones. Road Controlling Authorities plan to apply speed limits consistently throughout the nation by 2020; however, priorities have consistently focused on the highest severity and crash risk rated areas. This often means that network-wide treatments and policies that focus on non-driver user behaviour because of lower exposure are a lower priority [37,38].
In term of Safe Roads and Roadsides, increased investment has begun and will continue improvements in rural road safety, such as the “Safety Boost Program”. Approximately $22.5 million of safety improvements along regional State highways is programmed, adding to an existing $100 million per annum for rural roads [37]. In urban areas, cycling safety investment improvements has also significantly increased from a very low initial position, now funded at $400 million [39]. Pedestrian safety, however, has been considered mainly by identifying and targeting high-risk intersections, whereas most of the pedestrian crashes, pedestrians being struck while crossing the road, currently occurs at untreated intersections (see Section 6.2 and Section 6.3). Although Urban KiwiRAP has identified high-risk arterial roads and areas where vulnerable users are most likely to crash, any national approach is yet to resolve the level of risk systematically. Also, approximately 94% of NZ urban roads are operated by local government by local road controlling authorities that are less co-ordinated and more variable in their approach to road safety outcomes [37].
Finally, the Safe Vehicles pillar mainly works toward ensuring compliant vehicle safety standards. There is no current evidence of encouraging more pedestrian-friendly products in vehicles such as the frontal protection system, other than encouraging owners to purchase vehicles with higher overall aggregated ANCAP safety star ratings [40]. With these current and short-term future targets, improved pedestrian safety may not significantly improve.
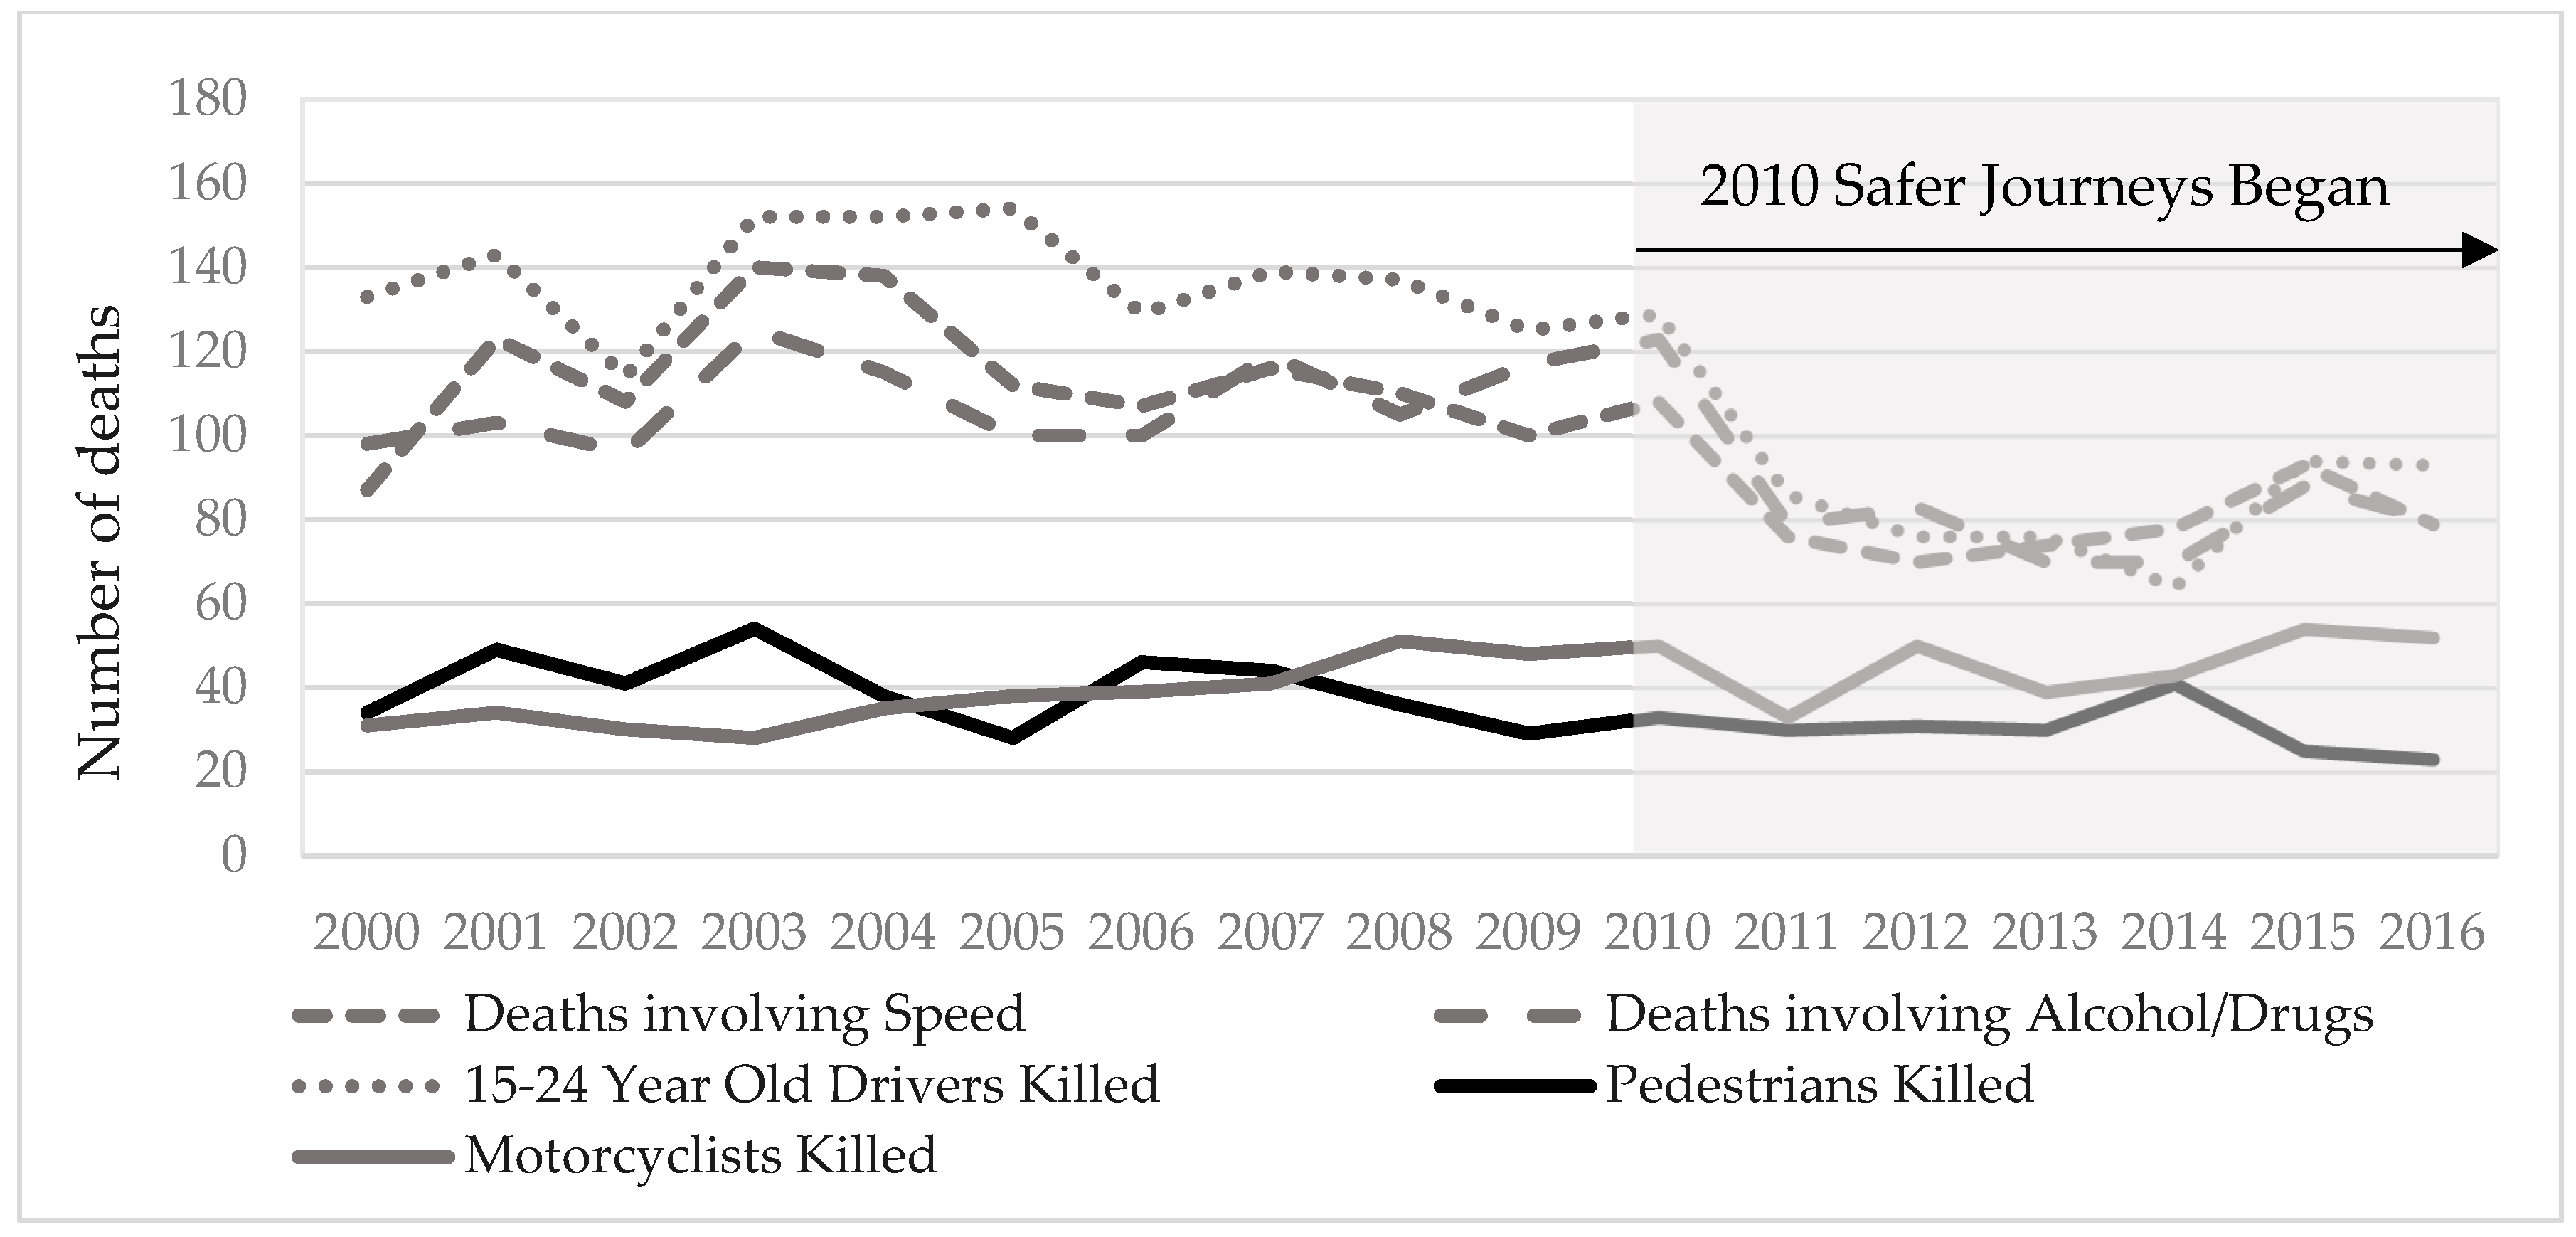
Figure 1 illustrates New Zealand pedestrian fatality trends compared to other crash types (areas of high concern in action plans) before and after the implication of Safer Journeys. The figure indicates that fatality in vulnerable road users did not significantly decrease. Since the launch of Safer Journeys in 2010, there was an overall decrease in road deaths involving young drivers, speeding drivers, and drugs/alcohol-impaired drivers despite a slow increase after 2014. In contrast, the number of pedestrians killed has remained relatively constant, and the trend has become worse for motorcyclists.
4. Materials and Methods
This paper evaluates two primary issues—New Zealand historic reported pedestrian crashes and national and international road safety policies. The evaluation will help in assessing how close New Zealand is to achieving targets from a Safe System approach. The research investigated five years of crash data from 2012 to 2016 (unless stated otherwise) from the New Zealand Crash Analysis System (CAS) and the amount of walking from 2012 to 2015 from the New Zealand Household Travel Survey (NZHTS). The CAS database, used to store and analyse road crash causations, is New Zealand’s primary tool for collecting, storing, and analysing crash records. Data are mainly obtained from Traffic Crash Reports (TCRs) completed by police officers when crashes occur at investigated scenes. Details are reviewed and added to the CAS database by the NZ Transport Agency. A five-year period is preferred because it provides a sufficient number of crashes for meaningful results whilst limiting the effect of fundamental changes on the network or driving rules. It also helps reduce statistical fluctuation and the effect of regression-to-the-mean [41]. The amount of walking from NZHTS is obtained from travel diary questionnaires or self-completed and household interviews. It includes recreational walks and calculated using a ‘trip leg’ defined as a non-stop leg of travel by a single mode. For example, driving to work with a stop at the shops on the way would be two trip legs. Crossing or walking for 100 m or more on a public footpath or road are counted. The data are then weighted to represent the New Zealand population [42,43,44,45].
In comparison to best-performing countries, several databases were obtained. These include Eurostat, CARE database, the Netherlands (CBS Statistics Netherlands, SWOV Institute for road safety research), the United Kingdom (Department for Transport, DfT; Transport for London, TfL), Sweden (Trafikanalys Swedish Transport Administration, SCB Swedish official statistics, Stockholms stad), and Australia (Bureau of Infrastructure, Transport and Regional Economics, BITRE; Transport for NSW).
5. Analysis Results
5.1. Pedestrian Crashes Time Series Data
Globally, Europe, Australia, and New Zealand have lower traffic and health risk compared to other regions [46]. Of all countries, Sweden, the United Kingdom, and the Netherlands (known as SUN countries) are among those with best practice in road safety [47]. Figure 2 shows a comparison between best-performing countries to New Zealand’s crash record. It provides the proportion of pedestrian crashes to all crash types. At an initial glance, it looks as if New Zealand had the lowest proportions of pedestrian fatalities. However, when comparing to pedestrian fatalities per million population (Figure 3), the result shows that New Zealand is not performing as well. Despite a drop in the pedestrian fatality rate from 2006 to 2008, the rate is still relatively high.
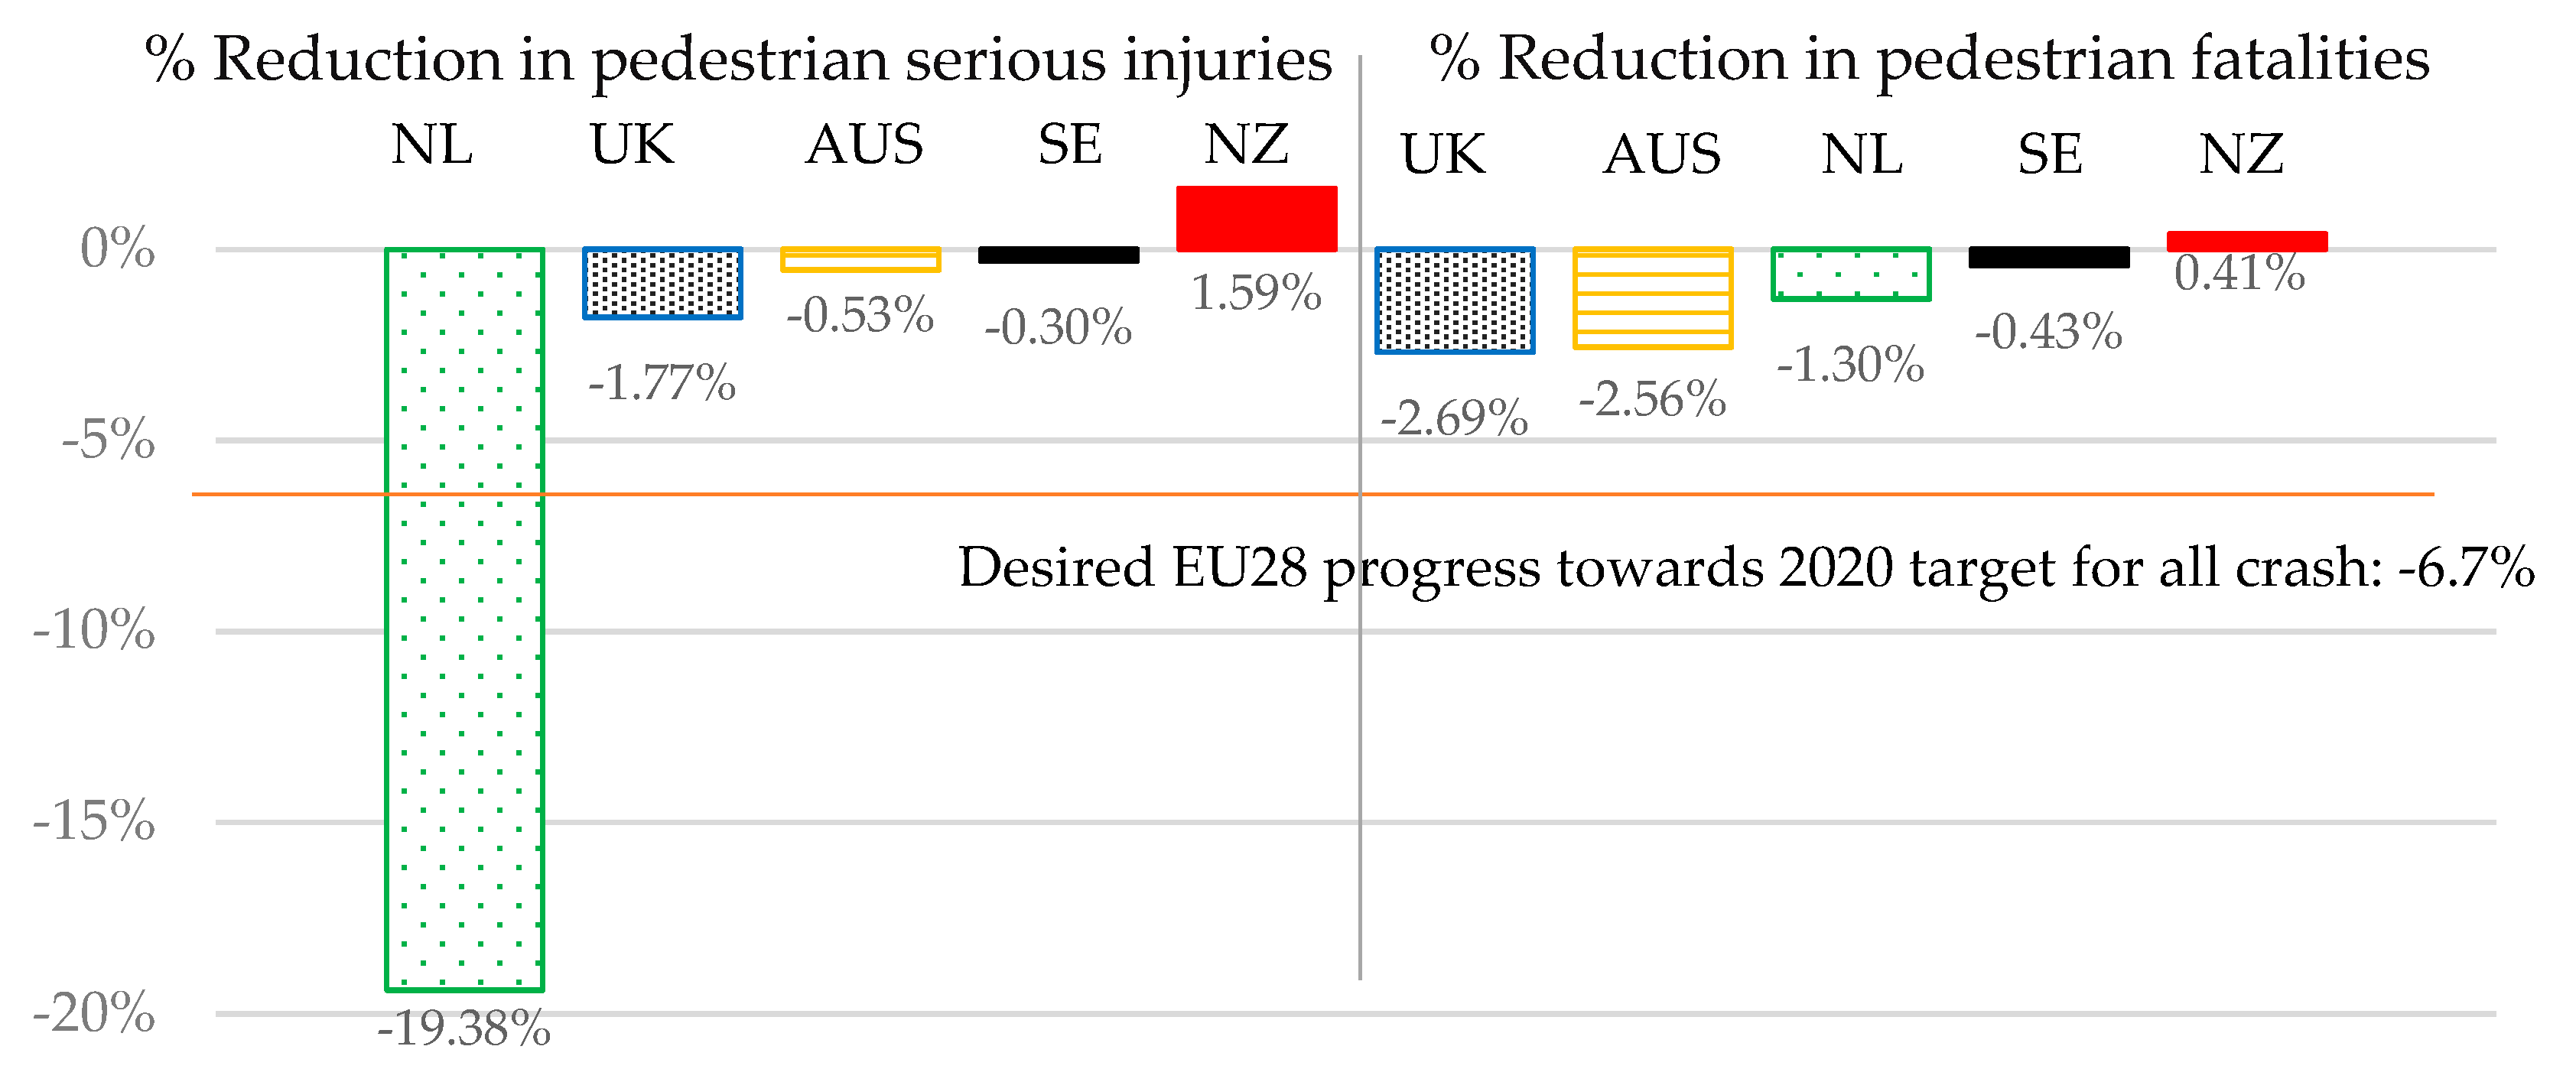
This is apparent when looking at the average annual percentage of pedestrian crash reductions in Figure 4. The Netherlands has achieved the highest reduction of serious injuries, whilst the UK has shown the most significant change in reducing pedestrian fatality. In contrast, pedestrian fatalities and serious injuries have increased in New Zealand. These figures, however, must be cautiously interpreted, as data collection methods and the definition of crash severity differs significantly between countries. For example, the definition of seriousness in the Netherlands and Sweden is normally referred to the number of people who are seriously injured based on MAIS (A trauma scale refer to ‘Maximum Abbreviated Injury Score.’ Seriously injured = all road victims with a MAIS score of 3 or more (MAIS3+)) [48]. For Australia, the ‘high threat to life’ hospitalized injury cases that are a subset of all serious injury [49] are similar categories for serious pedestrian injuries studied in this study.
5.2. Timeline of Road Safety Policies
The transport authorities in New Zealand have made significant progress since 1987 in reducing fatal road crashes (although, more recently, this has again been increasing). However, these policies did not achieve significant reductions in the number and severity of pedestrian crashes as most gains occurred to vehicle drivers or passengers
Table 2 summarises national road safety strategies and provides examples of local and regional action plans that have an impact on pedestrian safety from best-performing countries and New Zealand. As can be seen, the principal strategy was initiated at the highest level from central government and implemented mostly by the NZ Transport Agency that manages the National State Highways and/or regional or local authorities. A number of policies explicitly focus on the improvement of infrastructure, speed management programmes, driver behaviour, and child pedestrians. Australia has a clear principle toward urban safety management and vulnerable road users. Similar to European countries, area-wide traffic calming of 30 km/h zones are commonly implemented in the United Kingdom, Sweden, and the Netherlands. Guidelines focusing on lowering speed limits to more survivable impact speeds are lower compared to New Zealand.
As New Zealand does not now manufacture vehicles, vehicle safety is largely impacted by countries where vehicles are imported from (new and used), and the average vehicle fleet age (>14 years old) is quite old in comparison to comparator countries. The New Zealand vehicle safety policy is therefore barely evident other than ensuring vehicles meet minimum ‘warrant of fitness’ standards and encouraging the purchase of vehicles with higher safety standards [40]. In contrast, countries such as the Netherlands, the United Kingdom, and Sweden have been progressing through creating tighter generic safety requirements for motor vehicles, i.e., improving frontal impact testing in cars or pedestrian protection.
Viewing the timeline of significant events on pedestrian safety and pedestrian death rates per million population from Figure 5 indicates a relatively crude but un-proven co-relationship between policies and crash trends. Although this relation may not be fully understood, and notably outcomes in pedestrian crash reduction cannot be attributed in isolation to a single policy, the strategies have led to a significant move in reducing pedestrian crashes in some countries. Overall, the United Kingdom and Australia have shown forward progress in reducing pedestrian deaths in comparison to other countries. Positive outcomes could be a result from the stringent targets to reduce the number of pedestrian casualties being one of the major national safety indicators. The Netherlands and Sweden have had the lowest number of pedestrian deaths, although its reduction rate per year has reached a stable level and has remained relatively static for the last decade. A possible explanation may be due to these countries’ road safety policies are integrated into various policy areas, and their action plans are constantly monitored over two decades. Although several policies emphasise the protection of vulnerable road users through speeds and drivers, there is a strong commitment in an urban environment with a focus on pedestrians and cyclists.
The policies that may seemingly have had the most positive impact (if taken in isolation) on pedestrian safety in New Zealand are the Road Safety to 2010 that was implemented in 2003 and the Getting there-on foot, by bicycle policy in 2006. The number of pedestrian deaths overall during this period has trended slightly downwards after these policies were introduced, although, from year to year, there have been significant fluctuations. However, since 2010, with the less obvious action plans and monitoring programmes targeting specifically pedestrian safety in the Safe System Approach, the number of pedestrian deaths has remained relatively stagnant.
6. Pedestrian Crashes in New Zealand
New Zealand’s Safer Journeys approach may have contributed to an overall death toll reduction. However, during this same analysis period, pedestrian safety has not significantly improved. A possible reason for this is less attention has been paid to infrastructure and user behaviour improvements targeting pedestrian safety in comparison to more dominant crash types. To identify what these problems are and the gap between pedestrian crashes and Vision Zero targets, the study further analysed New Zealand pedestrian crash records.
6.1. Trends
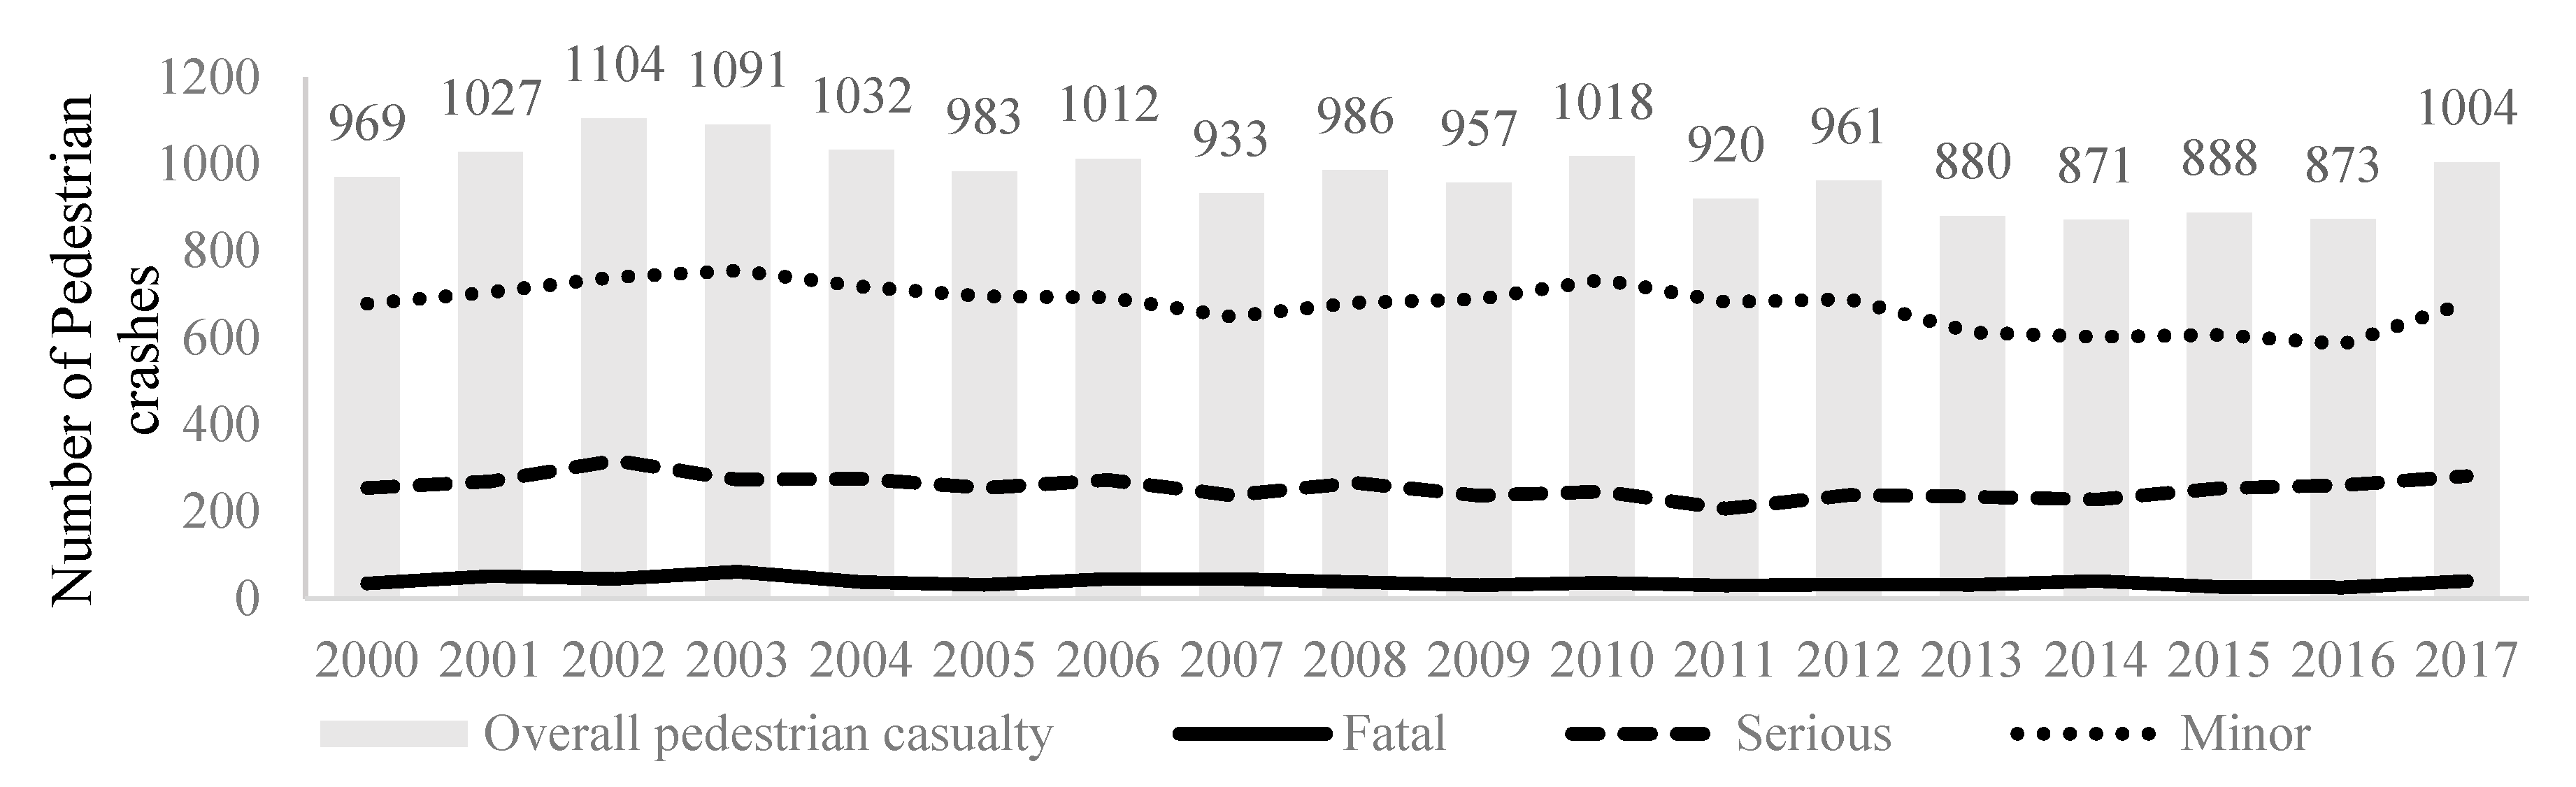
As can be seen from Figure 6, the total reported number of pedestrian deaths and injuries, throughout the country, has some year-to-year rise and fall from 969 in 2000 to 1004 in 2017. Nevertheless, pedestrian crashes have decreased mainly on minor injuries between 2013 to 2016, whereas no significant reduction in pedestrian fatalities and serious injuries were found. Notably, only a proportion of minor injury crashes are recorded in CAS [72]. Data that includes minor injury crashes is therefore less reliable because the under-reporting issue is much higher and more variable depending upon the location in comparison to fatal and serious injury crashes.
Figure 7 provides the number of pedestrian fatalities and serious injuries (FSi) per million km walking from 2005 to 2015. The result has shown a gradual increase in FSi rate since 2011 with a small fluctuation during this period, despite a slight drop in walking by an average annual rate of about 1%. The pedestrian risk exists, but data interpretation is mainly drawn from the million km walking per year, where it is not yet finalized. Overall, it can be concluded that pedestrian safety has not significantly improved.
In addition, according to the summary of transport future for New Zealand report [73], the number of walking trips has been forecasted to increase rapidly by 25% and almost 50% in Auckland to 2042/2043, despite a gradual reduced trip per capita. The future opportunities and choices are projected to shift to public transport and active modes, in particular, the urban cores where there will be major improvements in public transport and facilities for walking and cycling. Pedestrian crash quantity, therefore will likely to increase because of the overall increased exposure.
6.2. Locations and Times of the Day
Pedestrian crashes in urban areas are much higher than rural zones due to intense interactions between vehicles and pedestrians in urban cores. Of all 5139 pedestrian crashes (CAS, 2012–2016), almost 42% occurred on major urban roads, whilst 40% was on minor urban roads. When filtering the total number of pedestrian crashes to pedestrian crashes at road crossings, 89% occurred at uncontrolled sites (Figure 8). Uncontrolled crossings are facilities where provisions are made for cyclists and/or pedestrians to cross the road and priority is not given through the use of signals. The range of facilities includes kerb extensions, median refuges, raised platforms, kea crossings, and zebra crossings [74]. The reports also show that most pedestrian crashes occur during peak hour between 14:00 and 18:00 and morning peak from 8:00 to 9:00. Fatal crashes are about three times higher at evening peak than during the night. This may primarily because there are more cars and more pedestrians’ movements on the road than any other times.
6.3. Contributing Factors
The exposure of conflict between pedestrians and vehicles is known to be more frequent at road crossings and consequently creates a higher risk of crash involvement, particularly in urban areas. Figure 9 shows that crossing the road was the leading factor in pedestrian FSi accounting for 28% (876 crashes) of the total. Drivers did not see or look for another party comprised 12%, whilst alcohol or drugs from both pedestrians and drivers accounted for a further 6%. In rural areas, pedestrians wearing dark clothes (failed to notice category) and alcohol-impaired non-drivers were the leading causes of pedestrian fatality and serious injury. It is possible that poor visibility and higher operating speeds on rural roads may affect drivers’ ability to see, perceive, react and brake appropriately and therefore impact speeds and consequently, injury severity is greater.
6.4. Victims’ Characteristics
The number of pedestrian deaths and injuries per million h walking across different age groups (see Appendix B. Data and analysis of the number of pedestrian deaths and injuries rate) (as shown in Figure 10) illustrates that the over-75 group is the most vulnerable. This group spent less time walking than other groups, but their fatal and serious injury (FSi) rate was the highest. The evidence is consistent with a previous study [75], implying the failure of the elderly in being able to either see and perceive risk and taking an appropriate counteraction movement may result in a higher risk of collisions. The risk of road crashes in adults aged 25–34 years was also higher than others, and this is most likely due to higher risk-taking actions. In contrast, there was a significant drop in the crash risk among children aged 10–14 years-old in New Zealand compared to previous studies [75,76]. This could result from the implementation of road safety education policies, where children are trained to be aware of the safe road crossing, using walkways and safe practices in and around vehicles [77,78].
Comparing between genders (Figure 11), males represented a higher FSi per million h walked than females from all age groups. Males aged 25–44 were exposed to a crash risk 2.7× higher than for women of the same age. However, there was less difference in crash risk between genders among the age of 0–14 and the over 65. This may relate to the similarity of time spent walking within these groups.
6.5. Road Users’ Behaviour
Analysis of pedestrian crash records (CAS 2012–2016) from NZ police reports suggests that factors involved in pedestrian crashes primarily involve people making unsafe choices such as a drivers’ decision to go/not to go or pedestrians deciding when and where to cross the road. The reported evidence from CAS indicates that 89% of all reported factors relate to road user behaviour on pedestrian related crashes were likely (>50%) as opposed to vehicle drivers be related to pedestrian behaviours. This must be considered in relation to crashes being multi-factored events and that it is commonly reported that almost every crash (>90%) has human-related factors in the crash occurring.
This evidence is consistent with OECD [79] that serious injury of road crashes resulted from deliberate violation and risk-taking behaviour in best performing countries in road safety accounting about 30%. For example, in GB, the pedestrian failed to look properly has remained the most reported contributory factor resulting in pedestrian death and injury, whereas pedestrian carelessness, recklessness, or in a hurry was reported in 29 per cent of crashes [80]. Elvik et al. [46] found that vulnerability of road users, road user behaviour and poor system design, are the most important factors evidenced in the first-order attribute risks of the major road safety problems in Sweden. The study suggested that if there is no road-rule violation, the number of fatalities would be reduced by 63%.
Figure 12 illustrates that pedestrian running and crossing heedless through the traffic were the most common reasons that accounted for over one half of crashes both at intersections and mid-block sections. Stepping out from behind a parked vehicle made up a further 15.4% at intersections and 9.4% at the mid-block crossing. These figures explain that being in a hurry and being impatient influences pedestrians’ choice to cross. In addition, not complying with the signals comprised 8.5% at the intersections and 0.6% at the mid-block section. However, it should not be inferred that this is not an issue in mid-block areas. The evidence could be partly because the priority of traffic movement at the mid-block locations is not always given by the signals. Furthermore, pedestrian movements can be complicated compared to the vehicular traffic that is restricted to the road-rule and lane discipline. Pedestrians are required to use a pedestrian crossing if they are within 20 m of a pedestrian crossing. Additionally, they are not allowed to suddenly enter the pedestrian crossing when the driver approaches so close or unable to give way to pedestrian [81]. In addition, the results obtained from the Crash Analysis System based on the crash movements where road user’s maneuverer before the crash; and crash caused factors assigned in the database, e.g., crossing the road behind the parked vehicle. Other factors, including physical or environmental factors, may contribute to this crash.
Viewing driver behaviour from Figure 13, ‘did not check’ or ‘notice another party’ and ‘failed to give way to the pedestrians’ were the leading factors at intersections, whilst ‘did not check another party behind’ was an issue at the mid-block sections. Furthermore, about two-thirds of pedestrian’ crashes involved full licensed drivers. Although the majority of licensed drivers (85%) are on the roads [82], it is interesting to note that the result is contradicted by the Safer Journey vision as discussed in Section 2 that drivers who are skilled, alert, and unimpaired are more likely to comply with road rules and will be an initial move to improve road safety outcomes [7].
The factor that was not presented as the main factor in the figures above but pertained to pedestrian safety studies is vehicle speed. Deaths and severity of injuries from a pedestrian hit by a driver are found to have a strong dependence on speed [83,84,85]. Figure 14 indicates that most of the pedestrian fatalities occurred on urban road where the speed limit is 50 km/h, but it was primarily minor injuries. A possible explanation is that pedestrian trips are more condensed in urban areas where the standard speed limits on urban roads are 50 km/h. According to NZ Transport Agency, Speed limits of 60 and 80 km/h are suggested for arterial routes, whereas 70–80 km/h is appropriate in areas of intermediate roadside development, such as small country towns or urban fringe areas. A speed limit less than 50 km/h is necessary for safety purposes in urban traffic areas of shared zones, local roads or minor collector roads. It is also advised the speed limit of 20, 30 or 40 km/h [86]. The risk of serious injury or death increases substantially when the collision speed exceeds 40 km/h. This result supports a previous study [83]. Though drivers in speed-related crashes may not always reflect the actual speed when crashes occurred, it illustrates that the speed environments potentially contribute to a different level of pedestrian deaths and injuries.
6.6. Distractions for Road Users
Table 3 provides the number of pedestrian fatalities and serious injuries caused by road users’ attention being diverted. Drivers emotionally upset/road rage and pedestrians who were distracted by a cigarette, cell phone, or music player were the most influential factors. Pedestrian fatal and serious injuries due to drivers’ using their cell phones only accounted for 1%. The likely reason for very few crashes resulting from drivers using cell phones may relate to under-reporting of the real contributing factor.
6.7. Pedestrian Crashes and Economic Growth
The economy is an important factor affecting the trend of crashes. The relationship between population, overall road deaths, pedestrian crashes and economic determinants of travel, including real Gross Domestic Product (GDP) [87], the number of vehicle ownership, and Vehicle Kilometres Travelled (VKT) [88] is shown in Figure 15. The result suggests that overall road deaths and pedestrian crashes have been trending down during 2001–2013, despite increases in GDP, VKT, vehicle number, and population. However, road deaths again turned upward well after 2013. Likewise, pedestrian death trend that remained constant from 2013. It is likely that economic determinants such as GDP may affect the travel demand and therefore have the positively reflect on the road crashes through changes in vehicle and road quality and trauma care. Conversely, recent economic growth and increased urbanisation also results in transport-related problems, which potentially increases the likelihood of crashes. It should be noted that this result may have multi-factors involved, and cross-sectional studies are required.
7. Discussion and Recommendations
The analysis of pedestrian crashes in New Zealand shows that fatal and serious injury crashes for pedestrians remain relatively high in New Zealand, compared to some of the best performing countries. The analysis also indicated that national policies are generally broad in nature and involve multiple government and non-governmental organizations. A global comparison has shown that the Netherlands’ Sustainable Safety and Sweden’s Vision Zero have consistently achieved the lowest pedestrian casualties. They have focused on modifying road design standards, developing reduced speed management programmes and improving vehicle safety, especially for vulnerable road users. On the other hand, the greatest improvement over the 15 years analysis period has been achieved by the United Kingdom and Australia. They have achieved this possibly by setting the most stringent targets in reducing the number of pedestrian casualties and monitoring progress against national indicators.
In New Zealand, Road Safety to 2010 and ‘Getting there-on foot, by bicycle’ policies have seen some success in reducing pedestrian casualties from 2000 to 2010, although with large variations from year to year. Post-2010, the Safer Journeys, which includes the Safe System Approach, has been seemingly less effective in causing further reductions. The action plan of Safer Journeys provides a useful guide for practitioners on designing for pedestrians, but urban development plans focus mainly on high-risk roads and intersections. Overall, it is important to note that achievement on discussed policies may or may not directly impact pedestrian crash trends. A thorough assessment of each policy is needed. It is also useful to evaluate safety effectiveness drawn from a comparison of before and after studies [89].
The results from pedestrian crash data analysis in Section 6, demonstrates factors affecting the crashes and the key areas that should be addressed in improving the NZ Road Safety Strategy for pedestrians. Generally, the reduction of pedestrian casualty over almost twenty years seems to have decreased in the minor injury crashes category rather than for fatal or serious injury crashes. The ageing group is the most vulnerable road user in both genders. Crossing the road in urban areas creates the highest risk of pedestrian crashes particularly at uncontrolled crossing sites. There also is an increasingly high rate of pedestrians with unsafe user behaviour who do not comply to traffic rules and/or use digital devices (e.g., mobile phones and headphones) that distract attention from the crossing task even at appropriate crossing facilities.
This paper recommends that, in the next version of the NZ Safer Journeys strategy, a specific pedestrian crash and injury severity reduction target is specified to strengthen NZ road safety commitment and enables monitoring of future performance. The importance of safety for pedestrians deserves special attention due to their vulnerability to high severity injury. National reduction targets should include pedestrian fatal and serious injury crashes as one of the key indicators. It is expected that this would focus attention and thereby contribute to reducing the number of road deaths and serious injuries as a whole. Wider political support, approval, and facilitation of numerical outcome targets is important to enable road safety improvements in New Zealand and internationally.
Action plans related to pedestrians should expand to providing practical prevention programmes for the elderly. The growing size of this group, their vulnerability and its growing share in pedestrian crashes requires specific attention [90]. There is an increasing concern in elderly road users with ‘underdeveloped or diminishing competences’ as reported in the Netherlands Sustainable Safe that the safety system is for everybody, not just the average road users.
Regarding road user behaviour, the New Zealand Safe system approach accepts the fallibility of humans resulting in people making errors unintentionally. However, people can also violate traffic rules intentionally. Such behaviour is likely to be problematic in NZ. Although crashes are complex events and could cause from multi-factors, the evidence (Section 6.5) showed that road user behaviors, and particularly pedestrians, is one of the main factors contributing to their crashes. Safe system approaches accept human mistakes will occur and the inherent risk of changing the road environment to induce safer behavior, but road users are also expected to comply responsibly to the road rules. Therefore, a safe system that targets Vision Zero approaches must incorporate education, enforcement, and engineering and additionally all road and traffic system users and not only drivers.
An increasing magnitude of pedestrian issues occurs in the built urban environment compounded by an increase in crash exposure. New Zealand road safety strategies need to also target urban form and how transport systems integrate with land use to ensure long-term improvements in pedestrian safety. There are opportunities to further invest in urban planning and operational management. Crash location treatments should cover areas where crashes involving pedestrians are concentrated. An example project on speed limits in extended urban areas with high pedestrian density is shown in Australian policy, and area-wide, traffic calming zones with lower speeds implemented in the UK, Sweden, and the Netherlands.
Certainly, improving road safety costs money, and funding allocation can be a challenge in achieving the desired results. NZ countermeasures are based on an economic appraisal [72] where some options are made on a low-cost budget such as the treatment of specific high-risk locations or intersections rather than looking at mass actions along a whole alignment. These measures often cover small areas or short distances and may result in a lack of safe facilities for pedestrians between untreated locations. Funding and resource allocation mechanisms require careful consideration as a decision and infrastructure improvement can cause crash migration to occur longitudinally along the traffic route.
8. Conclusions
This paper investigates historical pedestrian safety in New Zealand (2000 to 2016) and compares performance to some of the best-performing countries. Policy options are discussed in attempting to achieve an outcome closer to Vision Zero. The method includes an analysis of national and international road safety strategies and factors associated with pedestrian related crashes. The strategies were compared, and recommendations were made by mapping national policies to the results from crash data analysis. The findings reveal a limited correlation between recent New Zealand road safety policy and pedestrian safety outcomes. It suggests a radical shift in pedestrian strategy to complement current practices. A specific pedestrian crash and injury severity reduction target should be specified in the NZ Safer Journeys strategy. The practical prevention programmes need to be concerns various road user groups, including elderly pedestrians. Further investigation should be conducted particularly in an urban environment, whereas crash location treatment could be extended to adjacent areas where pedestrian-related crashes are condensed. The usefulness of this study is to provide implementational learnings from investment lessons learned to develop practical solutions in improving safety policies. Although this study used New Zealand as a case study where strategies addressing pedestrian problems may differ between countries, it serves as a guideline to assess policy issues on a strategic level in any setting. The limitation of this study is that policy documents on pedestrian safety and pedestrian crash analysis are assessed specifically on the macro level with a focus on transport road safety strategy rather than the micro level. It should be noted that the New Zealand Ministry of Transport has produced a new Road to Zero: Road Safety Strategy (2019) for the period of 2020 to 2030 [91] as a new strategy policy document. This has not been specifically analysed in this paper.
To analyse crash trends over time requires an understanding of the multifaceted and integrated human/ vehicle and infrastructure aspects of road safety. Positive future road safety outcomes of reduced FSi requires evidence-based policies and monitoring of policy and infrastructure implementation to determine cause and effects. For example, the introduction of new technologies such as the development of Automated vehicles (AVs), will likely reduce pedestrian crashes resulted from unintentional driver errors at some point in the future. However, AVs’ ability without driver intervention to interpret the cues of pedestrians and perceive and interact with pedestrians that have more and more personal device distractions and vice versa is challenging and an area that requires greater attention. Furthermore, new insights into crashes, pedestrians and other road users related behaviour should be investigated. It should include not only current technologies but additional modes (e.g., Micromobility devices) that increasingly share the road reserve space and potentially increase pedestrian exposure, crash risk and injury severity.
Author Contributions
All authors were part of the conceptual idea. A.S. conceived and designed the analysis; A.S. and D.W. analyzed and verified the data; all authors reviewed the results and approved the final version of the manuscript.
Funding
This research received no external funding
Conflicts of Interest
The authors declare no conflict of interest.
Appendix A. Factors
This study retrieved pedestrian crashes statistics from the Crash Analysis System (CAS) database. The factors are grouped into related categories to identify reasons why the crash occurred, based on CAS package. The driver and pedestrian-related factors are shown as follow;

Table A1.
All road user factors.
| Alcohol | Drugs |
|---|---|
|
|
|
|
|
|
|
|
|
Table A2.
Driver only factors.
| Failed to Give Way | Attention Diverted by |
|---|---|
|
|
|
|
|
|
|
|
|
|
|
|
|
|
|
|
|
|
|
|
|
|
|
|
| Failed to notice |
|
| Trying to find intersection, house number, destination, etc. |
|
|
|
|
|
|
|
|
|
|
|
|
|
|
|
|
|
Table A3.
Pedestrian factors.
| Miscellaneous Pedestrian | |
|---|---|
|
|
|
|
|
|
|
|
|
|
|
|
|
|
|
|
|
|
|
|
| |
| |
|
Appendix B. Data and Analysis of Pedestrian Fatalities and Serious Injuries (FSi) Rate.
This study uses two data sources for measures of exposure to pedestrian crash risk. First, total numbers of pedestrians killed and seriously injured in road crash derived from Crash Analysis System (CAS) provided by the New Zealand Transport Agency (NZ Crash data in this study is not publicly available. It requires permission from the NZ Transport Agency). This data is used as a numerator. Second, ‘hour spent walking and walking distances’ from the New Zealand Travel Survey are used as a denominator of the Fatal and Serious injury (FSi) rate as follows:
Overall fatal and serious injury (FSi) rate in Figure 7 is estimated using the number of pedestrian deaths and serious injuries and the exposure measure ‘million km walking per year’ from 2005 to 2015, as shown in Table A4. FSi rate by different age groups and gender as shown in Figure 10 and Figure 11 are calculated using the number of pedestrian deaths and serious injuries per year from 2012 to 2014 combined with the exposure measure ‘hours spent walking’. Table A5 and Table A6 provide data for this estimation.
In addition, the New Zealand Household Travel Survey (NZHTS) collects information about day-to-day travel in randomly selected households for two days. As mentioned in the Materials and Methods section, the amount of walking obtained from travel diary questionnaires and interviews. A target a population is a ‘usually resident’ population of all ages. The definition of ‘walk’ includes walkers, joggers, users of mobility scooters, and children on tricycles. A single leg of a journey, with no stops or changes in travel mode, are calculated as a ‘trip leg’. It should be noted that for children under five years old, the dominant travel purpose is ‘accompanying someone else’, e.g., going on the parent’s errand. Information on the travel behaviour of children under 10 years old was generally obtained by interviewing a responsible adult from the same household or a parent. Walking distances are not directly recorded but have estimated from the time spent walking, using the conversion factor of 4.4 km/h. This is based on work done by Carolyn O’Fallon and Charles Sullivan by mapping a sample of walking trips in the 1997/98 survey. More information about the background of the survey can be found at www.transport.govt.nz/research/TravelSurvey/.
Table A4.
Pedestrian FSi per million km walking from 2005–2015.
| Year | Fatality | Serious Injury | Fsi | Million km Walking Per Year | FSi Rate |
|---|---|---|---|---|---|
| 2005 | 28 | 234 | 262 | 781.4 | 0.34 |
| 2006 | 46 | 249 | 295 | 819.2 | 0.36 |
| 2007 | 44′ | 216 | 260 | 848.5 | 0.31 |
| 2008 | 36 | 238 | 274 | 863.5 | 0.32 |
| 2009 | 29 | 227 | 256 | 823.2 | 0.31 |
| 2010 | 33 | 221 | 254 | 834.0 | 0.30 |
| 2011 | 30 | 196 | 226 | 804.7 | 0.28 |
| 2012 | 31 | 236 | 267 | 797.7 | 0.33 |
| 2013 | 30 | 219 | 249 | 804.6 | 0.31 |
| 2014 | 41 | 214 | 255 | 808.3 | 0.32 |
| 2015 | 25 | 231 | 256 | 690.5 | 0.37 |
Table A5.
Pedestrian FSi per million walking hours by different age groups.
| Age Group | Number of Pedestrian Trip Legs Sampled in 4 Years | Million Walking Hour Per Year | Number of Deaths and Serious Injuries (2011–2014) | Average Number of FSi Per Year | FSi Rate |
|---|---|---|---|---|---|
| 0–4 | 2072 | 9.7 | 49 | 12.25 | 1.3 |
| 5–9 | 2577 | 11 | 98 | 24.5 | 2.2 |
| 10–14 | 4190 | 20.4 | 98 | 24.5 | 1.2 |
| 15–19 | 4135 | 23 | 214 | 53.5 | 2.3 |
| 20–24 | 2487 | 16.7 | 214 | 53.5 | 3.2 |
| 25–29 | 1808 | 11.2 | 151 | 37.75 | 3.4 |
| 30–34 | 2208 | 10.7 | 153 | 38.25 | 3.6 |
| 35–39 | 2774 | 11.7 | 114 | 28.5 | 2.4 |
| 40–44 | 2798 | 12.2 | 157 | 39.25 | 3.2 |
| 45–49 | 2872 | 14.9 | 144 | 36 | 2.4 |
| 50–54 | 2601 | 13.7 | 146 | 36.5 | 2.7 |
| 55–59 | 2401 | 11.3 | 115 | 28.75 | 2.5 |
| 60–64 | 2293 | 10.8 | 96 | 24 | 2.2 |
| 65–69 | 1859 | 9.5 | 103 | 25.75 | 2.7 |
| 70–74 | 1453 | 7.2 | 64 | 16 | 2.2 |
| 75–79 | 1066 | 4.7 | 60 | 15 | 3.2 |
| 80+ | 986 | 4.7 | 122 | 30.5 | 6.5 |
| All ages | 40,580 | 203.4 | 2098 | 524.5 | 2.6 |
Table A6.
Pedestrian FSi per million working hours by age groups and genders.
| Female | Male | |||||||
|---|---|---|---|---|---|---|---|---|
| Age Group | Million Walking Hours Per Year | Number of Deaths and Serious Injuries (2011–2014) | Average Number of FSi Per Year | FSi Rate | Million Walking Hours Per Year | Number of Deaths and Serious Injuries (2011–2014) | Average Number of FSi Per Year | FSi Rate |
| 0–4 | 4 | 14 | 3.5 | 0.9 | 5 | 35 | 8.75 | 1.8 |
| 5–14 | 15 | 78 | 19.5 | 1.3 | 15 | 116 | 29 | 1.9 |
| 15–24 | 19 | 158 | 39.5 | 2.1 | 22 | 269 | 67.25 | 3.1 |
| 25–34 | 12 | 90 | 22.5 | 1.9 | 10 | 213 | 53.25 | 5.3 |
| 35–44 | 13 | 91 | 22.75 | 1.8 | 9 | 180 | 45 | 5.0 |
| 45–54 | 16 | 110 | 27.5 | 1.7 | 13 | 180 | 45 | 3.5 |
| 55–64 | 14 | 91 | 22.75 | 1.6 | 9 | 120 | 30 | 3.3 |
| 65–74 | 9 | 80 | 20 | 2.2 | 9 | 86 | 21.5 | 2.4 |
| 75+ | 5 | 88 | 22 | 4.4 | 5 | 91 | 22.75 | 4.6 |
| Total | 108 | 97 | ||||||
References
- WHO. Global Status Report on Road Safety 2015. Available online: http:// www.who.int (accessed on 9 May 2018).
- OECD. Towards Zero: Ambitious Road Safety Targets and the Safe System Approach; Transport Research Centre, OECD/ITF: Paris, France, 2008. [Google Scholar]
- CCMTA. Canada’s Road Safety Strategy 2025: Towards Zero: The Safest Roads in the World. Canadian Council of Motor Transportation Administrators. 2016. Available online: http://roadsafetystrategy.ca/en/ (accessed on 9 May 2018).
- Vision Zero Network. Moving from Vision to Action: Fundamental Principles, Policies, Practices to Advance Vision Zero in the U.S. 2017. Available online: http:// www.visionzeronetwork.org (accessed on 9 May 2018).
- NZTA. Road Safety: Some Key Milestones in New Zealand’s Road Safety History. NZ Transport Agency, Wellington 2018. Available online: https://nzta.govt.nz/roads-and-rail/research-and-data/fascinating-facts/road-safety/ (accessed on 15 July 2018).
- Jeanne Breen Consulting. Review of the Road Safety to 2010 Strategy New Zealand Government; Final Report Contract no. 170/04; Land Transport New Zealand, Ministry of Transport: Wellington, New Zealand, 2004.
- NZ MOT. New Zealand’s Road Safety Strategy 2010–2020. NZ Ministry of Transport. Available online: http://www.saferjourneys.govt.nz/. 2018 (accessed on 15 July 2018).
- Fruin, J.J. Pedestrian Planning and Design; Metropolitan Association of Urban Designers and Environmental Planners: New York, NY, USA, 1971; Print. [Google Scholar]
- Zegeer, C.V.; Bushell, M. Pedestrian crash trends and potential countermeasures from around the world. Accid. Anal. Prev. 2012, 44, 3–11. [Google Scholar] [CrossRef] [PubMed]
- Santacreu, A.; de Gouveia, P.H. Safer City Streets: Global Benchmarking for Urban Road Safety; OECD/ITF: Paris, France, 2018. [Google Scholar]
- Jacobsen, P.L. Safety in numbers: More walkers and bicyclists, safer walking and bicycling. Inj. Prev. 2015, 21, 271–275. [Google Scholar] [CrossRef] [PubMed]
- Karndacharuk, A.; Wilson, D.J.; Dunn, R. A review of the evolution of shared (street) space concepts in urban environments. Transp. Rev. 2014, 34, 190–220. [Google Scholar] [CrossRef]
- Mackie, H.W.; Charlton, S.G.; Baas, P.H.; Villasenor, P.C. Road user behaviour changes following a self-explaining roads intervention. Accid. Anal. Prev. 2013, 50, 742–750. [Google Scholar] [CrossRef] [PubMed]
- Oxley, J.; Corben, B.; Fildes, B.; O’Hare, M.; Rothengatter, T. Older Vulnerable Road Users—Measures to Reduce Crash and Injury Risk; Monash University Accident Research Centre Reports: Clayton, VIC, Australia, 2004; Volume 218, p. 162. [Google Scholar]
- SWOV. Vulnerable Road Users. SWOV Fact Sheet, July 2012; SWOV: The Hague, The Netherlands, 2012. [Google Scholar]
- OECD/ITF. Road Safety Annual Report 2017; International Transport Forum: Paris, France, 2017. [Google Scholar]
- NHTSA. Pedestrians: 2015 Data Traffic Safety Facts; Report No. DOT HS 812 375; National Highway Traffic Safety Administration: Washington, DC, USA, 2017.
- Öström, M.; Eriksson, A. Pedestrian fatalities and alcohol. Accid. Anal. Prev. 2001, 33, 173–180. [Google Scholar] [CrossRef]
- Charlton, S.; Starkey, N. Driver Risk from Blood Alcohol Levels Between 50 mg/100 mL and 80 mg/100 mL; Research Report 541; New Zealand Transport Agency: Wellington, New Zealand, 2013.
- McEvoy, S.P.; Stevenson, M.R.; McCartt, A.T.; Woodward, M.; Haworth, C.; Palamara, P.; Cercarelli, R. Role of mobile phones in motor vehicle crashes resulting in hospital attendance: A case-crossover study. BMJ 2005, 331, 428. [Google Scholar] [CrossRef] [PubMed]
- NHTSA. An Investigation of the Safety Implications of Wireless Communications in Vehicles. National Highway Traffic Safety Administration. 1997. Available online: https://icsw.nhtsa.gov/people/injury/research/wireless/ (accessed on 9 May 2018).
- Cinnamon, J.; Schuurman, N.; Hameed, S.M. Pedestrian injury and human behaviour: Observing road-rule violations at high-incident intersections. PLoS ONE 2011, 6, e21063. [Google Scholar] [CrossRef] [PubMed]
- Garder, P. Pedestrian safety at traffic signals: A study carried out with the help of a traffic conflicts technique. Accid. Anal. Prev. 1989, 21, 435–444. [Google Scholar] [CrossRef]
- Hamed, M.M. Analysis of pedestrians’ behavior at pedestrian crossings. Saf. Sci. 2001, 38, 63–82. [Google Scholar] [CrossRef]
- King, M.J.; Soole, D.; Ghafourian, A. Illegal pedestrian crossing at signalised intersections: Incidence and relative risk. Accid. Anal. Prev. 2009, 41, 485–490. [Google Scholar] [CrossRef] [PubMed] [Green Version]
- Várhelyi, A. Drivers’ speed behaviour at a zebra crossing: A case study. Accid. Anal. Prev. 1998, 30, 731–743. [Google Scholar] [CrossRef]
- Palamarthy, S.; Mahmassani, H.S.; Machemehl, R.B. Models of Pedestrian Crossing Behavior at Signalized Intersections; Texas Department of Transportation Research and Technology Transfer Office: Austin, TX, USA, 1994.
- Zegeer, C.V.; Richard Stewart, J.; Huang, H.; Lagerwey, P. Safety effects of marked versus unmarked crosswalks at uncontrolled locations: Analysis of pedestrian crashes in 30 cities. Transp. Res. Rec. 2001, 1773, 56–68. [Google Scholar] [CrossRef]
- Forsythe, M.J.; Berger, W.G. Urban Pedestrian Accident Countermeasures Experimental Evaluation; US Department of Transportation: Washington, DC, USA, 1973.
- Tiwari, G.; Bangdiwala, S.; Saraswat, A.; Gaurav, S. Survival analysis: Pedestrian risk exposure at signalized intersections. Transp. Res. Part F Traffic Psychol. Behav. 2007, 10, 77–89. [Google Scholar] [CrossRef]
- Vallyon, C.; Turner, S.; Hodgson, S. Reducing Pedestrian Delay at Traffic Signals; Research Report No. 440; New Zealand Transport Agency: Wellington, New Zealand, 2011; p. 93.
- Evans, D.; Norman, P. Understanding pedestrians’ road crossing decisions: An application of the theory of planned behaviour. Health Educ. Res. 1998, 13, 481–489. [Google Scholar] [CrossRef] [PubMed]
- The Swedish Transport Administration. Statistic for Road Traffic Injuries 2015. Available online: https://www.trafa.se/en/tags/report/ (accessed on 9 May 2018).
- Government Office of Sweden. Renewed Commitment to Vision Zero 2016: Intensified Efforts for Transport Safety in Sweden. Stockholm, Sweden 2016. Available online: https://www.regeringen.se (accessed on 15 July 2018).
- Whitelegg, J.; Haq, G. Vision Zero: Adopting a Target of Zero for Road Traffic Fatalities and Serious Injuries; Stockholm Environment Institute: Stockholm, Sweden, 2006. [Google Scholar]
- Tingvall, C.; Haworth, N. Vision zero: An ethical approach to safety and mobility. In Proceedings of the 6th ITE International Conference Road Safety & Traffic Enforcement: Beyond 2000, Melbourne, VIC, Australia, 6–7 September 1999. [Google Scholar]
- NZ MOT. Improving Road Safety in New Zealand; Office of the Associate Minister of Transport, Cabinet Economic Development Committee: Wellington, New Zealand, 2018.
- Small, M.; Howard, E.; Moore, R. Safer Journeys Interim Evaluation; Martin Small Consulting: Adelaide, SA, Australia, 2015. [Google Scholar]
- NZTA. Major Funding Boost for Urban Cycling. Available online: https://www.nzta.govt.nz/about-us/news-and-media/keeping-connected/major-funding-boost-for-urban-cycling/ (accessed on 9 May 2019).
- The Australasian New Car Assessment Program, (ANCAP). Safety-Ratings-Explained. Available online: https://www.ancap.com.au/safety-ratings-explained. (accessed on 9 May 2018).
- LTNZ. A New Zealand Guide to the Treatment of Crash Locations: A Companion Document to the Austroads: Guide to Traffic Engineering Practice. Part 4. Treatment of Crash Locations; Land Transport NZ: Wellington, New Zealand, 2004.
- NZ MOT. 25 Years of New Zealand Travel: New Zealand Household Travel 1989–2014; Ministry of Transport: Wellington, New Zealand, 2015.
- NZ MOT. Risk on the Road Introduction and Mode Comparison; Ministry of Transport: Wellington, New Zealand, 2015.
- NZ MOT. Walking New Zealand Household Travel Survey 2011–2014; Ministry of Transport: Wellington, New Zealand, 2015.
- NZ MOT. Survey Questionnaires and Methodology. Available online: https://www.transport.govt.nz/resources/household-travel-survey/survey-questionnaires-and-methodology/ (accessed on 9 May 2018).
- Elvik, R.; Vaa, T.; Hoye, A.; Sorensen, M. The Handbook of Road Safety Measures, 2nd ed.; Emerald Group Publishing Limited: Bingley, UK, 2009. [Google Scholar]
- Koornstra, M.; Lynam, D.; Nilsson, G. SUNflower: A Comparative Study of the Development of Road. Leidschendam; SWOV Institute for Road Safety Research: The Hague, The Netherlands, 2002. [Google Scholar]
- European Commission. Serious Injuries, European Commission, Directorate General for Transport; European Commission: Brussels, Belgium, September 2015. [Google Scholar]
- Australian Government, Department of Infrastructure, Regional Development and Cities, BITRE. Road Trauma Australia-Annual Summaries. 2015. Available online: https://Bitre.gov.au/statistics/safety/index.aspx (accessed on 9 May 2018).
- Australian Transport Council (ATC). National Road Safety Strategy 2001–2010. Australian Transport Council. 2000. Available online: http://www.atcouncil.gov.au/documents/atcnrss.aspx (accessed on 9 May 2018).
- Australian Government. National Road Safety Strategy 2011–2020; The Department of Infrastructure, Regional Development and Cities, Australian Government: Canberra, Australia, 2017.
- Transport for NSW. Pedestrian Safety Action Plan 2014–2016. 2014. Available online: http://roadsafety.transport.nsw.gov.au/downloads/ped-safety-plan.pdf (accessed on 9 May 2018).
- Wegman, F.; Aarts, L.; Bax, C. Advancing sustainable safety: National road safety outlook for The Netherlands for 2005–2020. Leidschendam: SWOV Institute for Road Safety Research, the Netherlands. Saf. Sci. 2006, 46, 323–343. [Google Scholar] [CrossRef]
- Ministry of Transport, Public Works and Water Management. Road Safety Strategic Plan 2008–2020: From, for and by Everyone. Den Hag. The Netherlands. 2009. Available online: http://www.verkeerenwaterstaat.nl (accessed on 15 July 2018).
- Ministry of Transport, Public Works and Water Management. Policy Document Road Safety. The Hague: The Netherlands. 2012. Available online: http://www.verkeerenwaterstaat.nl (accessed on 15 July 2018).
- DfT. Tomorrow’s Roads: Safer for Everyone. Department for Transport, Local Government and the Regions. 2000; Available online: http://webarchive.nationalarchives.gov.uk/20100203072313/http://www.dft.gov.uk/pgr/roadsafety/strategytargetsperformance/tomorrowsroadssaferforeveryone; (accessed on 1 August 2018). [Google Scholar]
- DfT. Child Road Safety Achieving the 2010 Target: An Action Plan Prepared in Consultation with the Child Road Safety Sub-Group of the Road Safety Advisory Panel; Department for Transport: London, UK, 2002.
- DfT. Strategic Framework for Road Safety; Department for Transport: London, UK, 2011.
- London Assembly Transport Committee. Feet First—Improving Pedestrian Safety in London. Retrieved from 2014. Available online: https://www.london.gov.uk/ (accessed on 1 August 2018).
- TfL. Healthy Streets for London: Prioritizing Walking, Cycling and Public Transport to Create a Healthy City; Transport for London: London, UK, 2017.
- Lie, A.; Tingvall, C. Governmental status report, Sweden. In Proceedings of the 18th Experimental Safety of Vehicles Conference, Nagoya, Japan, 19–22 May 2003. [Google Scholar]
- Lindberg, H.; Håkansson, M. How Dreams Can Become Reality: Vision Zero 20 Years. 2017. Available online: http://www.afconsult.com/ (accessed on 15 July 2018).
- The Swedish Transport Administration. Review of Interim Targets and Indicators for Road Safety in 2010–2020; Analytic Report; The Swedish Transport Administration: Borlänge, Sweden, 2012.
- Stockholm Stad. Part of the Urban Mobility Strategy: Stockholm Pedestrian Plan 2015–2020. 2017. Available online: http://www.stockholm.se/ (accessed on 15 July 2018).
- NZ MOT. Getting There on Foot, by Cycle. Strategic Implementation Plan 2006–2009; NZ Ministry of Transport: Wellington, New Zealand, 2006.
- NZTA. Pedestrian Planning and Design Guide; NZ Transport Agency: Wellington, New Zealand, 2009.
- NZTA. RTS 14—Guidelines for Facilities for Blind and Vision Impaired Pedestrians—Road and Traffic Standard Series, 3rd ed.; NZ Transport Agency: Wellington, New Zealand, 2015.
- NZTA. Neighbourhood Accessibility Plans: Information for Local Authorities Planning for or Starting Projects; NZ Transport Agency: Wellington, New Zealand, 2009.
- NZTA. Safer Journeys for Schools, 2nd ed.; NZ Transport Agency: Wellington, New Zealand, 2017.
- ARTA. Auckland Regional Road Safety Plan 2009/12: Creating a Safer Transport System for Aucklanders; Auckland Regional Transport Authority: Auckland, New Zealand, 2009.
- Auckland City Council. Auckland City Council’s Cycling and Walking Framework. Walking Action Plan 2007–2012: Making Walking a More Attractive Choice. Auckland City Council, Auckland. Available online: https://www.aucklandcouncil.govt.nz/Pages/default.aspx (accessed on 9 May 2018).
- NZTA. The NZ Transport Agency’s Economic Evaluation Manual (EEM). NZ Transport Agency, Wellington. 2017. Available online: https://www.nzta.govt.nz/resources/economic-evaluation-manual (accessed on 9 June 2018).
- NZ MOT. Transport Outlook: Transport Outlook: Future State; A Starting Discussion on the Future of Transport in New Zealand; NZ Ministry of Transport: Wellington, New Zealand, 2017.
- NZ Transport Agency. Uncontrolled Crossings. 2018. Available online: https://www.nzta.govt.nz/walking-cycling-and-public-transport/cycling/cycling-network-guidance/designing-a-cycle-facility/crossings/uncontrolled-crossings/ (accessed on 9 June 2018).
- Keall, M.D. Pedestrian exposure to risk of road accident in New Zealand. Accid. Anal. Prev. 1995, 27, 729–740. [Google Scholar] [CrossRef]
- Connelly, M.L.; Conaglen, H.M.; Parsonson, B.S.; Isler, R.B. Child pedestrians’ crossing gap thresholds1. Accid. Anal. Prev. 1998, 30, 443–453. [Google Scholar] [CrossRef]
- NZTA. Road Safety Education Policy. NZ Transport Agency, Wellington. 2016. Available online: https://Education.nzta.govt.nz/resources/policy-and-practices/road-safety-education-policy (accessed on 9 June 2018).
- Cullen, J.; Nolan, P. An integrative curriculum approach to road safety education. Early childhood folio. 2004, 8, 23–28. [Google Scholar]
- OECD. Executive Summary, in Zero Road Deaths and Serious Injuries: Leading a Paradigm Shift to a Safe System; OECD Publishing: Paris, France, 2016. [Google Scholar]
- DfT. Reported Road Casualties Great Britain: 2014 Annual Report: Introduction to the 2014 Annual Report. 2014. Available online: https://assets.publishing.service.gov.uk/government/uploads/system/uploads/attachment_data/file/463350/rrcgb2014-00.pdf (accessed on 1 August 2018).
- NZ Transport Agency. Land Transport (Road User) Rule 2004; NZ Transport Agency: Wellington, Australia, 2017.
- NZTA. Driver Licence and Vehicle Fleet Statistics. 2013. Available online: https://www.transport.govt.nz/assets/Uploads/Research/Documents/Motor-Vehicle-Crashes-2013/Motor-vehicle-crashes-2013-Driver-licence-and-vehicle-fleet-statistics.pdf. (accessed on 15 July 2018).
- Accident Compensation Corporation and Land Transport Safety Authority. Down with Speed: A Review of the Literature, and the Impact of Speed on New Zealanders; Accident Compensation Corporation and Land Transport Safety Authority: Wellington, New Zealand, 2000. [Google Scholar]
- Rosen, E.; Stigson, H.; Sander, U. Literature review of pedestrian fatality risk as a function of car impact speed. Accid. Anal. Prev. 2011, 43, 25–33. [Google Scholar] [CrossRef] [PubMed]
- Tefft, B.C. Impact Speed and a Pedestrian’s Risk of Severe Injury or Death; AAA Foundation for Traffic Safety: Washington, DC, USA, 2011. [Google Scholar]
- NZ Transport Agency. Land Transport Rule: Setting of Speed Limits 2017; NZ Transport Agency: Wellington, New Zealand, 2017.
- Statistics New Zealand. Gross Domestic Product: March 2019 Quarter. Available online: https://www.stats.govt.nz/large-datasets/csv-files-for-download/ (accessed on 12 September 2019).
- NZ Transport Agency. Time Series of Historic Casualties and Crashes. Available online: https://www.transport.govt.nz/mot-resources/new-road-safety-resources/annual-crash-statistics/time-series-of-historic-casualties-and-crashes/ (accessed on 9 September 2019).
- Hauer, E. Observational Before/After Studies in Road Safety. Estimating the Effect of Highway and Traffic Engineering Measures on Road Safety; Elsevier Science Ltd.: Oxford, UK, 2002. [Google Scholar]
- Statistics New Zealand. Population Ageing in New Zealand. 2000. Available online: http://archive.stats.govt.nz/browse_for_stats/people_and_communities/older_people/pop-ageing-in-nz.aspx (accessed on 14 April 2018).
- NZ Government. Road to Zero: Consultation on the 2020–2030 Road Safety Strategy. Available online: https://www.transport.govt.nz/multi-modal/keystrategiesandplans/road-safety-strategy/ (accessed on 24 July 2019).
Figure 1.
New Zealand road deaths before and after the implementation of Safer Journeys. Note: Deaths involving alcohol/drugs is listed as a factor when a driver’s blood or breath alcohol level is above the legal limit. More details are shown in Appendix A. Factors related to crashes.
Figure 1.
New Zealand road deaths before and after the implementation of Safer Journeys. Note: Deaths involving alcohol/drugs is listed as a factor when a driver’s blood or breath alcohol level is above the legal limit. More details are shown in Appendix A. Factors related to crashes.

Figure 2.
Pedestrian fatalities as a percentage of all crashes.

Figure 3.
Trend in pedestrian fatalities per million population.

Figure 4.
Average annual % change in the number of pedestrian casualty (2010–2015). Note: Australian pedestrian casualty is analysed from 2010 to 2014, whereas data for 2012 is unavailable.
Figure 4.
Average annual % change in the number of pedestrian casualty (2010–2015). Note: Australian pedestrian casualty is analysed from 2010 to 2014, whereas data for 2012 is unavailable.

Figure 5.
Pedestrian fatalities rate mapping with the major strategic plans. Pedestrian Crashes in New Zealand.
Figure 5.
Pedestrian fatalities rate mapping with the major strategic plans. Pedestrian Crashes in New Zealand.

Figure 6.
Trend of the pedestrian casualty in New Zealand from 2000–2017.

Figure 7.
Pedestrian FSi per million km walking from 2005–2015. Note: Million walking year in 2015 is a preliminary result and has not been finalized. For more details, see Appendix B.
Figure 7.
Pedestrian FSi per million km walking from 2005–2015. Note: Million walking year in 2015 is a preliminary result and has not been finalized. For more details, see Appendix B.

Figure 8.
New Zealand pedestrian crash locations.

Figure 9.
The leading causes of pedestrian fatality and serious injury in New Zealand. Note: Details of each category is shown in Appendix A.
Figure 9.
The leading causes of pedestrian fatality and serious injury in New Zealand. Note: Details of each category is shown in Appendix A.

Figure 10.
Pedestrian fatal and serious injury (FSi) per million walking hours by different age groups.
Figure 10.
Pedestrian fatal and serious injury (FSi) per million walking hours by different age groups.

Figure 11.
Pedestrian FSi per million working hours by age groups and genders.

Figure 12.
Pedestrian factors in New Zealand.

Figure 13.
Driver factors in New Zealand.

Figure 14.
Pedestrian involving collisions classified by the speed limit in New Zealand.

Figure 15.
Pedestrian deaths and related trends in New Zealand.

Table 1.
Immediate targets in New Zealand Safer Journeys.
| 2011–2012 | 2013–2015 | 2016–2020 |
|---|---|---|
| Safe Roads and Roadsides | ||
| ||
| ||
| Safe Road Use | ||
|
|
|
| Safe Speed | ||
| ||
| Safe Vehicle: Continuing to improve the safety of the New Zealand vehicle fleet | ||
Table 2.
Road safety policies related to pedestrian safety from best-performing countries compared to New Zealand.
Table 2.
Road safety policies related to pedestrian safety from best-performing countries compared to New Zealand.
| Country | Road Safety Strategy | Programs/Projects Affected Pedestrian Safety |
|---|---|---|
| Australia | National Road Safety Strategy 2001–2010 [50] |
|
| National Road Safety Strategy 2011–2020 (One of the national challenges is to reduce the number of serious casualties among pedestrian and cyclists.) [51] |
| |
| NSW Pedestrian Safety Action Plan 2014–2016 [52] |
| |
| The Netherlands | Sustainable Safety Principle (1992) |
|
| Advancing Sustainable Safety 2005–2020 (not policy paper) [53] | Proposes safe speeds 30 km/h for situations with possible conflicts between cars and unprotected road users | |
| Road Safety Strategic Plan 2008–2020 (Pedestrians is one of the emphasis areas) [54] |
| |
| The United Kingdom | Tomorrow’s Roads: Safer for everyone [56] |
|
| Strategic Framework for Road Safety (One of the national indicators is the rate of pedestrian deaths per billion miles walked) [58] |
| |
| Feet First-Improving Pedestrian Safety in London [59] |
| |
| Healthy Streets for London [60] | Making streets more accessible to cross, encouraging walking and connecting communities | |
| Sweden | Vision Zero (1997) |
|
| Renewed Commitment to Vision Zero 2016 [34] |
| |
| Stockholm Pedestrian Plan 2015–2020 [64] |
| |
| New Zealand | Road Safety to 2010 [6] |
|
| Getting there on foot, by bicycle 2006-2009 [65] Focus Four (P9): Improve road safety and security for pedestrians and cyclists |
| |
| Pedestrian Planning and Design Guide One of the Road Safety to 2010 strategy projects [66] |
| |
| Neighbourhood Accessibility Plans (NAP) [68] |
| |
| Safer Journeys for Schools [69] |
| |
| Safer Journeys Strategy 2010–2020 [7] |
| |
| Auckland Regional Road Safety Plan 2009–2012 [70] |
| |
| Walking Action Plan 2007–2012 [71] |
|
Table 3.
Pedestrian and drivers’ attention diverted in New Zealand.
| All Causes | FSi | % of FSi |
|---|---|---|
| Emotionally upset/road rage | 35 | 21% |
| Pedestrian attention diverted, e.g., cigarette, cell phone, music player | 34 | 20% |
| Attention diverted by driver dazzled by sun/lights | 26 | 16% |
| Attention diverted by other traffic | 23 | 14% |
| Attention diverted | 19 | 11% |
| Attention diverted by scenery or persons outside vehicle | 14 | 8% |
| Attention diverted by passengers | 8 | 5% |
| Attention diverted by advertising or signs | 3 | 2% |
| Attention diverted by cigarette etc. | 2 | 1% |
| Attention diverted while trying to find intersection | 1 | 1% |
| Attention diverted by cell phone | 1 | 1% |
| Attention diverted by navigation device | 1 | 1% |
| Grand Total | 167 | 100% |
© 2019 by the authors. Licensee MDPI, Basel, Switzerland. This article is an open access article distributed under the terms and conditions of the Creative Commons Attribution (CC BY) license (http://creativecommons.org/licenses/by/4.0/).
Share and Cite
MDPI and ACS Style
Soathong, A.; Wilson, D.; Ranjitkar, P.; Chowdhury, S. A Critical Review of Policies on Pedestrian Safety and a Case Study of New Zealand. Sustainability 2019, 11, 5274. https://0-doi-org.brum.beds.ac.uk/10.3390/su11195274
AMA Style
Soathong A, Wilson D, Ranjitkar P, Chowdhury S. A Critical Review of Policies on Pedestrian Safety and a Case Study of New Zealand. Sustainability. 2019; 11(19):5274. https://0-doi-org.brum.beds.ac.uk/10.3390/su11195274
Chicago/Turabian StyleSoathong, Ajjima, Douglas Wilson, Prakash Ranjitkar, and Subeh Chowdhury. 2019. "A Critical Review of Policies on Pedestrian Safety and a Case Study of New Zealand" Sustainability 11, no. 19: 5274. https://0-doi-org.brum.beds.ac.uk/10.3390/su11195274
Note that from the first issue of 2016, this journal uses article numbers instead of page numbers. See further details here.