Article

Assessing Sustainability in Rural Water Supply Systems in Developing Countries Using a Novel Tool Based on Multi-Criteria Analysis

by
Isabel Domínguez
1,*,
Edgar Ricardo Oviedo-Ocaña
1,
Karen Hurtado
1,
Andrés Barón
1 and
Ralph P. Hall
2
1
Universidad Industrial de Santander, Cra 27 calle 9, Bucaramanga, Santander 680002, Colombia
2
School of Public and International Affairs, Virginia Tech, Blacksburg, VA 24061, USA
*
Author to whom correspondence should be addressed.
Sustainability 2019, 11(19), 5363; https://0-doi-org.brum.beds.ac.uk/10.3390/su11195363
Submission received: 27 August 2019 / Revised: 9 September 2019 / Accepted: 10 September 2019 / Published: 27 September 2019

Abstract

:
Rural water supply systems (RWSS) in developing countries typically have deficiencies that threaten their sustainability. This research used Multi-Criteria Analysis and the Analytical Hierarchy Process to identify indicators that can be used to assess the sustainability of RWSS. The assessment tool developed is composed of 17 attributes with 95 quantifiable indicators. The tool enables the assessment of the sustainability of RWSS, using data collected through semi-structured interviews, social cartography, technical inspection, household surveys, and water monitoring. The tool was applied in a case study of a RWSS in the Andean region of Colombia, illustrating a participatory, holistic, and structured assessment that provided a single sustainability measure for the system (3.0/5.0). The tool’s completeness is represented by its extensive attributes and indicators that deliver a robust baseline on the state of a system, help identify improvement strategies, and monitor system performance over time that can assists rural community organizations with RWSS management.

1. Introduction

In 2015, the 2030 Agenda for Sustainable Development adopted the Sustainable Development Goals (SDGs) to end poverty, protect the planet, and ensure prosperity for all. Goal 6 seeks to ensure the availability and sustainable management of water and sanitation for all [1]. Although by 2015 over 90% of the world’s population used improved drinking water sources, those living in rural areas typically experience much lower levels of access to improved water [2].
Rural water supply systems (RWSS), especially those in developing countries, are characterized by their infrastructure and technology deficit and a lack of knowledge or experience among those operating or managing the systems [3]. Research in this field indicates that a large percentage of water projects end in premature failure [4]. A leading cause of these failures is that organizations tend to misunderstand or ignore the concept of sustainability, and community opinions are not always considered with regards to system design and management both before and after the system’s construction [5].
In the context of the water supply and sanitation sector, different authors have provided definitions of sustainable rural water supply systems [4,6,7,8,9]. In addition, different conceptual frameworks, methodologies, and tools exist to assess sustainability in RWSS, which have been categorized, classified, and compared [10]. There are a number of studies that have developed multidimensional assessments of rural water supply systems in developing countries using multi-criteria analysis, specifically the Analytical Hierarchy Process (AHP). In some of these studies, AHP is used to select suitable alternatives for water provision [11,12], whereas others focus on the assessment of water supply services at a country level [13], district level [14], the individual family level [5,15], or the collective water system level [16,17]. Molinos-Senante et al. [17] assessed and compared 40 rural water supply systems in Chile. However, the assessment was based on expert judgement and secondary information, using only a few indicators to generate recommendations at the country level. Dwivedi and Bhadauria [16] assessed 11 systems in India, but acknowledged the potential bias in the collection of information resulting from data collection instruments focused on easy to collect information that comes from a small sample size. In addition, attributes measuring system performance in rural areas—such as those related to policies, rules and norms, collective action, population characteristics, users acceptability, accountability and transparency, conflicts, risks to service provision, and environmental impact of technology—are typically not included.
This paper aims to address the above problems by developing a tool to assess the sustainability of collective RWSS in rural areas of developing countries, which are characterized by limited technical, financial, and managerial capabilities. In particular, this research aims to: (1) identify state-of-the-art indicators of sustainability in RWSS; (2) develop a tool that integrates these indicators; and (3) apply the tool to study a RWSS in Colombia. The tool is developed using Multi-criteria Analysis and allows for the integration of sustainability indicators from different dimensions in a quantitative way. Furthermore, data collection procedures are detailed that could aid community organizations, depending on their level of development and external support, to engage in data collection and analysis, formulation of action plans, and system monitoring over time.

2. Materials and Methods

This study was developed in three phases as described in the following sections.

2.1. Indicators to Assess Sustainability in Rural Water Supply Systems

A top-down approach to the identification of suitable sustainability indicators was used [18]. The Scopus database was searched using different combinations of the keywords “rural”, “sustainability”, and various permutations for “water supply” (“water system”, “water provision”, “water service”) and “assessment” (“evaluation”). The search was followed by a screening process consisting of (1) reading a paper’s title, (2) reading the abstract, and (3) reading the content to ensure the paper was related to the sustainability assessment of community-managed RWSS in a developing country. Excel® software was then used to tabulate data from the papers identified. The indicators contained in these papers were then grouped by category and attribute. Indicators with different wording and denominations, but with the same meaning, were combined. A single indicator was formulated for each group and was linked to a qualitative value using expert judgement. In addition, data collection methods for each indicator were identified.

2.2. Development of a Tool to Assess RWSS Sustainability

From the literature review, 95 sustainability indicators were identified, which were classified into 17 attributes using Multi-Criteria Analysis (MCA). MCA provides a structured framework for analyzing decision problems characterized by multiple objectives and criteria (quantitative and qualitative), and is considered comprehensive and appropriate in assessing sustainability of water projects [19]. There are various methods of MCA, among them, Multi-Attribute Theory (MAUT) methods, in which attributes can be weighted and scored, providing a one-dimensional measure that describes important properties of highly complex cases [20]. In this research, MAUT was used to integrate the different attributes and indicators of sustainability for the system under study. Five RWSS experts met and consensually assigned weights to the indicators based on their magnitude of influence on the sustainability of water systems using direct weighting [20]. To determine weights for the attributes, the Analytic Hierarchy Process (AHP) was used. AHP is a non-linear framework which takes several factors into consideration simultaneously and allows for dependence and feedback, making numerical trade-offs to arrive at a synthesis or conclusion [21].
The weights of the different attributes (Weight of attribute—Wa) were established following the stages and procedures recommended by Saaty [21]. Thus, the overall goal of the process was defined as: “the evaluation of the sustainability of a rural water supply system”, and the attributes to be compared were obtained from the literature review. An evaluation matrix containing 17 criteria was prepared to assess the attributes according to their importance in relation to achieving the overall goal. Using this evaluation matrix, five researchers from the Water Resources and Environmental Sanitation group of the Civil Engineering School at Universidad Industrial de Santander consensually expressed their preference for one attribute over another undertaking pairwise comparisons between attributes [22]. For this, the nine point scale proposed by Saaty [21] was used. Subsequently, a normalized matrix was prepared. The values in this matrix were obtained by dividing each component of the evaluation matrix by the sum of each column in the matrix (the last row of the evaluation matrix). Then the priority vector (Eigen vector) was obtained. This vector was determined using the simple average of each row of the normalized matrix and it defines the weight that corresponds to each attribute with respect to the overall objective [21]. The final step was the assessment of the researchers’ judgement consistency. This consistency was checked using the Consistency Ratio (CR). Consistency is considered acceptable when the CR is higher than 10% [21]. The weights of the indicators (Weight of indicator—Wi) within each attribute were assigned consensually by the five researchers, according to their importance. The weights within each attribute sum to 1.0. The detailed process, matrices, and calculations underlying the tool development process are provided in the Supplementary Material.

2.3. Application of the Tool in the Sustainability Assessment of a Rural Water Supply System in a Case of Study

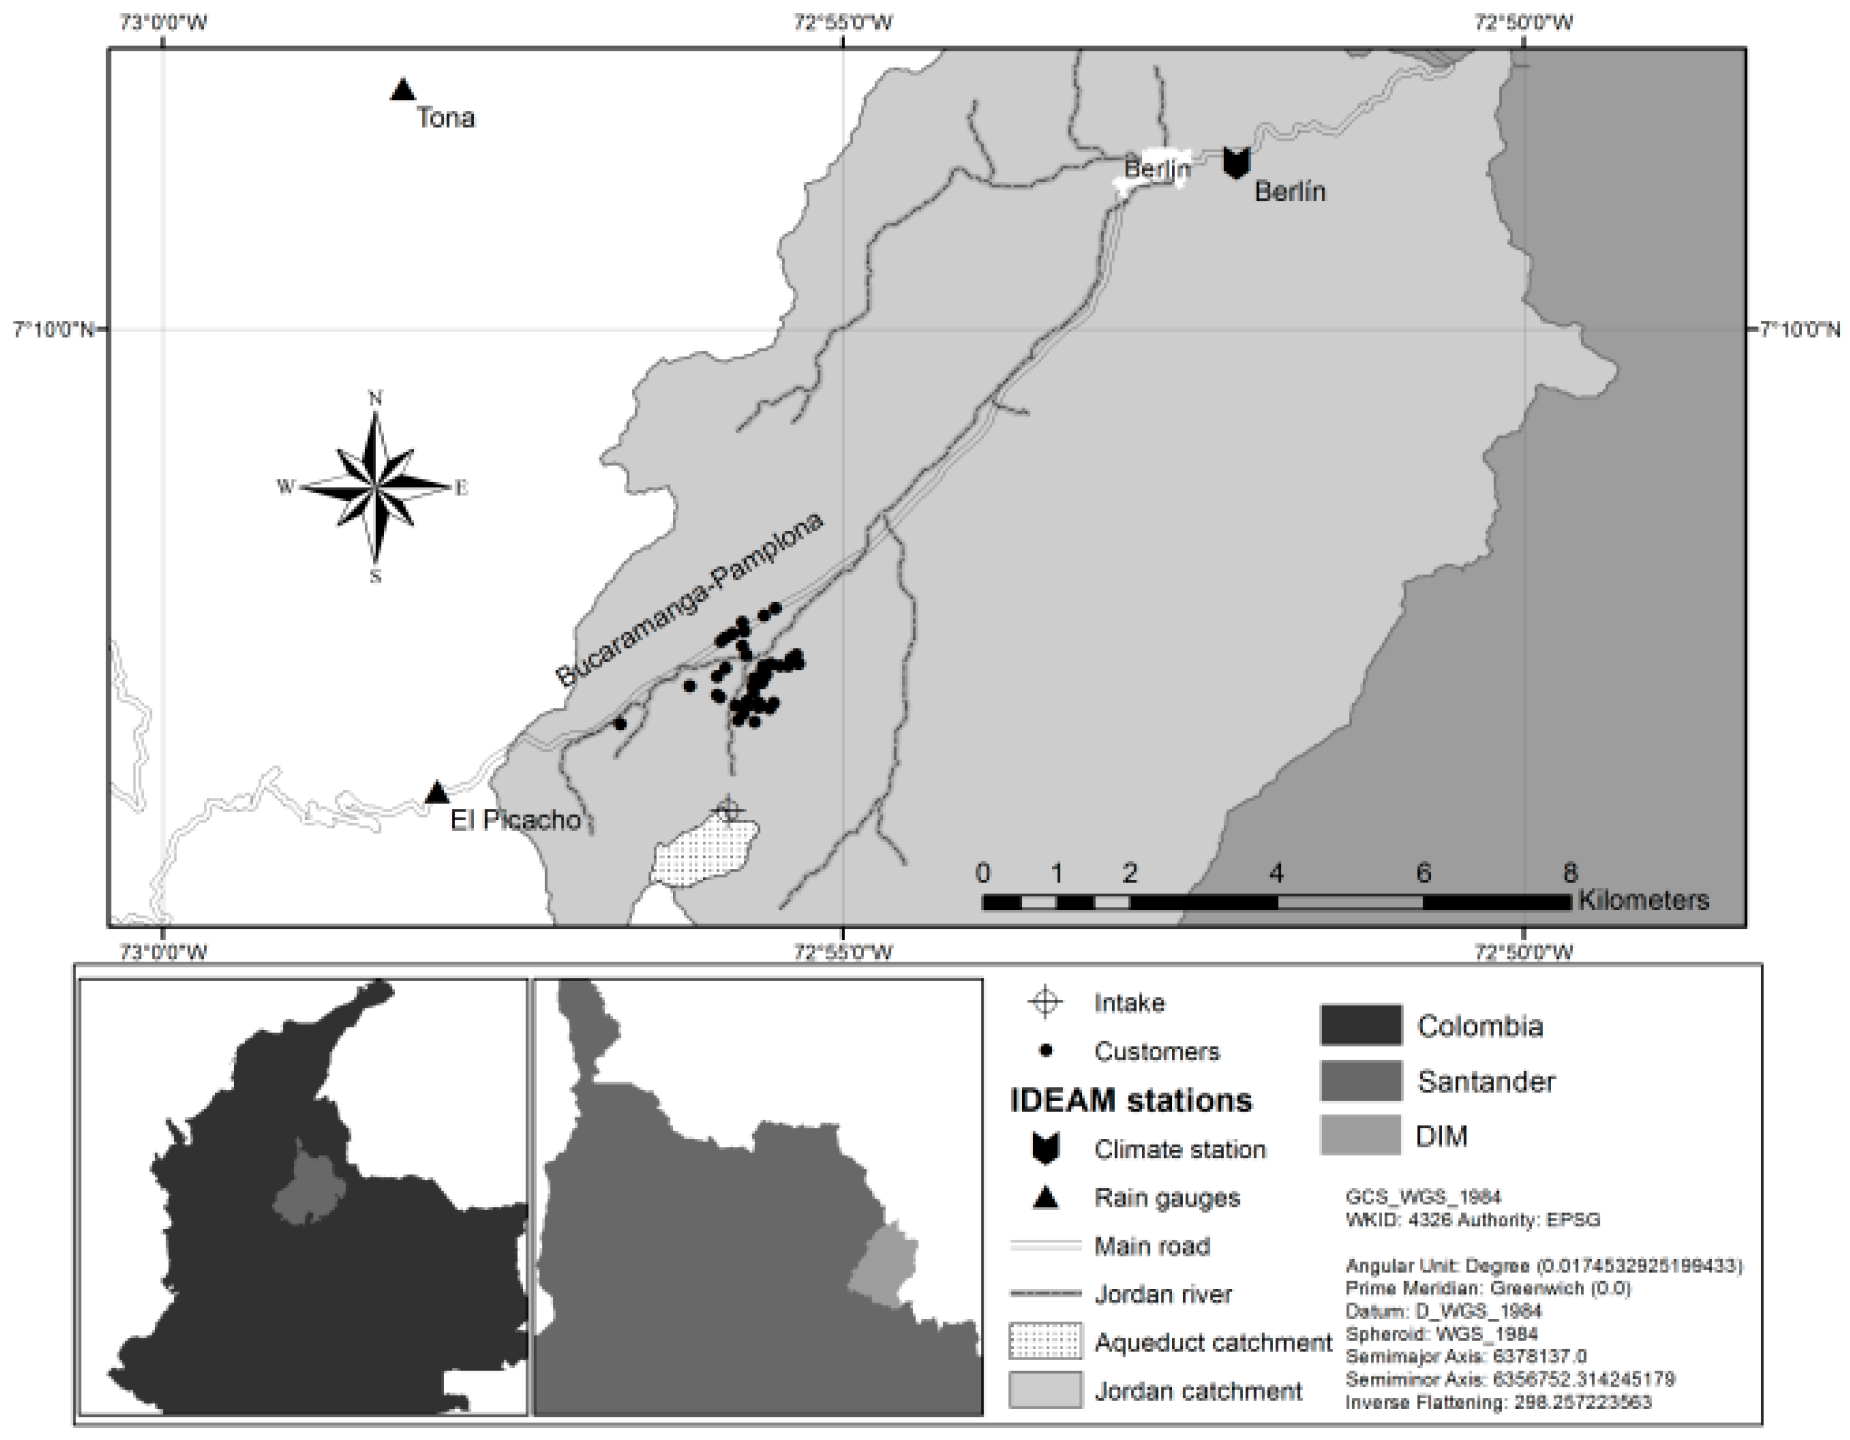
2.3.1. Selection of the Study Area

A RWSS in the Berlin páramo (Santander—Colombia) that provides water to 85 households was selected as a case study. The RWSS is located in an ecosystem of strategic importance, since páramos are high-mountain ecosystems that provide abundant and sustained clean fresh water for multiple uses in Andean communities and downstream urban areas [23]. However, páramos are increasingly threatened due to anthropogenic activities [24]. In the Berlin páramo, around 1500 Ha are planted with onions, with a production of 380 tons per day that provide livelihoods for around 5000 families [25]. This economic activity has led to a conflict between ecosystem protection and the livelihoods of small farmers [26]. Figure 1 shows the location of the study area.

2.3.2. Data Collection

A data collection team consisting of people from the area and researchers was established at the beginning of the study. Community members that participated were those who showed interest in the project and were involved in different community initiatives related to the RWSS. The institutional and community team members actively took part in all the data collection activities and analysis. A range of data collection strategies were implemented.
Semi-structured interviews were conducted to collect information regarding managerial aspects of the water supply system, such as organizational structure, community participation, legal and financial aspects, human and physical resources, collective action, and post-construction support. Respondents were selected based on their leadership in relation to water management and their direct experience in the construction, administration, and operation and maintenance of the system.
A social cartography was carried out with members of the fieldwork team to locate each of the system users, water sources, system components, and properties of the distribution network [27].
Technical inspections of the rural water system components were undertaken. The inspections were complemented by interviews with personnel in charge of the water system to identify technical, operational, and environmental aspects that may generate threats to the water supply [28]. Inspection forms proposed by the World Health Organization (WHO) [29] were adapted to the system infrastructure components, and the assessment was carried out with researchers and members of the fieldwork team. The information was collected through observations of the water system components, their performance status, and potential risks to water quality.
A survey was developed for the 85 households in the community that were identified through the social cartography exercise. The survey was administered by the researchers, accompanied by members of the fieldwork team, over three consecutive days. Initially, a census was planned, but only 65 households were interviewed (76% response rate), since the remaining households were not available at the time of the survey. The surveys were administered through face-to-face interviews. Household members more than 18 years old were targeted as respondents. Verbal consent was requested before conducting the survey. Information was collected on: user characteristics; uses of water and land; perception of the water service; hygiene practices and health of household members; participation in the system’s operation and management; and understanding of aspects on system administration, operation, and maintenance.
A timeline [27] was built with the participation of community leaders and people from different generations, including men, women, and seniors. This strategy helped identify the significant changes in the history of the community, the population dynamics, and the construction, operation, and management of the system, as well as difficulties the community has faced and how those were solved.
Data on water quantity were collected at the source from flow metering, while data on water quality were collected through sampling and laboratory analysis for a range of parameters suggested by WHO [30]. Sampling sites included the intake, storage tank, and most remote house in the distribution network [31,32]. Water discharge was estimated using the volumetric method. Sampling was carried out at the same time of the day, in the early morning. Samples were collected, preserved if required on ice ensuring a temperature less than 4 °C, and transported to a laboratory located a two-hour drive from the last sampling station. All samples were analyzed within 24 h of collection following APHA methods [33]. The water monitoring took place during five days in the dry season and five days in the rainy season.

2.3.3. Data Analysis

Excel® was used to analyze quantitative data from the household survey and the water monitoring. Qualitative data from the technical inspection, semi-structured interviews, and focus groups were analyzed according to the attributes studied. Both quantitative and qualitative data provided information to assess the level of compliance with indicators that consisted of a five-point scale: fully met (5); met to a high degree (4); met acceptably (3); met to a low degree (2); and not met (1). The results on the ratings of the indicators were then multiplied by the weight assigned to each indicator and then to the weights of the corresponding attributes to determine the sustainability score for the RWSS. In addition to the single sustainability measure, the attributes that affect sustainability were scored, revealing those that performed well and poorly. These data were synthesized using a radar diagram. This radar diagram visualized the multiple dimensions of sustainability, highlighting the relative performance of each attribute and the gaps that exist between the current and ideal state.

3. Results and Discussion

The results are presented and discussed in the following three sections focusing on (1) the tool development to assess the sustainability of a RWSS, (2) the sustainability assessment of a RWSS in a páramo community, and (3) a discussion of the tool in the context of rural water system sustainability.

3.1. Tool for Assessing the Sustainability of Rural Water Supply Systems

Most of the definitions of sustainability from the water and sanitation sector in rural areas have in common the ability of the system to provide benefits over time, such as improved lifestyle and human health [4], and enhanced quantity, quality, convenience, and continuity of water supply [6]. These benefits should be provided without adverse effects on the environment [6,8,9], or other people or services [4]. Brikke and Rojas [6] expand the definition of sustainability in rural water and sanitation services to include aspects such as administration, operation and maintenance, costs, community management, and external support, which influenced the selection of indicators in this research.

3.1.1. Selection of Indicators

The literature review identified 534 characteristics of sustainability in RWSS from 34 sources. By removing the characteristics with the same meaning, but with different wording, the list was reduced to 393 characteristics. This list was further refined by choosing characteristics that explicitly identify factors that influence the long-term functionality of rural water services in developing countries as recommended by Walters and Javernick-Will [34]. Each characteristic was reformulated as a quantifiable indicator and a qualitative value judgement was proposed for each. This process led to the selection of 95 indicators. These indicators were then grouped in 17 attributes identified as relevant to characterize the sustainability of RWSS. Each of these attributes is described below.

Population Characteristics

Indicators related to population characteristics have been proposed in the literature such as population growth [35], knowledge of users related to water, health, and hygiene [3], the understanding of the system operation and management by those tasked with this responsibility [4], and user capacity to pay for water [35]. For this study, the population attribute included seven indicators that consider aspects that influence water demand and the local capacities to run the system: Percentage (%) of people that have completed high school (1.1); Population growth rate (1.2); Per capita water demand/WHO standard [36] (1.3); Percentage (%) of users who have been trained in water, sanitation, and hygiene issues (1.4); Percentage (%) of users who understand how the system is managed (1.5); Percentage (%) of users who understand how the system is operated and maintained (1.6); and Percentage (%) of users who believe they are able to pay for the water service (1.7).

Users Acceptability

The users acceptability attribute has been proposed by authors such as Barnes and Ashbolt [4]. The water system should be able to supply the community throughout the day in all seasons, since water is a vital resource [37]. Although drinking, food preparation, and personal hygiene are considered as priorities for water uses, communities tend to prefer alternatives that can also provide water for livestock and irrigation [38]. Additionally, the acceptability of the appearance, taste, and odour of drinking water should be taken into account. If the source of water fails to satisfy these conditions, users could drink from unsafe and risky sources [39]. This attribute consisted of five indicators: Percentage (%) of users who are satisfied with water quality (2.1); Percentage (%) of users who are satisfied with water quantity (2.2); Percentage (%) of users who are satisfied with service reliability (2.3); Percentage (%) of users who have not experience illness perceived to be related to water (2.4); and Percentage (%) of users who are willing to pay for the water service (2.5).

Accountability and Transparency

Accountability and transparency indicators are considered key attributes of sustainability [40,41]. The committee members of a RWSS should define and follow a set of rules related to O&M, investment, and management. However, the absence of these rules combined with the lack of mechanisms to elect committee members or call for meetings can explain why a community is unable to adequately solve their problems [42]. Four indicators were used to characterize this attribute: Existence of democratic mechanisms to choose water committee members (3.1); Number of times in the last year the water committee met users (3.2); Percentage (%) of users who know rules for access and use of the service (3.3); and Existence of mechanisms to inform users about committee finances and use of funds (3.4).

Collective Action

Participation is an important attribute of sustainability in RWSS [8,22], together with the ability of community members to work together for common goals within groups, and trust and respect among members of a group [43,44]. In this case, collective action was selected as the attribute capturing indicators dealing with community participation in different aspects of (1) system design, operation, maintenance, and administration; and (2) leadership, trust, and respect. Ten indicators were used: Percentage (%) of users who participate in administration activities (4.1); Percentage (%) of users who participate in the planning and construction of the system (4.2); Number of initiatives developed by institutions with active community participation in the last year (4.3); Percentage (%) of users who participate by contributing in cash to the system (4.4); Percentage (%) of users who participate by supporting O&M activities (4.5); Percentage (%) of users who believe woman participate in all aspects of system management (4.6); Percentage (%) of users who participate in meetings (4.7); Percentage (%) of users who believe they are listened to and their opinions are respected (4.8); Number of initiatives undertaken for the committee regarding system improvement in the last year (4.9); and Percentage (%) of users who are willing to participate in activities related to the system (4.10).

Conflicts

The conflicts attribute included three indicators related to the existence of conflicts between users, or users and institutions and the mechanisms to deal with them [5,22]: Existence of institution-human conflicts over water sources (5.1); Existence of effective conflict resolution mechanisms (5.2); and Percentage (%) of users who have not experienced conflicts with other users regarding water (5.3).

Policies, Rules, and Norms

The policies, rules, and norms attribute is related to the fulfilment of formal legal requirements [34,45]. Legislation and policies are required to define roles, responsibilities, and procedures that regulate and coordinate the activities of a water scheme, not only for access, but also regarding the rules for tariff collection and infrastructure maintenance [3]. The existence of these rules is not sufficient; mechanisms for enforcing them are also required [46]. Two indicators were considered: (Number of regulations fulfilled/Number of applicable regulations) × 100 (6.1); and Existence of water rights (6.2).

Administration, Operation, and Maintenance (AO&M)

In the initial search of indicators, 51 of 374 indicators related to aspects of AO&M, and almost all sources included at least one indicator dealing with this attribute. Essential elements required for sustained O&M include: a formal community organization that operates the system (with literate and trained members); administrative structures; tariffs; regular meetings; and strategies for community engagement [3,9]. This attribute consisted in 17 indicators: Existence of a legally registered water committee (7.1); Existence of a functional water committee (7.2); Existence of water committee bylaws (7.3); (Active water committee members/Total number of committee members) × 100 (7.4); Existence of an effective mechanism for the rotation of the water committee (7.5); (Number of water committee members trained in water management/Total number of committee members) × 100 (7.6); (Number of female water committee members/Total number of committee members) × 100 (7.7); Existence of rules for access and use of the water service (7.8); Existence of mechanisms for enforcement of rules for access and use of the water service (7.9); Existence of an office for the water committee (7.10); Existence of strategies for asset reposition (7.11); Existence of good written records (7.12); Number of effectively solved user complaints/Total number of complaints (7.13); Annual frequency of operation and maintenance activities (7.14); Existence of a functioning caretaker or maintenance committee (7.15); Number of trainings received by the caretaker or the maintenance committee in the last five years (7.16); and Existence of a salary or compensation for the caretaker or maintenance committee (7.17).

Post-Construction Support

Long-term involvement by outside groups to support community management is considered critical for system sustainability [47,48]. However, different barriers to external support programs have been reported such as insufficient time, tools, and funds to support communities [49]. Since increasing the number of experts in RWSS in developing countries is an expensive and long-term endeavor, providing training to community members in order to operate and maintain their system is recommended [50]. Despite the importance of training, rural communities may lack the technical or financial capacity to carry out complex O&M activities [51]. For this reason, external support is necessary in order to keep the system functioning over time [52]. In this study, the post-construction support attribute consisted of three indicators: Amount of money or in-kind resources received by users or a water committee from government or NGOs in the last year (8.1); Technical/administrative/financial training received by users or a water committee from government or NGOs in the last year (8.2); and Technical/administrative/financial support received by users or a water committee from government or NGOs in the last year (8.3).

Access to Water

Improved water supply has among its main benefits the reduction of time and effort to obtain water, which is associated with other factors such as increased health, education, productivity, and leisure time [35]. Access to water is highly context-dependent and is related to factors such as water service coverage [3,35], distance from the household to the water source or point [3,53], connections to a particular type of source (e.g., improved, unimproved, piped) [3]; and fetching time [46]. In this study, the access attribute consisted of two indicators: (Households provided/Total households in the village) × 100 (9.1); and (Household connections/Households provided) × 100 (9.2).

Appropriate Technology

Appropriate technology has been connected with indicators such as: the impact of demand on the operation and maintenance of the technology [3]; the local availability of parts and technology [22,38,42]; system complexity [4]; adequacy [46]; and the compatibility of a technology with geographic characteristics [5]. Five indicators were proposed for this attribute: Distance and type of road to the nearest urban center (10.1); Number of mechanical and electrical parts in the system (10.2); Number of system parts that are locally available/Number of total parts (10.3); Number of system parts that are affordable to the community/Number of total parts (10.4); and Amount of non-renewable energy required for system functioning (Kw) (10.5).

Infrastructure

Hoko and Hertle [8] stress the importance of construction quality to ensure sustainability, including meeting construction standards. In general, infrastructure can be assessed by its condition [46]; lifetime or age [42]; adequacy of design [5]; and adequacy of construction or the implementation of a construction project [34]. The infrastructure attribute consisted of nine indicators: Demand used for design/Actual demand (11.1); Number of components properly designed/Total components (11.2); Number of components properly built/Total components (11.3); Length of fencing/Required length of fencing (11.4); Number of properly designed treatment components/Total components (11.5); Number of properly built treatment components/Total components (11.6); Number of visible leaks (11.7); Number of components with an age below its estimated lifetime/Total components (11.8); and Percentage (%) of users who have working customer meters (11.9).

Reliability

Reliability is a direct measure of the functionality of a water supply system [22], and can be captured by system disruption or downtime indicators [3,47]. System breakdowns due to malfunctioning parts in a rural water supply system and deficient management can force users to use a potentially unsafe unimproved source of water [54]. Reliability can be associated with a minimum system functioning target of hours/day (e.g., 8 h/day) or downtime in hours/week [47]. This attribute comprises five indicators: Percentage (%) of users that receive water 24 h a day in the dry season (12.1); Percentage (%) of users that receive water 24 h a day in the rainy season (12.2); Percentage (%) of users that have not experienced failures in water provision in the last year (12.3); Percentage (%) of users who believe that when the service gets disrupted, it is quickly repaired (12.4); Percentage (%) of users who believe water pressure is adequate (12.5).

Water Quality

Water quality can be measured by indicators such as Escherichia coli (E. coli) counts [53], a suite of chemical and microbiological parameters [3], cleanliness of the water source [4], or water quality at the source [22]. In this study, two indicators were used to measure water quality: Percentage (%) of water samples without E. coli (13.1); and Percentage (%) of water samples with turbidity below 2 Nephelometric Turbidity Units (NTU) (13.2).

Financial Knowledge

Water committee members should have the knowledge and skills to budget for system needs [35], understand expenses [9], and manage a bank account [8,22]. This attribute was characterized by four indicators associated with the knowledge and practices of those in charge of system management: Existence of an annual budget for the system (14.1); Number of financial training sessions received in the last five years (14.2); Existence of a fund with enough resources to carry out operation and maintenance activities (14.3); and Existence of a fund with enough resources for investments in system improvements (14.4).

Funding

Indicators related to the funding of systems include the collection of tariffs or fees [55], the raising of funds to support the system as needed [8], cost-recovery [34], and debtor rate [41]. To increase the sense of system ownership, Hoko and Hertle [8] recommend at least 20% of system costs should be covered by the users. In addition, user fees should not exceed 3.5% of the monthly household income [47]. Water committees should have income for recurrent costs and savings for eventual crisis maintenance activities [47] and asset rehabilitation/replacement [41]. In this study, the funding attribute was comprised of six indicators: Existence of a fee for water service linked to the volume consumed and with charges according to socioeconomic levels (15.1); Existence of payment records (15.2); Percentage (%) of users who are up to date with payments (15.3); Percentage (%) of users for whom fees for basic supply is up to 3.5% of monthly household income (15.4); Existence of sanctions for late or non-payment (15.5); and Revenue/Budgeted needs during the last year (15.6).

Risks to Service Provision

Risks to service provision can be captured by measures such as pollution near the source and water abstraction that exceeds 40% of the available resource, compromising environmental integrity [22]. This attribute uses four indicators: Water demand during the dry season projected for 20 years/Yield at source (dry season) (16.1); Absence of human activities (e.g., agriculture, industry, human settlements, mining, etc.) with potential to pollute the water source (16.2); Absence of landslides that could threaten infrastructure components (16.3); and Percentage (%) of users that utilize alternative water sources (16.4).

Environmental Impact of Technology

Indicators dealing with the environmental impact of water systems have been considered in previous studies [3,45]. Environmental effects of a project are usually identified after implementation, however, their impacts are often not properly assessed beforehand [56]. Since part of SDG 13 is to ensure environmental sustainability [1], a water system should minimize all negative impacts on its surroundings. This attribute included seven indicators: Volume of wastewater in a year/Volume of water supplied in a year (17.1); Area occupied by the system/Volume of water supplied in a year (17.2); (Water abstracted during the dry season/Yield at source (dry season)) × 100 (17.3); Tons of solid waste produced in a year/Volume of water supplied in a year (17.4); Tons of atmospheric emissions produced in a year/Volume of water supplied in a year (17.5); Decibels generated in a year/Volume of water supplied in a year (17.6); and kW of non-renewable energy used in a year/Volume of water supplied in a year (17.7).

3.1.2. Weighting of Attributes and Indicators

As explained before, the Multi-Attribute Theory (MAUT) method was selected to interpret the identified attributes and the Analytical Hierarchy Process (AHP) was used to assign weights to the selected attributes. This approach has been used in similar studies in the field [15,16,17,22,57], and is considered useful and adaptable [46]. Table 1 summarizes the attributes and indicators (with codes) identified to assess the sustainability of RWSS with their corresponding weights and data collection methods.
While this tool is similar to others developed using multi-criteria analysis, specifically AHP, to assess the sustainability [16] or quality of service [17] of collective rural water supply systems, the attributes in this tool were not classified into the typical social, economic, and environmental categories [19,57] using a hierarchical tree approach [20]. In contrast, this tool consists of a large number of attributes (17) to ensure that attributes of high impact are not underestimated [58]. For example, if water quality were to be located in a technical category that is assigned a lower weight than, for instance, indicators in the social category, this critical measure would be underrepresented in the analysis. Although some attributes such as quantity, quality, continuity, finances, and community participation can be found in other tools, the assigned weights are different, which is not surprising since these weights are the result of subjective evaluations [20] and are also influenced by contextual factors. However, water quality was found to be the most important attribute in this study and in studies by Dwivedi and Bhadauria [16] and Molinos-Senante et al. [17].
Despite the similarities that exist between the proposed tool in this paper and the tools developed by Dwivedi and Bhadauria [16] and Molinos-Senante et al. [17], there are a number of substantial differences. In this work, the 17 attributes are clearly defined, explained, and further subdivided in 95 quantifiable indicators. The strategies for collecting data for each indicator are suggested, allowing people interested in this topic to include these measures in their own data collection activities. Other studies in the field do not provide clear definitions of attributes/indicators (i.e., quality of service, financial governance, capacity [16]), which can be interpreted differently. Other assessment tools use fewer indicators, a number of which are context-dependent (i.e., [17]). In this case, while the use of a large number of indicators will increase the data collection efforts, they allow for a holistic analysis and provide a more universal tool that can be adapted and used across a variety of developing country contexts. The universal nature of the proposed tool is achieved by selecting indicators from an extensive literature review focused on developing countries, combined with a careful assessment of the relevance of the indicators and their availability.
To improve the tool, the weightings of indicators could take into account the opinion and expertise of a wider number of local experts including water regulators, practitioners from the water sector, RWSS managers, and researchers as performed by Dwivedi and Bhadauria [16], and by considering uncertainty during the weight calibration process [17].

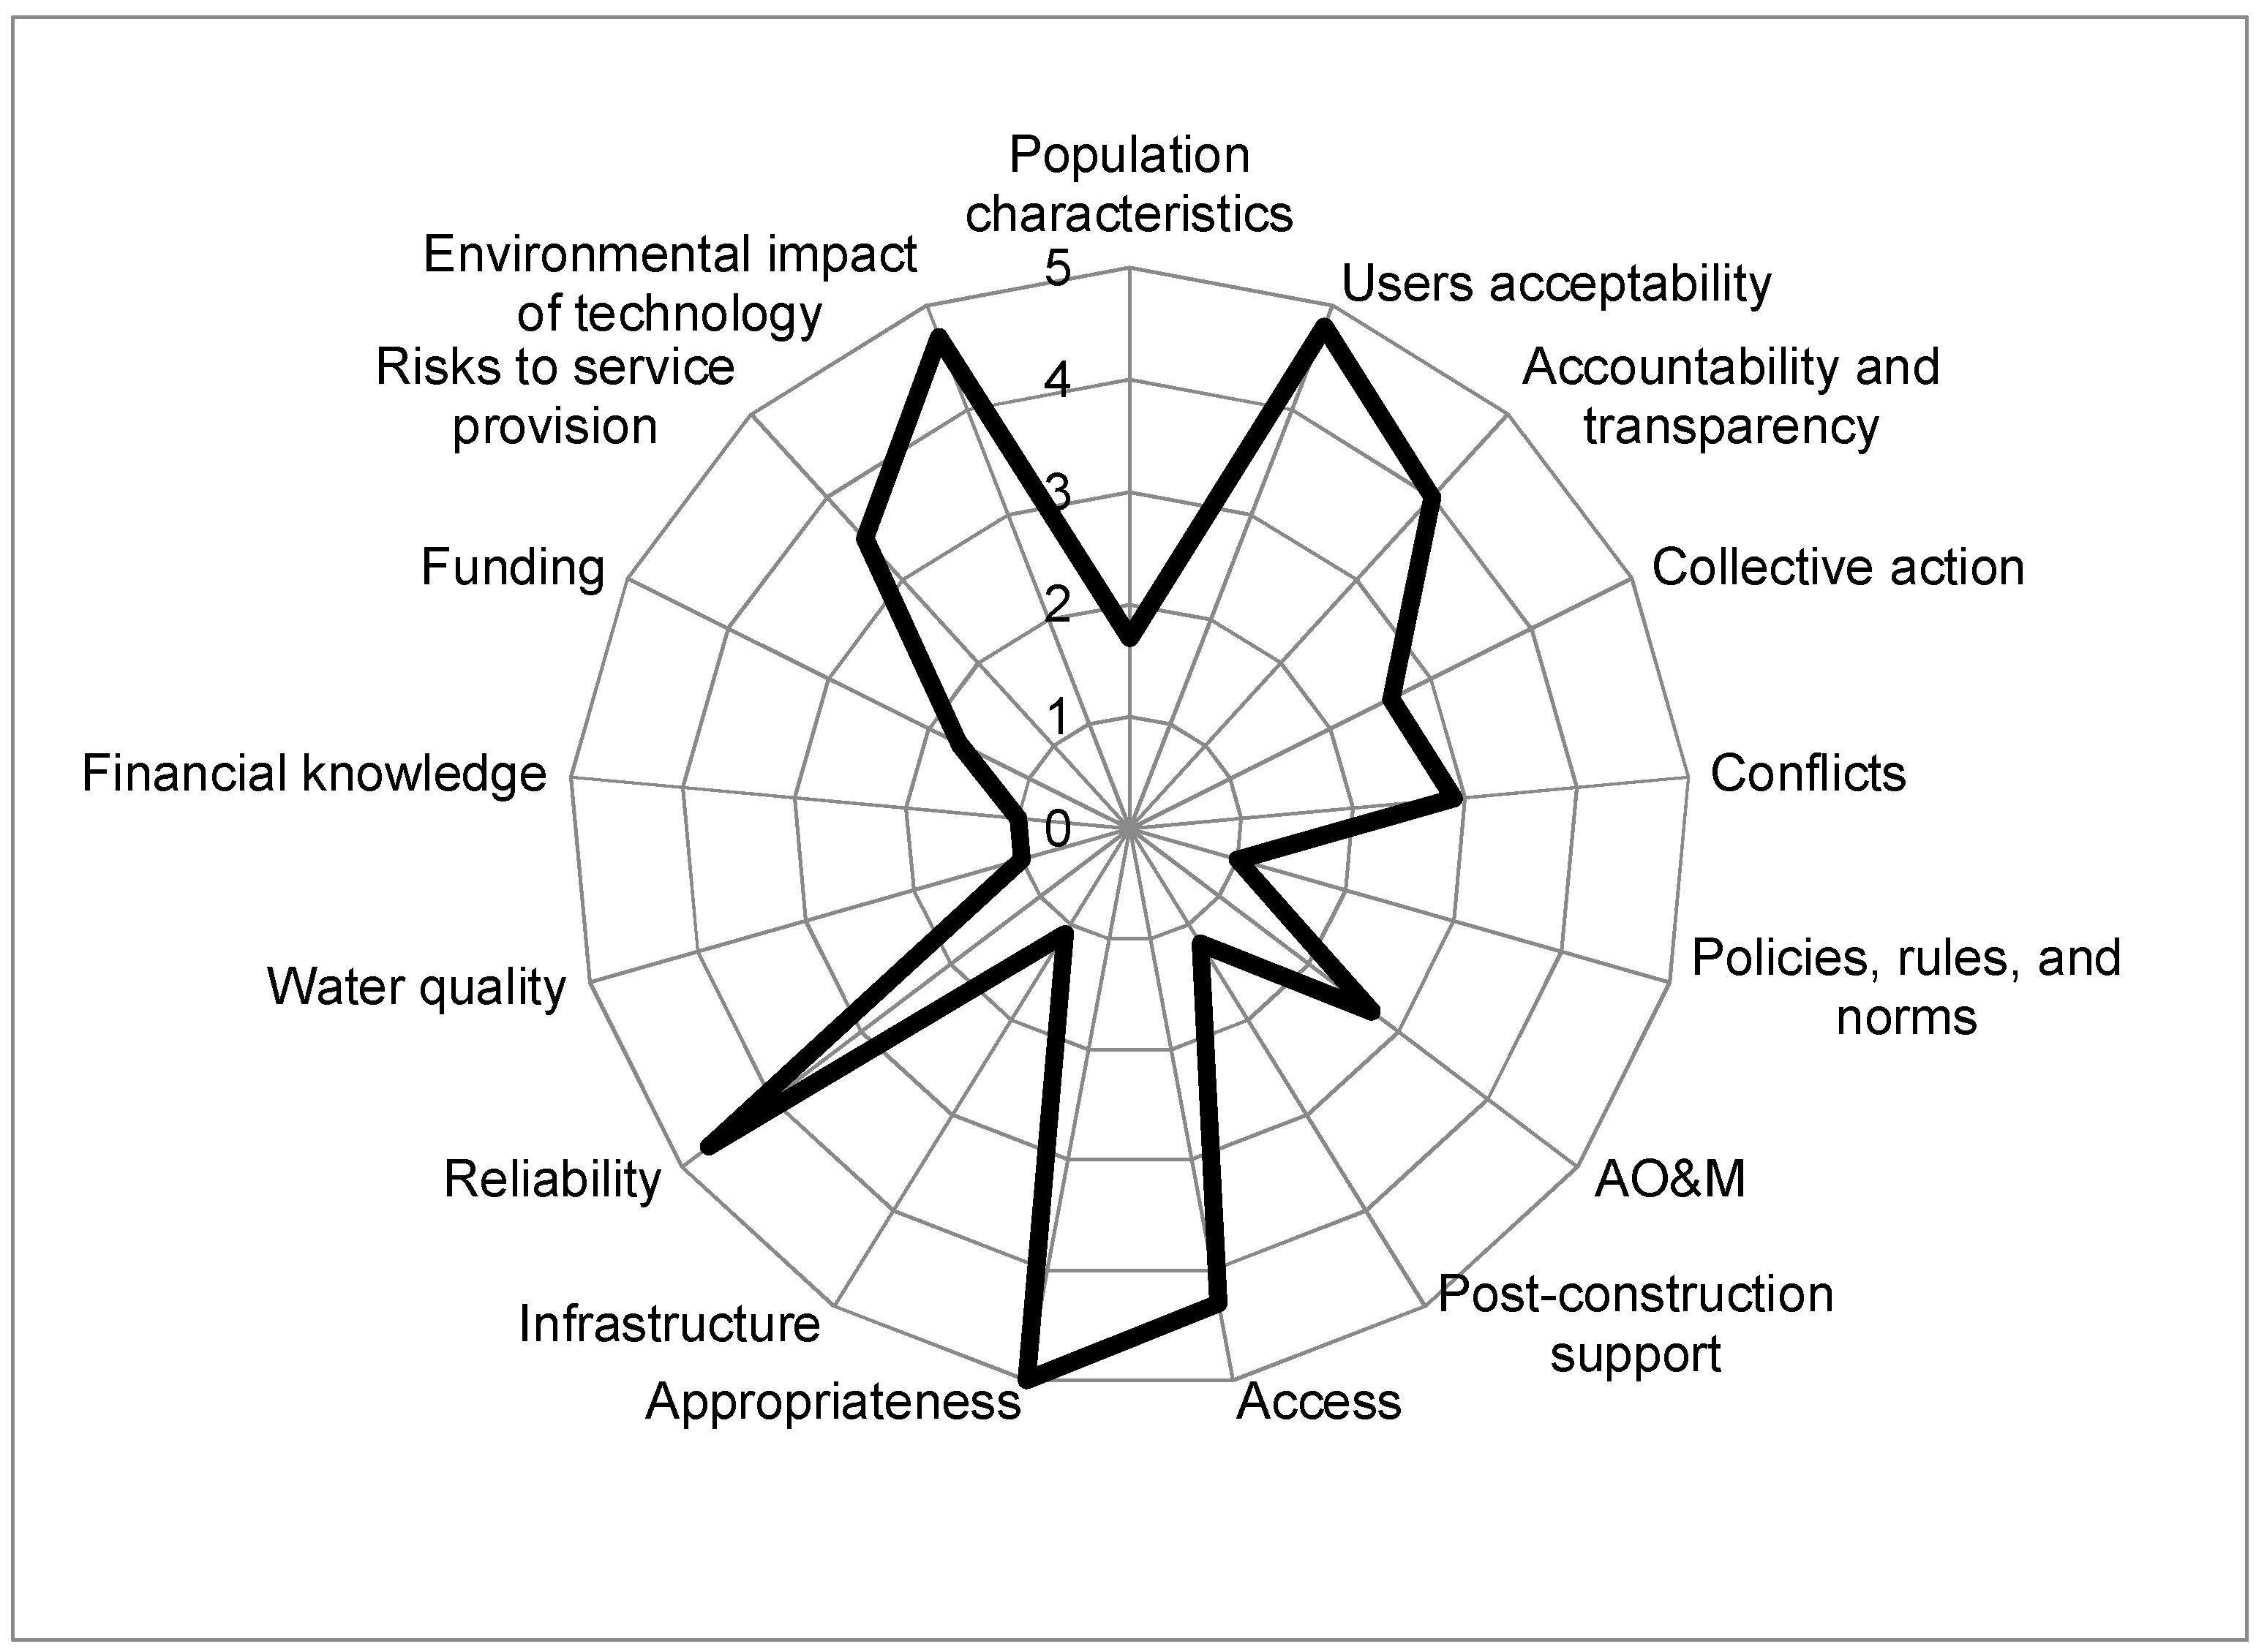
3.2. Sustainability Assessment of a Rural Water Supply System in a Páramo Community

A RWSS in the Berlin páramo (Santander—Colombia) was selected to apply the tool. The system is located 3200 m above sea level in the north of the eastern range in Colombia. The climate in this region has a bimodal behavior with two rainy and two dry seasons. The WSS had 85 household water connections (49% were owners and 51% were rented), with an average number of 4 inhabitants per household, that use the system for both domestic and productive uses. The main economic activity was cropping onions, which were irrigated twice a week for eight hours during the dry season. Users were responsible for AO&M and decision-making for the system. Water committee members were a small group of men and women who organized periodical meetings due to a lack of interest by others in the community to assume these responsibilities. Additionally, the community had little trust in external institutions due to bad previous experiences. The water intake structure for the community system was built across a stream located one hour walk from the households, in an area only accessible by foot. The intake was complemented by a sedimentation tank and a concrete reservoir.
In the following sections, the results of the evaluation of each sustainability attribute for the RWSS are presented and discussed, together with the single sustainability measure obtained. The complete data with scores and their rationale can be found in the Supplementary Material.

3.2.1. Population Characteristics

In the study area, this attribute scored low (1.7/5.0, see Table S6). The most critical aspects were the low educational level of the community, where only 12% of the survey respondents had completed high school or above; inexistent training in water, sanitation, and hygiene (0%); and the relatively high population growth (4%), which together with the high per capita water demand 740 l/d, could represent a risk for water provision in the future. One positive aspect was the perception of users on their ability to pay for the water service (97% believed they were able to pay). Table 2 provides the detailed results for the assessment of the Population characteristics attribute in the study area. Similar tables for each of the remaining 16 attributes can be found in the Supplementary Material.

3.2.2. Users Acceptability

This attribute had a high score (4.8/5.0, see Table S7), since 83% of users were satisfied with the water quantity, 89% with system reliability, and 92% had not experienced an illness perceived to be related to water. Furthermore, 95% of users were willing to pay a fee for the service. Slightly lower levels of satisfaction were found for water quality during the rainy season (60%) when compared with the dry season (80%).

3.2.3. Accountability and Transparency

This attribute scored high (4.0/5.0, see Table S8), since there was a water committee which met regularly with users, especially for decision-making; the community was informed when money was collected and how it was invested; and they knew the rules for access and use of the water service. For the last aspect, 100% of survey respondents expressed not using water from the system for irrigation. However, the demand for water (740 lpcd) suggested users were not following the water consumption rules they established (i.e., restrictions on the productive use of water).

3.2.4. Collective Action

This attribute scored 2.6/5.0 (see Table S9). The salient aspects were that people felt they were listened to and their opinions were respected (86%); people were willing to participate in activities related to the system (89%); and leaders had initiatives for system improvement. For instance, system construction was initiated by an external initiative and it was not finished. In this scenario, local leaders collected funds among the community, finished the system construction, and assumed its operation without any external support.

3.2.5. Conflicts

This attribute had a score of 2.9/5.0 (see Table S10). Although most respondents expressed an absence of conflicts between users (98%), local leaders acknowledged a latent conflict with people using water from the system for irrigation. Furthermore, human activities in the páramo and the mandate of the national government to protect paramo ecosystems [59], together with the increasing demand by downstream users of water provided by the páramo [26], posed an unresolved conflict.

3.2.6. Policies, Rules, and Norms

This attribute had a low score in the studied system (1.0/5.0, see Table S11), since the requirements set by Colombian regulations for water service providers were not met. The leaders ignored some of these requirements or the process to fulfil them, and, crucially, the system lacked the right to access water.

3.2.7. Administration, Operation, and Maintenance (AO&M)

Seventeen indicators were included in this attribute. The AO&M attribute had a medium score (2.7/5.0, see Table S12). Positive characteristics were the existence of a functional water committee, with actively involved members and with female participation. However, the committee was not legally registered and lacked bylaws. Committee members had taken over the management due to a lack of interest from others to assume responsibilities beyond performing occasional maintenance tasks or making sporadic economic contributions. Therefore, the committee members did not rotate or receive any compensation for their work, and had no training to perform their duties. The water committee lacked an office, a system for keeping records, strategies for asset reposition, and for receiving and addressing user complaints. Rules for access and use of the water service were not enforced, monitored, or sanctioned. Some 60% of respondents indicated they had participated in O&M, at least once, while around one third ignored basic information on system functioning. Due to the character of a voluntary service, the frequency of O&M was not adequate.

3.2.8. Post-Construction Support

This attribute scored low (1.2/5.0, see Table S13), since the community sporadically received financial resources from government institutions, but this has never been accompanied by technical/administrative/financial support or training. Since the community had little trust in external institutions, most respondents explained they preferred non-external intervention.

3.2.9. Access to Water

This attribute performed well (4.3/5.0, see Table S14), since 91% of premises in the community had household connections. The remaining households were not served due to pressure limitations, but individual surface sources were available.

3.2.10. Appropriate Technology

The appropriate technology attribute scored high (5.0/5.0, see Table S15), since the system was gravity-fed, it did not need any source of non-renewable energy or complex equipment or parts. Furthermore, parts were easily available from the nearest urban center, located 55 km away via a paved road.

3.2.11. Infrastructure

The infrastructure attribute had a low score (1.1/5.0, see Table S16), because several failures were identified. For instance, the intake area lacked a fence, allowing animals to enter and defecate near the source, which was not treated. Although the system was about five years old, there was evidence of deterioration. The pipeline was above the surface level and was being worn by animals, poor water drainage, and human activities. Furthermore, users’ water needs were not compatible with the design. Initially, the system was designed and built for domestic uses, but it had been repurposed for both domestic and productive activities. Thus, the infrastructure fell short and the community was forced to adapt an artisanal transmission pipe, making both the intake structure and the grit chamber ineffective.

3.2.12. Reliability

This attribute scored high (4.7/5.0, see Table S17), because 97% of survey respondents indicated the system provided water during the dry and rainy season, 24 h a day, every day (83%). Although, some people experienced failures in water provision at least once in the previous year (55%), mostly due to a pipe breakage, they stated failures were typically solved in two or less days.

3.2.13. Water Quality

Water quality scored low (1.0/5.0, see Table S18), since E. coli counts were present in 100% of samples at the source and at household taps, in both the dry and rainy seasons. Regarding Turbidity, 50% of the samples from the source and 100% from the households fell outside the quality standard in the dry season, while in the rainy season the non-compliance was 75% and 100%, respectively.

3.2.14. Financial Knowledge

This attribute scored low (1.0/5.0, see Table S19), because the water committee lacked a budget for system revenues and expenses; they ignored the total costs of providing a service (e.g., staff, water rights, taxes, O&M, depreciation, reposition); they had not received financial training; there was no money for recurring expenses, AO&M, or investments; and repairs and improvements were made with sporadic contributions. There were some remaining savings from extraordinary contributions, but those were limited since typically the exact amount of money needed for system investments were requested from users. As explained before, all work was performed by volunteers without financial compensation.

3.2.15. Funding

This attribute scored low (1.7/5.0, see Table S20), since there was no fee for the water service. Instead, money was collected through contributions when failures occurred, which was sufficient for some investments and minor repairs, but not for the improvements required by the system in terms of infrastructure and AO&M.

3.2.16. Risks to Service Provision

This attribute had a relatively high score (3.5/5.0, see Table S21). The source provided 18 l/s and the peak demand in the system was 3 l/s, which means only 17% of available water was being abstracted. However, service provision was at risk due to grazing activities around the intake, grit chamber, and storage tank. Livestock had free access to these areas, creating a potential pollution threat. In addition, in most of its length the main pipeline was above the surface level, and at some points, the network went through places where there was a landslide risk.

3.2.17. Environmental Impact of Technology

This attribute had good performance (4.7/5.0, see Table S22), because it was a gravity-fed system, occupying a small amount of land. The system only used 17% of the available flow at the source in the dry season, leaving water in the channel for downstream uses and the environment. The system did not produce any atmospheric emissions, solid waste, or noise, and did not use non-renewable energy. The only environmental impact was the generation of wastewater once a month when infrastructure components were washed.

3.3. Insights from Applying the Tool

Figure 2 provides a synthesis of the performance of the case study system in relation to each of the 17 attributes explained in Section 3.1.1 and whose results are summarized in Section 3.2. A scale of 1 to 5, with 5 being fully met and 1 being not met is used. The radar diagram allows a simple representation to simultaneously compare the results for all the attributes considered, showing the attributes with high, intermediate, and weak performance. This diagram provides an easy to understand but powerful communication strategy, which can help the community rapidly identify areas for improvement.
When addressing sustainability in RWSS, the literature has emphasized the importance of understanding challenges for different contexts [46]. The results from this study show that challenges to sustainable water provision in the assessed system are like those described elsewhere [5,9,40,53,55,60] and in Colombia [61,62] in relation to the lack of training, knowledge, and compliance with legal standards and regulations, weak finances to properly develop system administration, operation, and maintenance, and a lack of post-construction support. As in other places, productive uses of water, typical in rural areas, were ignored in the system design, which created technical and managerial problems. Although accounting for productive and domestic uses is considered a key factor for sustainability in the multiple uses of water literature [63,64], aspects of productive uses are typically excluded as attributes or indicators in the literature regarding sustainability of RWSS (e.g., Dwivedi and Bhadauria [16] and Molinos-Senante et al. [17]).
A distinctive feature of the system studied was the abundance of water, which could be threatened by population growth and increasing demand for productive activities. The poor quality of water, even in the highest elevations of the system, should be a priority at different decision-making levels. In addition, a conflict was identified between local people, the environmental authority, and downstream users who depend on water from the páramo. This conflict represents a challenge over the decisions regarding livelihoods, land use, and water resources. Disputes over divergent valuations by different stakeholders (farmers, the government, and downstream users) of the Berlin páramo, have been extensively discussed by Duarte-Abadía and Boelens [26], who argue that in relation to environmental arguments, páramo inhabitants are being marginalized and considered water polluters who threaten the ecosystem and water provision downstream.
In contrast to studies in which several RWSS are analyzed to understand or generate recommendations at the district [16] or country level [17], this research presents an in-depth case study, where data collection activities include the use of secondary information from official databases [17], RWSS records, semi-structured interviews with system managers, focus groups, technical inspections, and household surveys [16], complemented with water quantity and quality measurements. All the information was collected and analyzed with a team consisting of people from the system studied and researchers. Thus, the evaluation approach included community participation which provided spaces to discuss and identify improvements and develop action plans. This approach could lead to the appropriation of the results, mobilization of actions, and greater probability that the community will implement the changes required to improve the situation under analysis [65].
The tool could be used in a RWSS with different levels of compliance with legal and institutional aspects, and post-construction support. This represents an advantage over other tools, validated in systems that are often benefiting from government programs, and therefore ignore some key attributes (e.g., policies, rules, and norms [16] and post-construction support [17]). In contrast, many systems in Colombia are managed by community organizations that mobilize themselves [61]. Thus, these key aspects cannot be ignored when assessing the sustainability of these systems. This situation can also be found in other parts of the world. Despite the fact that the case study used for validation is not under serious water stress, the tool is able to evaluate water efficiency across different attributes (e.g., indicators 1.3, 11.1, 11.7, 11.9, 16.1, 16.4, and 17.3), which allow the tool to be used in water scarce areas. The tool can also be used in contexts similar to that of the case study (e.g., community-managed, gravity-fed systems with household connections). In general, available tools (such as the one developed in this paper) can be used to assess individual systems [5,15], with some focusing on systems accessing a specific type of water source, such as groundwater [16].
Furthermore, the tool allows a holistic assessment of sustainability since it includes attributes and indicators that sometimes are not under the direct managerial possibilities of community-based organizations (i.e., population characteristics), but have high influence on a system’s sustainability. Assessing these indicators through a participatory process could increase the understanding of local leaders and the community on the performance of the RWSS from a systemic perspective. Consideration of these aspects generates evidence that could mobilize the community to pursue strategies to improve different dimensions of a community’s quality of life, which would include improving the service provided by the RWSS. This community-based approach is crucial, since in many cases RWSS managers also lead other development projects in their community related to education, health, production, etc. These other projects can directly impact the sustainability of a RWSS, so using a tool that can help communities advance a more holistic approach to their development is likely to result in more impactful results than those that can be achieved when using tools that have a more limited scope. In addition, the tool advanced in this paper includes indicators associated with multiple-use water services (MUS), which is an approach to rural water planning that is increasingly associated with improved rural water system sustainability [64].
Finally, the tool incorporates attributes such as conflicts, risks to service provision, and the environmental impact of technology, which have been overlooked in comparable tools (e.g., [16,17]), but are critical when considering increasing pressures associated with climate change, water scarcity, and conflicts between users, communities upstream/downstream, and water providers and regulators [66].
This tool can be used to assess different dimensions of RWSS sustainability, especially for gravity-fed systems with household connections that are managed by participatory forms of governance. The assessment process and results could provide communities with a baseline against which they can identify opportunities to enhance their system and benchmark continuous improvement efforts. The proposed tool can also promote collective action, where a community could mobilize its own resources to address the problems identified. In addition, at the time of an evaluation, efforts can be made to connect a community with external institutions that may be able to provide financial resources for repairs that fall beyond what a community can afford. These external institutions may also be able to support a community through capacity development.

4. Conclusions

Despite decades of research on the sustainability of rural water supply systems, maintaining a reliable water supply remains a development challenge in rural, remote, and marginalized communities in developing countries.
Most studies assessing sustainability in rural water supply systems use a low number of indicators, presumably for pragmatism, the costs associated with data collection, or the use of indicators that are considered proxies to assess attributes. The attributes and indicators selected for the proposed assessment tool were found to be critical to the measurement of sustainability, collectable, and relevant for decision making. The tool developed provides a holistic way to assess the sustainability of rural water supply systems in a local context.
Most MCA studies have emphasized assessments and comparisons across different systems. In the analysis of the RWSS, the quantitative scale of sustainability and the empirical results of the assessment, when shared with community members proved to be a useful communication tool on system sustainability. In addition, the tool can be used to monitor the status of the scheme and as a reference point for decisions. The tool can also be used in similar contexts, providing a baseline for administrators to holistically assess the state of a system, devise improvements, and monitor behavior over time. The tool can help community providers prioritize their actions and investments, look for support for aspects beyond their immediate capabilities, and self-mobilize for improvements that can be performed without external support.
From a policy and managerial perspective, the results show the importance of integrating multiple attributes into a single dimension when assessing the sustainability of RWSS and how collaborating closely with a community can help ensure the findings can be linked with actionable system improvements. Developing studies comparing systems at a district or country level could also help governmental agencies devise policies and identify post-construction support strategies based on the needs of RWSS managed by community based-organizations.
The tool could be improved by establishing thresholds or benchmarks for the indicators. Furthermore, community members could assign weights to attributes, which can result in greater appropriation of the results and mobilisation for actions that generate positive changes in the systems assessed.

Supplementary Materials

The following are available online at https://0-www-mdpi-com.brum.beds.ac.uk/2071-1050/11/19/5363/s1, Detailed explanation and results of the analytic hierarchy process method; Sustainability score of the rural water supply system (RWSS).

Author Contributions

Conceptualization, I.D.; Data curation, A.B.; Formal analysis, I.D., E.R.O.-O. and R.P.H.; Methodology, I.D., E.R.O.-O., K.H. and A.B.; Project administration, I.D.; Validation, K.H. and A.B.; Writing—original draft, I.D.; Writing—review & editing, I.D., E.R.O.-O. and R.P.H.

Funding

This research was funded by Universidad Industrial de Santander and Corporación Autónoma para la Defensa de la Meseta de Bucaramanga.

Acknowledgments

The authors thank the community and leaders from rural water supply system (RWSS) for their active participation in this research.

Conflicts of Interest

The authors declare no conflict of interest. The funders had no role in the design of the study; in the collection, analyses, or interpretation of data; in the writing of the manuscript, or in the decision to publish the results”.

References

  1. UN. Transforming Our World: The 2030 Agenda for Sustainable Development; United Nations (UN): New York, NY, USA, 2015; Volume A/RES/70/1, p. 35. [Google Scholar]
  2. WHO; UNICEF. Progress on Drinking Water, Sanitation and Hygiene: 2017 Update and SDG Baselines; World Health Organization (WHO): Geneva, Switzerland; United Nations Children’s Fund (UNICEF): Geneva, Switzerland, 2017. [Google Scholar]
  3. Dickson, S.; Schuster-Wallace, C.; Newton, J. Water security assessment indicators: The rural context. Water Resour. Manag. 2016, 30, 1567–1604. [Google Scholar] [CrossRef]
  4. Barnes, R.; Ashbolt, N. Development of a planning framework for sustainable rural water supply and sanitation: A case study of a Filipino NGO. Int. Stud. Manag. Organ. 2010, 40, 78–98. [Google Scholar] [CrossRef]
  5. Garfì, M.; Ferrer-Martí, L.; Bonoli, A.; Tondelli, S. Multi-criteria analysis for improving strategic environmental assessment of water programmes. A case study in semi-arid region of Brazil. J. Environ. Manag. 2011, 92, 665–675. [Google Scholar] [CrossRef] [PubMed]
  6. Brikke, F.; Rojas, J. Key factors for sustainable cost recovery in the context of community-managed water supply. In Occasional Paper Series; IRC: New York, NY, USA, 2001. [Google Scholar]
  7. Harvey, P.; Reed, R. Sustainable rural water supply in Africa: Rhetoric and reality. In Towards the Millennium Development Goals—Actions for Water and Environmental Sanitation, Proceedings of the 29th WEDC International Conference, Abuja, Nigeria, 22–26 September 2003; WEDC: Loughborough, UK, 2004; pp. 115–118. [Google Scholar]
  8. Hoko, Z.; Hertle, J. An evaluation of the sustainability of a rural water rehabilitation project in Zimbabwe. Phys. Chem. Earth Parts A/B/C 2006, 31, 699–706. [Google Scholar] [CrossRef]
  9. Kwangware, J.; Mayo, A.; Hoko, Z. Sustainability of donor-funded rural water supply and sanitation projects in Mbire district, Zimbabwe. Phys. Chem. Earth Parts A/B/C 2014, 76, 134–139. [Google Scholar] [CrossRef]
  10. Zijp, M.C.; Heijungs, R.; van der Voet, E.; van de Meent, D.; Huijbregts, M.A.J.; Hollander, A.; Posthuma, L. An identification key for selecting methods for sustainability assessments. Sustainability 2015, 7, 2490–2512. [Google Scholar] [CrossRef]
  11. Hamouda, M.A.; Anderson, W.B.; Huck, P.M. Employing multi-criteria decision analysis to select sustainable point-of-use and point-of-entry water treatment systems. Water Sci. Technol. Water Supply 2012, 12, 637–647. [Google Scholar] [CrossRef]
  12. Sikder, A.H.M.K.; Salehin, M. Participatory multi-criteria evaluation of alternative options for water supply in cyclone-prone areas of Bangladesh. J. Water Sanit. Hyg. Dev. 2014, 4, 100–107. [Google Scholar] [CrossRef]
  13. Boukhari, S.; Djebbar, Y.; Amarchi, H.; Sohani, A. Application of the analytic hierarchy process to sustainability of water supply and sanitation services: The case of Algeria. Water Sci. Technol. Water Supply 2018, 18, 1282–1293. [Google Scholar] [CrossRef]
  14. Poonia, A.; Punia, M. A question on sustainability of drinking water supply: A district level analysis of India using analytic hierarchy process. Water Policy 2018, 20, 712–724. [Google Scholar] [CrossRef]
  15. Santos, J.; Pagsuyoin, S.A.; Latayan, J. A multi-criteria decision analysis framework for evaluating point-of-use water treatment alternatives. Clean Technol. Environ. Policy 2016, 18, 1263–1279. [Google Scholar] [CrossRef]
  16. Dwivedi, A.K.; Bhadauria, S.S. Composite sustainable management index for rural water supply systems using the analytical hierarchy process. J. Perform. Constr. Facil. 2014, 28, 608–617. [Google Scholar] [CrossRef]
  17. Molinos-Senante, M.; Muñoz, S.; Chamorro, A. Assessing the quality of service for drinking water supplies in rural settings: A synthetic index approach. J. Environ. Manag. 2019, 247, 613–623. [Google Scholar] [CrossRef] [PubMed]
  18. Reed, M.S.; Fraser, E.D.; Dougill, A.J. An adaptive learning process for developing and applying sustainability indicators with local communities. Ecol. Econ. 2006, 59, 406–418. [Google Scholar] [CrossRef]
  19. Mutikanga, H.E.; Sharma, S.K.; Vairavamoorthy, K. Multi-criteria decision analysis: A strategic planning tool for water loss management. Water Resour. Manag. 2011, 25, 3947. [Google Scholar] [CrossRef]
  20. Scholz, R.; Tietje, O. Embedded Case Study Methods: Integrating Quantitative and Qualitative Knowledge; Sage Publications, Inc.: Thousand Oaks, CA, USA, 2002. [Google Scholar]
  21. Saaty, T. How to make a decision: The analytic hierarchy process. Eur. J. Oper. Res. 1990, 48, 9–26. [Google Scholar] [CrossRef]
  22. Kativhu, T.; Mazvimavi, D.; Tevera, D.; Nhapi, I. Factors influencing sustainability of communally-managed water facilities in rural areas of Zimbabwe. Phys. Chem. Earth Parts A/B/C 2017, 100, 247–257. [Google Scholar] [CrossRef]
  23. Rivera-Ospina, D.; Murcia-Rodríguez, E. Guía Divulgativa de Criterios Para la Delimitación de Páramos de Colombia; Ministerio de Ambiente, Vivienda y Desarrollo Territorial, Instituto de Investigación de Recursos Biológicos Alexander von Humboldt: Bogotá, Colombia, 2011.
  24. Ochoa-Tocachi, B.F.; Buytaert, W.; De Bièvre, B.; Célleri, R.; Crespo, P.; Villacís, M.; Llerena, C.A.; Acosta, L.; Villazón, M.; Guallpa, M. Impacts of land use on the hydrological response of tropical Andean catchments. Hydrol. Process. 2016, 30, 4074–4089. [Google Scholar] [CrossRef] [Green Version]
  25. Quintero, F. Cebolleros de Santurban se resisten a dejar de cultivar. El Tiempo. 2014. Available online: https://www.eltiempo.com/archivo/documento/CMS-13918957 (accessed on 17 September 2019).
  26. Duarte-Abadía, B.; Boelens, R. Disputes over territorial boundaries and diverging valuation languages: The Santurban hydrosocial highlands territory in Colombia. Water Int. 2016, 41, 15–36. [Google Scholar] [CrossRef]
  27. Geilfus, F. 80 Tools for Participatory Development: Appraisal, Planning, Follow-Up and Evaluation; Instituto Interamericano de Cooperación Para la Agricultura (IICA): San José, CA, USA, 2008. [Google Scholar]
  28. WHO. Water Safety in Distribution Systems Services; World Health Organization (WHO): Geneva, Switzerland, 2014; p. 147. [Google Scholar]
  29. WHO. Water Safety Planning for Small Community Water Supplies: Step-by-Step Risk Management Guidance for Drinking-Water Supplies in Small Communities; World Health Organization (WHO): Geneva, Switzerland, 2012; p. 66. [Google Scholar]
  30. WHO. Guidelines for Drinking-Water Quality (2011), 4th ed.; World Health Organization (WHO): Geneva, Switzerland, 2012; p. 541. [Google Scholar]
  31. Bartram, J.; Ballance, R. Water Quality Monitoring: A Practical Guide to the Design and Implementation of Freshwater Quality Studies and Monitoring Programmes; E & FN Spon: London, UK, 1996. [Google Scholar]
  32. WHO. Rapid Assessment of Drinking-Water Quality: A Handbook for Implementation; World Health Organization (WHO): Geneva, Switzerland, 2012; p. 148. [Google Scholar]
  33. APHA. Standards Methods for Examination of Water and Wastewater; American Public Health Association (APHA): Washington, DC, USA, 2005. [Google Scholar]
  34. Walters, J.P.; Javernick-Will, A.N. Long-term functionality of rural water services in developing countries: A system dynamics approach to understanding the dynamic interaction of factors. Environ. Sci. Technol. 2015, 49, 5035–5043. [Google Scholar] [CrossRef]
  35. Jones, S.; Sanford Bernhardt, K.; Kennedy, M.; Lantz, K.; Holden, T. Collecting critical data to assess the sustainability of rural infrastructure in low-income countries. Sustainability 2013, 5, 4870–4888. [Google Scholar] [CrossRef]
  36. Howard, G.; Bartram, J. Domestic Water Quantity, Service Level and Health; WHO/SDE/WSH/03.02; World Health Organization: Geneva, Switzerland, 2003; p. 33. [Google Scholar]
  37. Hazeltine, B. Water supply. In Field Guide to Appropriate Technology; Hazeltine, B., Bull, C., Eds.; Elsevier Inc.: Amsterdam, The Netherlands, 2003; pp. 731–809. [Google Scholar]
  38. Garfì, M.; Ferrer-Martí, L. Decision-making criteria and indicators for water and sanitation projects in developing countries. Water Sci. Technol. 2011, 64, 83–101. [Google Scholar] [CrossRef] [PubMed]
  39. WHO. Guidelines for Drinking-Water Quality; World Health Organization (WHO): Geneva, Switzerland, 2008. [Google Scholar]
  40. Neely, K.; Walters, J.P. Using Causal Loop Diagramming to explore the drivers of the sustained functionality of rural water services in Timor-Leste. Sustainability 2016, 8, 57. [Google Scholar] [CrossRef]
  41. Smits, S.; Tamayo, S.; Ibarra, V.; Rojas, J.; Benavidez, A.; Bey, V. Gobernanza y Sostenibilidad de los Sistemas de Agua Potable y Saneamiento Rurales en Colombia. Banco Interamericano de Desarrollo (BID): Washington, DC, USA, 2012; p. 155. [Google Scholar]
  42. Madrigal-Ballestero, R.; Alpízar, F.; Schlüter, A. Public perceptions of the performance of community-based drinking water organizations in Costa Rica. Water Resour. Rural Dev. 2013, 1, 43–56. [Google Scholar] [CrossRef]
  43. Kelly, E.; Lee, K.; Shields, K.F.; Cronk, R.; Behnke, N.; Klug, T.; Bartram, J. The role of social capital and sense of ownership in rural community-managed water systems: Qualitative evidence from Ghana, Kenya, and Zambia. J. Rural Stud. 2017, 56, 156–166. [Google Scholar] [CrossRef]
  44. Koutsou, S.; Partalidou, M.; Ragkos, A. Young farmers’ social capital in Greece: Trust levels and collective actions. J. Rural Stud. 2014, 34, 204–211. [Google Scholar] [CrossRef]
  45. Jones, S.; Silva, C. A practical method to evaluate the sustainability of rural water and sanitation infrastructure systems in developing countries. Desalination 2009, 248, 500–509. [Google Scholar] [CrossRef]
  46. Peter, G.; Nkambule, S.E. Factors affecting sustainability of rural water schemes in Swaziland. Phys. Chem. Earth Parts A/B/C 2012, 50, 196–204. [Google Scholar] [CrossRef]
  47. Schweitzer, R.W.; Mihelcic, J.R. Assessing sustainability of community management of rural water systems in the developing world. J. Water Sanit. Hyg. Dev. 2012, 2, 20–30. [Google Scholar] [CrossRef]
  48. Alexander, K.T.; Tesfaye, Y.; Dreibelbis, R.; Abaire, B.; Freeman, M.C. Governance and functionality of community water schemes in rural Ethiopia. Int. J. Public Health 2015, 60, 977–986. [Google Scholar] [CrossRef]
  49. Miller, M.; Cronk, R.; Klug, T.; Kelly, E.R.; Behnke, N.; Bartram, J. External support programs to improve rural drinking water service sustainability: A systematic review. Sci. Total Environ. 2019, 670, 717–731. [Google Scholar] [CrossRef] [PubMed]
  50. Beyene, H.A. Factors Affecting the Sustainability of Rural Water Supply Systems: The Case of Mecha Woreda, Amhara Region, Ethiopia. Ph.D. Thesis, Cornell University, Ithaca, NY, USA, 2012. [Google Scholar]
  51. Kleemeier, E. The impact of participation on sustainability: An analysis of the Malawi rural piped scheme program. World Dev. 2000, 28, 929–944. [Google Scholar] [CrossRef]
  52. Lockwood, H. Mecanismos de Apoyo Institucional Para los Sistemas Rurales de Agua Potable y Saneamiento Manejados por las Comunidades en América Latina; USAID: Washington, DC, USA, 2002; p. 79.
  53. Majuru, B.; Jagals, P.; Hunter, P.R. Assessing rural small community water supply in Limpopo, South Africa: Water service benchmarks and reliability. Sci. Total Environ. 2012, 435, 479–486. [Google Scholar] [CrossRef] [PubMed]
  54. Klug, T.; Cronk, R.; Shields, K.F.; Bartram, J. A categorization of water system breakdowns: Evidence from Liberia, Nigeria, Tanzania, and Uganda. Sci. Total Environ. 2018, 619, 1126–1132. [Google Scholar] [CrossRef] [PubMed]
  55. Foster, T.; Hope, R. A multi-decadal and social-ecological systems analysis of community waterpoint payment behaviours in rural Kenya. J. Rural Stud. 2016, 47, 85–96. [Google Scholar] [CrossRef]
  56. World Bank. Infrastructure at the Crossroads: Lessons from 20 Years of World Bank Experience; World Bank: Washington, DC, USA, 2006; p. 168. [Google Scholar]
  57. Pagsuyoin, S.A.; Santos, J.R.; Latayan, J.S.; Barajas, J.R. A multi-attribute decision-making approach to the selection of point-of-use water treatment. Environ. Syst. Decis. 2015, 35, 437–452. [Google Scholar] [CrossRef]
  58. Raigoza-Loaiza, J.F. Aplicación de Métodos Multi-Criterio (MCDA) Para Planeamiento Energético de Largo Plazo en la Industria del Cemento. Ph.D. Thesis, Universidad Nacional de Colombia-Sede Medellín, Medellín, Colombia, 2016. [Google Scholar]
  59. Congreso de Colombia. Ley 1930; Diario Oficial: Bogotá, Colombia, 2018.
  60. Harvey, P.A.; Reed, R.A. Community-managed water supplies in Africa: Sustainable or dispensable? Community Dev. J. 2007, 42, 365–378. [Google Scholar] [CrossRef]
  61. Domínguez-Rivera, I.; Oviedo-Ocaña, E.R.; Restrepo-Tarquino, I. Service provision in rural water supplies: Analysis of four community-based systems in Colombia. Cuadernos de Desarrollo Rural 2016, 13, 117–140. [Google Scholar] [CrossRef]
  62. Moriarty, P.; Smits, S.; Butterworth, J.; Franceys, R. Trends in rural water supply: Towards a service delivery approach. Water Altern. 2013, 6, 329–349. [Google Scholar]
  63. Smits, S.; van Koppen, B.; Moriarty, P.; Butterworth, J. Multiple-use services as an alternative to rural water supply services: A characterisation of the approach. Water Altern. 2010, 3, 102–121. [Google Scholar]
  64. Van Koppen, B.; Smits, S. Multiple-use water services: Climbing the water ladder. Waterlines 2010, 29, 5–20. [Google Scholar] [CrossRef]
  65. Carr, G.; Blöschl, G.; Loucks, D.P. Evaluating participation in water resource management: A review. Water Resour. Res. 2012, 48. [Google Scholar] [CrossRef] [Green Version]
  66. WWAP. The United Nations World Water Development Report 2019: Leaving No One Behind; UNESCO World Water Assessment Programme: Paris, France, 2019; p. 186. [Google Scholar]
Figure 1. Location of the study area.
Sustainability 11 05363 g001
Figure 2. Behaviour of the RWSS water supply system on sustainability attributes.
Sustainability 11 05363 g002
Table 1. Attributes and indicators to assess RWSS sustainability.
AttributeWaIndicator CodeWiData Collection MethodIndicator CodeWiData Collection MethodIndicator CodeWiData Collection Method
1. Population characteristics0.061.10.05HS1.40.05HS1.70.10HS
1.20.20TL1.50.05HS
1.30.50WM1.60.05HS
2. Users acceptability0.062.10.20HS2.30.20HS2.50.20HS
2.20.35HS2.40.05HS
3. Accountability and transparency0.023.10.25FG; SSI3.30.25FG; SSI; HS
3.20.25FG; SSI3.40.25FG; SSI
4. Collective action0.064.10.05HS; FG; SSI4.50.10HS; FG; SSI4.90.05FG; SSI; TL
4.20.05HS; FG; SSI4.60.05HS; FG; SSI4.100.05HS; FG; SSI
4.30.05FG; SSI; TL4.70.20HS; FG; SSI
4.40.35HS4.80.05HS
5. Conflicts0.045.10.30FG; SSI; TL5.20.40FG; SSI; TL5.30.30HS; FG; SSI
6. Policies, rules, and norms0.026.10.30FG; SSI6.20.70FG; SSI
7. Administration, Operation, and Maintenance0.047.10.02FG; SSI7.70.01FG; SSI7.130.02FG; SSI; O
7.20.15FG; SSI7.80.10FG; SSI7.140.10FG; SSI; O; SI
7.30.01FG; SSI7.90.10FG; SSI; O7.150.10FG; SSI; O; SI
7.40.01FG; SSI7.100.01FG; SSI; O7.160.10FG; SSI
7.50.01FG; SSI7.110.01FG; SSI; O; SI7.170.10FG; SSI
7.60.12FG; SSI7.120.03FG; SSI; O
8. Post-construction support0.018.10.10FG; SSI; O8.20.70FG; SSI; O8.30.20FG; SSI; O
9. Access0.089.10.70FG; SSI; SI; O; SM9.20.30HS; FG; SSI
10. Appropriateness0.1310.10.20O10.30.20FG; SSI; SI; O10.50.20FG; SSI; SI; O
10.20.20FG; SSI; SI; O10.40.20FG; SSI; SI; O
11. Infrastructure0.0911.10.40WM; FG; SSI11.40.10FG; SSI; SI; O11.70.05FG; SSI; SI; O
11.20.10FG; SSI; SI; O11.50.05FG; SSI; SI; O11.80.10FG; SSI; SI; O
11.30.10FG; SSI; SI; O11.60.05FG; SSI; SI; O11.90.05HS; FG; SSI
12. Reliability0.0812.10.40HS; FG; SSI12.30.05HS; FG; SSI12.50.20HS; FG; SSI
12.20.30HS; FG; SSI12.40.05HS; FG; SSI
13. Water quality0.1413.10.80WM13.20.20WM
14. Financial knowledge0.0214.10.20FG; SSI; O14.30.30FG; SSI; O
14.20.30FG; SSI; O14.40.20FG; SSI; O
15. Funding0.0515.10.30FG; SSI; O15.30.05FG; SSI; HS15.50.05FG; SSI; O
15.20.05FG; SSI; O15.40.20FG; SSI; HS15.60.35FG; SSI
16. Risks to service provision0.0916.10.50WM16.30.10SI
16.20.30SI16.40.10HS; O
17. Environmental impact of technology0.0117.10.15WM17.40.10SI; WM17.70.10SI; WM
17.20.10SI; WM17.50.10SI; WM
17.30.40WM17.60.05SI; WM
Notes: Wa: Weight of attribute; Wi: Weight of indicator; Wa and Wi were obtained as explained in 2.2 and in the Supplementary material. HS: Household Survey; FG: Focus Groups; SSI: Semi-structured interviews; TL: Timeline; WM: Water Monitoring; O: Observation; SI: Sanitary Inspection.
Table 2. Assessment of the population characteristics indicator in the study area.
Sustainability IndicatorWeight of Indicator (Wi)Qualitative Value JudgementData Collection MethodBehavior in the Case StudyScore (S)Wi*S
Percentage (%) of people that have completed high school (1.1)0.05The educational level of the community facilitates system functioningHSOnly 12% of SR had a high school or above level of education.10.05
Population growth rate (%) (1.2)0.20Population growth is not a hazard for the system capacity in the short-termTLPopulation growth was 4%, which could be an issue and a pressure factor due to the fragile páramo ecosystem.10.20
Percapita water demand/World Health Organization standard (100 lpcd) [36] (1.3)0.50User water practices are not a hazard for the system capacity in the short-termWMWater demand was 740 lpcd. With increasing population growth (4%) and productive uses of water, water provision could be at risk if water management strategies are not considered.10.50
Percentage (%) of users who have been trained in water, sanitation, and hygiene issues (1.4)0.05Users have been trained in water, sanitation, and hygiene issuesHS0% of SR had received training in water, sanitation, and hygiene issues.10.05
Percentage (%) of users who understand how the system is managed (1.5)0.05Users understand how the system is managedHS52% of SR indicated they understood how the system was managed.30.15
Percentage (%) of Users who understand how the system is operated and maintained (1.6)0.05Users understand how the system is operated and maintainedHS68% of SR indicated they understood how the system was operated and maintained.40.20
Percentage (%) of Users who believe they are able to pay for the water service (1.7)0.1Users believe they are able to pay for the water serviceHS97% of SR indicated they were able to pay for the water service.50.50
( W i * S ) 1.7
Notes: HS: Household Survey; SR: Survey Respondents; TL: Timeline; WM: Water Monitoring.

