Environmental Performance, Customer Satisfaction, and Profitability: A Study among Large U.S. Companies

School of Management, Harbin Institute of Technology, 13 Fayuan Street, Nangang District, Harbin 150001, China
*
Author to whom correspondence should be addressed.
Sustainability 2019, 11(19), 5418; https://0-doi-org.brum.beds.ac.uk/10.3390/su11195418
Submission received: 3 August 2019
/
Revised: 21 September 2019
/
Accepted: 25 September 2019
/
Published: 30 September 2019
(This article belongs to the Section Economic and Business Aspects of Sustainability)
Abstract
:The academic community has been advocating for companies to focus on improving their environmental performance. While companies are increasingly taking environmental action driven mainly by top management commitment, there is interest in understanding whether by contributing to the sustainability of the natural environment companies can gain the satisfaction of their other stakeholders and in a manner that facilitates their competitiveness. With the use of partial least squares structural equation modeling among a sample of large U.S. publicly traded companies, this study investigates the role of customer satisfaction in driving an effect of companies’ environmental performance on their long-term oriented profitability. The results show that customer satisfaction positively affects the long-term oriented profitability of companies. However, customers are generally not satisfied with companies’ environmental performance. An opportunity, therefore, exists for companies to adopt new approaches to their environmental performance that are particularly focused away from reducing the use of environmental resources. An opportunity also exists for guidance to companies on environmental performance measurement metrics that reflect their involvement in the promotion of the sustainability of the natural environment.
1. Introduction
The sustainability of the natural environment and the central role of industry in its attainment continues to occupy the attention of academia. Some scholars suggest that companies have a responsibility to create economic value in a manner that also contributes to societal development [1]. The expectation of companies attaining simultaneous progress on the economic, environment, and social fronts has been gaining prominence since its introduction in the 1900s. Some scholars also suggest that the natural environment should be accorded the status of primary stakeholder by companies not only for moral reasons [2] but also for strategic reasons [3,4]. For in considering the natural environmental as a primary stakeholder, companies’ attention would be directed to giving prominence to the natural resources on which they depend and which have the potential to destroy or alter company infrastructure, resources, and markets [5]. By taking into account the environmental and societal implications of company operations, sustainability decisions can become integral to companies’ decision-making, planning, and customer and supplier relationships [6]. Companies keen on aiding the sustainability of the natural environment will refocus their production processes on reducing resource intensity, redesigning their industrial systems, and rethinking their business models [7,8]. Some companies have displayed their treatment of the natural environment as a primary stakeholder through their environmental leadership. Indeed, managers recognize the central and facilitative role that social and environmental responsibility plays in the long-term financial growth of their companies [9]. The literature shows that companies’ performance is partly determined by their managers’ background characteristics [10] and leadership style [11], including through the development of a reputable company, which has been found to be positively related to the ethical reputations of Chief Executive Officers [12]. The literature also shows that high top management commitment to environmental responsibility allows for greater company responsiveness to institutional pressure [13] and has a positive influence on companies’ corporate social responsibility [14], their environmental strategies [15], and their eco-friendly product development strategies [16].
Notwithstanding the increasing pursuit of companies’ undertaking of environmental management, sometimes through a recognition of a responsibility to society, some scholars suggest that companies have an interest in private returns from doing so [17], and this is the main consideration of companies when deciding on their environmental actions [18]. There is some evidence that by pursuing environmental action companies can earn positive financial returns, at least under certain conditions [19,20]. While there is some evidence that by undertaking environmental action companies can stimulate responses from their (human) stakeholders with effects on their financial performance (e.g., [21]), the literature is silent on whether by focusing on the environmental performance of their environmental actions (that is in satisfying a primary stakeholder—the natural environment) companies can attain market acceptance in a manner that drives competitiveness. Interest lies in determining whether by responding to the natural environment, companies can simultaneously satisfy other primary stakeholders. This study addresses this gap in the literature by investigating the role of customers in facilitating an effect of companies’ environmental performance on their long-term oriented profitability. It, furthermore, examines the role of the industry context of munificence in affecting the impact of companies’ environmental performance on the satisfaction they receive from their customers. An understanding of these is useful for two reasons. First, according to institutional theory, the realization of companies’ strategic goals is subject to factors including stakeholder responses [22,23]. Second, from a supply perspective, there is some evidence that even where managers may have prosocial motivations to improve their environmental responses, they may not be proactive in the absence of market support for doing so [24]. This finding corroborates suggestions, and the evidence, that companies are generally business case-driven when addressing environmental concerns [18,25]. Together, these suggest the appropriateness of understanding whether or not customer satisfaction drives the expected positive influence of companies’ environmental performance on their profitability. Furthermore, it would be useful for managers to understand the industry context that facilitates the receipt of the satisfaction of their customers following their environmental performance. This study focused on industry munificence, given the expectation that companies are more likely to be creative and, therefore, invest in the improvement of their environmental performance in this industry context.
This study singled out the response of customers (as a key stakeholder response) for primarily two reasons. First, customers are among companies’ primary stakeholder groups with the potential to affect their profitability. In fact, it is an expected marketing principle that the performance of companies can be enhanced by satisfying their customers [26]. Second, while studies have investigated the mediating role of customer satisfaction in the link of companies’ environmental management initiatives and their financial performance, none has—to the best of our knowledge—investigated this from the perspective of the environmental performance of companies. This study focused on profitability as a measure of companies’ financial performance as it is established as a key performance metric on which companies tend to focus. Two questions were addressed: Do customers facilitate companies’ profitability resulting from their environmental performance? Does industry munificence affect the relationship between environmental performance and customer satisfaction?
The rest of this paper first proceeds by discussing the extant literature and developing the hypotheses of this study in Section 2. Section 3 describes the methodology of this study and includes a description of the variables used. Section 4 presents the findings of structural equation modeling. We then offer interpretations of our findings in Section 5, before indicating the implications of those for managers in Section 6. In Section 7, we state the limitations of the study and offer suggestions for future study.
2. Literature Review
2.1. Effects of Environmental Performance on Customer Satisfaction
For the purpose of the current discussion and the empirical analysis that follows, we consider customers as not only consumers of goods and services but as members of society and as one primary stakeholder group of companies [27]. Consequently, we consider that customers engage with companies as influencers of their strategic orientations. In this sense, we reflect the evidence that customers are increasingly placing attention on corporate social responsibility [28,29], and on environmental management in particular [21]. Furthermore, we reflect the evidence that needs and values tend to drive customer satisfaction [30,31]. We, therefore, conceptualize customer satisfaction as based on customers’ total purchase and consumption experience with a company’s goods or services over time [32]. It is considered the benefit afforded to a company by a customer who perceives that his expectations have been met [33]. Customers tend to confer their satisfaction on the basis of perceptions of the value they receive [34], on the actual performance of companies [35], and on disconfirmation [36] (that is, the discrepancy between expectations of companies and perceptions of companies’ actual performance). Given some evidence of a positive association between the environmental management of companies and the satisfaction they receive from their customers [21], and increasing calls for companies to align their environmental initiatives to attaining a positive impact on the sustainability of the natural environment, we suggest that customer satisfaction is also associated with the improved environmental performance of companies. We specifically explain this below.
First, environmental management is a mechanism by which a company presents its image as a responsible company, and it is also one basis on which customers identify with companies [37]. Generally, people tend to support institutions that represent their identities [38]. Therefore, customers that identify with companies are more likely to be satisfied with the goods and services of those companies [37,39]. Second, when companies engage in societal development and repair, their customers will also have an opportunity to aid societal development and repair by virtue of their association with those companies. This opportunity is more likely to lead to customers feeling more satisfied with the goods and services of companies. Furthermore, the customer (being multidimensional in needs of association with companies) is likely to feel perceived quality and perceived value from companies that aid broader societal development, and environmental sustainability in particular. These will tend to lead to greater customer satisfaction [40,41] and loyalty [42]. We suggest, furthermore, that given that companies’ environmental performance reflects the success of their environmental management initiatives, by improving their environmental performance companies will be better able to enhance confidence among customers in their environmental management initiatives. We expect that such confidence will drive greater identification and the desirability for the goods and services of companies as perceptions of value and expectations are met. Therefore, it is proposed that:
Hypothesis 1 (H1).
Environmental performance is positively associated with customer satisfaction.
2.2. Effects of Customer Satisfaction on Profitability
Stakeholder theory [43] (in a sense) predicts that as companies satisfy their stakeholders’ demands, they can earn positive returns on their financial performance. We expect that satisfied customers can drive the profitability of companies. Extant literature has explained this by the mechanisms of customer retention, customer loyalty, and usage behavior [36,40,44]. Customer loyalty is expressed in several ways. First, loyal customers are expected to express a preference for a company over other companies in the evidence of repeat purchases [40,45,46], and by increasing business with the company in the future [47]. Second, when companies have long-time customers, they can implement price premia for their goods or services [48], as customers tend to value their relationship with companies [47] and become willing to pay more to companies, especially at high levels of customer satisfaction [49]. Third, satisfied customers tend to recommend the company to others [48], thereby opening an opportunity for new sources of revenue and, therefore, enhanced revenue to companies.
Where companies are able to retain customers, they will be able to secure their future revenues [44,50], including through an ability to increase their prices, given that loyal customers are found to be less price-sensitive [51]. At the same time, those companies will be able to lower their operating costs as loyal customers are less costly to finance (maintain). For instance, the promotional costs incurred by companies are expected to be lower as companies expend less effort in convincing loyal customers. Together, increased sales and reduced costs of operating can allow companies to benefit from improved profitability. Indeed, there is some empirical evidence of a positive association between customer satisfaction and the profitability of companies [51,52]. We suggest that repeat purchases, willingness to pay price premia, and promotion of companies can have enduring effects on the ability of companies to be profitable. Therefore, it is proposed that:
Hypothesis 2 (H2).
Customer satisfaction is positively associated with profitability.
2.3. Moderating Effect of Industry Munificence
The literature has made a distinction between objective industry munificence and perceived munificence; where perceived industry munificence relates to managers’ conception of the industry context [53]. This study is concerned with objective munificence, which reflects the actual context of the industry irrespective of managers’ perceptions. Industry munificence has been characterized in two ways. First, it has been described as the abundance of resources as needed by companies and which is supportive of growth [53]. Second, it has been described by low to moderate competition among companies in a given industry [54]. We expect that where competition among companies is low or moderate, the opportunity for company creativity and differentiation becomes attractive, as companies would not necessarily be constrained into competing only on prices. Therefore, it is reasonable to think that where industry munificence exists, companies have the opportunity to gain the satisfaction of their customers by appealing to their needs and values. We expect, furthermore, that the opportunities for creativity and differentiation inherent to industry munificence will facilitate companies investing in the improvement of their environmental performance towards meeting the needs of their customers.
We expect that the abundance of resources available for company and industry growth (as is inherent to industry munificence, for instance, governmental support for environmental management [55]) will make the task of improving environmental performance more attractive to companies. That is, companies constrained by the lack of wherewithal to invest in environmental management initiatives will become proactive in the undertaking of environmental management initiatives. In fact, there is some evidence of industry munificence affecting the environmental management of companies [56,57]. There is also some evidence that in a highly munificent industry context, companies are likely to convert environmental management to environmental performance [58]. As suggested in the previous section, an improvement in the environmental performance of companies will be rewarded with customer satisfaction. Therefore, it is proposed that:
Hypothesis 3 (H3).
Environmental performance has a stronger effect on customer satisfaction in the context of industry munificence.
3. Methodology
This study used a sample of publicly traded U.S.-based companies that were assigned green rankings by Newsweek (www.newsweek.com). Newsweek allows the general public to access information on environmentally friendly companies and has developed a reputation for its indication of the environmental performance of companies. The Newsweek ratings are developed in collaboration with Corporate Knights Capital and HIP Investor (Human Impact + Profit), with data from Bloomberg’s Professional Service and CDP (www.cdp.net). The rankings are based on assessments of the largest (by market capitalization) publicly traded companies in the U.S. (for the U.S. 500 ranking) and in the world (for the global 500 ranking). Apart from the evidence of the Newsweek-assessed sample companies being used in extant research [59], the reputation of the Newsweek green rankings and its public access (media popularity) make this source suitable for the current study in identifying customer satisfaction with companies’ environmental performance. Newsweek ranks companies on objectively defined metrics that indicate companies’ environmental performance in areas of energy, carbon release, water use, and waste production, and also on their use of environmental initiatives—including the existence of a pay link and a sustainability-themed committee. One aspect of the assessment of these is also done relative to that of peers’ in the same sector in order to ensure that companies in environmentally sensitive sectors are not scored poorly on account of being in such a sector. This study started with a population of 500 U.S.-based companies (the total population) assessed by Newsweek in each of the study years. In step one, it then removed companies from the sample that had either no customer satisfaction scores (as provided by the American Customer Satisfaction Index –ACSI) or financial data on the variables of this study, as provided by COMPUSTAT (accessed from Wharton Research Data Services. “Compustat Annual updates” wrds.wharton.upenn.edu). Then, additional companies were removed if they did not have simultaneous data across variables of interest (environmental performance, customer satisfaction, and financial performance) in each of the study years (2013–2015). The final sample of this study amounted to 276 observations (92 companies x 3 years). This sample size meets the requirement of at least 59 observations for achieving a statistical power of 80% [60], and the requirement of observations being ten times the number of predictors [61]. In this study, all independent variables were observed over the years 2013–2015. These years represent an interesting period in U.S. history following the enactment of the 2009 fiscal stimulus package that had a component aimed at improving the existence and the use of clean energy in the U.S. This study used three years of data according to a “rule of thumb” to building confidence in the results, but not extending the time series data much in avoidance of a risk of large amounts of missing data.
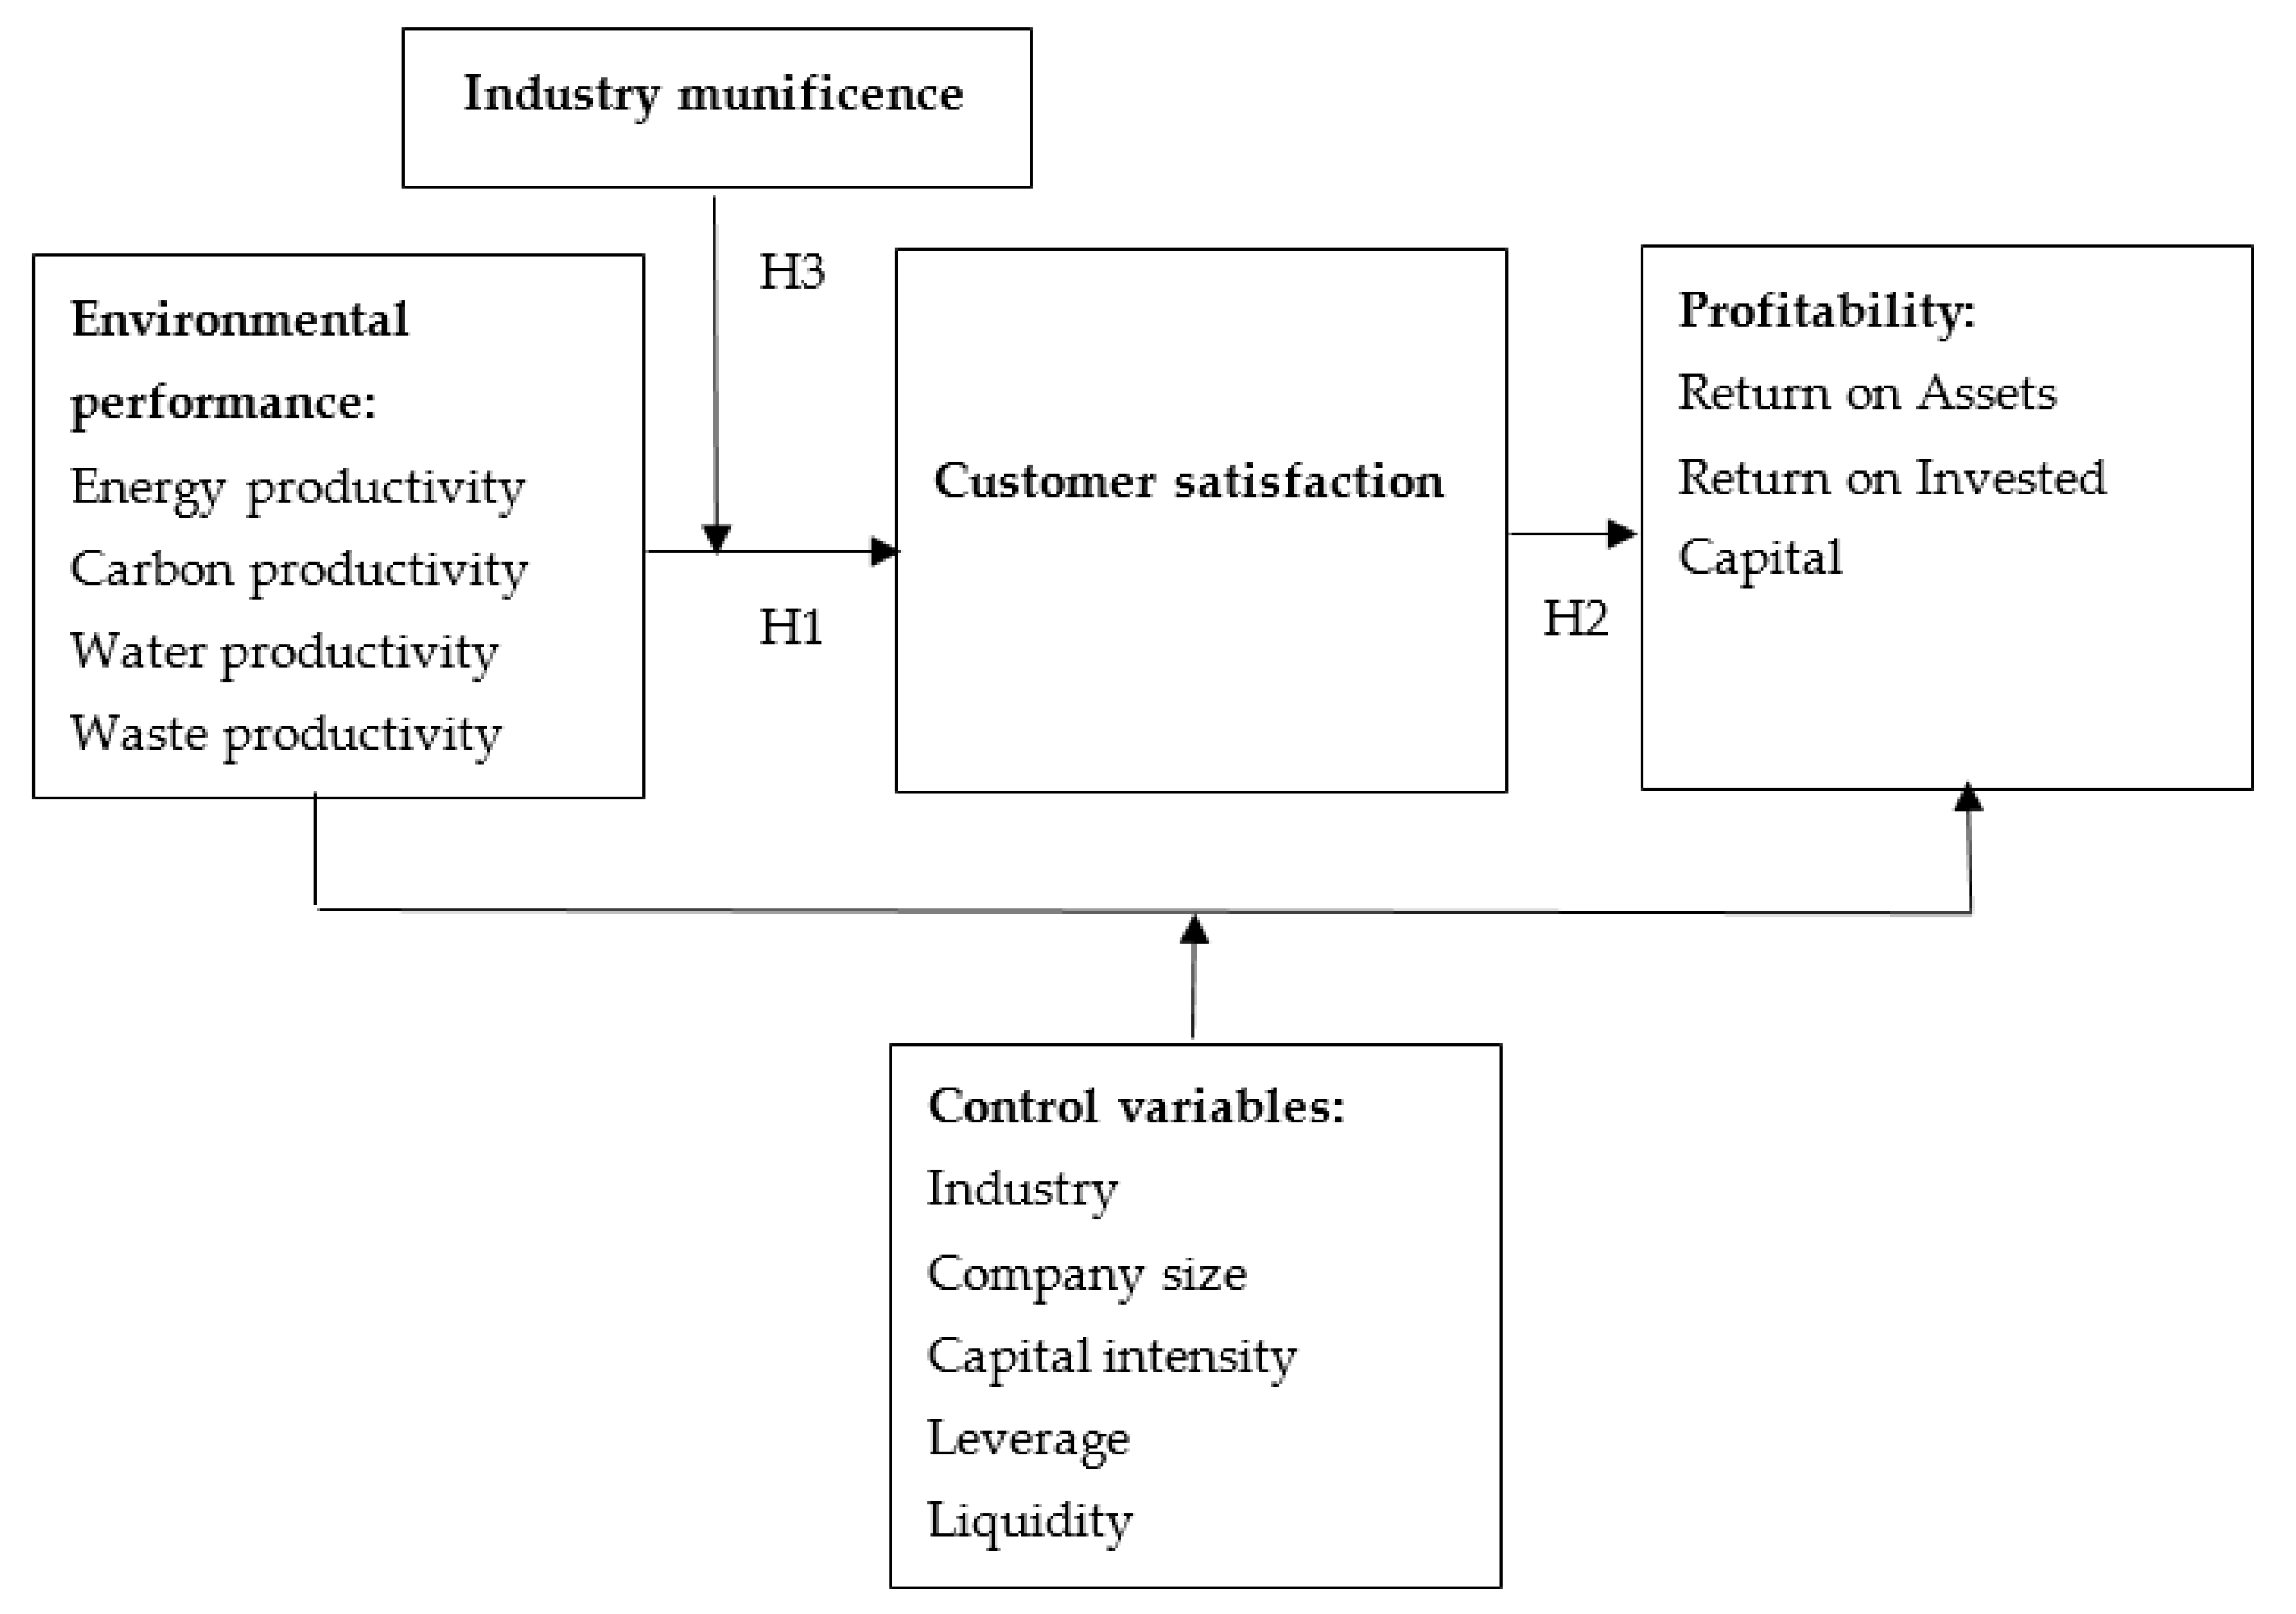
The research model of this study (based on the discussion of hypotheses previously presented) is shown in Figure 1. Figure 1 establishes customer satisfaction as a facilitator of companies’ environmental performance affecting their long-term orientated profitability. It also establishes that the strength of the effect of environmental performance on customer satisfaction will vary by the degree of objective industry munificence. Given the sample size of this study, partial least squares structural equation modeling (PLS-SEM) was used. This technique is being increasingly adopted in business and social sciences research, and it appears as a novelty when non-survey data are not used in sustainability research (for instance [62]). This model was also selected for this study given its ability to combine multiple indicators and therefore, avoid a fragmented assessment that would result in using either pooled ordinary least squares (OLS) or panel data techniques. The original sample of this study had few instances of missing values. Therefore, a missing completely at random test (MCAR) was conducted. Results of this test showed that the few absent data points were missing completely at random (χ2 = 14.024, degrees of freedom = 14, p = 0.448). Consequently, the absent data points were filled by multiple imputation under five iterations. After having filled in the missing data points, a normality check of the data was performed. There were instances of the existence of excess skewness and kurtosis. The presence of non-normal data underscores the importance and appropriateness of hypothesis testing by SmartPLS as developed by SmartPLS GmbH, Boenningstedt, Germany. This variance-based approach to structural equation modeling does not require that normality of data distributions be achieved.
3.1. Dependent Variable
Various measures of companies’ financial performance appear in the literature. In this study, financial ratios were used to reflect companies’ performance relative to the market. First, factor analysis was undertaken with several ratios (return on assets, return on invested capital, return on equity, gross margin, and profit margin) that reflect the profitability of companies and are popularly used in extant literature. Latent constructs that have been used in extant research were also examined. Based on the results of a factor analysis undertaken, in this study, the return on assets (ROA) and the return on invested capital (ROIC) were used to represent profitability. Given the evidence of a delay effect associated with companies’ environmental performance being translated to their financial performance [59], the indicators of companies’ profitability were measured over the years 2014–2016. These years represent a delay of one year after the observation of the environmental performance of companies. Table 1 details all variables used in this study.
3.2. Independent Variables
The first independent variable of this study is the environmental performance of companies. This was measured from data obtained from Newsweek’s green rankings. The Newsweek green rankings have featured in studies investigating the environmental performance of companies [59,63], and were selected as suitable for use in this study given their media popularity. Specifically, four items of companies’ environmental performance were measured in this study: energy productivity, carbon productivity, water productivity, and the waste productivity of companies. Newsweek provides scores for each of these in the range 0 to 100.
Another independent variable is customer satisfaction. Extant literature has popularly used the customer satisfaction index, as developed by the American Customer Satisfaction Index LLC, as a measure of customer satisfaction (e.g., [64]). This benchmark index is a latent construct that is based on data obtained directly from surveys among consumers. It is the weighted average of three questions, in categories of expectations, perceived quality, and perceived value. The final score assigned to a company will have value in the range of 0 to 100. In this study, the American Customer Satisfaction Index was used as a single-item construct.
3.3. Moderate Variable
The moderate variable of this study reflects objective industry munificence. Similar to [56], this is reflected as the industry growth rate. In order to construct the industry munificence variable, the five-year average growth rate of each industry represented in the sample was determined. Consistent with the procedure recommended by [65], the average growth rate of industry sales was calculated in a two-step procedure. We used three batches of years: 2009–2013, 2010–2014, and 2011–2015 in order to fit the multi-year nature of the data of this study. First, we regressed the natural logarithm of the net total industry sales on an indicator of time—the independent variable of this regression model. Then, we calculated the antilog of the regression coefficient. This was used to reflect the growth rate of sales and industry munificence [56]. Net sales were identified at the two-digit level of the standard industrial classification code.
3.4. Control Variables
While this study is concerned with the effect of companies’ environmental performance on their financial performance, it can be expected that companies that are more profitable could be more likely to improve their environmental performance. In avoidance of an endogeneity problem, control variables were included in the model; as the introduction of control variables is helpful in correcting endogeneity problems in structural equation modeling [66]. Control variables were selected on the basis of their ability to affect the financial performance of companies. Extant studies have shown diversity in control variables. This notwithstanding, popular control variables are company size, leverage, research and development intensity, capital intensity, sales/turnover, industry (where a multi-industry sample is used), and to a lesser extent liquidity. It was observed that the data on research and development expenses of the sample companies had many gaps. A decision was made to exclude this variable rather than fill in the missing data points or delete company observations. It is expected that larger companies can generate higher profitability than smaller counterparts, and therefore, company size was included in the model with the expectation of a positive association with company performance. In this study, company size is represented by the net sales of a given company. It is also expected that companies with greater leverage will be better able to facilitate greater profitability than companies with lower leverage. This is so because greater leverage can allow companies the opportunity to make investments to either influence their cost of production or to introduce goods and services that may command higher prices and returns. Therefore, leverage was included as a single-item control variable. It is expected that greater capital intensity will have a positive effect on company profitability. Therefore, capital intensity was included as an additional control variable. The industry to which a company belongs was also included a as control variable, recognizing the disparity in the ability of sectors to generate profitability [59]. Liquidity was additionally included in the model as a control variable.
4. Results
4.1. Summary Statistics
Table 2 describes the summary statistics of the variables used in this study. Table 3 shows negative and significant correlations (p < 0.05) between two indicators (energy productivity and carbon productivity) of environmental performance and our measure of customer satisfaction. It, furthermore, shows that the associations between the other two indicators of environmental performance (water productivity and waste productivity) and customer satisfaction are nonsignificant. The Pearson correlation coefficients, however, show positive associations between our measure of customer satisfaction and profitability (significant for return on assets). Table 3 also shows negative and significant correlations between our measures of environmental performance and our measure of industry munificence. We determined the variance inflation factors (VIFs) of our variables by regressions. We found an average VIF of 2.04 and a maximum of 3.71. Given that all VIFs are below the threshold of 10, we can conclude that there is no possibility of multicollinearity among the variables used.
4.2. Assessment of the Measurement Model
A measurement model was assessed to determine the validity of indicators and constructs, by the use of SmartPLS3. SmartPls makes use of principal components analysis [61]. Table 4 shows the composite reliability and average variance extracted values. All of the composite reliability scores and the average variance extracted (AVE) exceeded the “rules of thumb” of 0.7 and 0.5, respectively. Therefore, together, these showed that the constructs for environmental performance and for profitability could be accepted for internal consistency. Table 4 also shows the Fornell–Larcker criterion. Indications of the square root of AVEs exceeding their respective correlation coefficients indicate that the constructs achieved discriminant validity. Therefore, it could be concluded that the constructs of environmental performance and profitability were valid for use in this study. Having obtained these satisfactory results, we proceeded to assess the structural model.
4.3. Structural Model Assessment
The results of the assessment of the structural model are displayed in Table 5. These results are based on bootstrapping with 5000 subsamples with replacement. The results show that by increasing their environmental performance, companies tend to drive reductions in customer satisfaction (standardized beta = –0.182, p = 0.016). This finding is in contradiction to our Hypothesis 1. However, we found that customer satisfaction has a positive effect on companies’ long-term oriented profitability (standardized beta = 0.084; p = 0.093). Therefore, Hypothesis 2 is supported. This finding highlights the importance of customer satisfaction (a concept suggested in the literature as not having enduring effects) for the attainment of a positive long-term profitability orientation. This finding, furthermore, confirms that customers are important stakeholders for the survival of companies. We proceeded to determine the existence of a mediation effect by using the procedures suggested by [67]. We maintained the number of bootstrapping samples at 5000 and set the confidence interval at 95%. We found an indirect effect of −0.015 and a 95% confidence interval with no zero (−0.019 to −0.013). This finding further demonstrates an important role of the satisfaction of customers in translating companies’ environmental performance to their long-term oriented profitability.
Unexpectedly, the results do not show a significant moderating effect of industry munificence on the relationship between environmental performance and customer satisfaction. Therefore, Hypothesis 3 is not supported. In Section 5, these findings are interpreted.
5. Discussion
5.1. Effect of Environmental Performance on Customer Satisfaction
The results of the assessment of the measurement model reveal an interesting insight on customer behavior in relation to companies’ interaction with the natural environment. The finding of a significant association between companies’ environmental performance and the satisfaction they receive from their customers indicates that the performance of companies’ environmental actions defines the quality and value perceptions of their customers. This finding also reveals that customers are not only concerned with companies undertaking environmental initiatives as some evidence shows [21], but are also interested in the environmental performance of those initiatives. More so, this finding shows that customers are interested in companies giving prominence to the wellbeing of the natural environment. However, the finding of a negative association between companies’ environmental performance and the satisfaction they receive from their customers suggests that customers’ expectations of companies’ interaction with the natural environment are not being met. This result should be interpreted in the context of the measure of environmental performance used in this study, which is defined by companies’ use of (or focus on) fewer environmental resources in the generation of revenue. This considered, the results of this study seem to indicate that this approach to measuring companies’ environmental performance does not inspire improved customer satisfaction. This finding is consistent with the general seeming disapproval (especially among the academic community) with companies’ current environmental activities [68]. Haffar and Searcy [69], for instance, suggested that companies need to enhance their environmental performance in a manner that drives positive impacts on the sustainability of the natural environment, that is, those that focus on company impact relative to that which is required of it in promotion of the sustainability of the natural environment. In this regard, Braungart et al. [70] suggested that companies need to conceptualize their production processes away from a focus on reducing the use of environmental resources in their production processes, to the use of these more effectively with a goal of generating zero waste, that is, the concept of eco-effectiveness. [8] suggest that a system design approach is required, which entails companies not only maintaining value with environmental resource input reduction, but also making use of 90% of the discarded extracted materials, reusing materials, refurbishing and reusing long-lasting components, and mimicking and nurturing environmental niches.
5.2. Effect of Customer Satisfaction on Long-Run Profitability
The finding of a positive relationship between customer satisfaction and company profitability is consistent with the findings of extant research [51,52]. This finding of a positive association between customer satisfaction and the long-term oriented profitability of companies (in a sense) supports stakeholder theory, which suggests that as companies satisfy their stakeholders’ demands they can reap rewards from doing so. By focusing on long-term oriented profitability, this study adds the evidence that the effects of customer satisfaction on profitability can be, and are, enduring. The results show that this effect is observed for at least one year after customer satisfaction is registered. This is an interesting finding from the perspective that customer satisfaction has been generally conceptualized as a short-term occurrence. This study conceptualized customers as having multi-faceted needs that extend beyond the consumption of goods and services. The results of this study, therefore, suggest that it is by appealing to the multifaceted needs of customers that companies will be able to sustain their profitability in the long-term.
5.3. Moderating Effect of Industry Munificence
The unsupported Hypothesis 3 indicates that whether or not the resources for improving environmental performance exist, whether or not an environment facilitative of industry growth exists, and whether or not competition among companies is low or fierce, customers are dissatisfied with companies’ current approach (at least measured as environmental resource use relative to revenue earned) to the involvement in the promotion of the sustainability of the natural environment. This finding, somewhat, runs contrary to that of [58]. The results of this study suggest that customers expect (whether or not the market conditions facilitate it) a different dimension of environmental performance from companies. This finding, therefore, somewhat strengthens the finding of this study that the approach to environmental performance, which measures environmental resource use relative to company earnings, does not generally match the expectations of customers.
6. Conclusions and Implications
Against the background of companies being encouraged to enhance the sustainability of the natural environment, this study was developed to understand the extent to which customers translate the effect of companies’ environmental performance on their profitability in the long-term. It, furthermore, set out to understand the role that industry munificence (that which is characterized by opportunities for industry growth, availability of the resources for stimulating that growth, and low to moderate competition) plays in affecting the satisfaction companies obtain from their customers in response to improvements in their environmental performance. It suggested that the environmental performance of companies provides a benefit to their customers who are not only consumers of goods and services, but are interested in companies improving their environmental performance (and providing a positive service to the natural environment). In this regard, this paper suggests that companies will have an additional incentive to enhance the sustainability of the natural environment. This paper, furthermore, suggests that in that circumstance, the customer will be willing to provide the environment for companies to profit in the long-term from their investments in improving their environmental performance. The enabling environment created by customers could take several forms including the willingness to pay price premia and the promotion of a given company.
The findings of a large meta-analysis undertaken by [71] suggest that the translation of the environmental performance of companies to their financial performance can be positive where market support for improved environmental performance exists. The findings of the current study indicate that, at present, a key stakeholder group (customers) is not generally satisfied with the environmental performance companies are registering (at least when measured as environmental resource use relative to their revenue). This notwithstanding, customer satisfaction is a key predictor of the long-term profitability of companies. These findings, therefore, emphasize the importance of customer satisfaction for profitability. The results of this study, furthermore, imply that managers have an opportunity to enhance their long-term oriented profitability by responding to the multifaceted demands of their customers. Specifically, the environmental performance that is focused on reducing the use of environmental resources relative to revenue earned does not inspire customer satisfaction among companies. Managers may wish to, therefore, amend their current approaches to driving environmental performance. Sustainability management scholars have been suggesting that a better strategy for the natural environment is through committing to process changes that extend beyond mere reductions in the use of environmental resources. Recycling and remanufacturing are two key production directions companies may wish to follow in this regard. Ultimately, it is predicted that a closed-loop material flow can be helpful in improving the environmental performance of companies, and to the sustainability of the natural environment.
This study makes two primary contributions. First, it extends the investigations that have focused on providing an understanding of the means by which companies’ environmental performance affects their financial performance. The stakeholder response of customer satisfaction is introduced to the current debate. In doing so, this study provides useful guidance to companies that have generally been found to be business-driven when undertaking environmental actions, and that consider their customers as a key stakeholder group and with the potential to affect their profitability. Second, this study clarifies the customer desirability of a popularly used measure of company environmental performance: environmental resource productivity. The evidence of this study shows that in consideration of the importance of customer satisfaction for long-term oriented profitability, there is a need for the adoption of environmental performance that is proactive in nature. That is, environmental performance that is focused away from reducing the use of environmental resources in the production process. There is also an opportunity for greater guidance to industry in terms of measurement metrics that will adequately reflect their involvement in contributing to the sustainability of the natural environment.
7. Limitations and Future Study
We acknowledge the limitations of this study. First, this study is set among large U.S.-based companies. The findings of this study may, therefore, not be generalizable to small companies. Researchers may, therefore, wish to replicate this study among smaller companies. It is an interesting extension of this study to understand whether customers ascribe higher expectations in terms of the environmental performance of large companies just because, for instance, they are perceived as having the capability to adequately support the sustainability of the natural environment through improving their own environmental performance. Second, companies have a multiplicity of stakeholders. This study considered the role of one stakeholder group in driving the effect of environmental performance on long-term profitability. Managers may be interested in understanding how other stakeholders respond to companies’ environmental performance and the impact of that reaction on the survival of companies. Furthermore, whether the current approach to companies’ environmental performance is a factor of embedded practice and because this measure is popularly and currently being promoted, or whether it is the result of companies attempting to satisfy competing expectations of their various stakeholders is of interest. Therefore, an extension of this study to include a focus on other stakeholder groups could be undertaken. Finally, the literature has identified other industry contexts that may affect the profitability of companies. This study had an exclusive focus on munificence. Future studies may wish to examine the moderating roles of a dynamic and complex industry context.
Author Contributions
Conceptualization, T.R.D.M. and Y.Z; data curation, T.R.D.M.; formal analysis, T.R.D.M.; investigation, T.R.D.M.; methodology, T.R.D.M.; supervision, Y.Z; validation, T.R.D.M.; visualization, T.R.D.M.; writing—original draft preparation, T.R.D.M.; writing—review and editing, T.R.D.M. and Y.Z.
Funding
This research received no external funding.
Conflicts of Interest
The authors declare no conflict of interest.
References
- Porter, M.E.; Kramer, M.R. Creating Shared Value: How to reinvent capitalism and unleash a new wave of innovation and growth. Harv. Bus. Rev. 2011, 1–17. [Google Scholar]
- Laine, M. The Nature of Nature as a Stakeholder. J. Bus. Ethics 2010, 96, 73–78. [Google Scholar] [CrossRef]
- Driscoll, C.; Starik, M. The Primordial Stakeholder: Advancing the Conceptual Consideration of Stakeholder Status for the Natural Environment. J. Bus. Ethics 2004, 49, 55–73. [Google Scholar] [CrossRef]
- Haigh, N.; Griffiths, A. The Natural Environment as a Primary Stakeholder: The Case of Climate Change. Bus. Strategy Environ. 2009, 18, 347–359. [Google Scholar] [CrossRef]
- Starik, M. Should Trees Have Managerial Standing? Toward Stakeholder Status for Non-Human Nature. J. Bus. Ethics 1995, 14, 207–217. [Google Scholar] [CrossRef]
- Demartini, M.; Orlandi, I.; Tonelli, F.; Anguitta, D. A Manufacturing Value Modeling Methodology (MVMM): A Value Mapping and Assessment Framework for Sustainable Manufacturing. Smart Innov. Syst. Technol. 2017, 68, 98–108. [Google Scholar]
- Demartini, M.; Pinna, C.; Aliakbarian, B.; Tonelli, F.; Terzi, S. Soft drink supply chain sustainability: A case based approach to identify and explain best practices and key performance indicators. Sustainability 2018, 10, 3540. [Google Scholar] [CrossRef]
- Tonelli, F.; Evans, S.; Taticchi, P. Industrial sustainability: Challenges, perspectives, actions. Int. J. Bus. Innov. Res. 2013, 7, 143–163. [Google Scholar] [CrossRef]
- Jang, Y.J.; Zheng, T.; Bossleman, R. Top managers’ environmental values, leadership, and stakeholder engagement in promoting environmental sustainability in the restaurant industry. Int. J. Hosp. Manag. 2017, 63, 101–111. [Google Scholar] [CrossRef]
- Hambrick, D.C.; Mason, P.A. Upper Echelons: The Organization as a Reflection of Its Top Managers. Acad. Manag. Rev. 1984, 9, 193–206. [Google Scholar] [CrossRef]
- De Hoogh, A.H.B.; Den Hartog, D.N. Ethical and despotic leadership, relationships with leader’s social responsibility, top management team effectiveness and subordinates’ optimism: A multi-method study. Leadersh. Q. 2008, 19, 297–311. [Google Scholar] [CrossRef]
- Reputation Institute. Reputation and CEO RepTrak; Reputation Institute: Cambridge, MA, USA, 2018. [Google Scholar]
- Colwell, S.R.; Joshi, A.W. Corporate Ecological Responsiveness: Antecedent Effects of Institutional Pressure and Top Management Commitment and Their Impact on Organizational Performance. Bus. Strategy Environ. 2013, 22, 73–91. [Google Scholar] [CrossRef]
- Mahenthiran, S.; Tong, J.T.; Terpstra, R.; Rachagan, S. Impact of executive citizenship and organizational commitment on corporate social responsibility. Soc. Responsib. J. 2015, 11, 387–402. [Google Scholar] [CrossRef]
- Banerjee, S.B.; Iyer, E.S.; Kashyap, R.K. Corporate Environmentalism: Antecedents and Influence of Industry Type. J. Mark. 2003, 67, 106–122. [Google Scholar] [CrossRef]
- Katsikeas, C.S.; Leonidou, C.N.; Zeriti, A. Eco-friendly product development strategy: Antecedents, outcomes, and contingent effects. J. Acad. Mark. Sci. 2016, 44, 660–684. [Google Scholar] [CrossRef]
- Mazzi, A.; Toniolo, S.; Manzardo, A.; Ren, J.; Scipioni, A. Exploring the Direction on the Environmental and Business Performance Relationship at the Firm Level. Lessons from a Literature Review. Sustainability 2016, 8, 1200. [Google Scholar] [CrossRef]
- Karnani, A. “Doing Well by Doing Good”: The Grand Illusion. Calif. Manag. Rev. 2011, 53, 69–86. [Google Scholar] [CrossRef]
- Hang, M.; Geyer-Klingeberg, J.; Rathgeber, A.M. It is merely a matter of time: A meta-analysis of the causality between environmental performance and financial performance. Bus. Strategy Environ. 2018, 28, 257–273. [Google Scholar] [CrossRef]
- Horváthová, E. Does environmental performance affect financial performance? A meta-analysis. Ecol. Econ. 2010, 70, 52–59. [Google Scholar] [CrossRef]
- Kassinis, G.I.; Soteriou, A.C. Greening the Service Profit Chain: The Impact of Environmental Management Practices. Prod. Oper. Manag. 2010, 12, 386–403. [Google Scholar] [CrossRef]
- DiMaggio, P.J.; Powell, W.W. The Iron Cage Revisited: Institutional Isomorphism and Collective Rationality in Organizational Fields. Am. Sociol. Rev. 1983, 48, 147–160. [Google Scholar] [CrossRef]
- Feng, T.; Wang, D. The Influence of Environmental Management Systems on Financial Performance: A Moderated-Mediation Analysis. J. Bus. Ethics 2016, 135, 265–278. [Google Scholar] [CrossRef]
- Bendell, B.L. I don’t Want to be Green: Prosocial Motivation Effects on Firm Environmental Innovation Rejection Decisions. J. Bus. Ethics 2017, 143, 277–288. [Google Scholar] [CrossRef]
- Landrum, N.E.; Ohsowski, B. Identifying Worldviews on Corporate Sustainability: A Content Analysis of Corporate Sustainability Reports. Bus. Strategy Environ. 2018, 27, 128–151. [Google Scholar] [CrossRef]
- Yeung, C.H.; Ennew, C.T. Measuring the impact of customer satisfaction on profitability: A sectoral analysis. J. Target. Meas. Anal. Mark. 2001, 10, 106–116. [Google Scholar] [CrossRef] [Green Version]
- Daub, C.-H.; Ergenzinger, R. Enabling sustainable management through a new multi-disciplinary concept of customer satisfaction. Eur. J. Mark. 2005, 39, 998–1012. [Google Scholar] [CrossRef]
- Farah, M.F.; Newman, A.J. Exploring consumer boycott intelligence using a socio-cognitive approach. J. Bus. Res. 2010, 63, 347–355. [Google Scholar] [CrossRef]
- Lamberti, L.; Lettieri, E. CSR Practices and Corporate Strategy: Evidence from a Longitudinal Case Study. J. Bus. Ethics 2009, 87, 153–168. [Google Scholar] [CrossRef]
- Hur, W.-M.; Kim, Y.; Park, K. Assessing the Effects of Perceived Value and Satisfaction on Customer Loyalty: A ‘Green’ Perspective. Corp. Soc. Responsib. Environ. Manag. 2013, 20, 146–156. [Google Scholar] [CrossRef]
- Schneider, B.; Bowen, D.E. Understanding Customer Delight and Outrage. Sloan Manag. Rev. 1999, 41, 35–45. [Google Scholar] [CrossRef]
- Anderson, E.W.; Fornell, C.; Mazvancheryl, S.K. Customer satisfaction and shareholder value. J. Mark. 2004, 68, 172–185. [Google Scholar] [CrossRef]
- Oliver, R.L. A Cognitive Model of the Antecedents and Consequences of Satisfaction Decisions. J. Mark. Res. 1980, 17, 460–469. [Google Scholar] [CrossRef]
- Mulki, J.P.; Jaramillo, F. Ethical reputation and value received: Customer perceptions. Int. J. Bank Mark. 2011, 29, 358–372. [Google Scholar] [CrossRef]
- Burton, S.; Sheather, S.; Roberts, J. Reality or Perception? The Effect of Actual and Perceived Performance on Satisfaction and Behavioral Intention. J. Serv. Res. 2003, 5, 292–302. [Google Scholar] [CrossRef]
- Bolton, R.N.; Drew, J.H. A multistage model of customers’ assessments of service quality and value. J. Consum. Res. 1991, 17, 375–384. [Google Scholar] [CrossRef]
- Luo, X.; Bhattacharya, C.B. Corporate social responsibility, customer satisfaction, and market value. J. Mark. 2006, 70, 1–18. [Google Scholar] [CrossRef]
- Ashforth, B.E.; Mael, F. Social Identity Theory and the Organization. Acad. Manag. Rev. 1989, 14, 20–39. [Google Scholar] [CrossRef]
- Bhattacharya, C.B.; Rao, H.; Glynn, M.A. Understanding the bond of identification: An investigation of its correlates among art museum members. J. Mark. 1995, 59, 46–57. [Google Scholar] [CrossRef]
- Anderson, E.W.; Sullivan, M.W. The antecedents and consequences of customer satisfaction for firms. Mark. Sci. 1993, 12, 125–143. [Google Scholar] [CrossRef]
- Mithas, S.; Krishnan, M.S.; Fornell, C. Why do customer relationship management applications affect customer satisfaction? J. Mark. 2005, 69, 201–209. [Google Scholar] [CrossRef]
- Mustonen, N.; Karajaluoto, H.; Jayawardhena, C. Customer environmental values and their contribution to loyalty in industrial markets. Bus. Strategy Environ. 2016, 25, 512–528. [Google Scholar] [CrossRef]
- Freeman, R.E. Strategic Management: A Stakeholder Approach; Pitman Publishing Inc.: Marshfield, MA, USA, 1984; pp. 1–276. [Google Scholar]
- Fornell, C. A National Customer Satisfaction Barometer: The Swedish Experience. J. Mark. 1992, 56, 6–21. [Google Scholar] [CrossRef]
- Bolton, R.N.; Kannan, P.K.; Bramlett, M.D. Implications of loyalty program membership and service experiences for customer retention and value. J. Acad. Mark. Sci. 2000, 28, 95–108. [Google Scholar] [CrossRef]
- Srivastava, R.K.; Shervani, T.A.; Fahey, L. Market-Based Assets and Shareholder Value: A Framework for Analysis. J. Mark. 1998, 62, 2–18. [Google Scholar] [CrossRef] [Green Version]
- Zeithaml, V.A.; Berry, L.L.; Parasuraman, A. The behavioral consequences of service quality. J. Mark. 1996, 60, 31–46. [Google Scholar] [CrossRef]
- Reichheld, F.F.; Sasser, W.E., Jr. Zero defections: Quality comes to services. Harv. Bus. Rev. 2009, 68, 105–111. [Google Scholar]
- Homburg, C.; Koschate, N.; Hoyer, W.D. Do Satisfied Customers Really Pay More? A Study of the Relationship between Customer Satisfaction and Willingness to Pay. J. Mark. 2005, 69, 84–96. [Google Scholar] [CrossRef]
- Rust, R.R.; Zahorik, A.J. Customer Satisfaction, Customer Retention, and Market Share. J. Retail. 1993, 69, 193–215. [Google Scholar] [CrossRef]
- Yeung, C.H.; Ennew, C.T. From customer satisfaction to profitability. J. Strategy Mark. 2000, 8, 313–326. [Google Scholar] [CrossRef]
- Chi, C.G.; Gursoy, D. Employee satisfaction, customer satisfaction, and financial performance: An empirical examination. Int. J. Hosp. Manag. 2009, 28, 245–253. [Google Scholar] [CrossRef]
- Tang, Z.; Kreiser, P.M.; Marino, L.; Weaver, K.M. Exploring proactiveness as a moderator in the process of perceiving industrial munificence: A field study of SMEs in four countries. J. Small Bus. Manag. 2010, 48, 97–118. [Google Scholar] [CrossRef]
- Dess, G.G.; Beard, D.W. Dimensions of organizational task environments. Adm. Sci. Q. 1984, 29, 52–73. [Google Scholar] [CrossRef]
- Aragon-Correa, J.A.; Sharma, S. A contingent resource-based view of proactive environmental strategy. Acad. Manag. Rev. 2003, 28, 71–88. [Google Scholar] [CrossRef]
- Chen, H.; Zeng, S.; Lin, H.; Ma, H. Munificence, Dynamism, and Complexity: How Industry Context Drives Corporate Sustainability. Bus. Strategy Environ. 2017, 26, 125–141. [Google Scholar] [CrossRef]
- Martinez-del-Rio, J.; Antolin-Lopez, R.; Cespedes-Lorente, J.J. Being green against the wind? The moderating effect of munificence on acquiring environmental competitive advantages. Organ. Environ. 2015, 28, 181–203. [Google Scholar] [CrossRef]
- Hartmann, J.; Vachon, S. Linking environmental management to environmental performance: The interactive role of industry context. Bus. Strategy Environ. 2018, 27, 359–374. [Google Scholar] [CrossRef]
- Li, S.; Ngniatedema, T.; Chen, F. Understanding the Impact of Green Initiatives and Green Performance on Financial Performance in the US. Bus. Strategy Environ. 2017, 26, 776–790. [Google Scholar] [CrossRef]
- Wong, K.K. Technical Note: Mediation analysis, categorical moderation analysis, and higher-order constructs modeling in Partial Least Squares Structural Equation Modeling (PLS-SEM): A B2B Example Using SmartPLS. Mark. Bull. 2015, 26, 1–22. Available online: http://marketing-bulletin.massey.ac.nz (accessed on 27 June 2019).
- Barclay, D.; Higgins, C.; Thompson, R. The partial least squares (PLS) approach to causal modeling: Personal computer adoption and use as an illustration. Technol. Stud. 1995, 2, 285–309. [Google Scholar]
- Taliento, M.; Favino, C.; Netti, A. Impact of Environmental, Social, and Governance Information on Economic Performance: Evidence of a Corporate ‘Sustainability Advantage’ from Europe. Sustainability. 2019, 11, 1738. [Google Scholar] [CrossRef]
- De Mendonca, T.; Zhou, Y. What does targeting ecological sustainability mean for company financial performance? Bus. Strategy Environ. 2019, 1–11. [Google Scholar] [CrossRef]
- Tang, A.K.Y.; Lai, K.-H.; Cheng, T.C.E. Environmental governance of enterprises and their economic upshot through corporate reputation and customer satisfaction. Bus. Strategy Environ. 2012, 21, 401–411. [Google Scholar] [CrossRef]
- Keats, B.W.; Hitt, M.A. A causal model of linkages among environmental dimensions, macro organizational characteristics, and performance. Acad. Manag. J. 1988, 31, 570–598. [Google Scholar] [CrossRef]
- Ong, T.S.; Lee, A.S.; The, B.H.; Magsi, H.B. Environmental innovation, environmental performance and financial performance: Evidence from Malaysian environmental proactive firms. Sustainability 2019, 11, 3494. [Google Scholar] [CrossRef]
- Zhao, X.; Lynch, J.G., Jr.; Chen, Q. Reconsidering Baron and Kenny: Myths and Truths about Mediation Analysis. J. Consum. Res. 2010, 37, 197–206. [Google Scholar] [CrossRef]
- Dyllick, T.; Muff, K. Clarifying the Meaning of Sustainable Business: Introducing a Typology from Business-as-Usual to True Business Sustainability. Organ. Environ. 2015, 29, 156–174. [Google Scholar] [CrossRef]
- Haffar, M.; Searcy, C. Target-setting for ecological resilience: Are companies setting environmental sustainability targets in line with planetary thresholds? Bus. Strategy Environ. 2018, 27, 1079–1092. [Google Scholar] [CrossRef]
- Braungart, M.; McDonough, W.; Bollinger, A. Cradle-to-cradle design: Creating healthy emissions-a strategy for eco-effective product and system design. J. Clean. Prod. 2007, 15, 1337–1348. [Google Scholar] [CrossRef]
- Orlitizky, M.; Schmidt, F.; Rynes, S. Corporate Social and Financial Performance: A Meta-analysis. Organ. Stud. 2003, 24, 403–441. [Google Scholar] [CrossRef]
Figure 1.
The relationship between environmental performance and profitability.


Table 1.
Description of indicators.
| Variable | Description | Source |
|---|---|---|
| Profitability: | ||
| Return on Assets | The ratio of net income to total assets | COMPUSTAT, sourced from Wharton’s Data Research Services |
| Return on Invested Capital | The ratio of net income to long-term debt plus total equity | COMPUSTAT |
| Environmental Performance: | ||
| Energy productivity | The ratio of revenue (US$) to total energy consumption (GJ) | Newsweek Green rankings 2015–2017 |
| Carbon productivity | The ratio of revenue (US$) to total greenhouse gas emissions (CO2e) | Newsweek Green rankings 2015–2017 |
| Water productivity | The ratio of revenue (US$) to water use (m3) | Newsweek Green rankings 2015–2017 |
| Waste productivity | The ratio of revenue (US$) to total waste generated (metric tons)–waste recycled/reused (metric tons) | Newsweek Green rankings 2015–2017 |
| Customer Satisfaction: | ||
| American customer satisfaction index | A weighted average of survey questions measuring perceived quality, perceived value and customer expectations | American Customer Satisfaction Index LLC |
| Industry munificence: | ||
| Industry sales growth | COMPUSTAT | |
| Control variables: | ||
| Company size | Net sales | COMPUSTAT |
| Industry | Unique industry identifier | |
| Capital intensity | The ratio of total capital expenditure to net sales | COMPUSTAT |
| Leverage | The ratio of total debt to total stockholders’ equity | COMPUSTAT |
| Liquidity | The ratio of current assets to current liability | COMPUSTAT |
Table 2.
Summary statistics.
| Variable | Mean | S.D. |
|---|---|---|
| 1. Energy productivity | 13.40 | 23.03 |
| 2. Carbon productivity | 15.65 | 22.79 |
| 3. Water productivity | 13.77 | 23.44 |
| 4. Waste productivity | 10.50 | 20.38 |
| 5. Customer satisfaction | 76.35 | 5.37 |
| 6. ROA | 0.06 | 0.05 |
| 7. ROIC | 0.12 | 0.25 |
| 8. Industry Munificence | 1.09 | 0.12 |
| 9. Industry | 15.26 | 8.74 |
| 10. Company size | 48915 | 65867 |
| 11. Capital intensity | 0.09 | 0.10 |
| 12. Leverage | 0.68 | 9.75 |
| 13. Liquidity | 1.68 | 1.51 |
Note: observations = 276, ROA = return on assets, ROIC = return on invested capital, S.D. = standard deviation.
Table 3.
Pearson correlation statistics.
| Variable | 1 | 2 | 3 | 4 | 5 | 6 | 7 | 8 | 9 | 10 | 11 | 12 | 13 |
|---|---|---|---|---|---|---|---|---|---|---|---|---|---|
| 1. Energy productivity | 1.00 | ||||||||||||
| 2. Carbon productivity | 0.81* | 1.00 | |||||||||||
| 3. Water productivity | 0.71* | 0.75* | 1.00 | ||||||||||
| 4. Waste productivity | 0.63* | 0.64* | 0.61* | 1.00 | |||||||||
| 5. Customer satisfaction | −0.15* | −0.14* | −0.10 | 0.00 | 1.00 | ||||||||
| 6. ROA | 0.13* | 0.12 | 0.07 | 0.08 | 0.13* | 1.00 | |||||||
| 7. ROIC | 0.01 | 0.01 | −0.01 | 0.01 | 0.12 | 0.44* | 1.00 | ||||||
| 8. Industry Munificence | −0.14* | −0.16* | −0.14* | −0.13* | 0.09 | 0.01 | 0.15* | 1.00 | |||||
| 9. Industry | 0.03 | 0.07 | 0.06 | 0.05 | −0.22* | −0.33* | −0.21* | −0.22* | 1.00 | ||||
| 10. Company size | 0.02 | 0.08 | 0.10 | 0.02 | −0.13* | 0.05 | −0.02 | 0.09 | −0.14* | 1.00 | |||
| 11. Capital intensity | −0.03 | 0.02 | 0.04 | 0.04 | −0.12* | −0.29* | −0.16* | −0.25* | −0.74* | −0.25* | 1.00 | ||
| 12. Leverage | −0.13* | −0.11 | −0.08 | −0.12* | −0.02 | −0.13* | −0.07 | 0.06 | 0.00 | 0.03 | 0.04 | 1.00 | |
| 13. Liquidity | 0.06 | −0.02 | −0.04 | −0.06 | −0.22* | 0.02 | −0.04 | 0.23* | −0.10 | 0.03 | −0.23* | 0.00 | 1.00 |
Note: observations = 276, ROA = return on assets, ROIC = return on invested capital, * p < 0.05.
Table 4.
Average variance extracted (AVE), composite reliability (CR), and Fornell–Larcker criterion analysis.
Table 4.
Average variance extracted (AVE), composite reliability (CR), and Fornell–Larcker criterion analysis.
| Fornell–Larcker Criterion | ||||||
|---|---|---|---|---|---|---|
| CR | AVE | Customer Satisfaction | EP*Munificence | Environmental Performance | Profitability | |
| Customer satisfaction | SIC | SIC | SIC | |||
| EP*Munificence | 0.941 | 0.801 | −0.059 | 0.869 | ||
| Environmental performance | 0.924 | 0.755 | −0.136 | −0.326 | 0.869 | |
| Profitability | 0.829 | 0.711 | 0.148 | −0.142 | 0.091 | 0.843 |
Notes: N = 276, EP = environmental performance, SIC = single item construct, the square root of AVE is in italics.
Table 5.
Path loadings and t-value path statistics.
| Path Coefficient | t Value | p-Value | ||
|---|---|---|---|---|
| H1: | Environmental performance → Customer satisfaction | −0.182 | 2.412 | 0.016 |
| H2: | Customer satisfaction → Profitability | 0.084 | 1.678 | 0.093 |
| H3: | EP * Munificence → Customer satisfaction | −0.207 | 1.340 | 0.180 |
| Environmental performance → Profitability | 0.107 | 1.391 | 0.164 | |
| Industry → Profitability | −0.257 | 2.513 | 0.012 | |
| Company Size → Profitability | −0.029 | 0.598 | 0.550 | |
| Capital intensity → Profitability | −0.091 | 1.090 | 0.276 | |
| Leverage → Profitability | −0.107 | 1.139 | 0.255 | |
| Liquidity → Profitability | −0.030 | 0.455 | 0.649 | |
| Munificence → Customer satisfaction | −0.021 | 0.238 | 0.812 |
Abbreviation: EP = environmental performance.
© 2019 by the authors. Licensee MDPI, Basel, Switzerland. This article is an open access article distributed under the terms and conditions of the Creative Commons Attribution (CC BY) license (http://creativecommons.org/licenses/by/4.0/).
Share and Cite
MDPI and ACS Style
De Mendonca, T.R.; Zhou, Y. Environmental Performance, Customer Satisfaction, and Profitability: A Study among Large U.S. Companies. Sustainability 2019, 11, 5418. https://0-doi-org.brum.beds.ac.uk/10.3390/su11195418
AMA Style
De Mendonca TR, Zhou Y. Environmental Performance, Customer Satisfaction, and Profitability: A Study among Large U.S. Companies. Sustainability. 2019; 11(19):5418. https://0-doi-org.brum.beds.ac.uk/10.3390/su11195418
Chicago/Turabian StyleDe Mendonca, Taryn Renatta, and Yan Zhou. 2019. "Environmental Performance, Customer Satisfaction, and Profitability: A Study among Large U.S. Companies" Sustainability 11, no. 19: 5418. https://0-doi-org.brum.beds.ac.uk/10.3390/su11195418
Note that from the first issue of 2016, this journal uses article numbers instead of page numbers. See further details here.