The Material Indices Method in the Sustainable Engineering Design Process: A Review


1
Faculty of Transport Engineering, Poznan University of Technology, ul. Piotrowo 3, 60-965 Poznań, Poland
2
Faculty of Wood Technology, Poznań University of Life Sciences, ul. Wojska Polskiego 28, 60-637 Poznań, Poland
*
Author to whom correspondence should be addressed.
Sustainability 2019, 11(19), 5465; https://0-doi-org.brum.beds.ac.uk/10.3390/su11195465
Submission received: 1 August 2019
/
Revised: 26 September 2019
/
Accepted: 29 September 2019
/
Published: 2 October 2019
(This article belongs to the Section Sustainable Engineering and Science)
Abstract
:The material indices method has its application in both the design of construction materials and products. The method has evolved since the 1960s and has been described in German, Russian, Polish, and English scientific literature. In the 1990s, the method was adapted to Design for the Environment with the inclusion of specific energy consumption indicators for various construction materials. The article cites six principles of Design for the Environment and presents specific energy consumption indicators according to various authors. This data was then used in two sample applications of the material indices method to determine the specific energy consumption of product manufacture: of a support structure of the standing frame and a compression spring design. In the conclusions, the significant limitations of the material indices method are emphasized, which are not extensively discussed in the literature on the subject, such as its high sensitivity to the accuracy of the adopted energy consumption indicators for materials in view of the actual production process; not taking into consideration all the negative aspects of the materials’ impact on the environment, or the difficulties associated with predicting the impact of material production technology on the material indices. On the other hand, their simple functional form makes them ideal for incorporation into modern CAD software and in product optimization at the initial stage of concept design.
1. Introduction
The contemporary engineering design process takes into account the full life cycle of the object being designed. This includes its functions, manufacturability, and economic and environmental factors in the product’s life cycle analysis. Generally, the design process is oriented towards efficient and cost-effective use of resources to ensure a positive environmental effect; work safety and quality of life; adjustment and adaptation to market needs; operation and servicing with a tolerance to errors and risk; as well as the use of renewable resources [1,2,3,4,5,6,7,8,9]. Such an orientation established a trend for designing structures that fulfilling their functions and are light and often inexpensive at the same time or have a minimal effect on the environment, i.e., production using appropriate materials.
The main objective of this paper is to review the strategies of structural materials selection in mechanical design based on material indices found in the subject literature. These indicators are related to the volume, weight, cost, and environmental indicators of the construction material, thanks to which they take into account the whole life cycle of the designed product.
2. State of the Art in the Use of Material Indices in Mechanical Design
2.1. Evolution of Material Selection Methods in Engineering Design
The material indices method is used to perform a comparative quantitative estimation of various structural materials, taking into consideration the type of load. Every new engineering material can be characterized by calculating its indices and comparing these with those of currently used materials [10]. To the best of the authors’ knowledge, the material indices method has been created by professor Gustav Niemann in 1960 [11], who proposed that the selection of materials should be based on the comparison of volume, mass, and material cost of a given structural member. For example, in the Polish subject literature, when the fundamentals of machine design were referred to for the first time, the compactness index, material consumption index, and cost absorption were introduced in 1964 by professor Stanisław Kocańda [12]. Material indices were also used in 1968 by professor Pavel Orlov [13,14] for the comparison of stiffness, strength, and mass (Table 1) in the four cases of shapes of structural members: a—members of the same shape, demonstrating the same stresses under the same load that exists when a given material is replaced without geometrical changes (cross-sections arranged accordingly to process-related conditions under small stresses); b—members of the same stiffness, the same strains for different cross-sections and stresses; c—members of the same strength, i.e., the same margin of reliability for different cross-sections and stresses proportional to the short-term strength; d—members of the same mass. Cases b and c apply when a material is replaced by another one, and cross-sections of members are changed, with sufficiently accurate stress and strain calculations that are suitable to establish strength and stiffness for different cross-sections. Case d applies when mass is predefined based on the intended use of the member.
In addition, a generalized strength–stiffness index that characterizes the ability of a member to withstand great loads with a small strain and mass was introduced in the aforementioned publication by Orlov. An extended and modified approach to material indices was provided by professor Witold Korewa in 1974 [15]. Table 2 shows the volume indices υv of bars during tension, bending, and torsion for three cases of limit load capacity (as regards the criteria of strength, stiffness, and elasticity).
Mass index cq and material cost index ck are determined based on the relationship:
While creating tables with ordered values of the indices for various materials, one must remember that an increase in the calculated values of the indices cv, cq, ck leads to a proportional decrease in volume, mass, and material cost. The compilation of the tables requires the same geometrical values of the shape factor gk and length factor gl of the bar and load conditions w. For geometrically-similar bars with the cross-section shape factor gk = const. 1, the bar length factor gl = const. 2 and the same loads F = const. 3, the calculations are simplified.
Taking a beam subjected to bending as an example, when the beam load is determined by strength, beam volume for F∙gk∙gl = const. 4 is V = (1/σper2/3) const. 4, its mass is Q = V∙γ = (γ/σper2/3) const. 4 and its cost is K = Q∙kj = (γ∙kj/σper2/3) const. 4. The quantity const. 4 has a fixed value in the set of the materials being compared. This means that the creation of relative standardized measures of material values (e.g., for score or percentage measure relative to the best material) requires only the comparison of given material functions for the above-mentioned relationships in brackets (designated as cv, cq, ck).
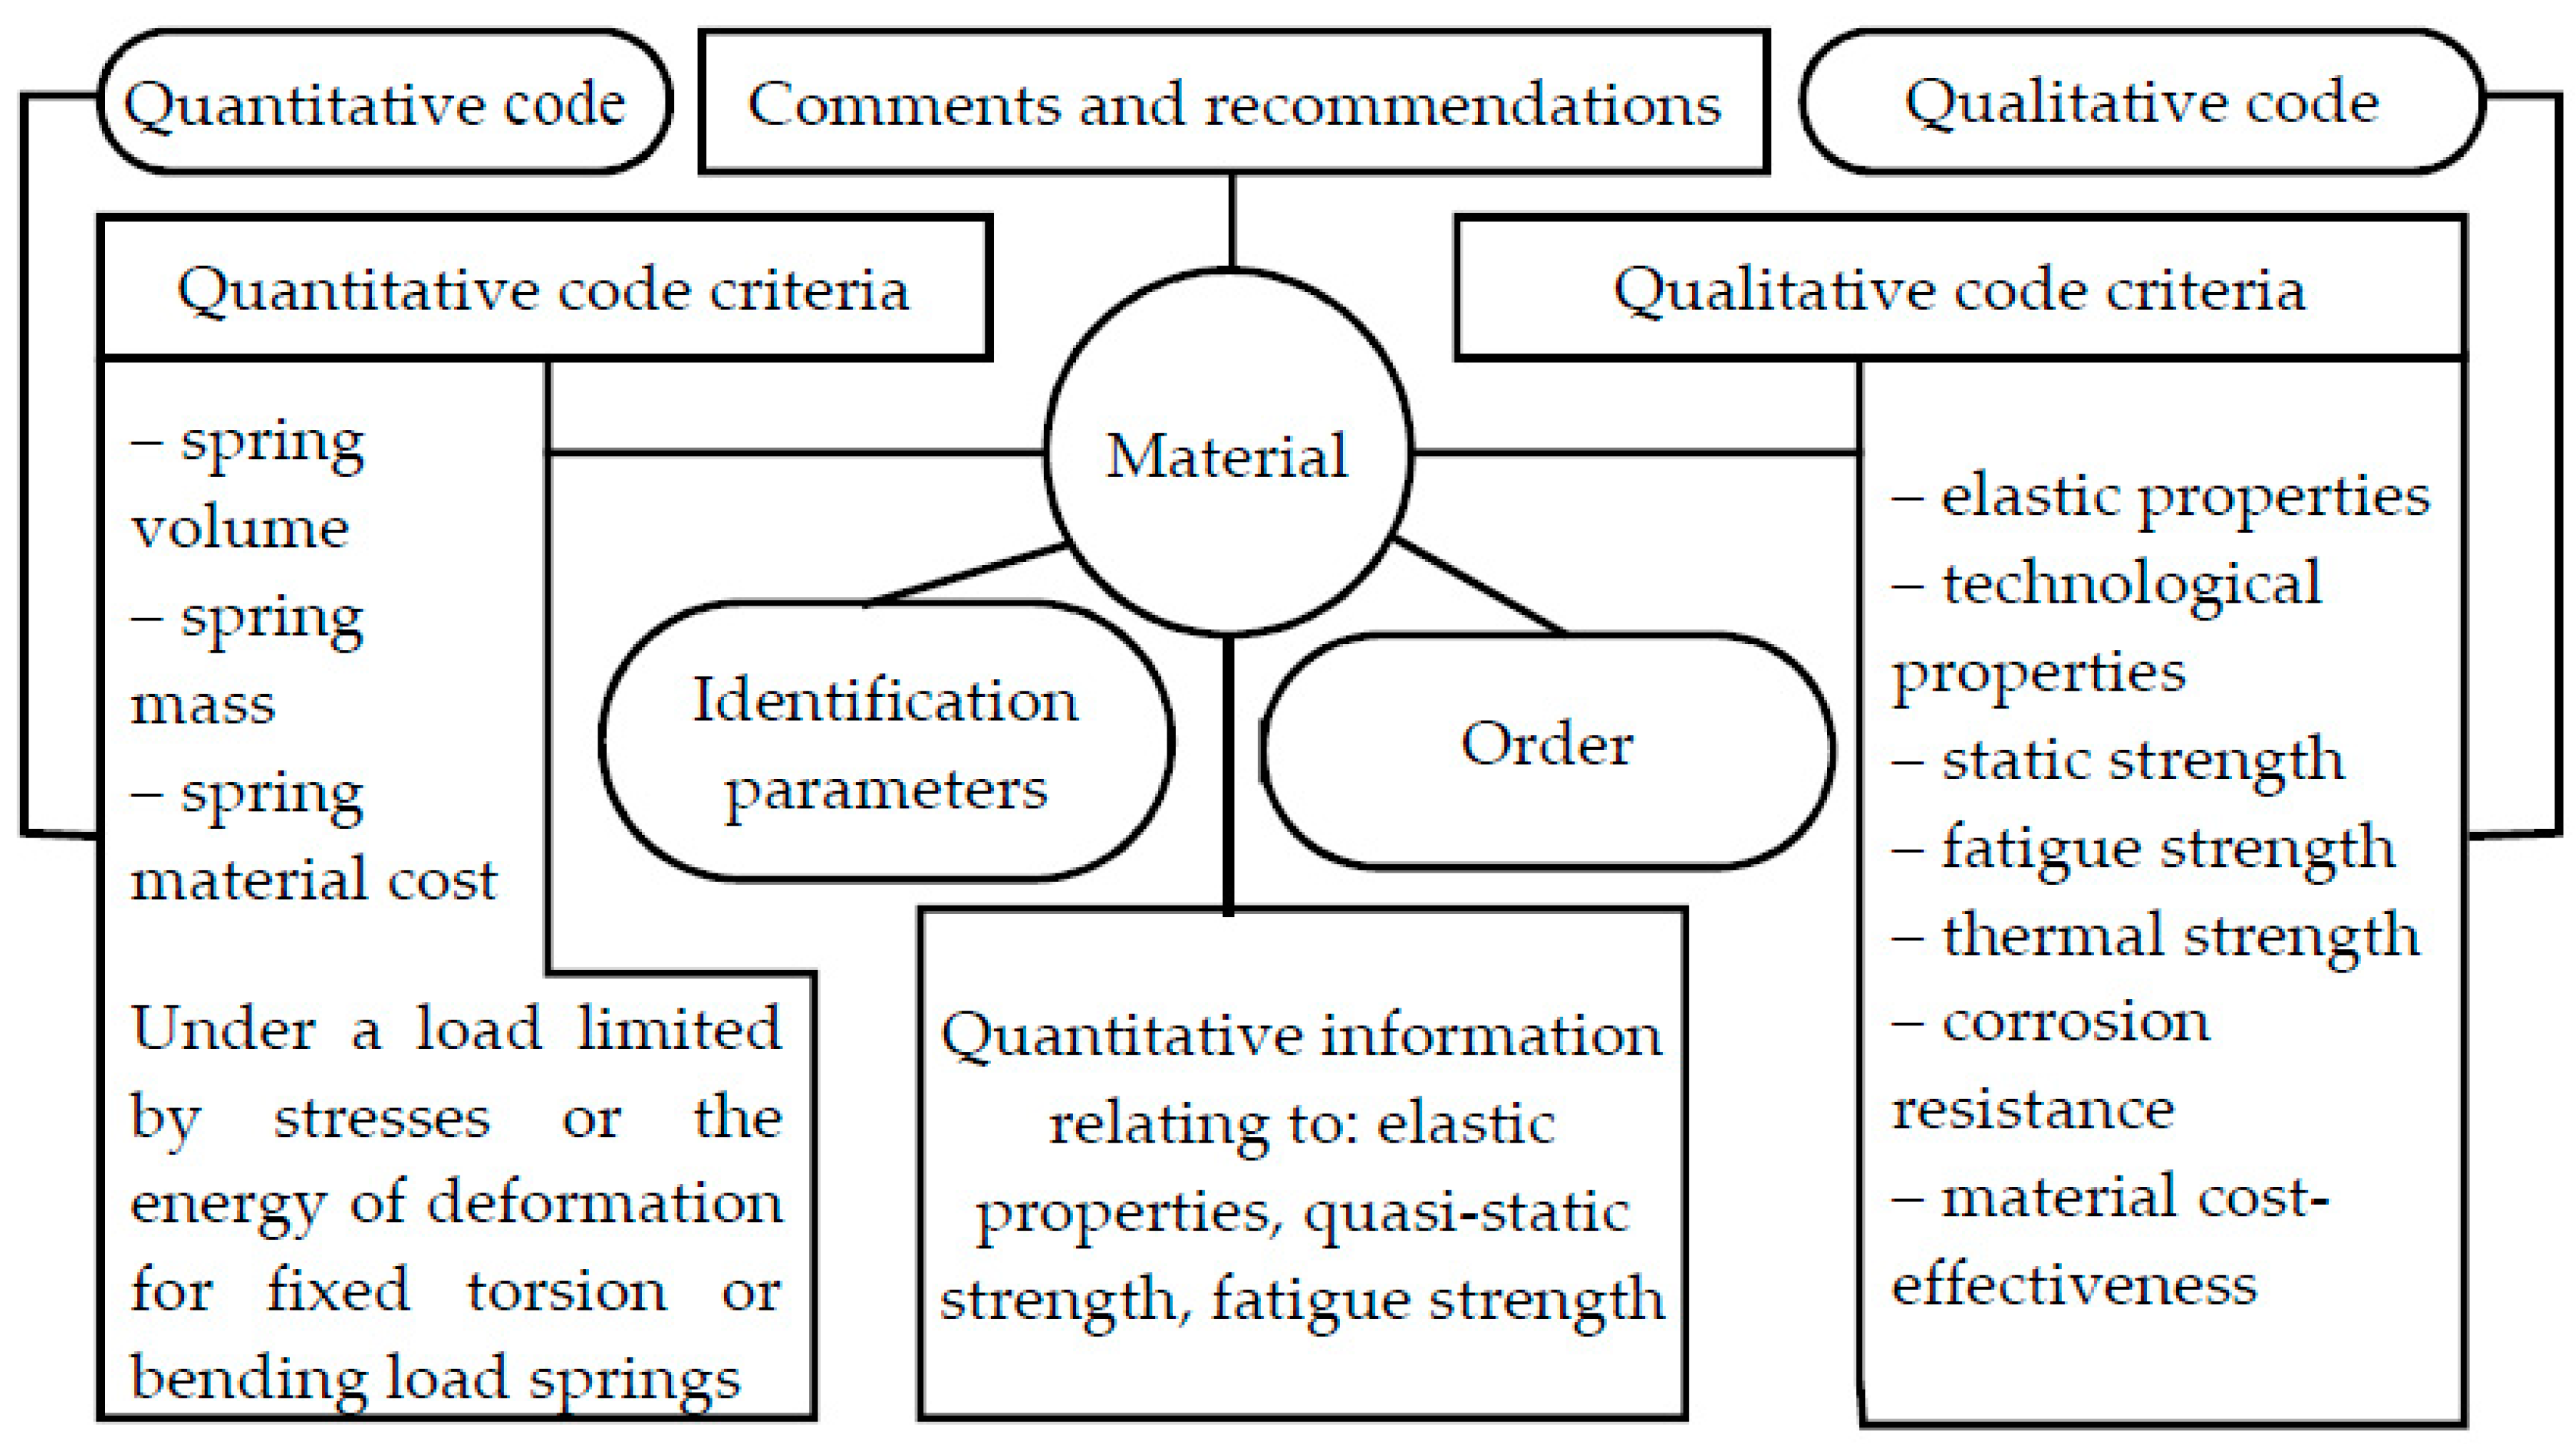
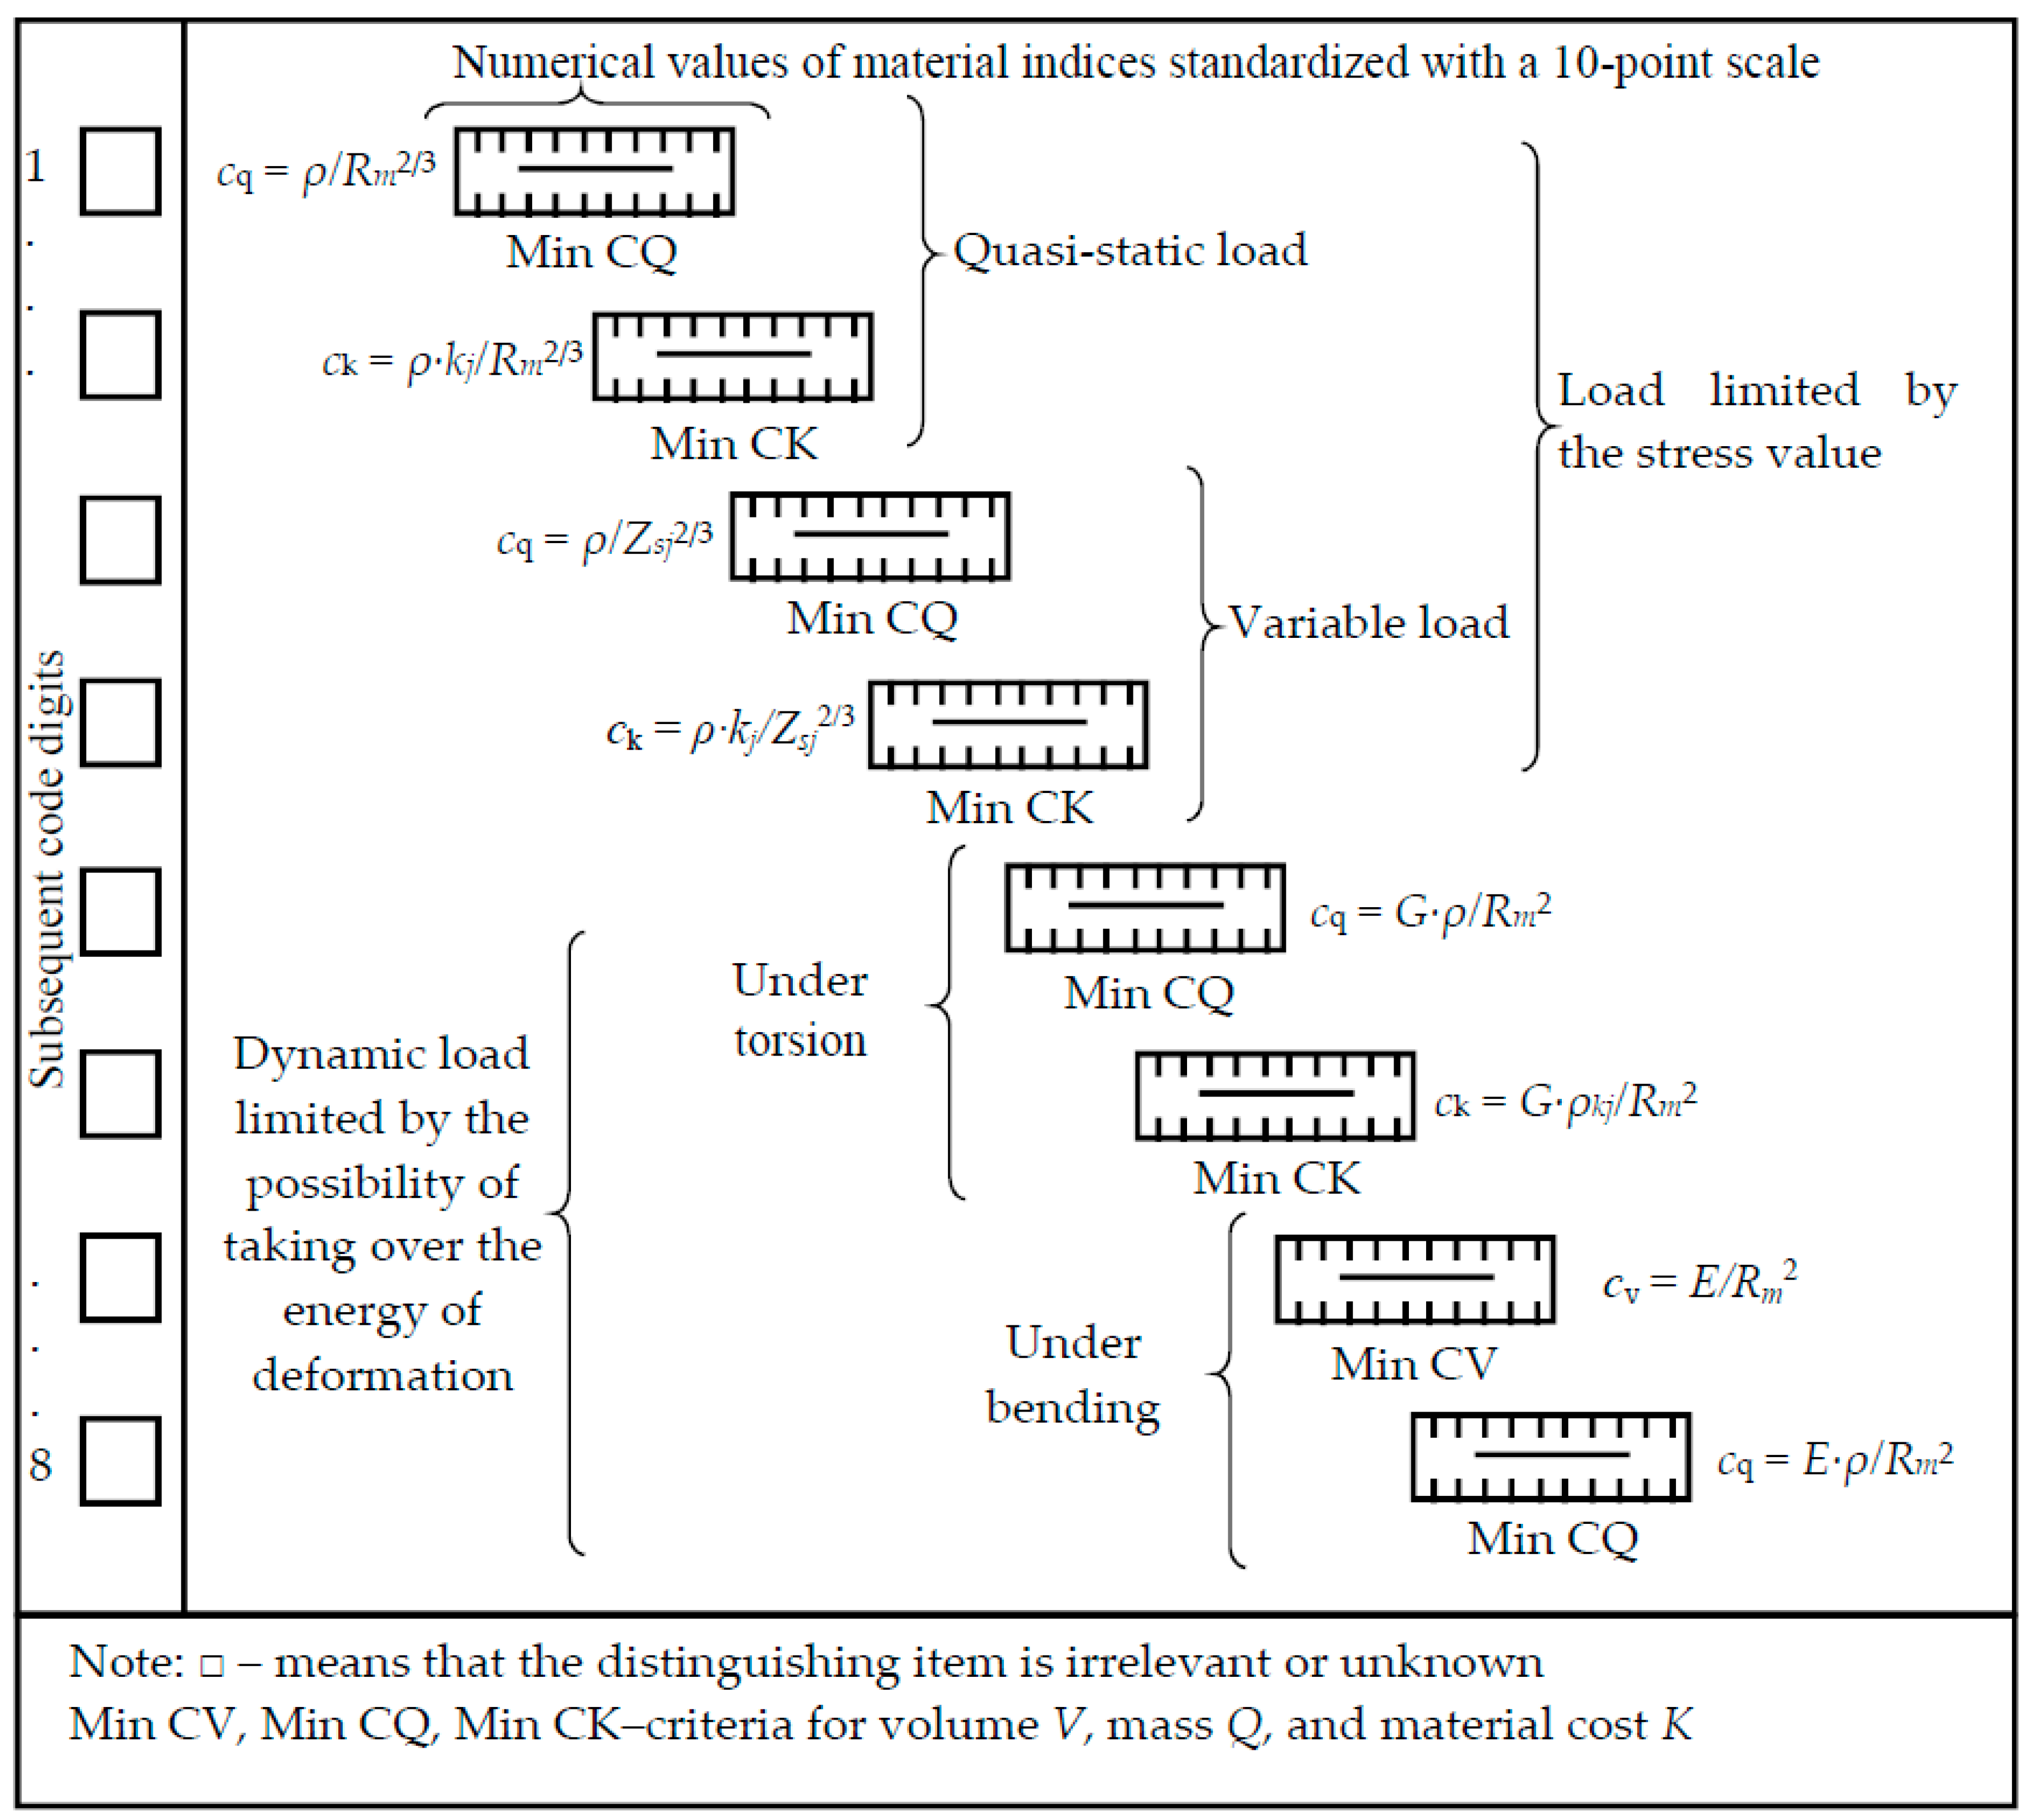
A major advantage of material indices is their simple functional form that can be easily used in practical applications during material selection. For instance, in previous publications by one of the authors of this paper in 1997 ([16,17]), material indices were used as an aid during material selection using databases of CAD systems designed for optimization, design, and verification calculations of metal helical, flat, and disc springs. Each material was described by 25 quantitative attributes of elasticity, static, and fatigue strength. Material selection was performed in terms of the previously chosen descriptive classification criteria enabling qualitative coding (seven attributes, including technological properties and material cost) or quantitative coding. The assumed criteria of descriptive classification for a spring material are provided in Figure 1, whereas the format of the quantitative code according to the method of material indices developed by Gustav Niemann is presented in Figure 2.
The method of material indices devised by Gustav Niemann was developed in later studies of the Munich school of fundamentals of machine design. In the chapter devoted to lightweight structures in the recent edition of the book “Machine Elements” by Gustav Niemann, Hans Winter, and Bernd Robert Hőhn [18], a synthesis of indices was made, together with updated data, including light metals and low-density plastic materials, materials of increased strength and moderate strains or higher wear resistance and fatigue strength. Table 3 presents a set of data relating to structural properties and costs (relative costs) for 21 materials in various forms: metal profiles, simple cast parts, as well as plastic and wood boards. The impact of a material on mass can be illustrated by the quantities of specific volume, strength, and stiffness (the greater the specific volume, the greater the mass):
- specific volume indicating the actual volume (mass) ;
- specific strength corresponding to the length of a fixed cross-section bar which breaks under its own weight ;
- specific stiffness (elongation) when the deformation is predefined .
Computational relationships for the determination of the mass index cq under various loads are collected in Table 4, whereas the energy consumption index ce will be characterized later in this paper.
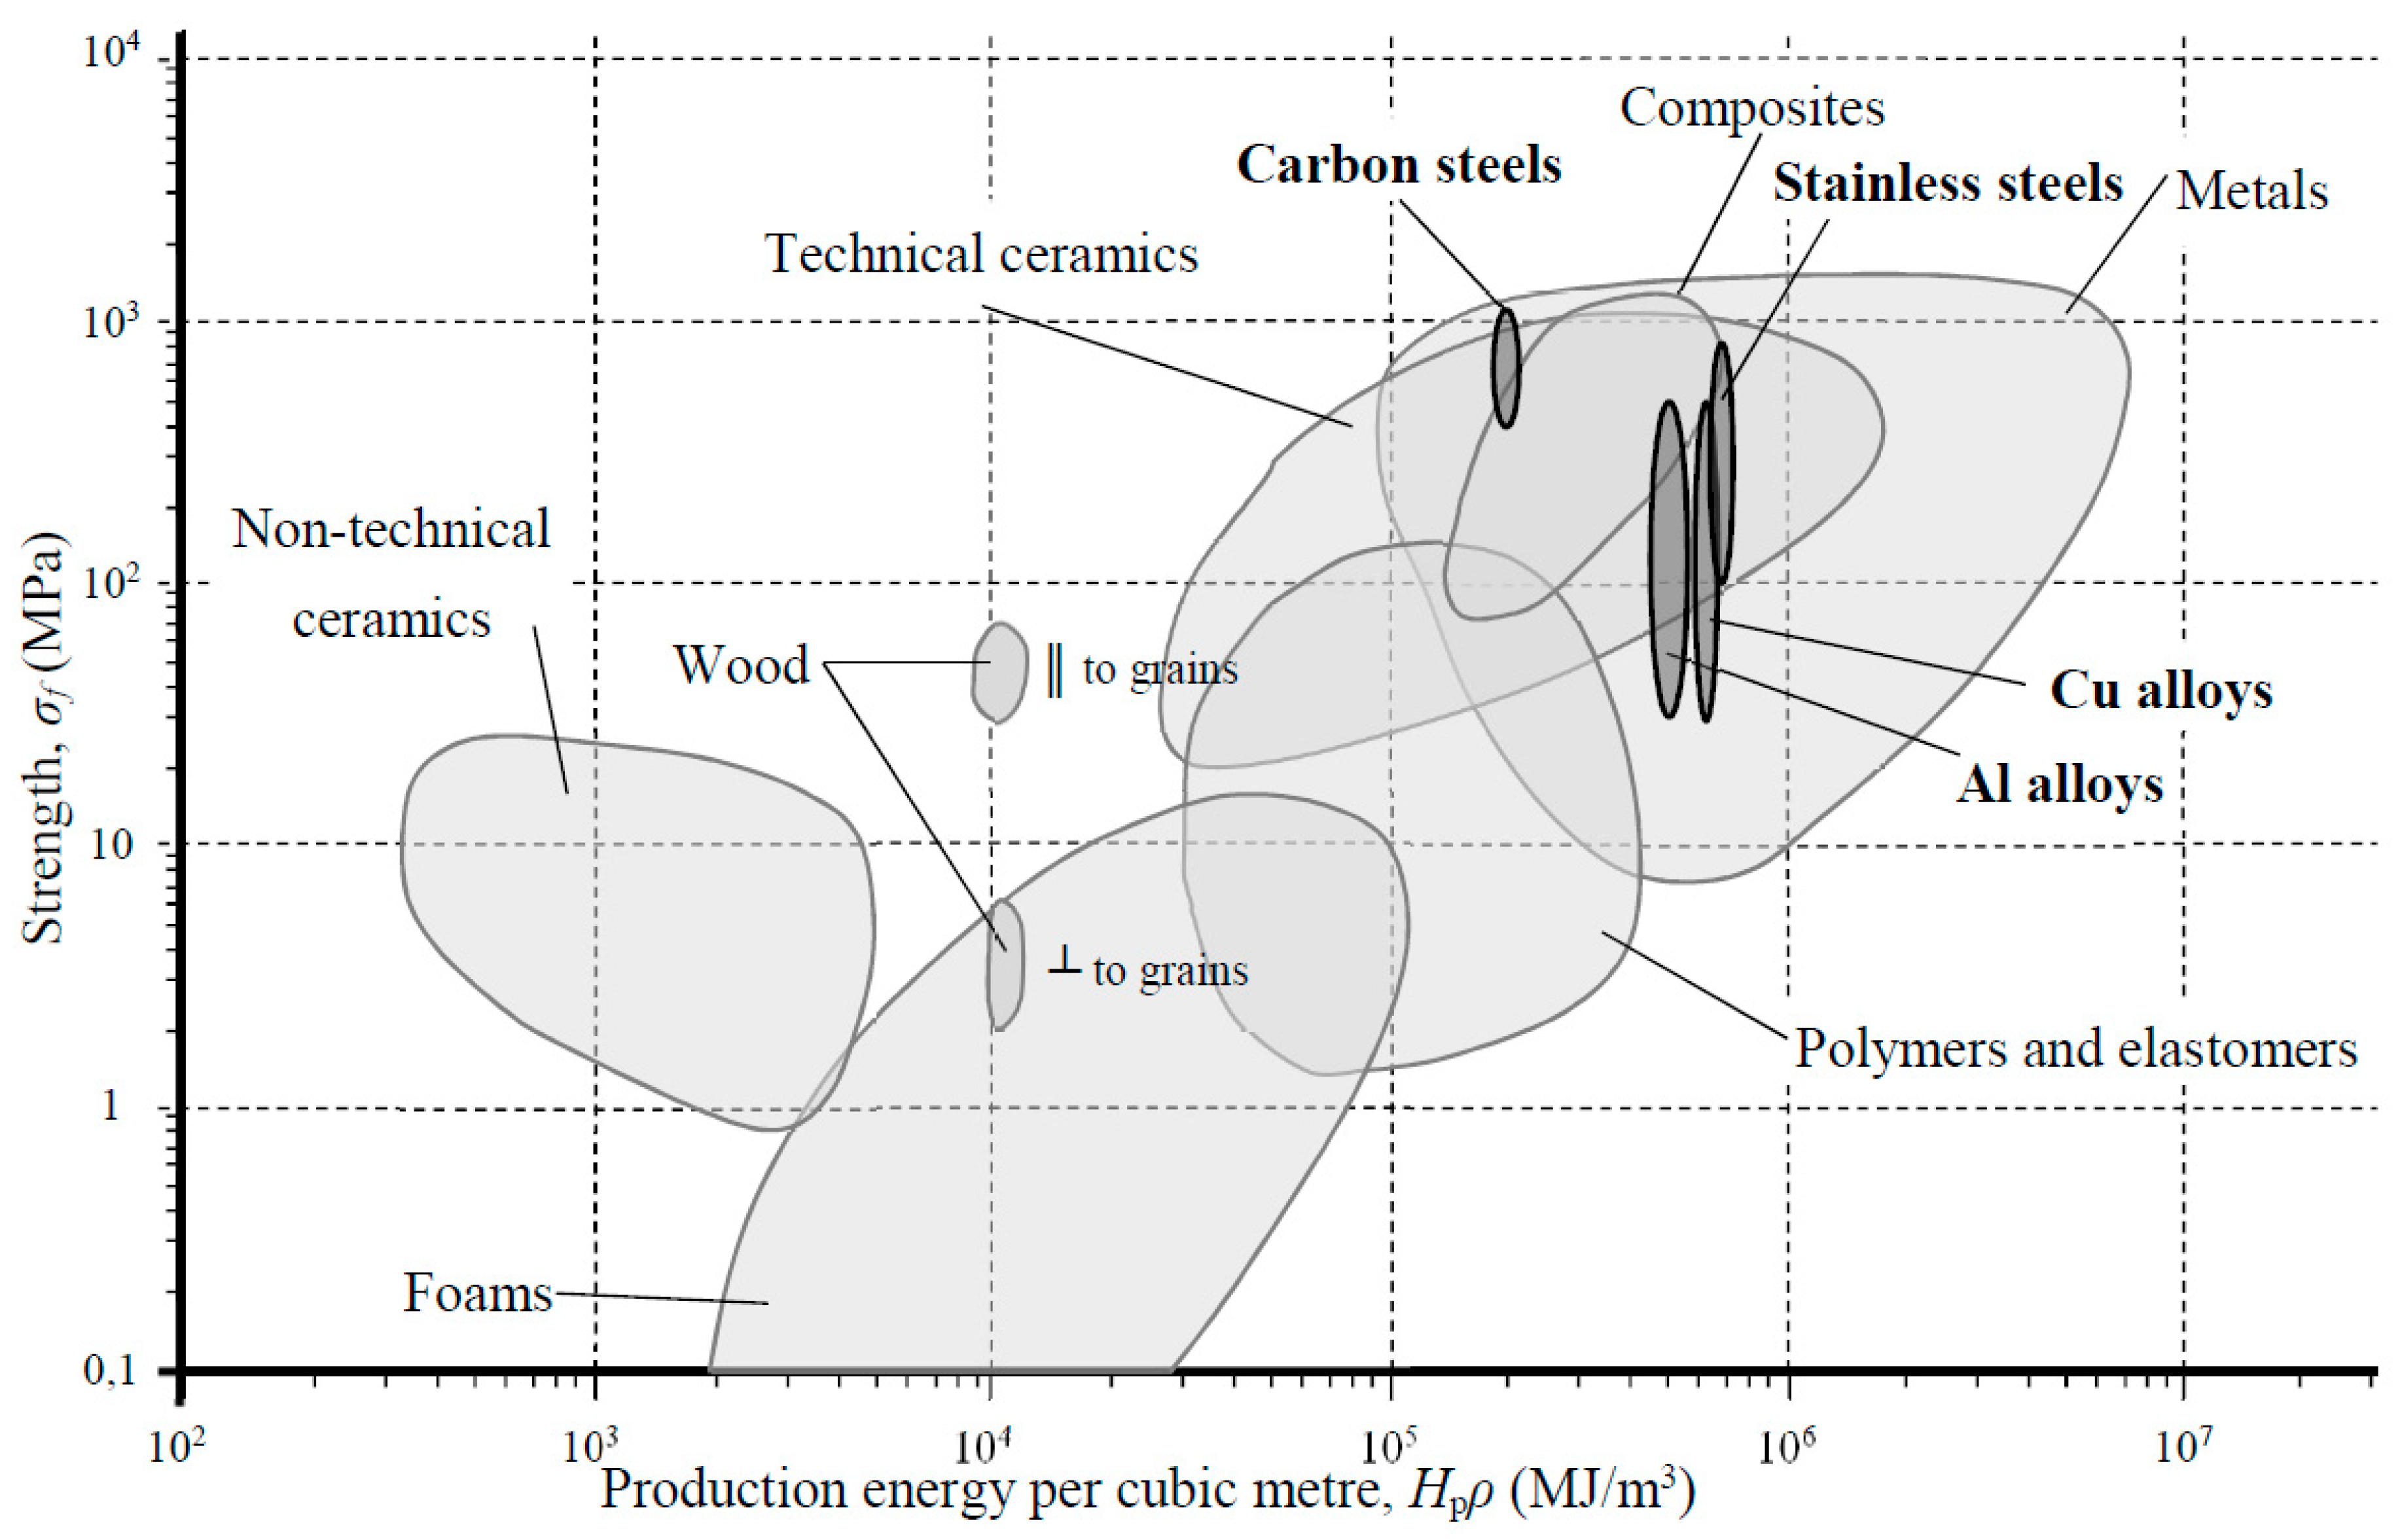
The material selection methodology developed by British professor Michael Farries Ashby is highly esteemed (published in 1989–2013, [10,19,20,21,22]). In 1989 he indicated 6 classes of engineering materials and 10 basic subsets of material properties [19] (in 1992, he raised that number of material properties to 18 [10]) and has created characteristic plots used to compare these properties for engineering materials (metals, ceramics, glasses, elastomers, polymers, and composites); the Ashby plots may be used for solving various design problems with a formal model based on criteria [10]. At the same time, he introduced the so-called performance indices as the basis for the selection of an optimum material. Performance (p) shall be understood as a function of three sub-functions of separate parameters: functional requirements f1, geometric parameters f2, and material properties f3 . For a given design task, it is possible to assume the same values of sub-functions of functional requirements f1 and geometric parameters f2. This means simplification of material selection by the maximization of the sub-function f3 → max. In the aforementioned book by Ashby and the following books by Michael Farries Ashby and John Humphrey Christopher Jones on engineering materials, particular attention was paid to the material selection method based on performance indices with a series of examples [23,24,25,26]. In fact, Ashby’s performance indices correspond to Niemann’s material indices. They were creatively developed, but created later and independently of Niemann’s work. The method of the materials science school originating from Cambridge University for material selection using Ashby’s performance indices has been widely applied to solutions for many design problems in the American subject literature on the fundamentals of machine design [27,28]. Figure 3 shows one characteristic Ashby’s plot, simplified by the authors for further analysis. This plot is used for material selection based on the collected parameters of strength and specific energy consumption of specified material families. The guidelines in the plot are used to select materials for robust structures featuring the minimum material consumption index.
Here, it is necessary to point out a certain “intrinsic error” of the material indices method. All calculations performed while determining the strength, stiffness, and work of the elastic strain (σ = σper; f = fper) are based on the limit load state F of the component in question for the volume index cv (Table 2).
This limit load state is not typical for mechanical designs or undesirable due to other design limitations that are not accounted for in the material indices method (e.g., process-related, ergonomic limitations). Parameters of the component cross-section are not constant due to load changes (e.g., bending moment) along the component length, the limit state of which occurs only locally. Allowable stresses not only result from the strength properties of a material (with the values assumed with a certain spread), but also from the component reliability measured by safety factors under static and fatigue loads. Even in components under tension or compression with a conventionally-fixed distribution of stresses along the component length, increased cross-sections often occur at the points where the loads are applied. The remaining indices of mass, cost, or energy consumption (as discussed later) are derived from the doubtful volume index. Results of such analyses of indices are accompanied by heavily scattered values that correspond to the scattering of values of the cost-absorption and energy consumption indices. The use of the material indices method for material selection in a multi-component design is greatly hindered since non-uniform loads on components are the reason for which material properties in such components are different.
A reasonable approach to material selection in multi-component design is to use contemporary 3D computer-aided design methods. A virtual three-dimensional model of a structure makes it easy to reproduce numerical values of cross-section and mass factors without the simplification that is characteristic for the material indices method. Computer databases facilitate the search and selection of information on material properties [29].
2.2. Material Selection in Design for the Environment
The orientation of engineering design towards the environment is based on the concept of sustainable development. In the process of Design for the Environment, detailed criteria of the environmental impact within the full life cycle of a product are important cornerstones for the structure—from the moment of establishing the design problem, through the process of creating lists of requirements, the process of searching for solutions, evaluating and selecting them to the stage of design engineering [30]. All it means is a new integral approach to the development of products, wherein the approach employs and enriches the former achievements of the design theory. Functions such as safety, durability, reliability, costs, and ergonomics continue to be the main general requirements. Such requirements during the selection of an environmentally-friendly structural material necessitate more thorough analyses of the potential effects of basic phenomena and processes in machines (friction, wear, lubrication, creeping, and material fatigue), toxicity of materials, price availability, process-related processing capabilities, and susceptibility to material recycling. Design for the Environment is one of the design strategies that is currently being widely developed [30,31,32,33,34]. The focal point of these strategies is included in the rules of Design for the Environment [35] that can be characterized as follows:
- Rule 1. To ensure sustainable development of resources: to specify renewable and abundant resources; to specify recyclable and recycled resources; to use recycled materials; to employ common and remanufactured components; to specify compatible materials and fasteners for recycling; to minimize the variety of materials in the product or its components; to specify renewable energy sources.
- Rule 2. To minimize the use of resources in the production and transportation phase: to change the functions and appeals of packaging during design; to fold and disassemble in a compact state; to apply structural techniques and material technologies that minimize the total volume of material; to provide light materials and components; to specify materials that do not require additional surface treatment or paint; to structure the product to minimize material waste; to minimize the number of components; to ensure clean production processes.
- Rule 3. To ensure harmless inputs and outputs: to ensure containment of hazardous substances, substances that are safe to the environmental and user health; to ensure water-based and biodegradable waste; to specify the cleanest source of energy; to ensure easy removal of concentrated toxic components.
- Rule 4. To minimize consumption of resources during operation: not to manufacture in a hot-state to prevent material losses; to minimize volume, surface area, and mass of components and materials to which energy is transferred; to specify best-in-class efficiency components; to reduce power in systems that are not in use by default; to incorporate partial operation to disengage systems that are not in use; to reveal energy and water consumption; to incorporate features that prevent the waste of materials by the user.
- Rule 5. To ensure durability of the products and components: to reuse energy; to provide aesthetics of the life cycle; to minimize maintenance; to protect the product from dirt and corrosion; to indicate through the product how parts are maintained; to ensure easy repair and upgrade; to minimize the number of service and inspection tools; to facilitate testing.
- Rule 6. To ensure incorporation, disassembly, separation, and cleaning; to indicate through the product how it should be accessed; to ensure that joints and fasteners are accessible; to minimize the number and plurality of fastening elements; to ensure easy cleaning methods and reusability; to create simple part placement that can be restored; to organize in hierarchical modules for end-of-life repair; to implement reusable platforms after replacement of modules; to specify adhesives, labels, surface coatings, and varnishes that are compatible with cleaning; to ensure one disassembly direction without reorientation; to mark materials with reutilization protocol to ensure a shallow or open structure for easy access to sub-assemblies.
Three quantities determine well the environmental impact of materials: embodied energy, carbon footprint, and water demand [36]. Energy consumption by materials during manufacturing and processing may be evaluated using the so-called specific energy consumption per unit volume pv [GJ/m3] or per unit mass pq (MJ/kg). If the volume V (m3) or mass m (kg) of the material is known, its energy consumption E = pv∙V (MJ) or E = pq∙M (MJ) can be determined. While comparing the energy consumption of many materials, it is therefore sufficient to compare values of material indices under a given load (Table 4). Table 5 presents specific energy consumption of frequently occurring materials. Specific energy consumption is one measure of how use affects the natural environment, without hazards caused by the emission of toxic by-products, recycling difficulties, resistance to biodegradation.
Table 5 presents specific energy consumption for three groups of construction materials used in the technique (metals, polymers, and composites). The values of individual parameters differ depending on the author and are characterized by a significant dispersion of values. Average values of energy intensity pq according to Bey [38] were adopted for further analysis.
3. Sample Application of the Energy Consumption Index in Material Selection
3.1. Selection of the Material for a Standing Frame Subject to Bending
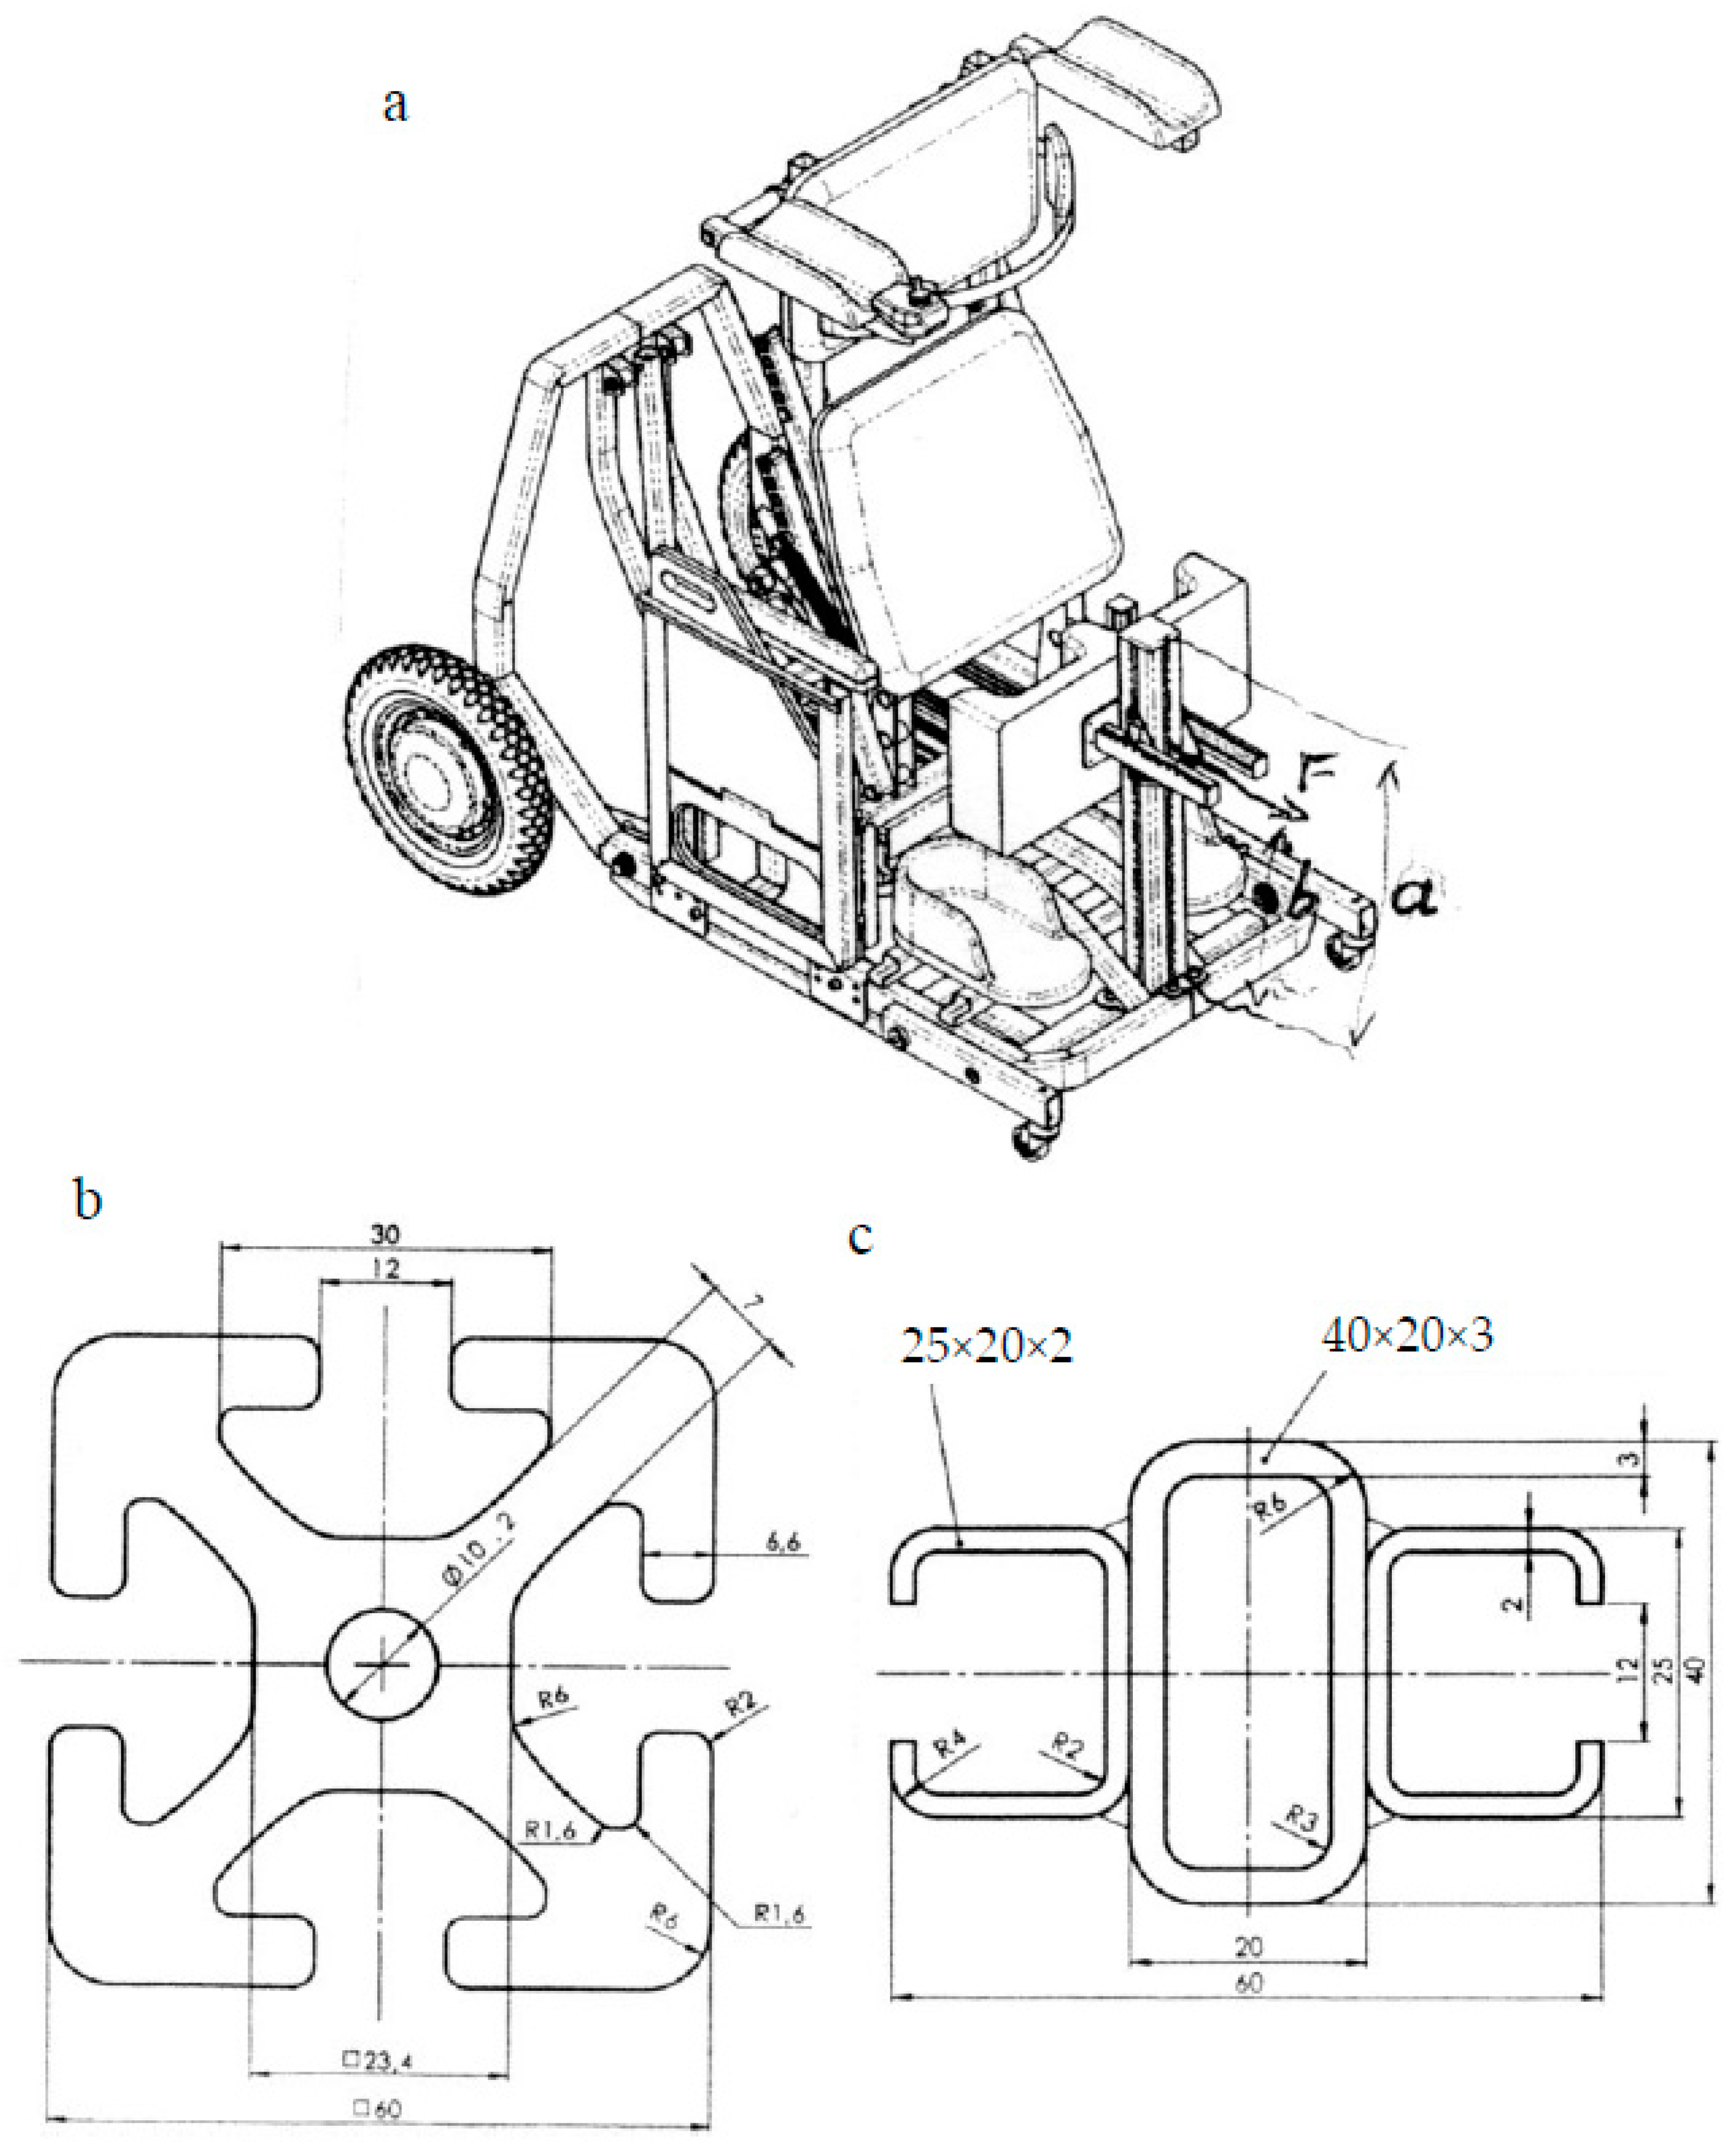
The objective here is material selection for a knee support column under bending in a mobile rehabilitation standing frame, i.e., an individual medical device for a physically disabled person. Figure 4 shows the standing frame together with the dimensional system and support column loads (F = 800 N, l = 400 mm, a = 500 mm) as well as the dimensions of the cross-section of preliminarily selected aluminum profiles (60 × 60 mm, section area A = 20.6 cm2, and index Wx = 23.5 cm3) and steel (3 welded rectangular profiles according to EN 10210, section area A = 5.6 cm2, and index Wx = 5.9 cm3). The shape factor mv of the aluminum section considerably differs in its value from the shape factor of the steel section , which raises doubts as regarding the suitability of the material indices method.
Limit load capacities Mgmax = Wx∙kg of the support column made of aluminum alloys and steel (Table 6) are considerably different and considerably smaller than the actual load (M = F∙l = 320 Nm).
Table 7 presents values of the material consumption index (mass cq) and energy consumption (energy ce) determined by means of the material indices method and the calculation method (mass m = A∙l∙ρ; energy consumption E = pq∙m).
Please note that the verification of the accuracy of the results obtained by the material index method relative to the computational method requires that the ratios of mass material indices be equal to the ratios of component masses for given materials cqi/cqmin = mi/mmin and the ratios of energy consumption indices be equal to the energy ratios: cei/ceSt3 = Ei/Emin. These relationships do not apply. This is evidence of the indicative nature of material selection based on the material indices method and confirms the prior critical evaluation of the method. Furthermore, it may be concluded from Table 7 that steel as a structural material has an advantage over aluminum alloys both in terms of the material consumption index and the energy consumption index as indicators of the environmental burden.
3.2. Comparison of the Energy and Material Consumption Index in the Accurate Calculation Method with the Approximate Indicator Method for Material Helical Compression Springs
In the field of spring design, the use of the material elasticity coefficient has had a long history. Wilhelm Gerolsky made the first compilation of analytical forms of the VF/W indicator for various bent and twisted springs already in 1918 [39]. Choosing the right material and shape in order to obtain the expected spring parameters, was the main area for the optimization of spring design. The criteria for this selection were the assembly volume ratios of the spring VF or mass m to stiffness R or the accumulated deformation energy (W) in the spring. In the literature on the subject [10,11,16,17], indicators m/W, m/R, VF/W, VF/R were distinguished. Synthetic summaries of applications of the indicator method in spring design, as carried out by prof. B. Branowski [16,17], indicate the possibility of using the accumulated deformation energy to select the optimum type of spring due to the criterion represented by the indicator of material selection for specific types of springs. Another indicator (the ratio of accumulated energy W to volume VM of spring material – cM = W/VM) is used by prof. M.F. Ashby [23] to select the best type of spring material.
This paper presents two ways of proceeding in the determination of energy consumption. The first algorithm compares the mass indicators cm of three cylindrical helical compression springs with the workload of W = 0.5 Fn∙sn = const. Expressing the mass index cM as:
and the derivative energy index will be cw:
In the other algorithm, a strict calculation of energy consumption is performed. In a separate calculation procedure, the geometrical parameters of springs are determined. Each of the three considered cylindrical helical compression springs made of a wire of circular cross-section (marked A, B, C) of the shock absorbers is made of a different material. The springs are made of the following materials: (A) of patented steel wire of unalloyed steel according to DIN 17223 Part 1, type B (EN 10270-1); (B) of stainless steel wire acc. to DIN 17224, type X12CrNi177 (EN 10270-3), (C) of beryllium bronze wire acc. to DIN 17682, type CuBe2 (EN 12166).
The developed calculation algorithm determines the geometric parameters of springs at a given value of deformation work W. Due to the discontinuous nature of the geometric features of spring design (e.g., in Table 8: parameters of wire diameters d or turn numbers n), the calculations were carried out using the method of successive approximations using known calculation relationships. The spring parameters given in Table 8 were adopted.
Shock absorber springs have similar values of accumulated work W = 0.930 ± 0.044 Nm. These are for springs A, B, C, respectively: WA = 0.974 Nm, WB = 0.899 Nm, and Wc = 0.886 Nm. When taking into account the permissible torsional stresses τdop ≈ 0.3∙Rm, geometric parameters were determined using the following basic design relationships of springs:
- nominal torsional stresses ;
- stiffness ;
- accumulated deformation energy ;
- wire mass (kg), (nt = n + 1.5).
The above limits meet the spring parameters given in Table 9.
The consolidated results of the calculations of energy and material consumption are presented in Table 10 using the accurate method and the material indicator method.
The results of the calculations indicate the correct trend of energy consumption increase in the change of spring material from patented carbon steel through stainless steel to beryllium bronze. Large differences in the comparison with the logically occurring similarity of cE/cEmin values in the method of material indicators and E/Emin values in the accurate method result from simplifications of the indicator method. However, the results of the calculations using the indicator method allow for control of the impact of the designed structure on the environment. In designing the geometrical features of A, B, C springs, the permissible torsional stresses (τdop = 0.3 Rm) were consciously reduced to compensate for the dynamic character of shock absorber spring loads and to reduce stress relaxation.
4. Conclusions
The results of the analyses indicate significant limitations of the application of the material indicator method, which is not fully emphasized in the scientific literature. This is a result of antinomy: simplicity of the form of indicators vs. high accuracy of representation of many structural properties of the designed object.
- Literature data (M.F. Ashby [36], N. Bey [38]) shows a large dispersion of the values of specific energy consumption for materials. For example, as given in Table 5, the specific energy consumption of stainless steels varies between pq = 110–120 MJ/kg according to Ashby and pq = 46–115 MJ/kg according to Bey and, for copper alloys, between pq = 95–115 MJ/kg and pq = 57–120 MJ/kg, respectively. Assuming energy consumption limits for specific energy consumption, stainless steel features higher pq values than Ashby’s copper alloys, while the opposite is true for Bey. This may change the order of importance for the environment of the compared structures.
- The negative impact of materials on the environment may result from factors other than energy consumption in their production (e.g., emissions of nitrogen oxides, sulphur compounds, and solid particles, the demand for water in production).
- In the calculation example of a bent pole of the standing frame (described in Section 3.1), the results of energy consumption calculations for a pole made of aluminum alloy and a pole made of welded steel profiles were compared. This comparison was carried out using the method of material indicators and the accurate method of calculating mass and energy consumption. Both methods showed a significant advantage of the steel structure over the aluminum structure in terms of environmental loads (energy consumption). Lack of proportionality between the results of the two methods of energy consumption determination (Table 7), as expressed by the ratio cEi/Ei and ratios cEi/cEmin and Et/Emin, confirm the approximate nature of the material indicator method.
- In the second calculation example (Section 3.2), when comparing the energy and material consumption of helical compression springs made of different materials, similar calculation conclusions were obtained as to the lack of adequacy of the indicator method in relation to the accurate calculation method. The indicator method was used by one of the authors [16,17] to construct a quantitative semantic code of spring materials based on the values of mass and material indicators standardized on a scale of 1–10 at different states of quasi-static and dynamic loading. This code is the basis for the selection of spring material from the computer database. Material indicators were also used in the paper [17] of one of the authors for the selection of the optimum spring type.
- Material indices are used as some attempts to estimate quantitatively the comparison of structural materials, taking into consideration the type of load. Their major advantage is the functional form that can be easily used operationally in practical applications during material selection in CAD systems. The assumptions made for the use of components made of materials with comparable shape factors create an important restriction on the use of this method in design. A change of technology (e.g., welded structure replaced by a structure with fixing screws) usually changes shape factors. Such limitations are the reason the main importance of the material indices method is associated with materials science and less practically important in design. The use of the material indices method for material selection in a multi-component design, e.g., a support frame made of fixed-section bars, is hindered since non-uniform loading on components results in differently-used material properties.
The evolution of the indices material selection methods has switched from material consumption and cost-absorption indices to energy consumption indices. The literature review presented in this article shows that the method of material indicators may be too simplistic and, in some cases, lead to the selection of non-optimal material (this conclusion is consistent with the conclusions contained in Ref. [40]). This indicates that applying linguistic values (by fuzzy logic) can significantly improve the adequacy of the selected material in engineering design. Especially by describing the material selection problem as a multi-criteria decision-making (MCDM) problem [41].
Author Contributions
The following co-authors were responsible for: conceptualization, B.B.; methodology, B.B. and M.S.; validation, M.S.; resources, B.B. and M.S.; data curation, M.Z.; writing the draft version of the manuscript, B.B.; writing the final version of the manuscript, formulation of final conclusions—review and editing, M.S.; visualization, M.Z.; supervision, B.B.
Funding
This research received no external funding.
Conflicts of Interest
The authors declare no conflict of interest.
Nomenclature
γ—specific weight; ρ—volumetric mass density; σ—tensile or bending stress; σper—permissible tensile or bending stress; τper—permissible torsion stress; φper—permissible turning angle; A—cross-sectional area; ce—energy index; cq—mass index; cv—volume index; E—modulus of elasticity; F—force; f1—sub-function of functional requirements; f2—sub-function of geometric parameters; f3—sub-function of material properties; fper—permissible deflection; Fmax—maximum force; G—shear modulus; g0—standard acceleration due to gravity; gk—section shape factor; gl—length factor of the bar; Hp—production energy per cubic metre; Io—polar moment of inertia of the section; Ix—axial moment of inertia of the section; kg—permissible bending stress; kj—unit cost; l—bar length; LD—specific stiffness (elongation length), if the deformation is decisive (km); LR—specific strength (breaking length), if the strength is decisive (km); LV—inverse of the specific volume, indicative of the real volume (dm3/N); m—mass; Mg—bending moment; Mgmax—peak bending moment; mv—volume index; n—beam factor of fastening and loading under bending; pq—mass specific energy consumption; pv—volumetric specific energy consumption; Re0,2—yield strength; Rm—ultimate tensile strength (UTS); Sw—bending strength indicator (buckling); T—torsional moment; V—volume of the material; w—load conditions factor; W—work of elastic deformation; W—work; Wo—torsion modulus; Wx—bending modulus; x—safety factor; Zsj—permissible fatigue stress for one-sided torsion.
References
- Ermolaeva, N.S.; Kaveline, K.G.; Spoormaker, J.L. Materials selection combined with optimal structural design: Concept and some results. Mater. Des. 2002, 23, 459–470. [Google Scholar] [CrossRef]
- Hodgson, S.; Harper, J. Effective use of materials in the design process: More than a selection problem. In Proceedings of the DS 33: Proceedings of E&PDE 2004, the 7th International Conference on Engineering and Product Design Education, Delft, The Netherlands, 2–3 September 2004; Lloyd, P., Roozenburg, N., McMahon, C., Brodhurst, L., Eds.; The Design Society: Stockholm, Sweden, 2004; pp. 593–601. [Google Scholar]
- Dehghan-Manshadi, B.; Mahmudi, H.; Abedian, A.; Mahmudi, R. A novel method for materials selection in mechanical design: Combination of non-linear normalization and a modified digital logic method. Mater. Des. 2007, 28, 8–15. [Google Scholar] [CrossRef]
- Rao, R.V.; Davim, J.P. A decision-making framework model for material selection using a combined multiple attribute decision-making method. Int. J. Adv. Manuf. Technol. 2008, 35, 751–760. [Google Scholar] [CrossRef]
- Huang, H.; Zhang, L.; Liu, Z.; Sutherland, J.W. Multi-criteria decision making and uncertainty analysis for materials selection in environmentally conscious design. Int. J. Adv. Manuf. Technol. 2011, 52, 421–432. [Google Scholar] [CrossRef]
- Zarandi, M.H.F.; Mansour, S.; Hosseinijou, S.A.; Avazbeigi, M. A material selection methodology and expert system for sustainable product design. Int. J. Adv. Manuf. Technol. 2011, 57, 885–903. [Google Scholar] [CrossRef]
- Prill, T. Beitrag zur Gestaltung von Leichtbau-Getriebegehäusen und deren Abdichtung/Contribution to the Design of Lightweight Transmission Housings and the Sealing Thereof; Bertsche, B., Wehking, K.-H., Eds.; Berichte aus dem Institut für Maschinenelemente; Institut für Maschinenelemente, Universität Stuttgart: Stuttgart, Germany, 2013; ISBN 978-3-936100-43-3. [Google Scholar]
- Posner, B. Methodik zum Leichtbaugerechten Konzipieren/Methodology for Lightweight Design; Binz, H., Ed.; Bericht/Institut für Konstruktionstechnik und Technisches Design, Universität Stuttgart; Institut für Konstruktionstechnik und Technisches Design, Universität Stuttgart: Stuttgart, Germay, 2016; ISBN 3-922823-96-3. [Google Scholar]
- Kaiser, R. Ein Vorgehensmodell zur Systematischen Werkstoffauswahl in der Frühen Phase der Entwicklung von Fahrzeugstrukturbauteilen/A Process Model for the Systematic Selection of Materials in the Early Phase of the Development of Vehicle Structural Components; Vielhaber, M., Ed.; Der Naturwissenschaftlich-Technischen Fakultät der Universität des Saarlandes: Saarbrücken, Germay, 2017. [Google Scholar]
- Ashby, M.F. Materials Selection in Mechanical Design, 1st ed.; Pergamon Press: Oxford, UK, 1992; ISBN 0-08-041907-0. [Google Scholar]
- Niemann, G. Maschinenelemente: Band, I.; Grundlagen, Verbindungen, Lager, Wellen und Zubehör, 4th ed.; Springer: Berlin/Heidelberg, Germany, 1960. [Google Scholar]
- Kocańda, S. Materiały konstrukcyjne/Design materials. In Podstawy Konstrukcji Maszyn; Maszyny-budowa i konstrukcje; Wydawnictwa Naukowo-Techniczne: Warszawa, Poland, 1964; Volume 1. [Google Scholar]
- Orlov, P.I. Osnovy Konstruirovaniia/Оснoвы кoнструирoвания/Principles of Design, 1st ed.; Машинoстрoение/Masinostrojenije: Moskva, Russia, 1968. [Google Scholar]
- Orlov, P.I. Fundamentals of Machine Design, 1st ed.; Mir Publishers: Moscow, Russia, 1976; Volume 1. [Google Scholar]
- Dietrich, M.; Kocańda, S.; Korewa, W. Podstawy Konstrukcji Maszyn/Fundamentals of Machine Design; Wydawnictwa Naukowo-Techniczne: Warszawa, Poland, 1974; Volume 1. [Google Scholar]
- Branowski, B. Metody Syntezy I Poszukiwań Projektowych Konstrukcji Sprężyn/The Methods of Synthesis and Design Research for the Springs; Rozprawy, Politechnika Poznańska; Wydawnictwo Politechniki Poznańskiej: Poznań, Poland, 1990; Volume 237. [Google Scholar]
- Branowski, B. Sprężyny Metalowe/Metal Coil Springs, Podstawy Konstrukcji Maszyn; Wydawnictwo Naukowe PWN: Warszawa, Poland, 1997; ISBN 83-01-12378-8. [Google Scholar]
- Niemann, G.; Winter, H.; Hoehn, B.R. Maschinenelemente Band, I. Konstruktion und Berechnung von Verbindungen, Lagern, Wellen, 4th ed.; Springer: Berlin/Heidelberg, Germany, 2005; ISBN 978-3-540-25125-5. [Google Scholar]
- Ashby, M.F. Overview No. 80: On the engineering properties of materials. Acta Metall. 1989, 37, 1273–1293. [Google Scholar] [CrossRef]
- Ashby, M.F. Materials Selection in Mechanical Design, 3rd ed.; Elsevier: Amsterdam, The Netherlands, 2005; ISBN 0 7506 6168 2. [Google Scholar]
- Ashby, M.F.; Johnson, K. Materials and Design: The Art and Science of Material Selection in Product Design, 1st ed.; Butterworth-Heinemann: Oxford, UK, 2002; ISBN 978-0-75-065554-5. [Google Scholar]
- Ashby, M.F.; Johnson, K. Materials and Design: The Art and Science of Material Selection in Product Design, 3rd ed.; Butterworth-Heinemann: Oxford, UK, 2013; ISBN 978-0-08-098205-2. [Google Scholar]
- Ashby, M.F.; Jones, J.H.C. Engineering Materials 1. An Introduction to their Properties and Applications, 1st ed.; International Series on Materials Science and Technology; Butterworth-Heinemann: Oxford, UK, 1980; Volume 1, ISBN 978-0-08-026138-6. [Google Scholar]
- Ashby, M.F.; Jones, J.H.C. Engineering Materials 2. An Introduction to Microstructures, Processing and Design, 1st ed.; International Series on Materials Science and Technology; Butterworth-Heinemann: Oxford, UK, 1986; Volume 2, ISBN 978-0-08-032532-3. [Google Scholar]
- Ashby, M.F.; Jones, J.H.C. Engineering Materials 1. An Introduction to their Properties and Applications, 5th ed.; Butterworth-Heinemann: Oxford, UK, 2018; Volume 1, ISBN 978-0-08-102051-7. [Google Scholar]
- Ashby, M.F.; Jones, J.H.C. Engineering Materials 2. An Introduction to Microstructures, Processing and Design, 4th ed.; Butterworth-Heinemann: Oxford, UK, 2012; Volume 2, ISBN 978-0-08-096668-7. [Google Scholar]
- Budynas, R.G.; Nisbett, J.K. Shigley’s Mechanical Engineering Design, 10th ed.; McGraw-Hill Education: New York, NY, USA, 2015; ISBN 978-0-07-339820-4. [Google Scholar]
- Collins, J.A.; Busby, H.; Staab, G. Mechanical Design of Machine Elements and Machines: A Failure Prevention Perspective, 2nd ed.; John Wiley & Sons: New York, NY, USA, 2010; ISBN 0-470-41303-4. [Google Scholar]
- Zakutayev, A.; Wunder, N.; Schwarting, M.; Perkins, J.D.; White, R.; Munch, K.; Tumas, W.; Phillips, C. An open experimental database for exploring inorganic materials. Sci. Data 2018, 5, 180053. [Google Scholar] [CrossRef] [PubMed] [Green Version]
- Ashby, M.F. Materials and the Environment. Phys. Status Solidi (a) 1992, 131, 625–638. [Google Scholar] [CrossRef]
- Cotetiu, R. Eco-design aspects of product and technologies, development of mechanical engineering as tool for enterprise logistics progress. In Development of Mechanical Engineering as a Tool for the Enterprise Logistics Progress; Legutko, S., Ed.; Poznan University of Technology, Division of Technology Planning: Poznań, Poland, 2006; pp. 159–177. ISBN 83-89873-28-1. [Google Scholar]
- Kurczewski, P.; Lewandowska, A. Zasady Prośrodowiskowego Projektowania Obiektów Technicznych dla Potrzeb Zarządzania ich Cyklem Życia/Principles of Pro-Environmental Design of Technical Objects for their Lifecycle Management; Politechnika Poznańska/KMB DRUK: Poznań, Poland, 2008; ISBN 978-83-61352-20-4. [Google Scholar]
- Ashby, M.F.; Didac, F.B.; Coral, J.S. Materials and Sustainable Development, 1st ed.; Butterworth-Heinemann: Oxford, UK, 2015; ISBN 978-0-08-100176-9. [Google Scholar]
- Lewandowska, A.; Branowski, B.; Joachimiak-Lechman, K.; Kurczewski, P.; Selech, J.; Zablocki, M. Sustainable Design: A Case of Environmental and Cost Life Cycle Assessment of a Kitchen Designed for Seniors and Disabled People. Sustainability 2017, 9, 1329. [Google Scholar] [CrossRef]
- Telenko, C.; Seepersad, C.C.; Webber, M.E. A compilation of design for environment principles and guidelines. In Proceedings of the ASME 2008 International Design Engineering Technical Conferences and Computers and Information in Engineering Conference, New York, NY, USA, 3–6 August 2008; pp. 289–301. [Google Scholar]
- Ashby, M.F.; Shercliff, H.; Cebon, D. Materials: Engineering, Science, Processing and Design, 4th ed.; Butterworth-Heinemann: Oxford, UK, 2018; ISBN 0-08-102377-4. [Google Scholar]
- Ashby, M.F. Dobór Materiałów Projektowaniu Inżynierskim/Materials Selection in Mechanical Design; Wydawnictwa Naukowo-Techniczne: Warszawa, Poland, 1998; ISBN 83-204-2167-5. [Google Scholar]
- Bey, N. The Oil Point Method-A Tool for Indicative Environmental Evaluation in Material and Process Selection. Ph.D. Thesis, Department of Management Engineering, Technical University of Denmark, Lyngby, Denmark, 2000. [Google Scholar]
- Meissner, M.; Fischer, F.; Wanke, K.; Plitzko, M. Die Geschichte der Metallfedern und der Federntechnik in Deutschland/The History of Metal Springs and Spring Technology in Germany; Universitätsverlag Ilmenau: Ilmenau, Germany, 2009; ISBN 978-3-939473-64-0. [Google Scholar]
- Jahan, A.; Ismail, M.; Sapuan, S.; Mustapha, F. Material Screening and Choosing Methods—A Review. Mater. Des. 2010, 31, 696–705. [Google Scholar] [CrossRef]
- Babanli, M.; Prima, F.; Vermaut, P.; Demchenko, L.; Titenko, A.; Huseynov, S.; Hajiyev, R.; Huseynov, V. Material selection methods: A review. In Proceedings of the 13th International Conference on Theory and Application of Fuzzy Systems and Soft Computing—ICAFS-2018, Warsaw, Poland, 27–28 August 2018; Aliev, R.A., Kacprzyk, J., Pedrycz, W., Jamshidi, M., Sadikoglu, F.M., Eds.; Springer Nature: Cham, Switzerland, 2018; Volume 896, pp. 929–936. [Google Scholar]
Figure 1.
Criteria of descriptive classification of spring materials in a CAD system for spring design in 1997 (source: [17]).
Figure 1.
Criteria of descriptive classification of spring materials in a CAD system for spring design in 1997 (source: [17]).

Figure 2.
Quantitative code of the values (standardized in the 0–9 point scale) relating to volume, mass, and material cost of a spring (source [17]).
Figure 2.
Quantitative code of the values (standardized in the 0–9 point scale) relating to volume, mass, and material cost of a spring (source [17]).

Figure 3.
A selection chart for strength with minimum production energy (based on Ashby 2005 [20]) (The darker areas in the figure highlight structural materials used for the analysis in the further part of this paper (in Section 3.1)).
Figure 3.
A selection chart for strength with minimum production energy (based on Ashby 2005 [20]) (The darker areas in the figure highlight structural materials used for the analysis in the further part of this paper (in Section 3.1)).

Figure 4.
Mobile rehabilitation standing frame (a) and dimensional system of the support column of the mobile standing frame made of aluminum alloys (b) and steel (c) (based on the unpublished result of project PBS1/A6/5/2012 financed by the Polish National Centre for Research and Development).
Figure 4.
Mobile rehabilitation standing frame (a) and dimensional system of the support column of the mobile standing frame made of aluminum alloys (b) and steel (c) (based on the unpublished result of project PBS1/A6/5/2012 financed by the Polish National Centre for Research and Development).


Table 1.
Stiffness, strength, and mass indices as assumed by Orlov in 1968. (source: [14] after [13]).
| Parameter | Parts with: | |||
|---|---|---|---|---|
| a) Similar Shapes | b) Equal Stiffness | c) Equal Strength | d) Equal Mass | |
| Mass Q | ρ | ρ/E | ρ/Rm | constans |
| Stiffness S | E | constans | E/Rm | E/ρ |
| Strength R = f (x, Fmax) | Rm | Rm/E | constans | Rm/ρ |
| Relative stiffness S/Q | Tension/compression E/ρ | Bending E1/2/ρ | Torsion G1/2/ρ | |
| Relative strength Fmax//R | Rm/ ρ | |||
Table 2.
Volume index υv of bars for various load capacity criteria as assumed by Korewa et al. in 1974 (source: [15]).
Table 2.
Volume index υv of bars for various load capacity criteria as assumed by Korewa et al. in 1974 (source: [15]).
| Bar | Strength | Stiffness | Elasticity | ||||||||||||||||||||
|---|---|---|---|---|---|---|---|---|---|---|---|---|---|---|---|---|---|---|---|---|---|---|---|
| cv | = | mv | × | gk | × | gl | cv | = | mv | × | gk | × | gl | × | w | cv | = | mv | × | gk | × | w | |
| during tension/compression | = | × | 1 | × | = | E | × | 1 | × | × | = | × | 1 | × | 1 | ||||||||
| during bending | = | × | × | = | × | × | × | = | × | × | |||||||||||||
| during torsion | = | × | × | = | × | × | × | = | × | × | 1 | ||||||||||||
n = 3 for a cantilever beam, n = 48 for a single-span beam with joint fastening, n = 192 for a single-span beam with rigid fastening.
Table 3.
Material and cost data for selected structural materials according to Niemann, Winter, and Hőhn. (source: [18]).
Table 3.
Material and cost data for selected structural materials according to Niemann, Winter, and Hőhn. (source: [18]).
| Material | ρ kg/dm3 | E N/mm2 | Rm N/mm2 | LV dm3/N | LR km | LD km | Relative Prices | ||
|---|---|---|---|---|---|---|---|---|---|
| kg | dm3 | ||||||||
| Metal profiles: | |||||||||
| 1 | Steel S235 | 7.85 | 210,000 | 360 | 0.0130 | 4.7 | 2727 | 1.00 | 1.00 |
| 2 | Steel E295 | 7.85 | 210,000 | 490 | 0.0130 | 6.4 | 2727 | 1.10 | 1.10 |
| 3 | Spring steel Si-Mn | 7.85 | 210,000 | 1300 | 0.0130 | 16.5 | 2727 | 1.67 | 1.67 |
| 4 | Pure aluminum (hard) Al | 2.70 | 71,000 | 140 | 0.0377 | 5.2 | 2681 | 1.60 | 0.55 |
| 5 | Al-Cu-Mg-Pb | 2.85 | 73,000 | 370 | 0.0358 | 13.2 | 2611 | 2.90 | 1.05 |
| 6 | Al-Mg 5 | 2.64 | 72,000 | 250 | 0.0386 | 9.7 | 2780 | 3.90 | 1.31 |
| 7 | Mg-Al | 1.80 | 43,000 | 280 | 0.0566 | 15.9 | 2435 | 3.00 | 0.69 |
| 8 | Titanium 99.7 | 4.50 | 105,000 | 350 | 0.0226 | 7.9 | 2378 | 31.7 | 18.2 |
| Simple cast parts: | |||||||||
| 9 | EN-GJL-200 | 7.20 | 100,000 | 200 | 0.0141 | 2.8 | 1415 | 2.00 | 1.83 |
| 10 | GS 45 | 7.85 | 215,000 | 450 | 0.0130 | 5.7 | 2792 | 4.00 | 4.00 |
| 11 | Cast Al alloy | 2.65 | 70,000 | 220 | 0.0385 | 8.5 | 2693 | 2.80 | 0.95 |
| 12 | Cast Mg alloy | 1.80 | 42,000 | 240 | 0.0566 | 13.6 | 2378 | 3.10 | 0.71 |
| Plastic and wood boards: | |||||||||
| 13 | Hard PVC up to 55 °C | 1.38 | 3000 | 55 | 0.0739 | 4.0 | 221.6 | 3.33 | 0.59 |
| 14 | Polystyrol up to 60°C | 1.05 | 3200 | 75 | 0.0971 | 7.0 | 310.7 | 4.33 | 0.58 |
| 15 | Polyamide up to 90 °C | 1.14 | 1700 | 60 | 0.0894 | 5.3 | 152.0 | 11.7 | 1.67 |
| 16 | Polyester resin up to 70°C with glass fibre (GFK) | 1.10 | 3200 | 50 | 0.0927 | 4.2 | 296.5 | 4.83 | 0.67 |
| 17 | Reinforced mat (up to 50 °C) | 1.60 | 13,000 | 150 | 0.0637 | 9.4 | 828.2 | 8.33 | 1.70 |
| 18 | Reinforced fabric (up to 65 °C) | 1.90 | 27,000 | 340 | 0.0536 | 18.0 | 1448.6 | 14.2 | 3.44 |
| 19 | Reinforced roving (up to 70 °) | 2.0 | 33,000 | 630 | 0.0510 | 24.4 | 1682.0 | 9.16 | 2.12 |
| 20 | Hard fabric 2082.5 | 1.35 | 7000 | 60 | 0.0755 | 4.5 | 528.6 | 4.30 | 0.74 |
| 21 | Wood (beechwood) | 0.72 | 12,000 | 13 0 | 0.1416 | 18.0 | 1698.0 | 0.10 | 0.01 |
Relationships: ; ; .
Table 4.
Mass indices under various loads (based on: [18]).
Table 4.
Mass indices under various loads (based on: [18]).
| Load Type | Load Exerted by | Limit Value | Mass Index cq | Energy Index ce |
|---|---|---|---|---|
| Tension (compression) | F | σper | ρ/σper | cq∙pq |
| fper | ρ/E | cq∙pq | ||
| W | σper | ρ∙E/σ2per | cq∙pq | |
| Compression (buckling) | F | Sw | ρ/E1/2 | cq∙pq |
| Beam bending | Mg | σper | ρ/σ2/3per | cq∙pq |
| fper | ρ/E1/2 | cq∙pq | ||
| W | σper | ρ∙E/σ2per | cq∙pq | |
| Board bending (b and l–known, t–variable) | Mg | σper | ρ/σ1/2per | cq∙pq |
| fper | ρ/E1/3 | cq∙pq | ||
| W | σper | ρ∙E/σ2per | cq∙pq | |
| Torsion | T | τper | ρ /τ2/3per | cq∙pq |
| φper | ρ /E1/3 | cq∙pq | ||
| W | τper | ρ/τ2per | cq∙pq |
Table 5.
Specific energy consumption of materials.
| Material | Specific Energy Consumption | ||
|---|---|---|---|
| pq (MJ/kg) According to Ashby 1998 [37] | pq (MJ/kg) According to Bey 2000 [38] | pv (GJ/m3) According to Ashby 1998 [37] | |
| Metals | |||
| Magnesium alloys | 410–420 | 212–490, average 400 | 717–756 |
| Cast irons | 60–260 | – | 468–1500 |
| Aluminum alloys | 290–305 | 142–335, average190 | 754–884 |
| Stainless steels | 110–120 | 46–115, average 70 | 825–972 |
| Copper and its alloys | 95–115 | 57–120, average 80 | 712–1035 |
| Zinc and its alloys | 67–73 | 53–145, average 90 | 348–525 |
| Carbon steel | 50–60 | 30–72, average 45 | 390–468 |
| Lead and its alloys | 28–32 | – | 300–360 |
| Polymers | |||
| Polyamide 66 | 170–180 | 156–180 | 187–216 |
| Polypropylene | 108–113 | 74–110 | 93–102 |
| Low-density polyethylene | 103–120 | 75–110 | 97–116 |
| High-density polyethylene | 80–104 | 85–120 | 73–94 |
| Polystyrene | 90–140 | 96–104 | 96–154 |
| Polyvinyl chloride | 67–92 | 57–106 | 87–147 |
| Synthetic rubber | 120–140 | 84–150 | 108–126 |
| Natural rubber | 5.5–6.5 | – | 5–6 |
| Composites | |||
| GFRP (Glass Fiber Reinforced Polymer) | 90–120 | 60–150 | 160–220 |
| CFRP (Carbon Fiber Reinforced Polymer) | 130–300 | 300–700 | 230–540 |
| Glass fibres | 38–64 | 10–34 | 95–160 |
| Hardwood and softwood | 1.8–4.0 | 17–46 | 1.2–3.6 |
Table 6.
Material data of the support column design.
| Material | E | ρ | Rm | Re | kg = Re/x | Mgmax | pq |
|---|---|---|---|---|---|---|---|
| N/mm2 | kg/m3 | N/mm2 | N/mm2 | N/mm2 | Nm | MJ/kg | |
| AlMgSi0,5F25 (T6) | 70,000 | 2700 | 245 | 195 | 55,7 | 1309 | 190 |
| AlMgSi0,5F19 (T6) | 70,000 | 2700 | 190 | 150 | 42,8 | 1006 | 190 |
| St3VC | 210,000 | 7860 | 360 | 235 | 145 | 856 | 45 |
| 18G2AC | 210,000 | 7860 | 490 | 355 | 177 | 1044 | 45 |
Table 7.
Data of the material consumption index and the energy consumption index of the support column design.
Table 7.
Data of the material consumption index and the energy consumption index of the support column design.
| Material | cq = ρ/kg2/3 | cqi/cqmin | ce = pq∙cq | cei/cESt3 | m (kg) | mi/mmin | E (MJ) | Ei/Emin |
|---|---|---|---|---|---|---|---|---|
| AlMgSi0.5F25 (T6) | 185 | 1.54 | 35172 | 2.74 | 2.781 | 1.27 | 528 | 5.33 |
| AlMgSi0.5F19 (T6) | 221 | 1.29 | 41925 | 3.27 | 2.781 | 1.27 | 528 | 5.33 |
| St3VC | 285 | 1.00 | 12815 | 1.00 | 2.198 | 1.00 | 99 | 1.00 |
| 18G2AC | 249 | 1.14 | 11219 | 0.87 | 2.198 | 1.00 | 99 | 1.00 |
Table 8.
Basic structural properties of springs.
| Spring | Type of Material | Breaking Strength Rm (N/mm2) | Coefficient of Transverse Elasticity G (N/mm2) | Density ρ (kg/dm3) | Specific Energy Consumption pq (MJ/kg) (Acc. to M.F. Ashby Table 5) |
|---|---|---|---|---|---|
| A | patented steel unalloyed wire according to DIN 17223 Part 1, type B | 1650 | 80,400 | 7.85 | 55 on average |
| B | stainless steel wire according to DIN 17224, type X12CrNi177 | 1850 | 73,000 | 7.80 | 115 on average |
| C | beryllium bronze wire according to DIN 17682, type CuBe2 | 1250 | 47,000 | 8.90 | 105 on average |
Table 9.
Design parameters of springs (geometrical, elastic, and strength characteristics).
| Spring Parameters | A | B | C | |
|---|---|---|---|---|
| wire diameter d (mm) | 2.0 | 2.0 | 2.5 |  |
| average diameter of the spring in the non-load condition D (mm) | 14.0 | 14.0 | 14.0 | |
| total number of turns nt | 9.5 | 9.5 | 7.0 | |
| active number of turns n | 8.0 | 8.0 | 5.5 | |
| locking deflection sbl (mm) | 19.0 | 19.0 | 17.5 | |
| minimum sum of the inter-turn gaps Σamin (mm) | 1.6 | 1.6 | 1.4 | |
| deflection sn corresponding to force Fn (mm) | 16.5 | 16.5 | 10.8 | |
| spring length in the non-load condition D (mm) | 40.0 | 40.0 | 29.7 | |
| spring wire volume V (mm3) | 1313 | 1313 | 1511 | |
| mass M (kg) | 0.0103 | 0.0104 | 0.0135 | |
| τn/Rm ratio | 0.32 | 0.26 | 0.13 | |
| stiffness R (N/mm) | 7.1 | 7.3 | 15.2 | |
| force Fn (N) | 118 | 109 | 164 | |
| impact work W (Nm) | 0.974 | 0.899 | 0.886 |
Table 10.
Comparison of calculation methods for energy and material consumption of springs.
| Spring | cE | cE/cEmin | E (MJ) | E/Emin | M (kg) | M/Mmin |
|---|---|---|---|---|---|---|
| A | 141.7 | 1 | 0.57 | 1 | 0.0103 | 1 |
| B | 212.6 | 1.50 | 1.20 | 2.1 | 0.0104 | 1.01 |
| C | 312.3 | 2.20 | 1.42 | 2.5 | 0.0135 | 1.31 |
© 2019 by the authors. Licensee MDPI, Basel, Switzerland. This article is an open access article distributed under the terms and conditions of the Creative Commons Attribution (CC BY) license (http://creativecommons.org/licenses/by/4.0/).
Share and Cite
MDPI and ACS Style
Branowski, B.; Zabłocki, M.; Sydor, M. The Material Indices Method in the Sustainable Engineering Design Process: A Review. Sustainability 2019, 11, 5465. https://0-doi-org.brum.beds.ac.uk/10.3390/su11195465
AMA Style
Branowski B, Zabłocki M, Sydor M. The Material Indices Method in the Sustainable Engineering Design Process: A Review. Sustainability. 2019; 11(19):5465. https://0-doi-org.brum.beds.ac.uk/10.3390/su11195465
Chicago/Turabian StyleBranowski, Bogdan, Marek Zabłocki, and Maciej Sydor. 2019. "The Material Indices Method in the Sustainable Engineering Design Process: A Review" Sustainability 11, no. 19: 5465. https://0-doi-org.brum.beds.ac.uk/10.3390/su11195465
Note that from the first issue of 2016, this journal uses article numbers instead of page numbers. See further details here.