Sustainability of Circular Economy Indicators and Their Impact on Economic Growth of the European Union


1
Faculty of Business Administration in Foreign Languages, Bucharest University of Economics Studies, 6 Piata Romana, 010374 Bucharest, Romania
2
Faculty of Agrifood and Environmental Economics, Bucharest University of Economic Studies, 6 Piata Romana, 1st district, 010374 Bucharest, Romania
*
Author to whom correspondence should be addressed.
Sustainability 2019, 11(19), 5481; https://0-doi-org.brum.beds.ac.uk/10.3390/su11195481
Submission received: 5 August 2019
/
Revised: 20 September 2019
/
Accepted: 1 October 2019
/
Published: 3 October 2019
(This article belongs to the Collection Circular Economy and Sustainable Strategies)
Abstract
:In this paper, we develop a methodology for studying the sustainability of the circular economy model, based on environmental indicators, and its impact on European Union (EU) economic growth. In open-end systems, waste is converted back to materials and objects through recycling; hence, a linear economy is transformed into a circular economy (CE). Environmental factors support the argument for the sustainable implementation of a circular economy. The main objective of this paper is to analyze the sustainability of the CE indicators and to elaborate a multilinear regression model with panel data for determining the dependency of the main CE factors on EU economic growth. Starting with the model of economic growth based on circular material use rate, recycling rate of municipal waste (RRMW), trade in recycling materials, labor productivity, environmental taxes, and resource productivity as independent variables, six statistical hypotheses were validated through a multiple regression model with the use of the statistical software EViews 11. The research study was conducted for 27 EU countries, and the data was collected from the European Union Statistical Office (EUROSTAT), during the time frame 2010 to 2017. Based on econometric modeling, the paper highlights that circular economy generates sustainable economic growth across the EU.
1. Introduction
Anthropological evolutionary studies have highlighted the risk factors facing society as a whole. Population growth cannot be sustained worldwide at the same rate as the finite natural resources. Industrial development and its impact on climate change as a result of the environmental pollution represent another major harm affecting the ecosystem. In this regard, the European Commission (EC) has proposed a strategy in the field of circular economy (CE) [1], which identifies the risks generated by geopolitics and recommends a list of objectives to be achieved, including adaptation to climate change, reducing dependence on finite resources and its effects, food security, and job growth in rural areas.
In order to achieve these goals, as set by the EC, the transition to the circular economy implies the knowledge and awareness of the way a CE model functions—respectively, information about the recycling systems, economic goals, and governmental policy—in order to determine the stage of the transition process. The next step is economic modelling, to achieve the expectations of the decision makers. Economic studies applied in the CE field will be those that will contribute significantly to the expertise in the field of recycling and biomass reuse by means of biotechnology.
There are plenty of CE models in the economic literature. Rick Bosman and Jan Rotmans compared the two sustainability models of the transition to the circular economy in Finland and Netherlands. Their research paper [2] contains a series of guidelines adapted to the economic conditions of the two states. Out of these, we note the authors’ suggestion for the development of partnerships between public and private, whereby both private environment and public decision-makers work together and find the best solutions to solve issues in the transition from linear to circular economy. Inevitably, demographic development and consumer preferences are considered as the main determinants of the sustainability of the circular economy [3].
A management system for the development of the circular economy should know what the provisions are for converting a linear economy into a circular economy. The sustainability of the transition models was analyzed by a recent paper [4]. The modeling of sectoral inter-dependencies requires both qualitative and quantitative analysis. For this reason, there is no perfect integrative management model that in aggregate captures all the exogenous variables, for reasons that, as can be seen, are related to the permanent evolution of the dependencies and the multitude of the indicators.
In order to make valuable economic analyses, it is necessary to adapt to the economic situation of each country, adjusted according to the member state policy and the demand from the private environment for the products obtained from recyclable materials and for bioenergy [5]. This specific context is useful in the process of decision-making, for developing a technology suitable for recyclable materials, and for evaluating the contributions of these sectors in producing positive externalities on the production and competition recorded in other complementary sectors, such as in the chemical or in the biofuel industry. Nowicki et al. [6] performed a thoroughly economic study at the level of economic subsectors; thus, the analysis was performed for products that might have bio-ingredients.
From the economic models perspective, a classification of research works could be done into general equilibrium models for the analysis of multi-sectoral interdependencies; those done at the macro level, developed by some researchers [7,8]; equilibrium economic models, applicable to certain economic sectors [9]; and those defined as partial models and bottom-up models [10], which answer circumstantial questions related to procedural, technological, or behavioral evolution, studying developmental aspects of recyclable sources, and the ecological and economic effects resulting from these operations.
Research analyses at the EU level have common landmarks that are crucial for a contextual analysis. This is mainly due to the common features of the two projects launched at EU level by the EC, underpinning the framework for assessing the transition to a sustainable circular economy. The first study was released in 2012, and it relates to the set of analytical tools to respond to the EU Strategy on the Circular Economy within the EU Seventh Framework Programme. This research takes an inventory of industries with the potential of generating products from recyclable materials, and describes the barriers in the progress of the new industry. The second study was released by the EC in 2013, and its objective was to integrate the data collected from the first study and conceptualize them in an artificial intelligence system. The model illustrates the connection between environmental factors and society. The system of management is described by human use, consumerism, technological progress and innovation, limited resources, and not least by government programs.
From the perspective of the transition to a sustainable circular economy with significant impact on economic growth, in the EU countries, the potential of the production of recyclable materials, such as in the zootechnic, bioindustry, fish farming, pharmaceutical, and chemical industries, can be relevant. Economic reforms, as well as adopted environmental and research policies, that set organizational forms are necessary elements to turn negative effects into benefits for the circular economy.
The objective of the present paper is to develop an assessment model of the interdependencies of the economic sectors, taking into account the independent variables, such as the circular material use rate, the recycling rate of municipal waste (RRMW), trade in recycling materials, real labor productivity, environmental taxes, and resource productivity.
According to Yamamoto and Hosoda [11], CE refers to the recycling-based economy of 3R (reduce, reuse and recycle), comparing to the linear model of production, consumption, and disposal. In order to vitalize this sector and contribute to a CE, an EU waste policy was created to manage the necessary framework to implement waste management strategies. Nowadays, legal regulations, such extended producer responsibility (EPR) standards, add to the sustainability requirements in the business sectors, as they impose on manufacturers to organize and reimburse for the treatment and reintegration of their products at the end of the life cycle, which is acknowledged as being effective for contributing to a CE [12]. Recycling is a key factor in the CE in terms of waste management procedures, which implies biological treatment or material recycling, namely anaerobic digestion and composting, according to Lakatos et al. [13].
This paper has the following structure. Firstly, we make a statistical description of the independent variables used in the paper. Then, the multiple regression model is estimated. Finally, the research hypotheses are validated. Further research, limitations of the study, and conclusions are summarized in the last section of the article.
2. Materials and Methods
2.1. Research Methodology
The impact of circular economy indicators on economic growth has been investigated by many researchers. It has been proven that a CE has a significant impact on economic growth [14,15,16]. Other researchers [17,18,19] have concluded that circular material use rate and productivity of the resources are strongly correlated with economic growth.
Furthermore, while some authors [20,21] argue that the RRMW has a significant impact on economic growth, other researchers [22,23,24] emphasize that real labor productivity and environmental taxes are strongly correlated with economic growth. Moreover, other economists [25,26] underline that circular material use rate and trade in recycling materials are strongly correlated with economic growth.
We formulate our research question based on the empirical results stated above: “What is the CE’s impact on economic growth at the EU level?”. Our goal is to make an estimation of the six explanatory variables used in our research—namely, the RRMW, circular material use (CMU) rate, trade in recycling materials, real labor productivity, environmental taxes, and resource productivity—and their impact on economic growth. Following the empirical studies mentioned above, these explanatory factors are some of the most important indicators of the CE.
We start our analysis with formulating statistical hypotheses (see Table 1).
2.2. Circular Economy Indicators in European Union Countries
As opposed to the traditional economy, CE is developing economic models to better use the resources. In our study, six macroeconomic factors to describe CE were used, and their impact on economic growth was analyzed. In our model, the six indicators will be the independent factors of the regression model.
A description of the dependent variable in the model (Y) and the six independent variables (X1–X6) can be seen in Table 2.
2.3. Research Methodology
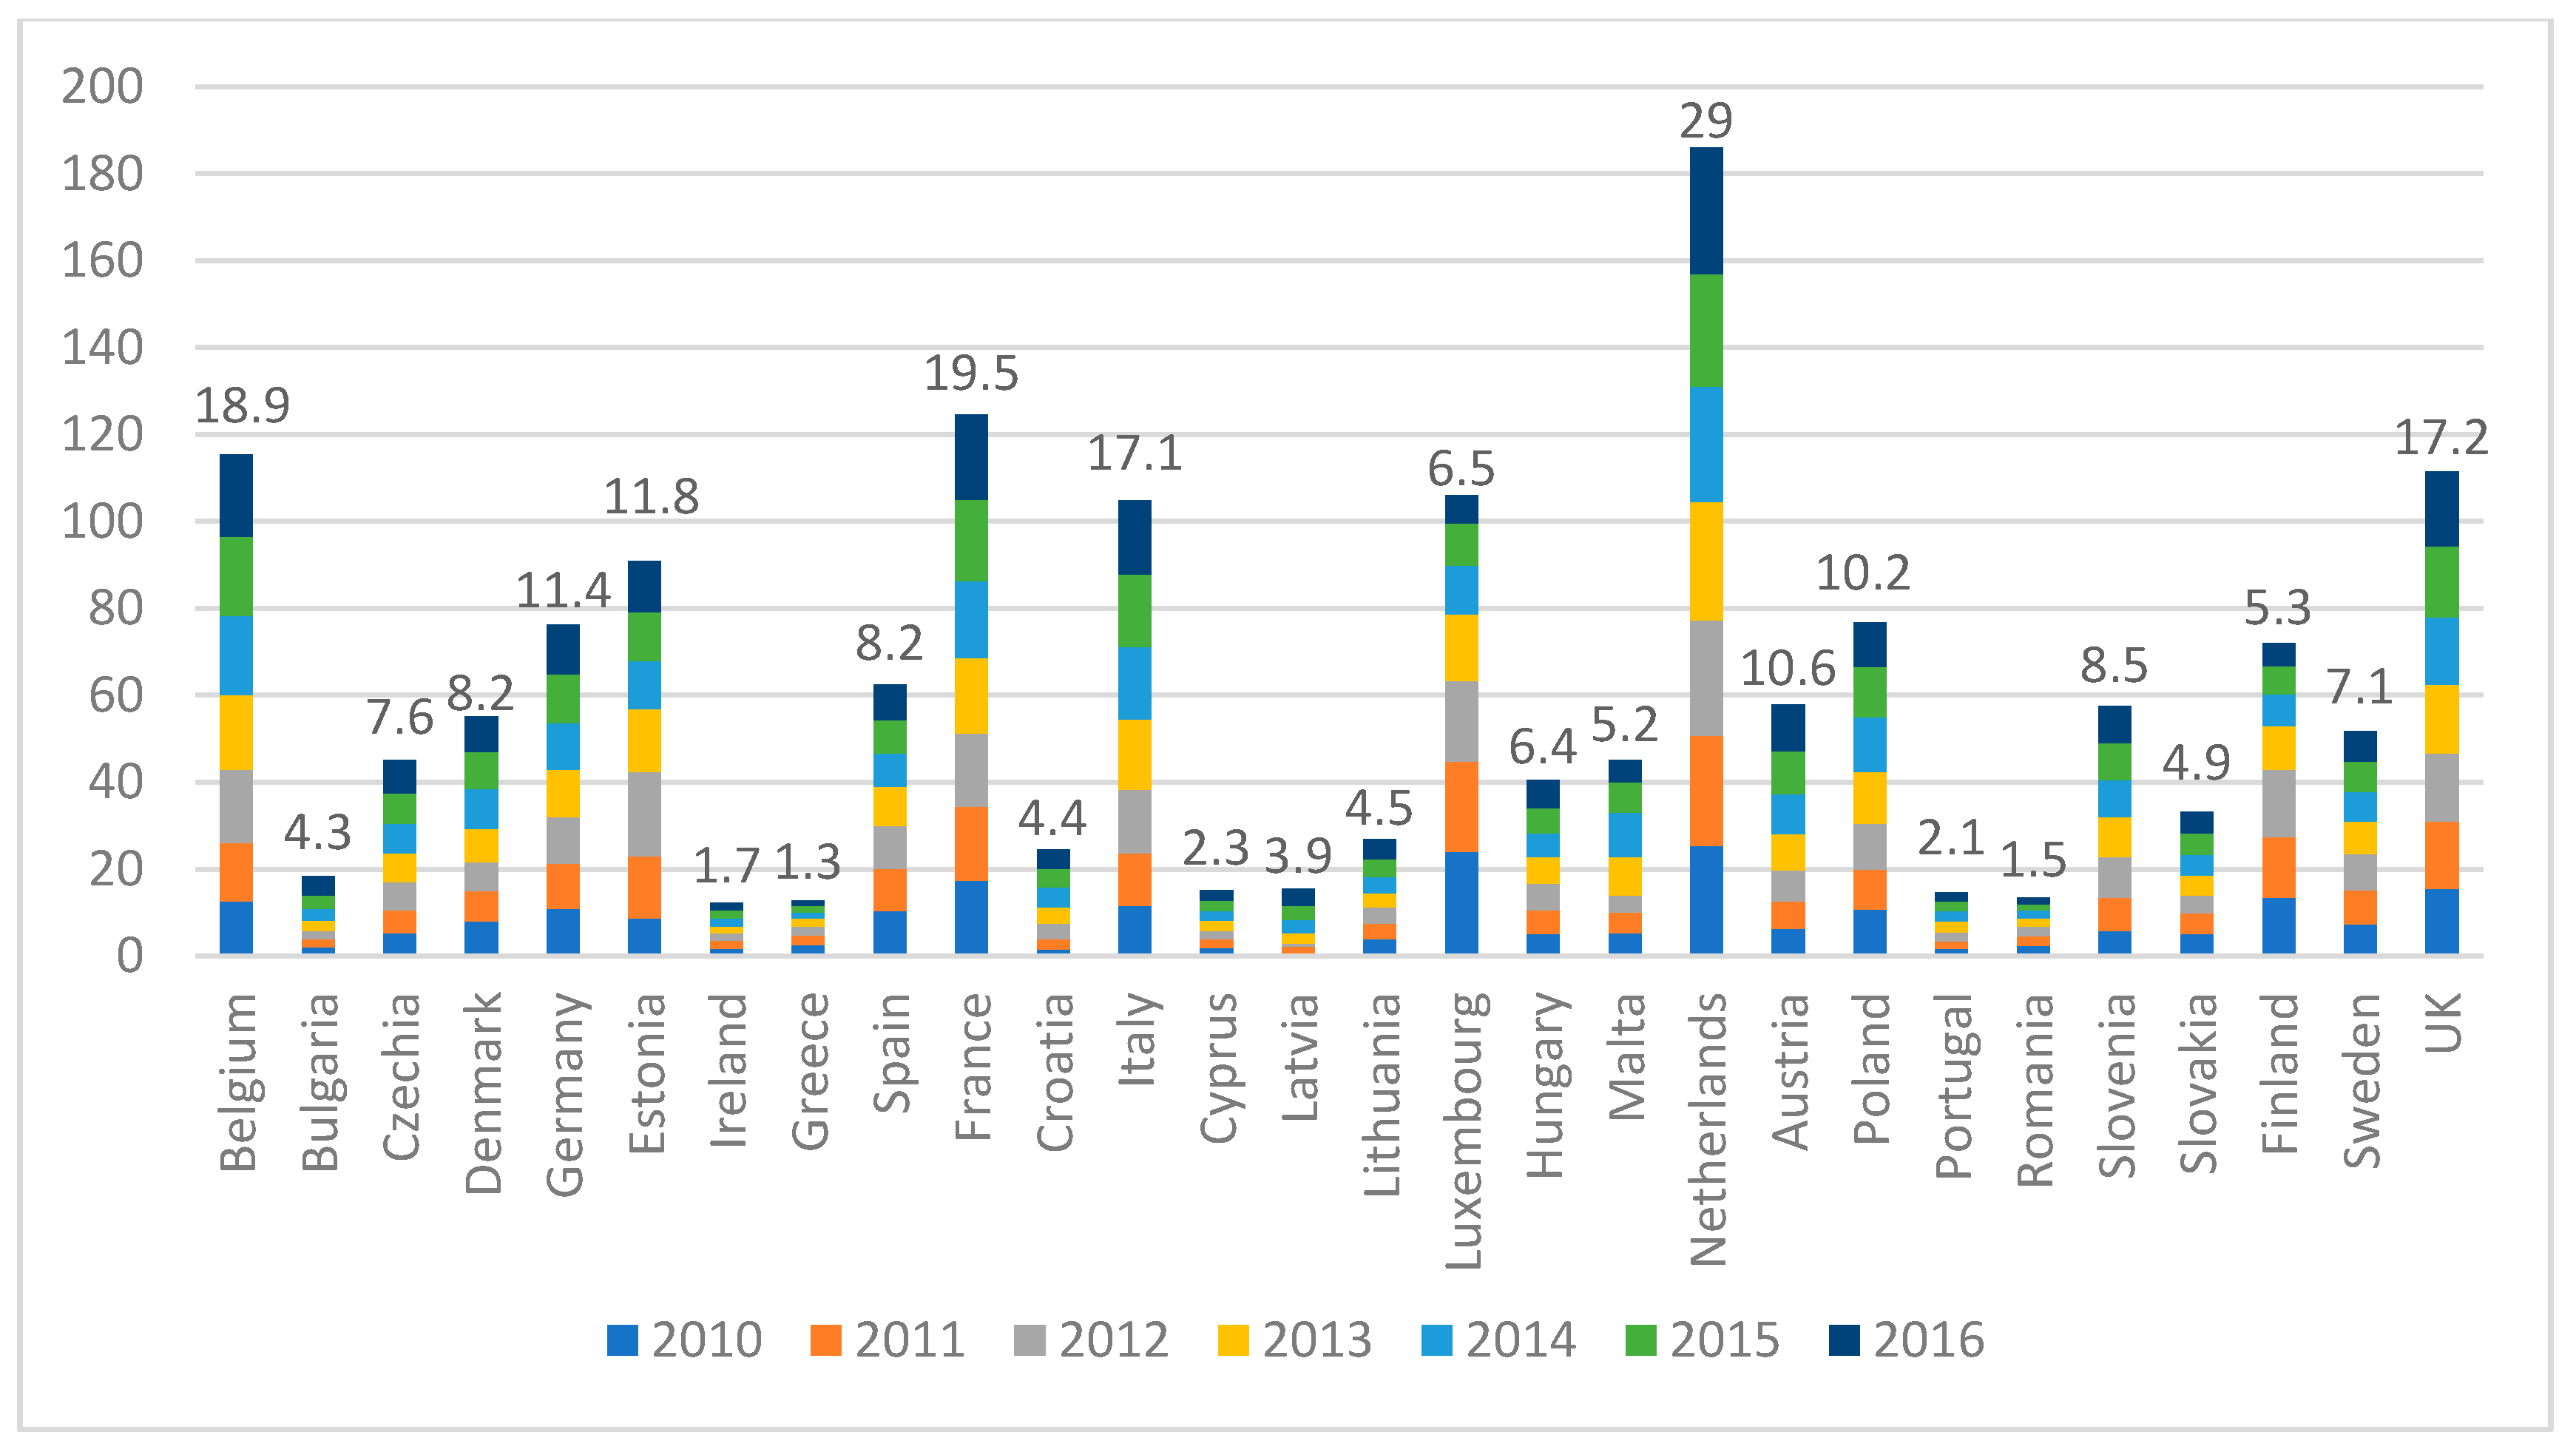
Figure 1, Figure 2, Figure 3, Figure 4, Figure 5 and Figure 6 represent the evolution of the CE indicators at the EU level from 2010 to 2017. The first analyzed indicator is the “circular material use rate” [27]. The CMU rate is calculated as the quotient between the circular use of materials and the total material used. The evolution of this indicator in EU member states, from 2010 to 2017, can be seen in Figure 1.
From Figure 1, we can observe that on the top rankings of CMU are the Netherlands (29%), France (19.5%), and Belgium (18.9%), while in last place are Ireland (1.7%), Romania (1.5%), and Greece (1.3%).
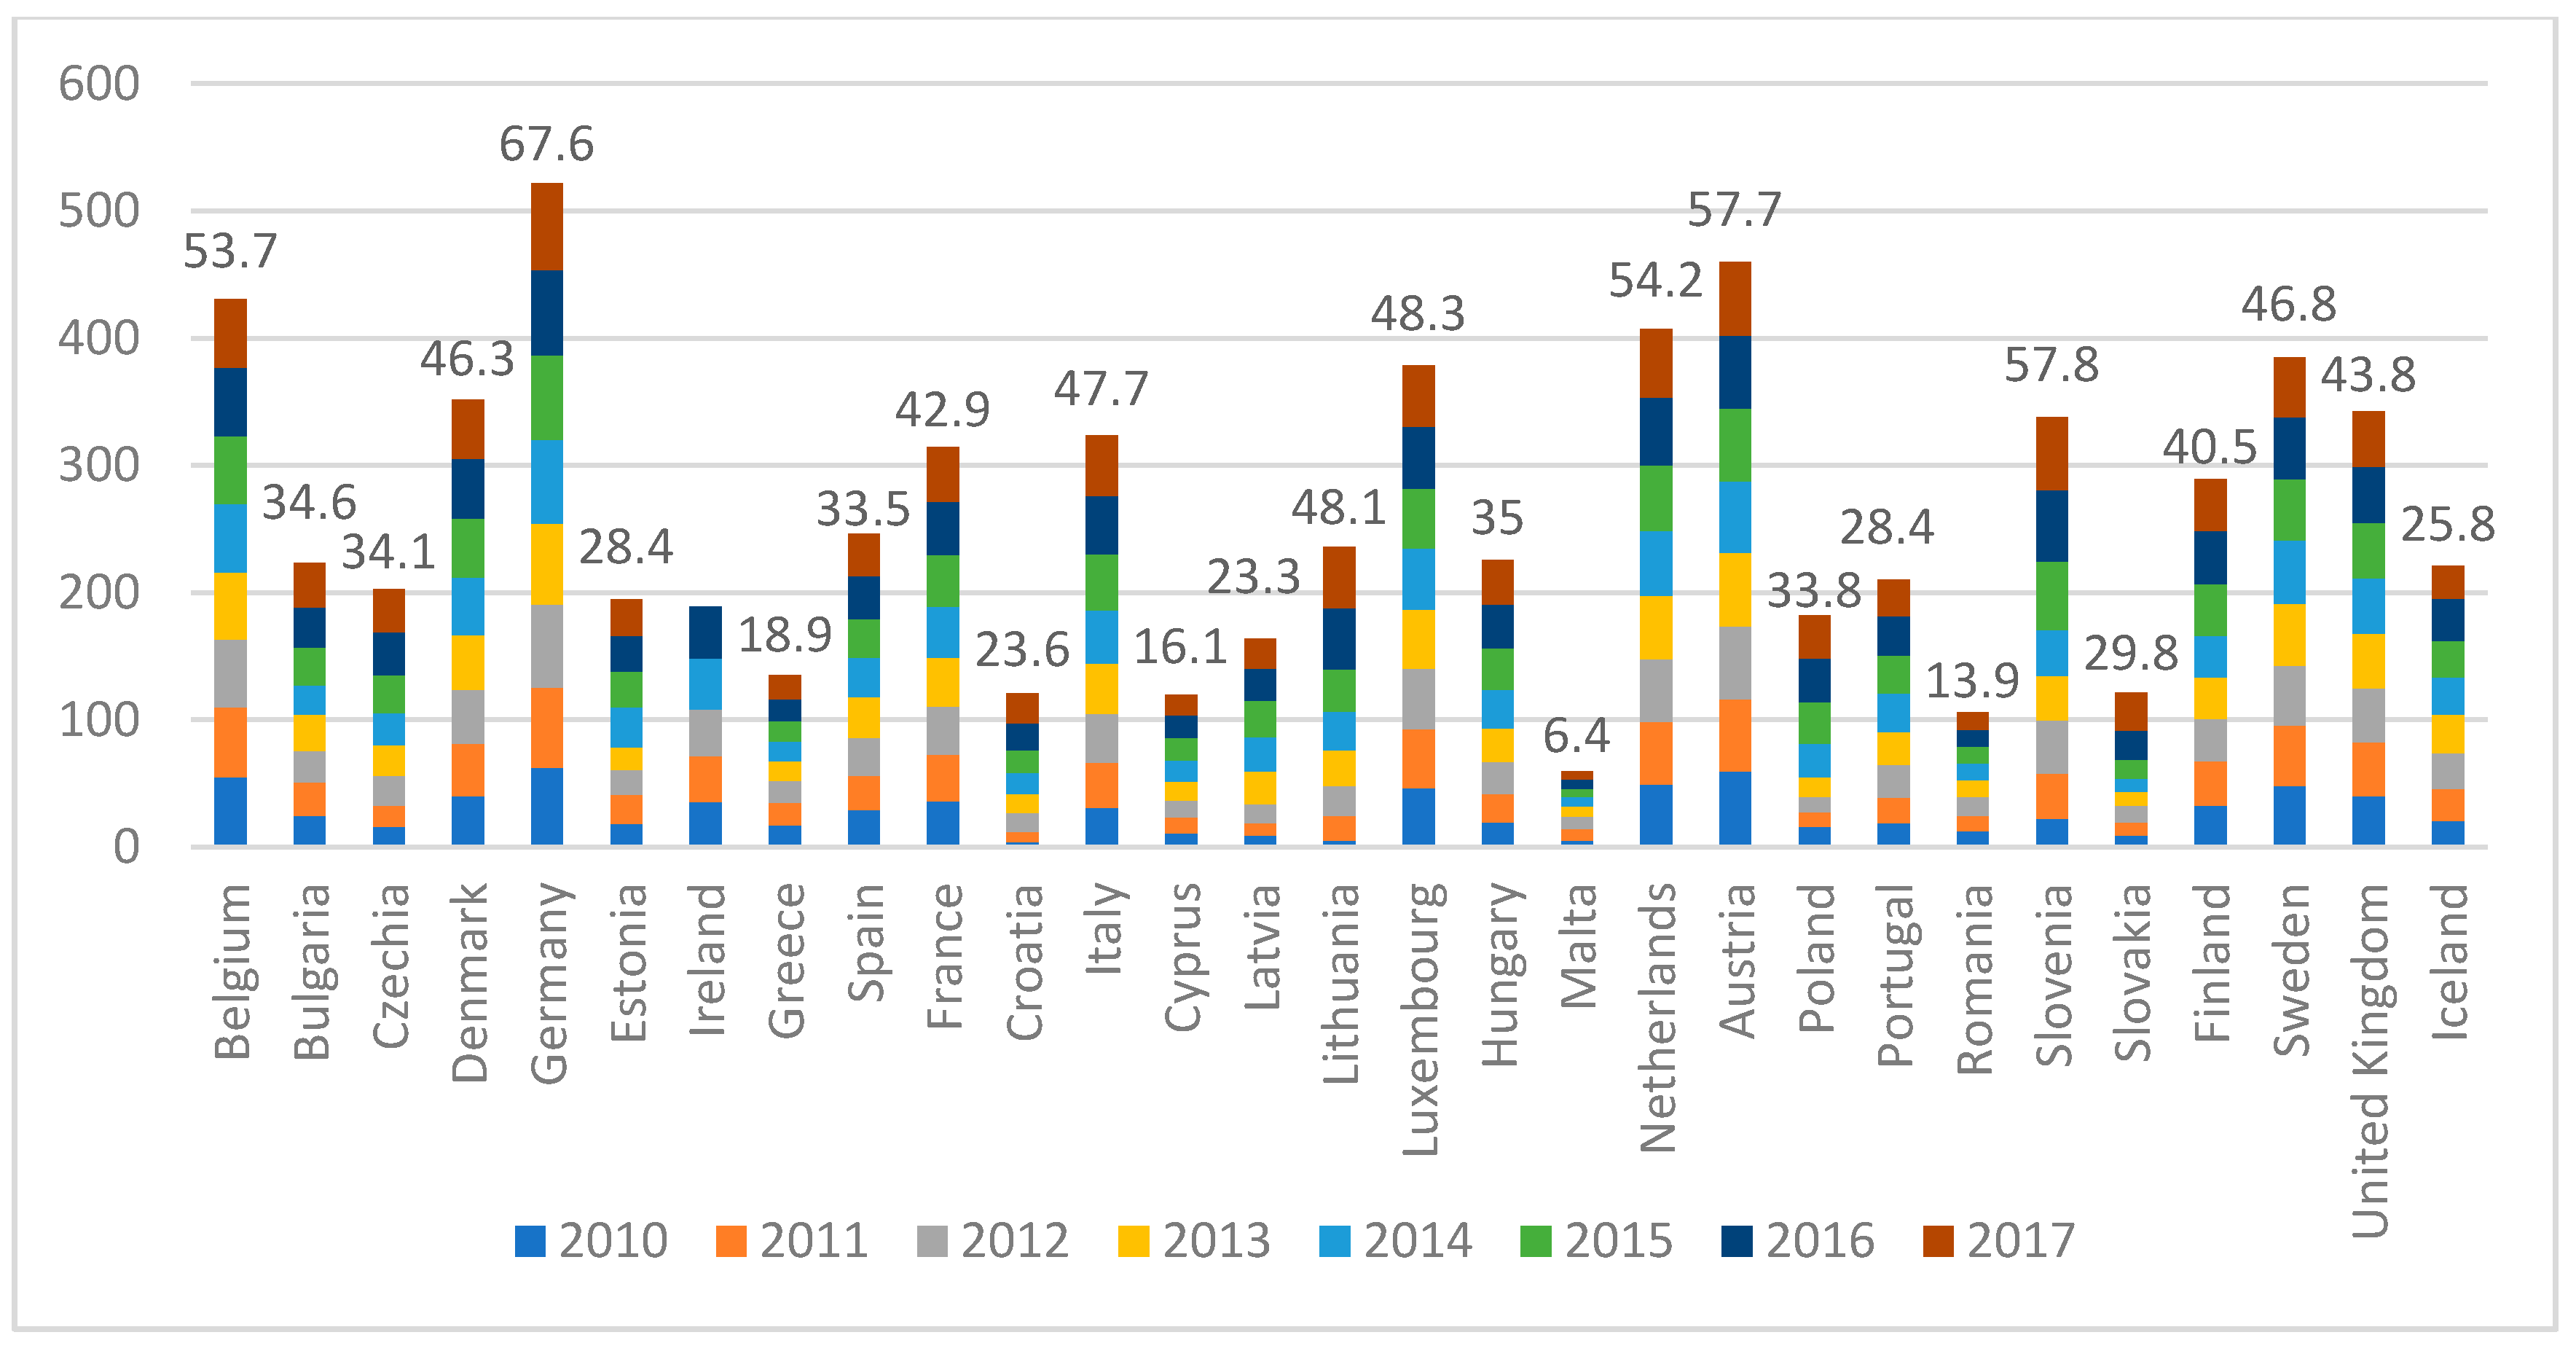
Another analyzed macroeconomic factor is RRMW [28]. RRMW is defined as municipal waste recycled from total municipal waste generated. The evolution of this indicator in EU countries between 2010 and 2017 can be seen in Figure 2.
Thus, it can be seen that in 2017, the EU member states with the highest rates of RRMW were Germany (67.6%), Slovenia (57.8%), and Austria (57.7%), while the countries with the lowest rates of recycling municipal waste were Cyprus (16.1%), Romania (13.9%), and Malta (6.4%).
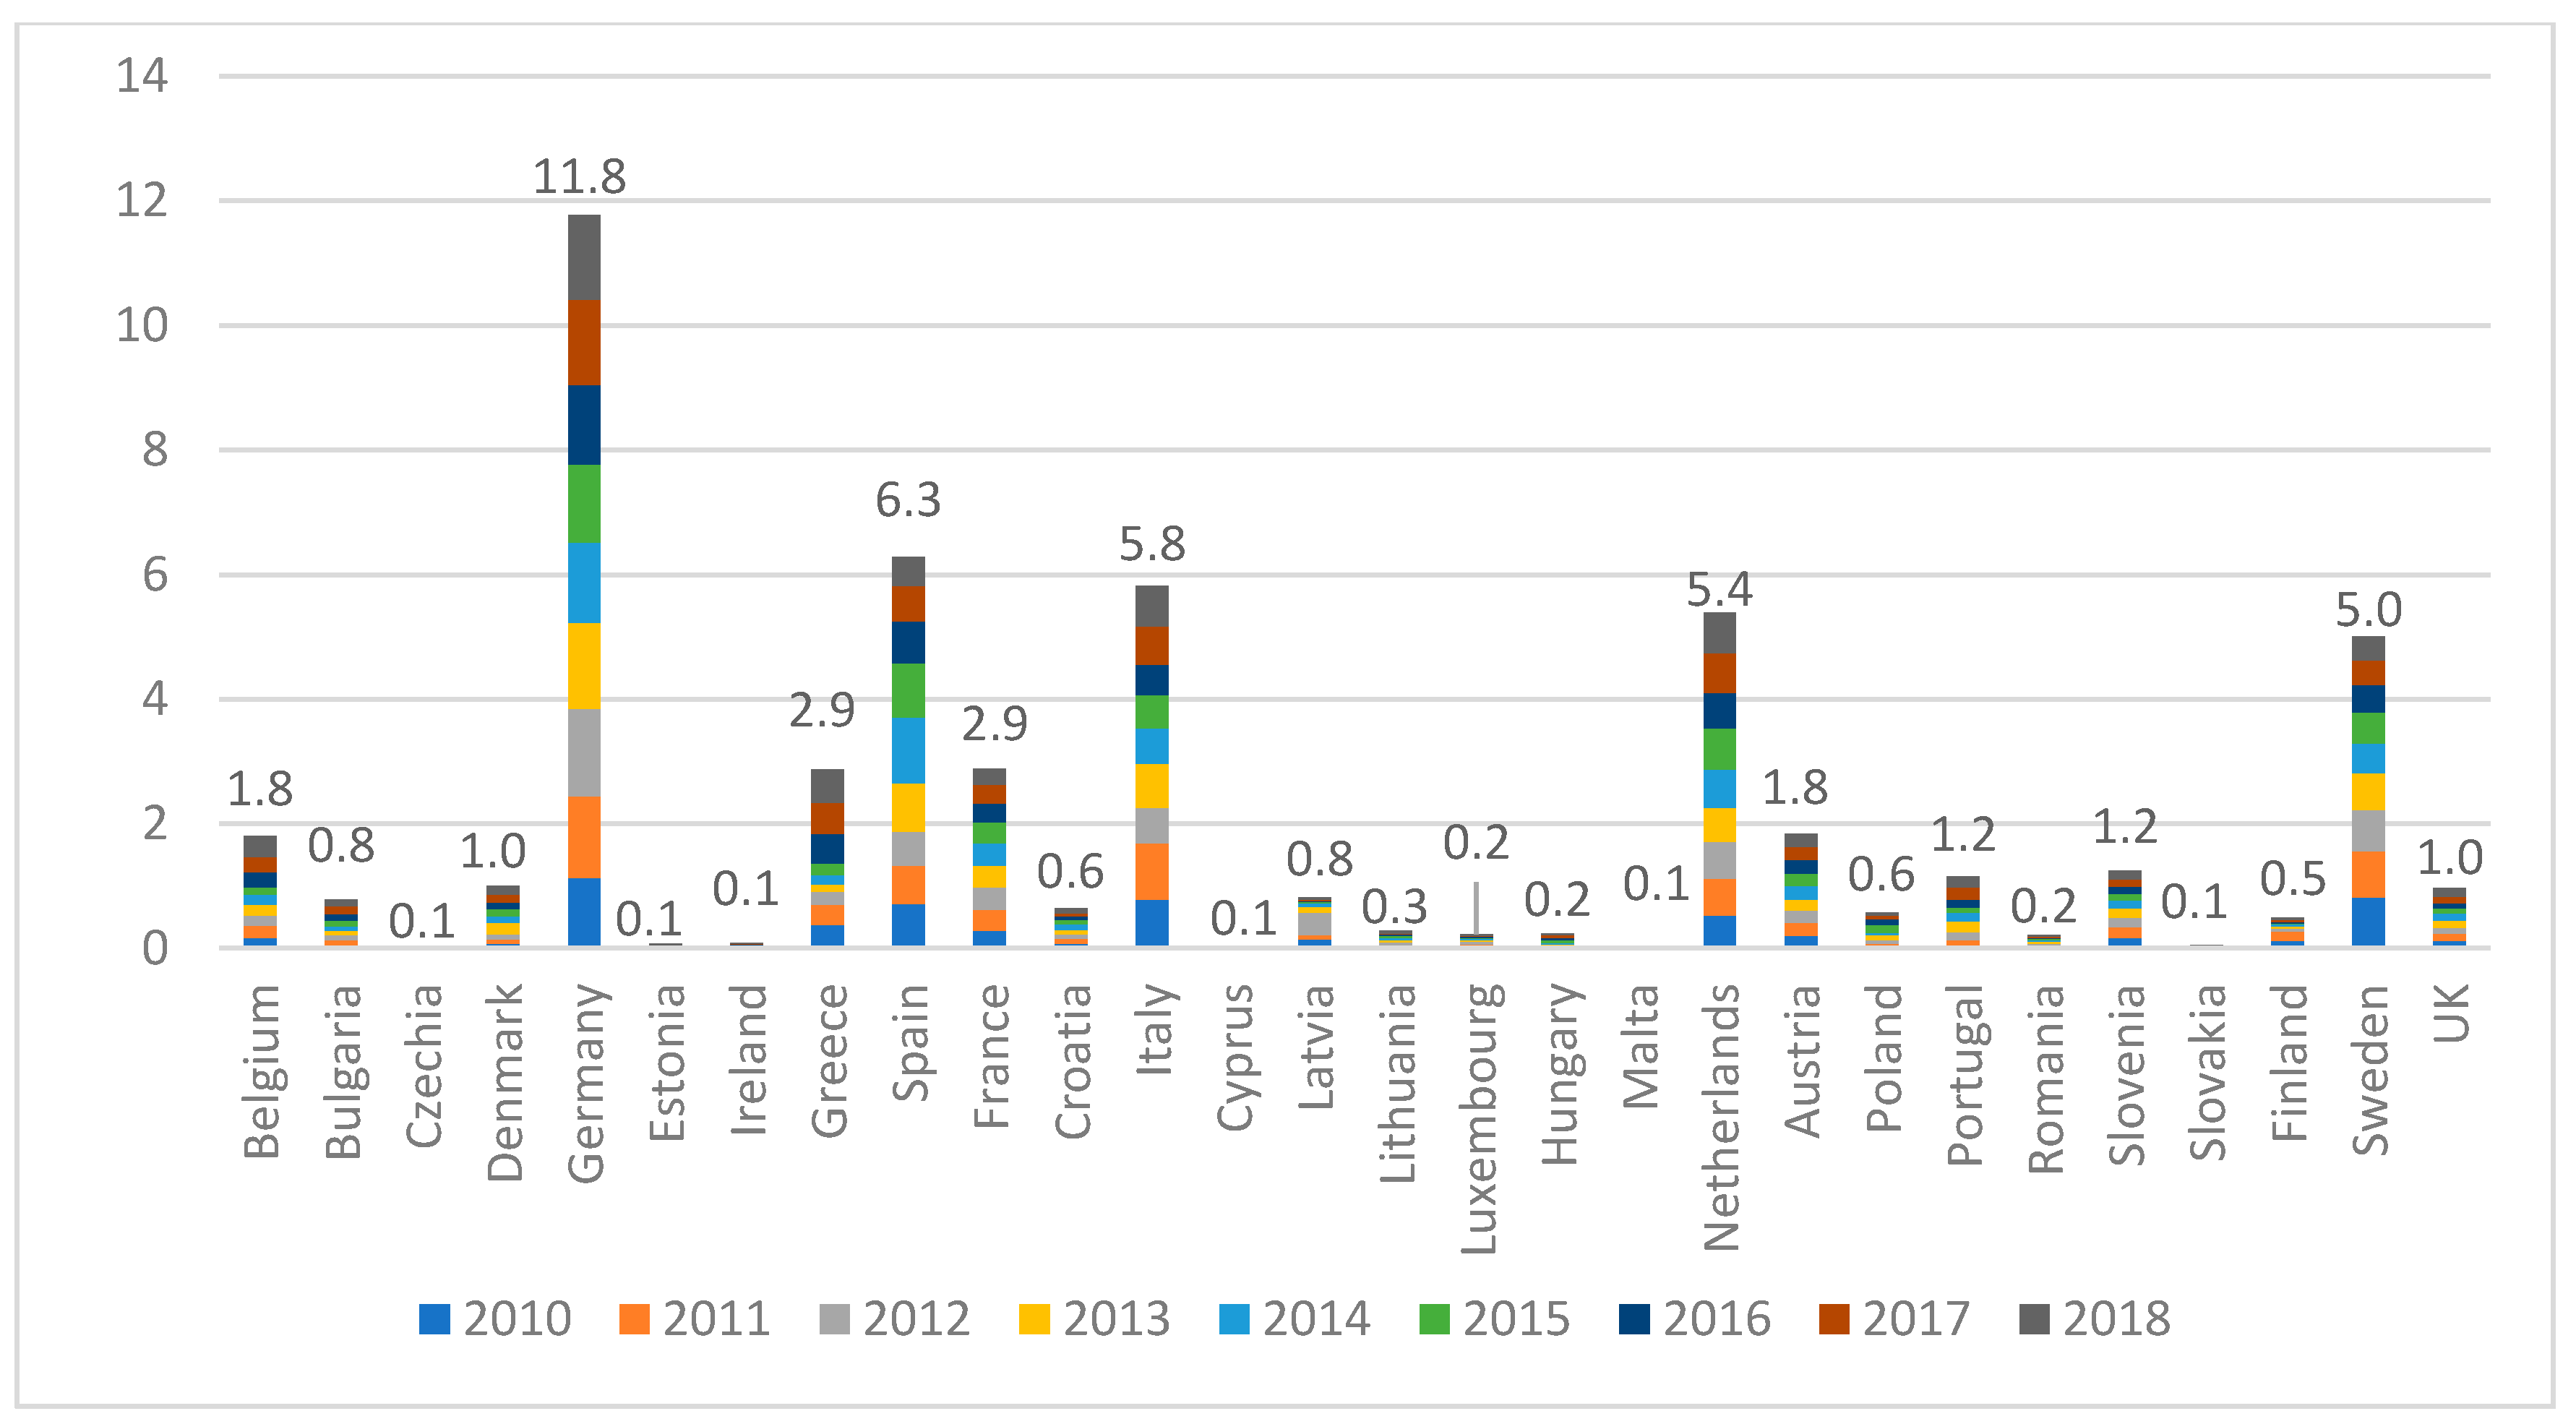
Furthermore, Figure 3 reveals the status of trade in recyclable raw materials (tons) in the EU countries between 2010 and 2017.
From Figure 3, we can observe that the EU country with the highest amounts of trade in recyclable raw materials is Germany, followed by Spain and Italy, while on the last places we can see the Czech Republic, Spain, and Italy.
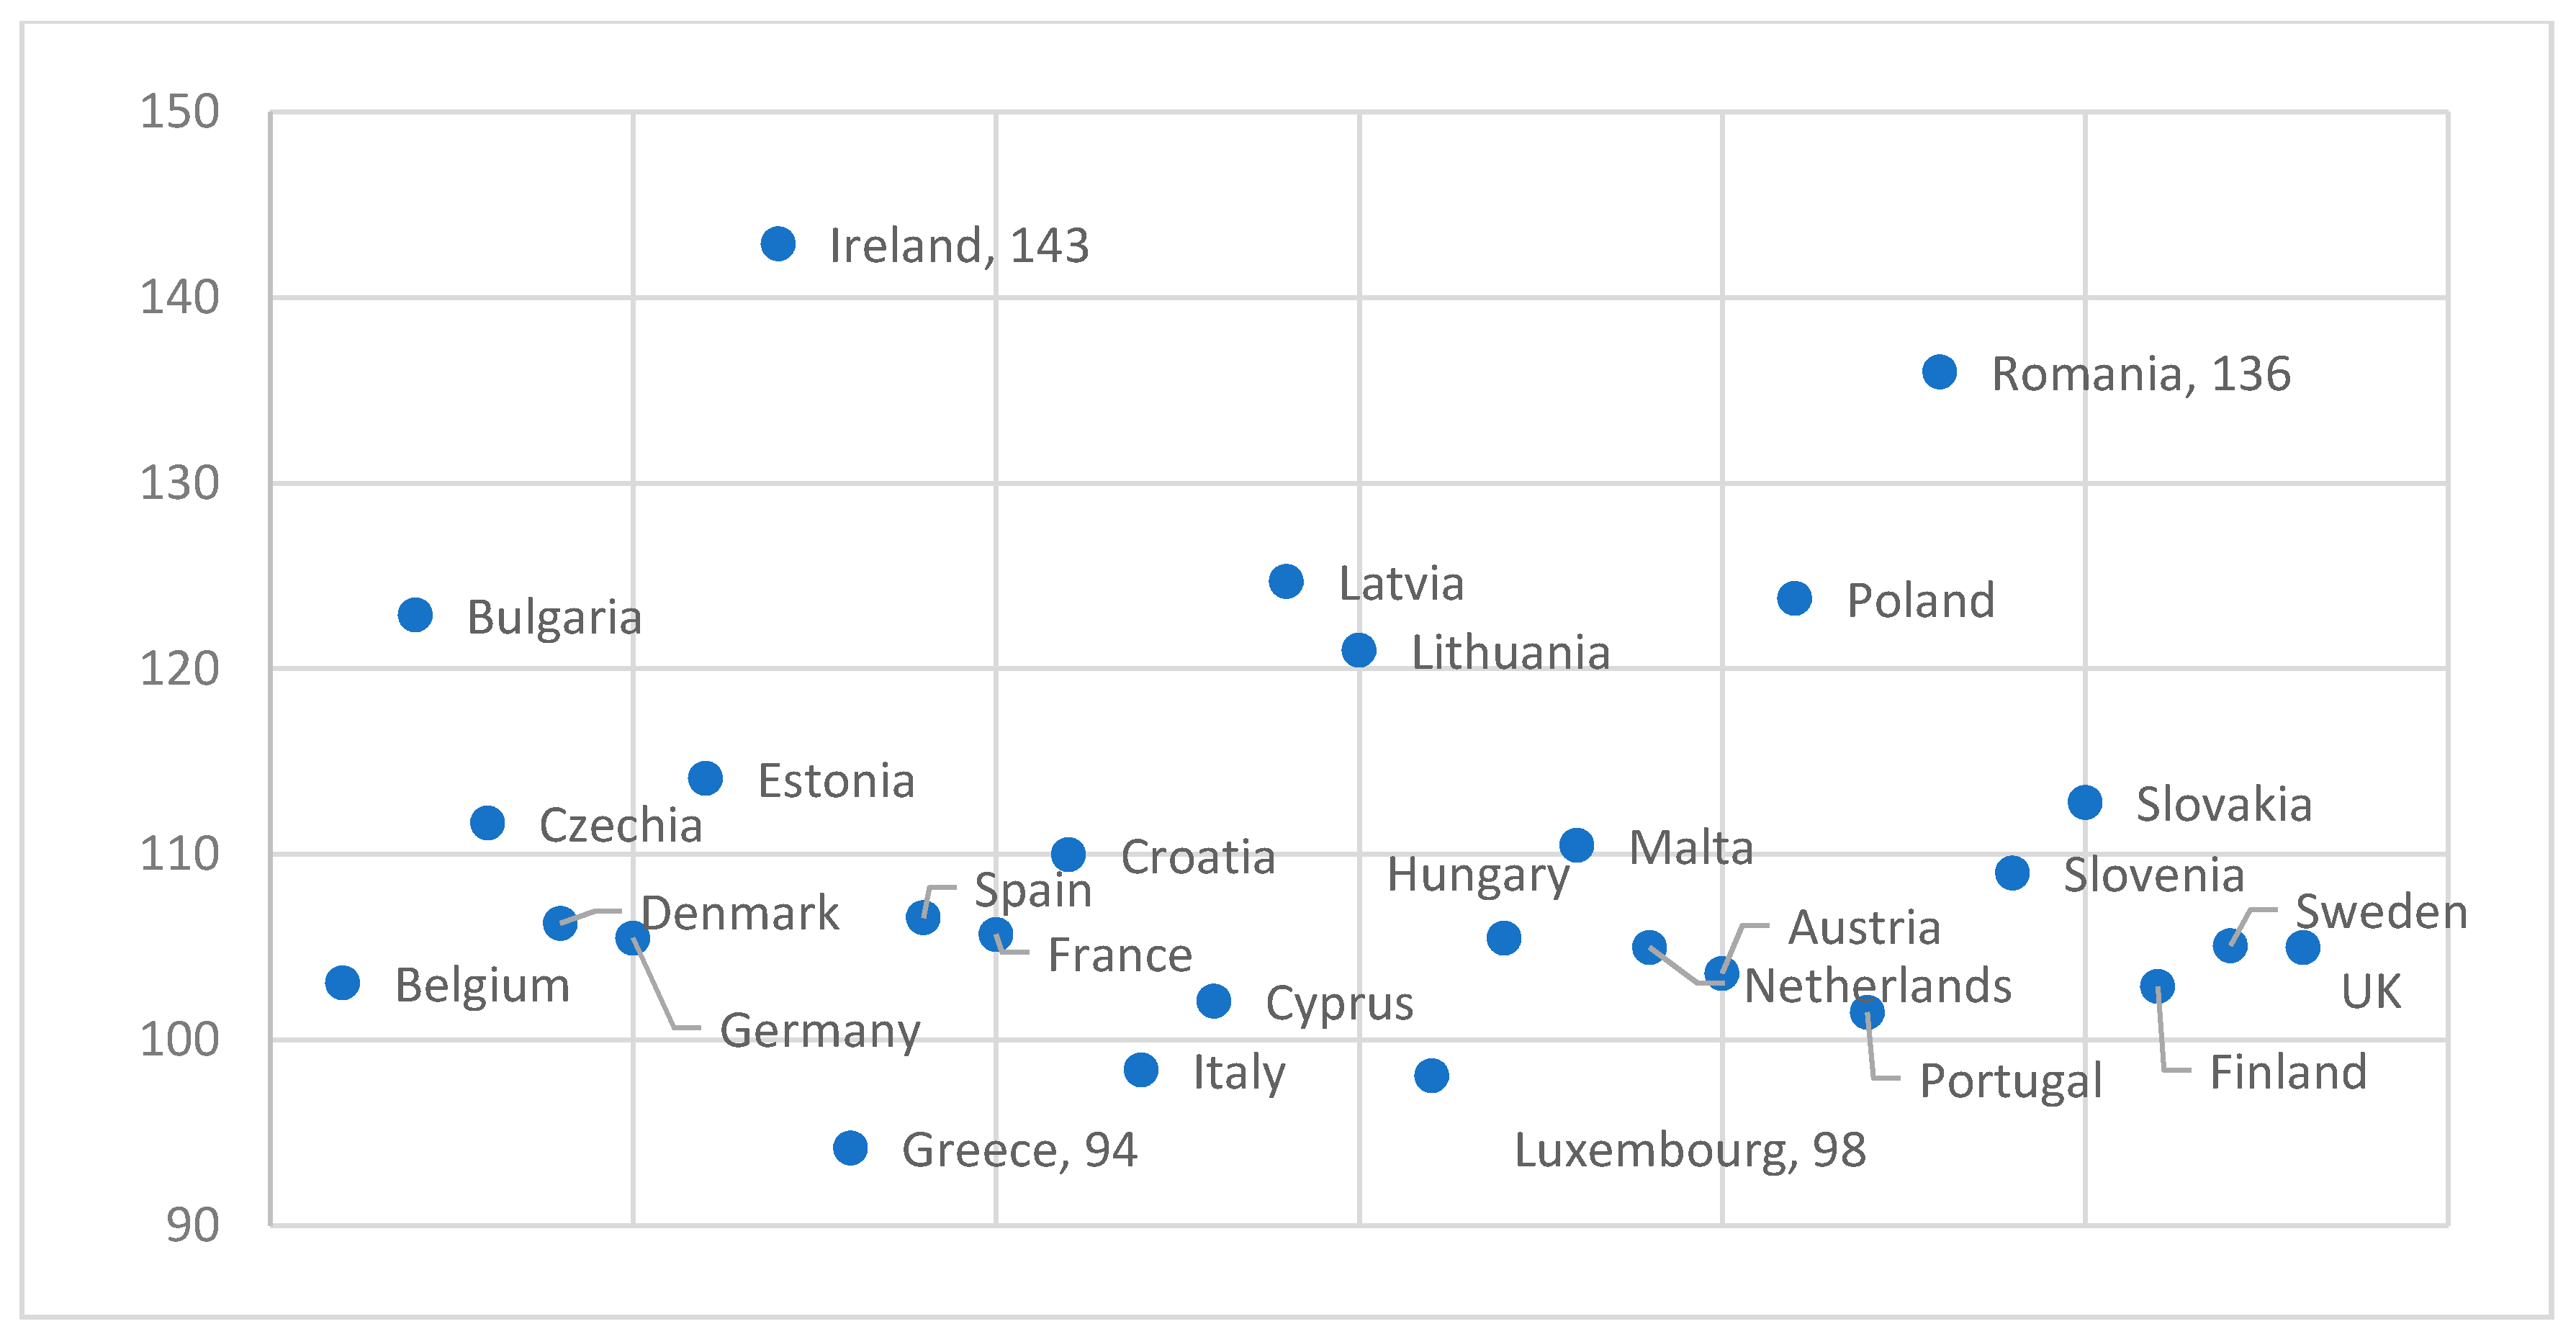
Figure 4 illustrates the real labor productivity per person in the EU member states, in 2018.
In Figure 4, it can be seen that in 2018, Ireland ranks first (143%) in the real labor productivity per person index, followed by Romania (136%). At the same time, Luxembourg (98%) and Greece (94%) were on the last places in this ranking.
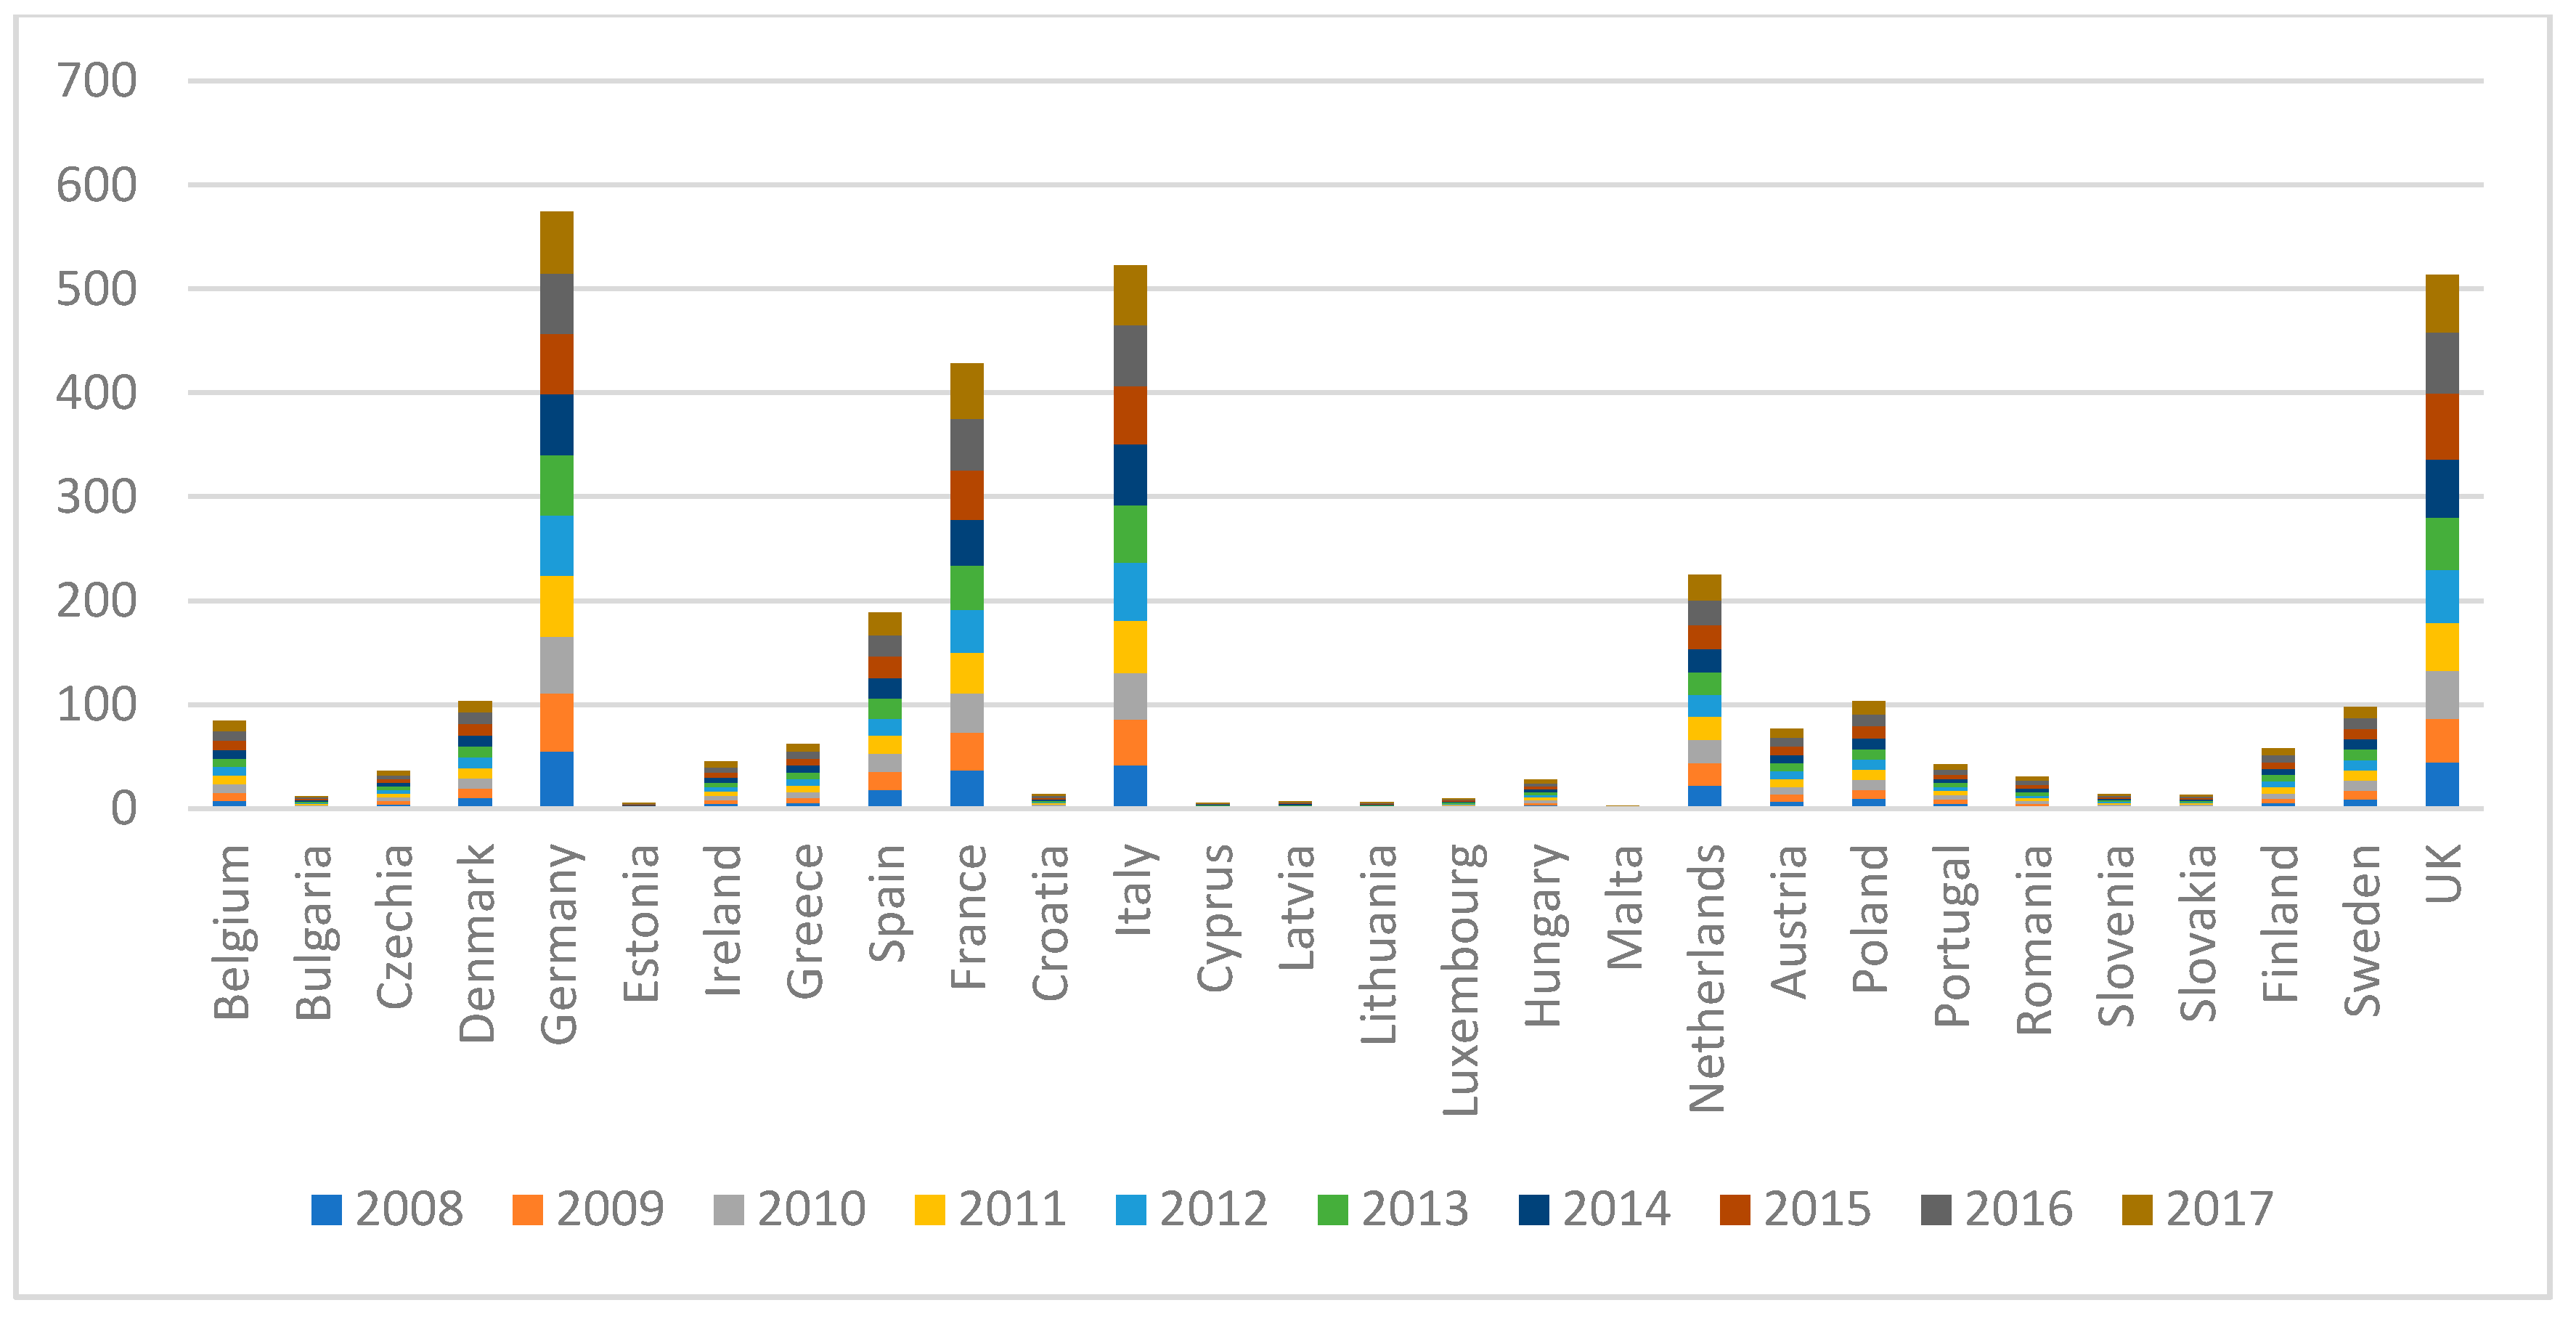
Figure 5 gives a description of the evolution of the environmental taxes (revenues in billion euro) in EU countries, between 2008 and 2017.
From this graph, we could see that the EU states with the highest values of environmental taxes were Germany, Italy, and the United Kingdom, while the countries with the lowest values of environmental taxes collections were the Baltic countries: Lithuania, Latvia, and Estonia.
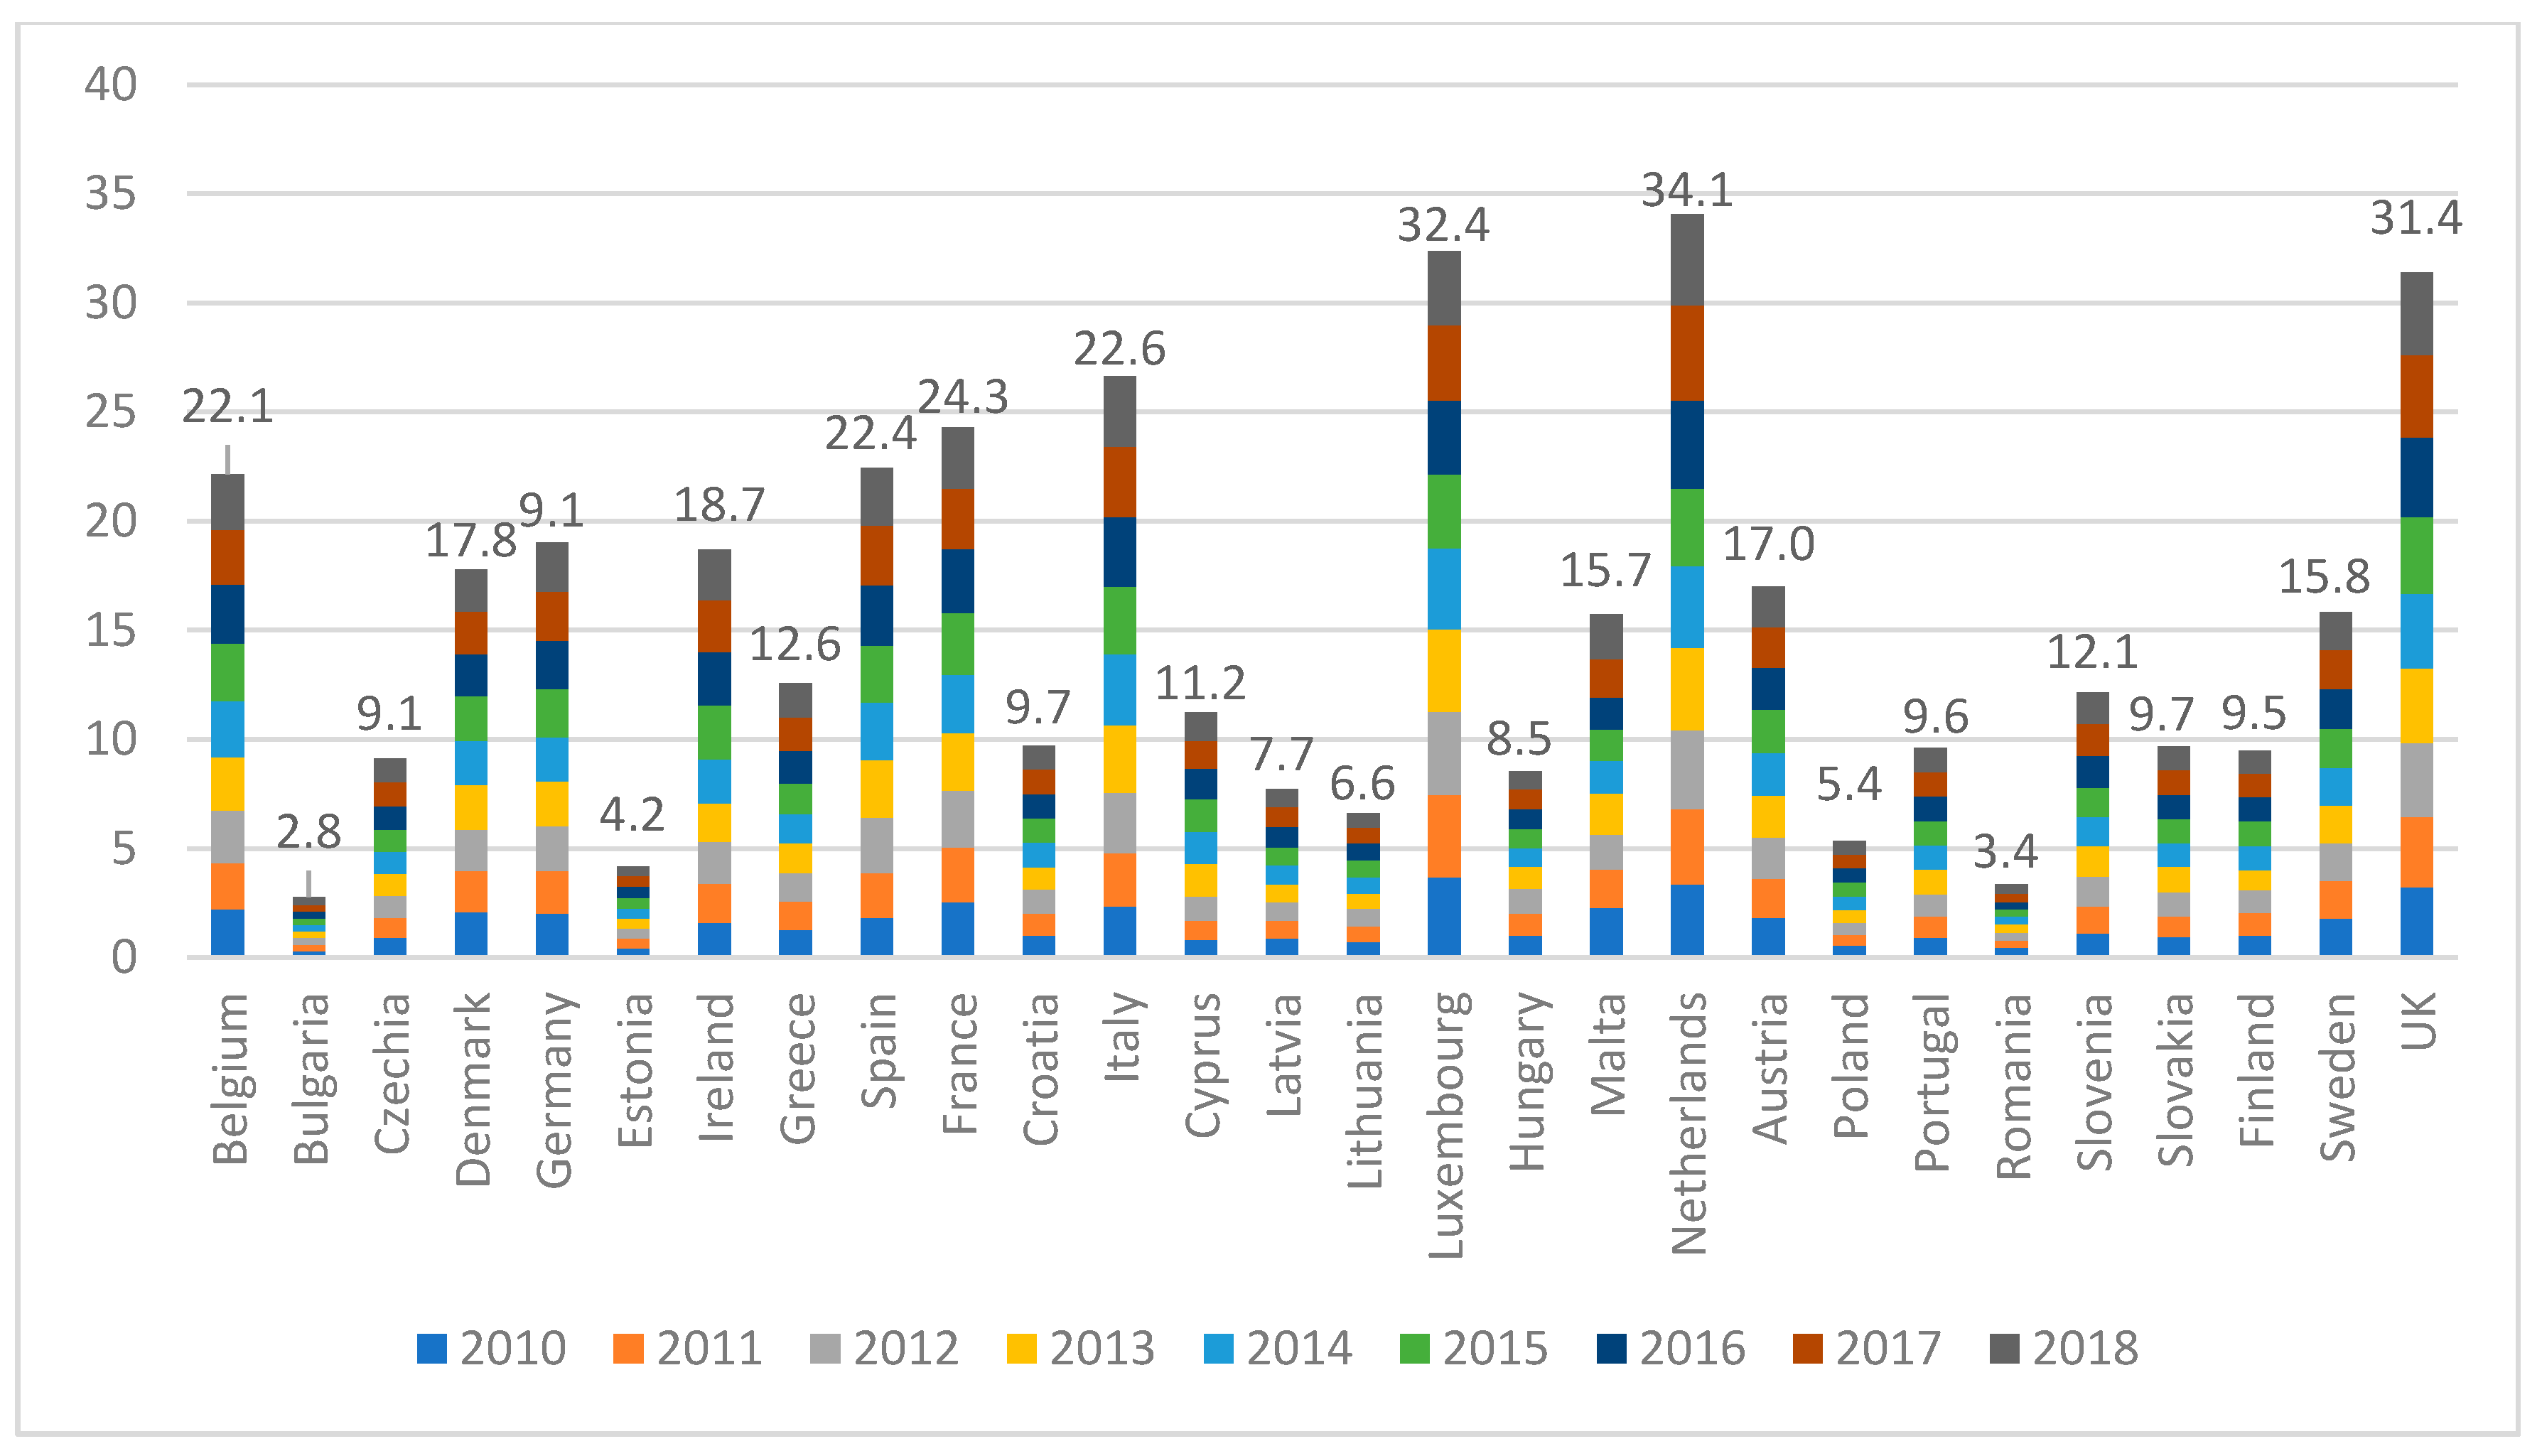
The productivity of resources is one of the most important circular economy indicators. In Figure 6, we could see the evolution of this indicator at the EU level, between 2010 and 2018.
From the above figure, we could see that real labor productivity and domestic material consumption in 2018 was highest in the Netherlands (4.2 euro/kg), followed by the United Kingdom (3.8 euro/kg) and Luxembourg (3.4 euro/kg). In the same time, in the last places were Estonia (0.4 euro/kg), Romania (0.4 euro/kg), and Bulgaria (0.3 euro/kg).
3. Results
A statistical description of the indicators used in the regression model—i.e., minimum, maximum, median, mean, and standard deviation—can be seen in Table 3. The values of the median and the mean of the variables of the model from Table 3 reveal how close the data is to normal distribution. If the mean and median values are close to one other, then we could say that the data follows a normal distribution [29]. In Table 3, we could see that these values are approximately equal to one other, so we can assume that the variables used in our model are normally distributed.
Pearson correlation analysis was performed to test multicollinearity between the explanatory variables of the regression model. As we could see in Table 2, the correlation coefficients between the independent variables in Table 4 are smaller than ±0.30, we could conclude that there are no multicollinearity issues between the selected variables [30].
A Lagrange multiplier (LM) Breusch–Pagan test and F-test were performed to analyze whether our method has random effects, fixed effects, or pooled data.
The LM Breusch–Pagan Test was used to choose between random models and the pooled method [31]. The null (H0) and the alternative (H1) hypotheses are the following:
- H0: H1:
If we accept the null hypothesis that the variance of the unit effects is zero, it would indicate that the regression model will be tested with the LM Breusch–Pagan Test. The results of the Pooled Model Test could be seen in Table 5.
In Table 5, we could see that the p-value (probability = 0.091) is greater than 0.05, so the null hypothesis H0 was accepted. In this case, we could state that the random effect model is not appropriate for our analysis, so pooling is suitable for our analysis.
Now we need to choose between the pooled and fixed effect models. For this, an F-test was performed [32,33].
The restricted model is as follows:
Unrestricted model: ; .
If the Hypothesis H1 is accepted, then 𝛽𝑖 ≠ 𝛽 and the restricted model would be accepted, in which case the pooled data technique would be used to analyze our model. Otherwise, the fixed effect model would be validated.
Table 6 gives us the results of the F-test. The hypothesis H1 is rejected, since the p-value (probability (F-statistic) = 0.316) is greater than the 0.05 threshold. Hence, we conclude that the fixed effect model will not be used in our model.
Therefore, the pooled least square (PLS) Method was performed to test the six statistical hypotheses. This method was used to estimate the impact of the CE indicators on economic growth in EU countries between 2010 and 2017.
For the multiple linear regression, the endogenous variable (Y) is economic growth, determined by a set of six exogenous indicators, i.e., circular material use rate (X1), RRMW (X2), trade in recycling materials (X3), real labor productivity (X4), environmental taxes (X5), and resource productivity (X6) as independent variables. For economic growth, we have used a proxy variable: GDP per capita growth.
To analyze the economic growth between EU member states between 2010 and 2017, according to the explanatory variables, the output of the regression model is revealed in Table 7. For the analysis, the data was collected for all EU countries except Croatia, who joined the EU in 2013.
According to the above table, the regression equation is:
where Y is the GDP per capita growth, X1 is the circular material use rate, X2 is the recycling rate of municipal waste, X3 is the trade in recycling materials, X4 is real labor productivity, X5 represents environmental taxes, and X6 refers to resource productivity.
Y = −12.933 + 0.107X1 + 0.118X2 + 0.108X3 + 0.203X4 + 0.097X5 + 0.178X6,
Hence, as we can see in Table 8, all six hypotheses are validated.
As we could see in the above table, all six hypotheses were validated by the regression model. A description of the regression variables can be observed in Table 2.
4. Discussion of the Results
The present study connects with the economic literature regarding the impact on economic growth of the CE indicators. The multiple linear regression coefficients used in the regression model were estimated by the PLS model, and the regression computations were performed by EViews 11.0 software.
The study was focused on the development of a multilinear regression model with panel data between the economic growth, as a dependent variable, and six other explanatory factors: CMU rate, RRMW, trade in recycling materials, real labor productivity, environmental taxes, and resource productivity. As we can see from the results, the greatest impact on economic growth was that of real labor productivity (coefficient = 0.203765), followed by resource productivity (coefficient = 0.178292) and RRMW (coefficient = 0.118950).
Analyzing the economic growth in the selected EU countries in our study between 2010 and 2017, using the explanatory factors, the following equation was obtained through analysis of the multiple linear regression (see Table 6): Y = −12.933 + 0.107X1 + 0.118X2 +0.108X3 + 0.203X4 + 0.097X5 + 0.178X6, with standard error coefficients 0.930, 0.848, 0.872, 0.459, 0.073, and 0.109.
Since the value of R-squared is 0.7765, we emphasize that 77.65% of the variability of the endogenous variable is determined by the exogenous factors of the model, and conclude that 22.35% of the dependent variable’s variability is still explained by other indicators that are not included in the analysis. Additionally, the value of the Durbin–Watson (DW) statistical test is DW = 2.18, close to 2, we conclude that there are no collinearity issues with the residuals in the regression model, which leads to the conclusion that the errors are not autocorrelated.
As we can see in Table 7, the results of the estimated model are significant at the 95% confidence level for all six explanatory factors in the analysis. The conclusions of the study are in line with the work of Puigcerver-Peñalver [34], who analyzed a multiple linear regression model in which the economic growth was explained by several CE environmental macroeconomic indicators.
Analyzing the results of the regression model, we can state that the model was correctly specified and the selected CE indicators were all significant, with positive impacts on EU economic growth in EU member states; the coefficients estimated by the panel data regression model were all significant, and most of the economic growth‘s variation was determined by the model. The results of the paper are consistent with another recent study [35], in which the authors developed a regression model to explain the economic growth explained by resource and labor productivity in EU member states. The results could be also linked with two other studies [36,37], which argue that sustainability and the circular economy impact on economic growth is not increased by a simple shift to renewable resources or materials. The authors highlight that recycling rates and environmental innovation are also significant factors of sustainable development and economic growth. Nevertheless, other studies [38,39] confirm our results that the CMU rate and trade in recycling materials have positive and significant impacts on economic growth, while [40] arguing that environmental taxes are one of the most important drivers for that economic growth. Last but not least, the results of our paper confirm the work of Aid et al. [41], who analyzed the barriers for inter-organizational resource management, and in turn uncovered some potential opportunities and risks of novel offerings from the waste management sector in Sweden. The results of the paper validate the conclusions of the research [42,43], underlining the significant impact of innovation in the recycling sector on the economic growth.
Eventually, not all EU countries will have the same level of implementation of CE indicators. While Nordic and Western countries have outstanding results and are on top of the CE rankings, Eastern European countries still need to improve their CE macroeconomic indicators. Sweden, Denmark, and Finland are the top-ranking countries in a composite score with eco-innovation inputs [44].
The novelty of this research comes from the panel data econometric analysis of the 27 EU member states, in order to determine the interrelationship between the CE and economic growth.
Multiple linear regression analysis was based on the data of the macroeconomic indicators over a period of eight years, and therefore, the main limitation of this research is associated with the time length period used in the econometric research. Thus, future research could encompass longer time periods and may reveal a better picture of the econometric model to analyze CE at the EU level.
5. Conclusions
Studies conducted on advanced economies have revealed multiple assets of the civil society in the spirit of environmental protection, in parallel with the investments in recycling infrastructure. The positive effects of the CE model can be offset by increasing the level of municipalities’ income, the labor force employed, and the profit obtained by the contractors providing the environmental infrastructure. The econometric analysis performed highlights the impact of exogenous indicators, determining factors of the CE in the economic growth.
Economic growth and environmental performance must go hand in hand. The natural environment is based on economic activity and growth, providing the main resources we need to produce services and goods, and processing and absorbing unwanted by-products in the form of waste and pollution. Circular economy and environmental assets contribute to economic growth and social activity, helping to regulate flood risks, regulating the local climate (both temperature and air quality), and maintaining the supply of clean water and other resources. Correspondingly, economic growth contributes to the investment and dynamism needed to deploy and develop new technology, which is foundational to both managing environmental assets and productivity growth.
Perhaps the most important benefit is the one felt at the individual level. By making an analogy between the product life through reuse, which translates into life prolongation and the benefits of this natural process on the biological human life, and given that the basic resource is biomass, we can observe how the quality of the environmental factors is implicitly propagated, positively impacting the quality of the human life. The analysis can be further developed using other macroeconomic indicators commensurate the attributes of the CE and environmental challenges, shedding light on the latest EC developments in the field in order to implement the circular economy in day-to-day activities. Future research could be developed for a longer period of time and use other economic indicators or econometric models.
Author Contributions
M.B. drafted the initial manuscript and revised the final manuscript. M.B. contributed the data acquisition and estimated the model; C.L.T. contributed with conclusions and recommendations, as well as the limitations of the study and further research; C.L.T. contributed the literature review; M.B. was responsible for the overall writing process.
Funding
This research was funded by the Romanian government through the CERTRAN project: The Upgrade of the Research Capacity in Economics through Development of a Transdisciplinary Research Infrastructure.
Acknowledgments
The research published in this article has been supported by the Romanian government through the CERTRAN project: The Upgrade of the Research Capacity in Economics through Development of a Transdisciplinary Research Infrastructure.
Conflicts of Interest
The authors declare no conflict of interest.
Abbreviations
| EU | European Union |
| EC | European Commission |
| OLS | ordinary least squares |
| PLS | Pooled least square |
| GDP | gross domestic product |
| PPS | purchasing power standard |
| CE | circular economy |
| RRMW | recycling rate of municipal waste |
| EPR | extended producer responsibility |
| CMU | circular material use |
| DMC | domestic material consumption |
References
- European Commission. Innovating for Sustainable Growth: A Bioeconomy for Europe. 2012. Available online: https://ec.europa.eu/research/bioeconomy/pdf/official-strategy_en.pdf (accessed on 14 May 2019).
- Bosman, R.; Rotmans, J. Transition governance towards a bioeconomy: a comparison of Finland and the Netherlands. Sustainability 2016, 8, 1017. [Google Scholar] [CrossRef]
- Carrez, D.; Van Leeuwen, P. Bioeconomy: circular by nature. Eur. Files 2015, 38, 34–35. Available online: https://biconsortium.eu/sites/biconsortium.eu/files/downloads/European_Files_september2015_38.pdf (accessed on 10 July 2019).
- Hockings, M.; Stolton, S.; Leverington, F.; Dudley, N. Evaluating Effectiveness: A Framework for Assessing Management Effectiveness of Protected Areas. IUCN. 2006. Available online: http://zeropoaching.org/pdfs/IUCN_MEE_guidelines.pdf (accessed on 22 June 2019).
- Angenendt, G.; Zurmühlen, S.; Axelsen, H.; Sauer, D.U. Comparison of different operation strategies for PV battery home storage systems including forecast-based operation strategies. Appl. Energy 2018, 229, 884–899. [Google Scholar] [CrossRef]
- Nowicki, P.; Banse, M.; Bolck, C.; Bos, H.; Scott, E. Biobased Economy. 2008. Available online: https://core.ac.uk/download/pdf/29261855.pdf (accessed on 28 July 2019).
- Van Meijl, T. Multiple identifications and the dialogical self: Urban Maori youngsters and the cultural renaissance. J. R. Anthropol. Inst. 2006, 12, 917–933. [Google Scholar] [CrossRef]
- Busu, C.; Busu, M. The role of knowledge intensive business services on Romania’s economic revival and modernization at the regional level. Sustainability 2017, 9, 526. [Google Scholar] [CrossRef]
- Izaurralde, R.C.; McGill, W.B.; Williams, J.R. Development and Application of the EPIC Model for Carbon Cycle, Greenhouse Gas Mitigation, and Biofuel Studies. In Managing Agricultural Greenhouse Gases; Elsevier Inc.: Atlanta, GA, USA; pp. 293–308. Available online: https://0-www-sciencedirect-com.brum.beds.ac.uk/science/article/pii/B9780123868978000176 (accessed on 3 July 2019).
- Janssen, M.A.; Walker, B.H.; Langridge, J.; Abel, N. An adaptive agent model for analyzing co-evolution of management and policies in a complex rangeland system. Ecol. Model. 2000, 131, 249–268. [Google Scholar] [CrossRef]
- Yamamoto, M.; Hosoda, E. The Economics of Waste Management in East Asia; Routledge: New York, NY, USA, 2016; ISBN 13 978-1138805989. [Google Scholar]
- Roman, A.G.; Mocanu, M.; Hoinaru, R. Disclosure Style and Its Determinants in Integrated Reports. Sustainability 2019, 11, 1960. [Google Scholar] [CrossRef]
- Lakatos, E.S.; Cioca, L.I.; Dan, V.; Ciomos, A.O.; Crisan, O.A.; Barsan, G. Studies and Investigation about the Attitude towards Sustainable Production, Consumption and Waste Generation in Line with Circular Economy in Romania. Sustainability 2018, 10, 865. [Google Scholar] [CrossRef]
- Geissdoerfer, M.; Savaget, P.; Bocken, N.M.; Hultink, E.J. The Circular Economy–A new sustainability paradigm? J. Clean. Prod. 2017, 143, 757–768. [Google Scholar] [CrossRef]
- Busu, M.; Gyorgy, A. Real Convergence, Steps from Adherence to Integration. Amfiteatru Econ. J. 2016, 18, 303–316. [Google Scholar]
- Binswanger, M. Is there a growth imperative in capitalist economies? A circular flow perspective. J. Post Keynes. Econ. 2009, 31, 707–727. [Google Scholar] [CrossRef]
- Moriguchi, Y. Material flow indicators to measure progress toward a sound material-cycle society. J. Mater. Cycles Waste Manag. 2007, 9, 112–120. [Google Scholar] [CrossRef]
- Hart, S.L.; Milstein, M.B. Global sustainability and the creative destruction of industries. Mit Sloan Manag. Rev. 1999, 41, 23. [Google Scholar]
- Cai, H.; Fan, R. Regional Total Factor Energy Efficiency Evaluation of China: The Perspective of Social Welfare. Sustainability 2019, 11, 4093. [Google Scholar] [CrossRef]
- Tantau, A.D.; Maassen, M.A.; Fratila, L. Models for Analyzing the Dependencies between Indicators for a Circular Economy in the European Union. Sustainability 2018, 10, 2141. [Google Scholar] [CrossRef]
- Kazulytė, I. Using Recycled Materials in Packagings to Meet the Goals of Circular Economy. Proceedings 2019, 16, 50. [Google Scholar] [CrossRef]
- Abdullah, S.; Morley, B. Environmental taxes and economic growth: Evidence from panel causality tests. Energy Econ. 2014, 42, 27–33. [Google Scholar] [CrossRef] [Green Version]
- De Mooij, R.R.; Bovenberg, L.A. Environmental tax reform and endogenous growth. J. Public Econ. 1997, 63, 207–237. [Google Scholar] [Green Version]
- Fullerton, D.; Kim, S.R. Environmental investment and policy with distortionary taxes, and endogenous growth. J. Environ. Econ. Manag. 2008, 56, 141–154. [Google Scholar] [CrossRef] [Green Version]
- Geng, Y.; Fu, J.; Sarkis, J.; Xue, B. Towards a national circular economy indicator system in China: An evaluation and critical analysis. J. Clean. Prod. 2012, 23, 216–224. [Google Scholar] [CrossRef]
- George, D.A.; Lin, B.C.A.; Chen, Y. A circular economy model of economic growth. Environ. Model. Softw. 2015, 73, 60–63. [Google Scholar] [CrossRef]
- Haas, W.; Krausmann, F.; Wiedenhofer, D.; Heinz, M. How circular is the global economy?: An assessment of material flows, waste production, and recycling in the European Union and the world in 2005. J. Ind. Ecol. 2015, 19, 765–777. [Google Scholar] [CrossRef]
- Troschinetz, A.M.; Mihelcic, J.R. Sustainable recycling of municipal solid waste in developing countries. Waste Manag. 2009, 29, 915–923. [Google Scholar] [CrossRef] [PubMed]
- Hozo, S.P.; Djulbegovic, B.; Hozo, I. Estimating the mean and variance from the median, range, and the size of a sample. Bmc Med Res. Methodol. 2005, 5, 13. [Google Scholar] [CrossRef] [PubMed]
- Dabholkar, P.A.; Shepherd, C.D.; Thorpe, D.I. A comprehensive framework for service quality: An investigation of critical conceptual and measurement issues through a longitudinal study. J. Retail. 2000, 76, 139–173. [Google Scholar] [CrossRef]
- Block, J. Long-term Orientation of Family Firms: An Investigation of R&D Investments, Downsizing Practices, and Executive Pay. Gabler: Wiesbaden, Germany. 2009. Available online: https://0-link-springer-com.brum.beds.ac.uk/book/10.1007/978-3-8349-8412-8 (accessed on 18 May 2019).
- Urban, M. The Influence of Blockholders on Agency Costs and Firm Value an Empirical Examination of Blockholder Characteristics and Interrelationships for German Listed Firms; Springer: Wiesbaden, Germany, 2015. [Google Scholar]
- Schmidheiny, K. Panel data: Fixed and Random Effects. 2016. Available online: http://www.schmidheiny.name/teaching/panel2up.pdf (accessed on 18 June 2019).
- Puigcerver-Peñalver, M.C. The impact of structural funds policy on European regions’ growth. A theoretical and empirical approach. Eur. J. Comp. Econ. 2007, 4, 179. [Google Scholar]
- Rada, E.C.; Zatelli, C.; Cioca, L.I.; Torretta, V. Selective Collection Quality Index for Municipal Solid Waste Management. Sustainability 2018, 10, 257. [Google Scholar] [CrossRef]
- Busu, M.; Nedelcu, A.C. Sustainability and Economic Performance of the companies in the renewable energy sector in Romania. Sustainability 2018, 10, 8. [Google Scholar] [CrossRef]
- Lieder, M.; Rashid, A. Towards circular economy implementation: a comprehensive review in context of manufacturing industry. J. Clean. Prod. 2016, 115, 36–51. [Google Scholar] [CrossRef]
- Busu, M. Adopting Circular Economy at the European Union Level and Its Impact on Economic Growth. Soc. Sci. 2019, 8, 159. [Google Scholar] [CrossRef]
- Murray, A.; Skene, K.; Haynes, K. The circular economy: an interdisciplinary exploration of the concept and application in a global context. J. Bus. Ethics 2017, 140, 369–380. [Google Scholar] [CrossRef]
- Cucchiella, F.; D’Adamo, I.; Gastaldi, M. Future Trajectories of Renewable Energy Consumption in the European Union. Resources 2018, 7, 10. [Google Scholar] [CrossRef]
- Aid, G.; Eklund, M.; Anderberg, S.; Baas, L. Expanding roles for the Swedish waste management sector in inter-organizational resource management. Resour. Conserv. Recycl. 2017, 124, 85–97. [Google Scholar] [CrossRef]
- Kihl, A.; Aid, G. Driving forces and inhibitors of secondary stock extraction. Open Waste Manag. J. 2016, 9, 11–18. [Google Scholar] [CrossRef]
- Aid, G.; Lazarevic, D.; Kihl, A. Waste to resources: moving toward the 2030 sustainable development goals. In Proceedings of the Linnaeus Eco-Tech 2016, Kalmar, Sweden, 21–23 November 2016; pp. 1–19. [Google Scholar]
- Eco-Innovation and Competitiveness Annual Report. 2017. Available online: http://eco.nomia.pt/contents/ documentacao/kh0414991enn-002.pdf (accessed on 10 September 2019).
Figure 1.
Circular material use (CMU) rate (%). Source: Eurostat, 2019.

Figure 2.
RRMW (%) in European Union (EU) countries between 2010 and 2017. Source: Eurostat, 2019.

Figure 3.
Trade in recyclable raw materials (million tons) in EU member states. Source: Eurostat, 2019.
Figure 3.
Trade in recyclable raw materials (million tons) in EU member states. Source: Eurostat, 2019.

Figure 4.
Real labor productivity per person in the EU countries in 2018 (base year 2010 = 100%). Source: based on processed data provided by Eurostat, 2019.
Figure 4.
Real labor productivity per person in the EU countries in 2018 (base year 2010 = 100%). Source: based on processed data provided by Eurostat, 2019.

Figure 5.
Environmental taxes (revenues in billion euro) at EU level, between 2010 and 2017. Source: Eurostat, 2019.
Figure 5.
Environmental taxes (revenues in billion euro) at EU level, between 2010 and 2017. Source: Eurostat, 2019.

Figure 6.
Resource productivity (euro/kg) in EU countries between 2010–2018. Source: Eurostat, 2019.
Figure 6.
Resource productivity (euro/kg) in EU countries between 2010–2018. Source: Eurostat, 2019.


Table 1.
Hypotheses of the research study.
| Hypothesis Number | Hypothesis |
|---|---|
| H1 | Circular material use (CMU) rate has is strongly correlated with economic growth |
| H2 | The impact of the recycling rate of municipal waste (RRMW) on economic growth is positive and significant |
| H3 | Trade in recycling materials are strongly correlated with economic growth |
| H4 | Real labor productivity is highly correlated with economic growth |
| H5 | The impact of environmental taxes on economic growth is significant |
| H6 | Resource productivity is a significant factor of economic growth |
Table 2.
Descriptive statistics of variables in the model.
| Variable | Name | Definition | Unit |
|---|---|---|---|
| (Y) | GDP per capita growth | Gross domestic product increases per capita in EU member states | Percentage (%) |
| (X1) | CMU rate | The ratio of the circular use of materials to the overall material use | Percentage (%) |
| (X2) | RRMW | Measures the tonnage recycled from municipal waste divided by the total municipal waste arising | Tons |
| (X3) | Trade in recycling materials | The trade in recyclable raw materials (tons) in the EU countries | Tons |
| (X4) | Real labor productivity | The productivity per person employed in relation to EU average | Percentage (%) |
| (X5) | Environmental taxes | A tax whose base is a physical unit of something that has a proven, specific negative impact on the environment | Euro |
| (X6) | Resource productivity | Gross domestic product divided by domestic material consumption | Euro/kg |
Table 3.
Descriptive statistics.
| Variable | Min | Mean | Median | Max | St. dev. | N |
|---|---|---|---|---|---|---|
| Y | 6.981 | 30.612 | 29.084 | 118.299 | 2.229 | 27 |
| X1 | 1.300 | 8.557 | 7.800 | 29 | 6.580 | 27 |
| X2 | 6.400 | 37.178 | 34.800 | 67.600 | 14.882 | 27 |
| X3 | 0.001 | 0.211 | 0.187 | 1.350 | 0.299 | 27 |
| X4 | 94.200 | 110.286 | 106.000 | 143.000 | 11.282 | 27 |
| X5 | 0.303 | 8.171 | 7.095 | 59.259 | 18.930 | 27 |
| X6 | 0.332 | 1.731 | 1.492 | 4.173 | 1.060 | 27 |
Source: own calculations, with the use of EViews 11.0.
Table 4.
Pearson correlation matrix between explanatory variables.
| Variable | X1 | X2 | X3 | X4 | X5 | X6 |
|---|---|---|---|---|---|---|
| X1 | 1 | 0.134 | 0.128 | 0.212 | 0.289 | 0.283 |
| X2 | 0.134 | 1 | 0.148 | 0.207 | 0.258 | 0.198 |
| X3 | 0.128 | 0.148 | 1 | 0.149 | 0.081 | 0.246 |
| X4 | 0.212 | 0.207 | 0.149 | 1 | 0.102 | 0.269 |
| X5 | 0.289 | 0.258 | 0.081 | 0.102 | 1 | 0.174 |
| X6 | 0.283 | 0.198 | 0.246 | 0.269 | 0.174 | 1 |
Source: own calculations, with the use of EViews 11.0.
Table 5.
Random effect test.
| Cross Section | Time | Both | |
|---|---|---|---|
| Coefficient | 18.73 | 49.132 | 79.45 |
| Probability | 0.091 | 0.603 | 0.047 |
Table 6.
Fixed effect test.
| Test | Value |
|---|---|
| F-statistic | 4.36 |
| Probability (F-statistic) | 0.316 |
Table 7.
Impact of the CMU rate, RRMW, trade in recycling materials, real labor productivity, environmental taxes, and resource productivity on GDP per capita growth in EU countries.
Table 7.
Impact of the CMU rate, RRMW, trade in recycling materials, real labor productivity, environmental taxes, and resource productivity on GDP per capita growth in EU countries.
| Dependent Variable: GDP_CAPITA_GROWTH | ||||
| Method: pooled least squares | ||||
| Sample: 2010–2017 | ||||
| Total panel observations: 216 GDP_CAPITA_GROWTH = C(1) + C(2) × CIRCULAR_MATERIAL + C(3)×MUNICIPAL_WASTE + C(4) × TRADE_MATERIALS + C(5) × LABOR_PROD+C(6) × ENVIRON_TAXES + C(7) × RESOURCE_PROD | ||||
| Coefficient | Standard Error | t-Statistic | Probability | |
| C | −12.9335 | 1.245 | 2.875409 | 0.0284 |
| CIRCULAR_MATERIAL | 0.107652 | 0.930 | 3.765092 | 0.0073 |
| MUNICIPAL_WASTE | 0.118950 | 0.848 | 2.987650 | 0.0053 |
| TRADE_MATERIALS | 0.108709 | 0.872 | 3.679802 | 0.0027 |
| LABOR_PROD ENVIRON_TAXES | 0.203765 0.097522 | 0.459 0.073 | 2.897695 3.098783 | 0.0231 0.0089 |
| RESOURCE_PROD | 0.178292 | 0.109 | ||
| R-squared | 0.776552 | Mean dependent var | 4.8762 | |
| Adjusted R-squared | 0.687378 | SD dependent var | 0.8954 | |
| Standard error (SE) of regression | 2.195433 | Akaike info criterion | 1.9034 | |
| Sum squared residual | 14.45673 | Schwarz criterion | 1.9835 | |
| Log likelihood | 82.38760 | Hannan-Quinn criterion | 1.6902 | |
| Durbin–Watson statistic | 2.187454 | |||
Table 8.
Statistical hypotheses.
| Hypothesis | Valid (Yes/No) |
|---|---|
| Hypothesis 1 | Yes |
| Hypothesis 2 | Yes |
| Hypothesis 3 | Yes |
| Hypothesis 4 | Yes |
| Hypothesis 5 | Yes |
| Hypothesis 6 | Yes |
© 2019 by the authors. Licensee MDPI, Basel, Switzerland. This article is an open access article distributed under the terms and conditions of the Creative Commons Attribution (CC BY) license (http://creativecommons.org/licenses/by/4.0/).
Share and Cite
MDPI and ACS Style
Busu, M.; Trica, C.L. Sustainability of Circular Economy Indicators and Their Impact on Economic Growth of the European Union. Sustainability 2019, 11, 5481. https://0-doi-org.brum.beds.ac.uk/10.3390/su11195481
AMA Style
Busu M, Trica CL. Sustainability of Circular Economy Indicators and Their Impact on Economic Growth of the European Union. Sustainability. 2019; 11(19):5481. https://0-doi-org.brum.beds.ac.uk/10.3390/su11195481
Chicago/Turabian StyleBusu, Mihail, and Carmen Lenuta Trica. 2019. "Sustainability of Circular Economy Indicators and Their Impact on Economic Growth of the European Union" Sustainability 11, no. 19: 5481. https://0-doi-org.brum.beds.ac.uk/10.3390/su11195481
Note that from the first issue of 2016, this journal uses article numbers instead of page numbers. See further details here.