Article

The Conundrums of Sustainability: Carbon Emissions and Electricity Consumption in the Electronics and Petrochemical Industries in Taiwan

1
The Graduate Institute of National Development, National Taiwan University, Taipei 10617, Taiwan
2
Risk Society and Policy Research Center (RSPRC), National Taiwan University, Taipei 10617, Taiwan
3
Institution of Technology Management, National Taiwan University of Science and Technology, Taipei 10617, Taiwan
*
Author to whom correspondence should be addressed.
Sustainability 2019, 11(20), 5664; https://0-doi-org.brum.beds.ac.uk/10.3390/su11205664
Submission received: 2 September 2019 / Revised: 11 October 2019 / Accepted: 11 October 2019 / Published: 14 October 2019
(This article belongs to the Section Energy Sustainability)

Abstract

:
The electronics industry plays an essential role in the future of a Taiwan economy based on science, technology, and innovation. At the same time, it is also the most energy-intensive industry. Taiwan is currently driven by high-carbon power generation, and adopts a passive carbon reduction pathway, but unless Taiwan urgently undergoes energy transition, the development of Taiwan’s electronics industry will be impeded. Our analysis found that the petrochemical and electronics industries are the main sources of carbon emissions (27.1%) and electricity consumption (31.6%) in Taiwan, and the existence of the petrochemical industry has constrained the growth of the electronics industry, which has therefore resulted in conundrums to Taiwan’s sustainability strategy. To accommodate the growth of the electronics industry, Taiwan needs to undertake three major transitions: energy transition, industrial transition, and restrain the growth of energy (energy conservation). Under the policy of the nuclear-free homeland, the reduction of coal-fired and thermal power generation, while at the same time increasing the share of renewable energy in power generation, are urgent and important government projects in Taiwan; however, the implementation has been sluggish.

1. Introduction

Industrialized countries are now at the juncture, faced with the international trend of sustainability, they need to develop strategies to maintain economic growth whilst undergoing a carbon reduction pathway. Similarly, Taiwan is also faced with the pressure of having to reduce carbon emissions and pollution, as well as to lower energy demand within the limited environmental capacity, in order to remain competitive, while at the same time being confronted by the dual pressures of international low-carbon and domestic environmental movements, which both involve complex issues. This article seeks to explain how the decoupling of economic growth and carbon emissions can be done in the pursuit of sustainability, and to identify the conundrums that act as barriers to Taiwan’s sustainable transition, as well as the policy perspectives that can be undertaken in Taiwan.
In 2016, Taiwan’s semiconductor exports comprised 13.6% of global exports, ranking third globally, and Taiwan’s information and communications (ICT) industry made up close to 43.9% of total exports, accounting for 17.2% of the GDP [1]. For the iPhone model that Apple introduced in the third quarter of 2018, the world-leading 7-nm A12 processor that makes up its internals is also made by the Taiwan Semiconductor Manufacturing Company (TSMC). However, as thermal power generation in Taiwan accounted for 85.9% of the power generation (and even by 2025, thermal power generation will still account for 80% under the current policy plan), the high amount of power demand by the electronics industry (17.7% in 2016) thus makes the industry one of the largest sources of carbon emissions in Taiwan [2]. In addition, TSMC’s electricity consumption is projected to increase by 18.4 billion kWh every year for the next 10 years [3]. The rising trend of high power demand and high carbon emissions in the electronics industry will therefore come into serious conflict with Taiwan’s current carbon reduction pathway. The development of the electronics industry, which consumes a high and increasing amount of electricity, may therefore be constrained by international requirements for carbon footprint reduction in the future. In other words, for the future of Taiwan’s economic development, the biggest challenge that the electronics industry face is whether it can bear the weight of its carbon emissions and electricity consumption.
Under the government’s current plan for carbon reduction, the “Greenhouse Gas Reduction Action Plan” mandated the establishment of targets to regulate total greenhouse gas emissions, where the emission reduction targets are set in phases every five years. The carbon reduction pathway was planned to be gradual at the start before being accelerated; as such, the greenhouse gas emissions reduction target in 2020 was set to be 2% lower than the baseline year of 2005, before the target is to be raised to being 10% lower by 2025 and 20% lower by 2030 [4]. However, according to the TSMC’s plans for its 5-nm and 3-nm production plants, the increase in electricity consumption is expected to increase carbon emissions by 13.66 million tons in the next 10 years when calculated based on the lowest emission factor of electricity generation, which is already equivalent to half the 2025 carbon reduction target, and would make up one-quarter of 2030’s target; this does not yet include the increase in the electricity consumption in the other electronics industries [5]. Therefore, based on the electricity emissions factor and industrial composition, it would be a challenge to achieve the carbon reduction targets and at the same time ensure power stability. The referendum held in Taiwan on 24 November 2018 rejected the 2025 deadline to achieve the nuclear-free homeland as stipulated under the Electricity Act, with the reason being that the public was concerned that Taiwan’s carbon reduction and energy transition plans might result in energy disruption and impact on economic growth. Taiwan’s current situation means that it is therefore faced with the predicament of being forced to choose between the development of the electronics industry and carbon reduction [6]. This article analyses various sources of data to identify and summarize the main problems that are faced by Taiwan’s carbon emissions and electricity consumption composition, and proposes countermeasures regarding how to address these issues.
The literature review and research method will be covered in Section 2 and Section 3, respectively, after which, Section 4 will provide an overview of the carbon emissions and quantitative economic data to identify the sectors with the highest carbon emissions and electricity consumption in Taiwan in order to develop a pathway for structural reform. Section 5 will seek to explain the predicament that Taiwan is facing in its efforts to decouple economic growth from carbon emissions, and will adopt a qualitative policy analysis approach grounded in the energy composition data to understand the interdependence between carbon reduction and energy, so as to propose possible solutions that Taiwan can undertake.

2. Decoupling Economic Growth from Carbon Emission and Electricity Consumption

Since Taiwan first responded to the International Convention on Climate Change in 1998 by proposing a greenhouse gas reduction target, it has repeatedly reaffirmed or adjusted the targets. The Paris Agreement was signed in December 2015, and in September in the same year, Taiwan announced to the world its Intended Nationally Determined Contributions (INDC). Thereafter, the Greenhouse Gas Reduction and Management Act was promulgated in January 2018, with the goal of reducing Taiwan’s carbon emissions in 2030 by 80% from 2005 levels, and to reduce total emissions to about 214 million tons. However, for countries striving for economic development, an important concern is how they would be able to maintain economic growth whilst under a carbon reduction pathway. Fankhauser and Jotzo [7] pointed out that economic development over the last 200 years was built on fossil fuel energy and the energy generated by fossil fuels was the main driver of economic growth; however, due to climate change, fossil fuel use therefore has to be limited, and countries have to consider how the energy demands for development can be met while enforcing carbon reduction regulations. They believe that investing in a power generation infrastructure, on the backdrop of green energy and innovation, and enhancing market practices, would be beneficial for developing countries that are pursuing universal access to energy. Zoundi [8] came out with the same conclusion in a study of 25 African countries, which stated that renewable energy can be used to reduce carbon emissions and act as an alternative to fossil fuels in the long run. Nordin et al. [9] also found that the carbon emissions of energy-importing countries have been impacted by their electricity consumption and economic growth, both over the short and long term, and that if the electricity consumption of energy-importing countries are controlled and investments in renewable energy are made in those countries’ industries, that this would reduce pollution and carbon emissions. Therefore, there exists a strong association between carbon emissions and electricity consumption, which is consistent with the situation in Taiwan.
York et al. [10] pointed out that, from 1960 to 2012, transnational data showed that in countries where renewable energy accounted for a major component of their power generation, the per capita carbon emissions were lower as well. However, in rich countries, a high proportion of renewable energy use is still closely related with the countries’ economic growth and carbon emissions. The decoupling between carbon emissions and economic growth should therefore not only rely on the development of renewable energy, but requires a lesser reliance of the country’s political and economic structures on fossil fuels. Wu et al. [11] found that there is greater potential among developed countries to ensure that the implementation of carbon reduction measures have a lesser impact on economic growth. However, there is a strong relationship between economic growth and carbon emissions in developing countries, which therefore requires energy conservation to be an important policy tool for carbon emissions reduction. Increasing energy efficiency has also been shown to contribute to carbon reduction in all countries. In addition, developing countries need to change their industrial compositions, to transform into low-energy demand manufacturing with high added value in order to undergo carbon reduction. It is worth noting that a global study conducted by Schandl et al. [12] found that economic growth and environmental goals (such as greenhouse gas reductions) can be achieved simultaneously, and it is therefore necessary to improve resource use efficiency, which includes that of electricity, fossil fuels, and various raw materials.
An overview of the literature therefore shows that policy changes that are targeted at changing the industrial composition to improve energy efficiency, as well as by replacing fossil fuels with renewable energy, is an effective way to decouple carbon emissions from economic growth, though there still exist differences in the energy composition and the stages of economic development between different countries. Meanwhile, the different stages of economic development in different countries require completely different decoupling policies in terms of energy production and consumption, though the literature did not provide specific policy recommendations for the industrial and energy transitions in these countries. Therefore, even though quantitative research can provide “various degrees of the correlations and trends of carbon emissions and economic growth among rich and developing countries,” whether individual countries can successfully undergo carbon reduction while maintaining economic growth would require a qualitative analysis of the industrial and energy development policies in order to allow for the interpretation of the longitudinal studies and outcomes to be supported.
Taiwan has reached an economic stage of development where it has the socioeconomic conditions to access affordable energy. In addition, the main source of Taiwan’s GDP contributions come from the capital- and innovation-driven electronics industries rather than the energy-intensive industries, which should therefore allow Taiwan to be better placed for decoupling economic growth from carbon emissions. However, in reality, the relationship between economic growth, energy consumption, and carbon emissions in Taiwan is still very high, which is different from other developed countries in Europe like the U.K. and Germany. Previous studies mainly used quantitative data on transnational carbon emissions and economic growth for analysis. However, the context of electricity consumption, industrial composition, and economic development strategies in each country are very different, and it is therefore necessary to analyze the key factors that contribute to carbon reduction and economic growth in each of these countries.

3. Research Methods

This research is a longitudinal study based on secondary data analysis. Secondary data analysis is a social research method that uses existing statistical data (such as a census) or data from a large academic database to further analyze the subject for empirical exploration. Since the argument of this research requires the observation of long-term changes in electricity, energy, and carbon emissions in Taiwan, secondary data analysis is therefore suitable as a method for this study [13].
The main analysis data of this study comes from official statistics and past research, as well as reports in newspapers and magazines, which were also used to supplement the arguments put forward by this research. The official statistics included information on electricity, carbon emissions, and energy use in Taiwan’s electronics and petrochemical industries from 1996 to 2016. In addition, the sources included the latest information on electricity and carbon emissions in various industries, which we contrasted with relevant policy white papers and policy reports to perform quantitative and qualitative research.
The research structure of the article is mainly comprised of two parts. The first part of the article begins with a background on Taiwan’s carbon reduction policy and a short analysis of its policy effectiveness. Thereafter, the article will analyze the composition of Taiwan’s carbon emissions and electricity growth, and then pay close attention to Taiwan’s most important industries (and their intensities). For high electricity-using industries (e.g., semiconductor production), the focus will be on their indirect emissions from electricity use in comparison to their GDP contributions, from which this section will provide some policy implications when faced with the juxtaposition between wanting to reduce emissions and maintain economic growth at the same time. The second part of the article explores key issues pertaining to the carbon emissions related to energy composition. This section will analyze how the slow energy transition in Taiwan has led to a carbon reduction dilemma, and explain why the solution to accelerate Taiwan’s energy transformation lies with the decoupling of economic growth and carbon emissions.

4. Carbon Emissions and Electricity Consumption as a Critical Issue of Sustainability

4.1. Taiwan’s Current Plan for Carbon Reduction

Over the last 20 years, Taiwan has introduced several policy mechanisms and set several carbon emissions targets to move gradually toward an energy transition (such as the nuclear-free homeland policy and the Renewable Energy Development Act). However, the fact is that Taiwan’s energy transition has been too slow means it has been difficult to achieve the carbon reduction and transition targets. Currently, the Greenhouse Gas Reduction Action Plan mandates the establishment of targets to regulate total greenhouse gas emissions, with the emission reduction targets phased in and set at each five-year point. The carbon reduction pathway was gradual at the start before it was accelerated, where the greenhouse gas emissions reduction target in 2020 was set to be 2% lower than the baseline year of 2005, 10% lower by 2025, and 20% lower by 2030 [4]. It is estimated that the reduction in 2025 would be about 239.4 million tons. This carbon reduction plan comes from the Energy Bureau’s National Energy Resources Supply and Demand Report (2018–2025). Based on this report, renewable energy would account for 15% of the total power generation, and would still not reach the target of 20% under the government’s original plan. Therefore, carbon emissions would need to be further reduced if the renewable energy goal under the 2050 energy composition target is to be met. In addition, the target for the electricity emission factor in 2020 should be 0.492 kg CO2e per kWh. Increasing the installed capacity of renewable energy by 17,250 MW would also allow energy efficiency to be further enhanced [14].
The most important target in the Energy Transition White Paper is to achieve the distribution of electricity generation at 20% renewable energy, 30% coal-fired power, and 50% natural gas. At the same time, the White Paper also proposed new proposals and targets in relation to the energy conservation goals. The planning for the reduction pathway would also rely on the technological breakthroughs and supporting measures to allow energy intensity and electricity generation to improve by 2.4% and 2%, respectively, from 2017 to 2025 [14]. Although the government has proposed these carbon reduction targets, a deeper look at Taiwan’s carbon emissions and electricity consumption composition reveals the two major sectors that are the main sectors responsible for carbon emissions and electricity consumption, namely the petrochemical and electronics industries, which when coupled with Taiwan’s energy composition, present the greatest obstacles to the carbon reduction targets.

4.2. The Main Composition of Carbon Emissions and Electricity Consumption

Chou’s study [
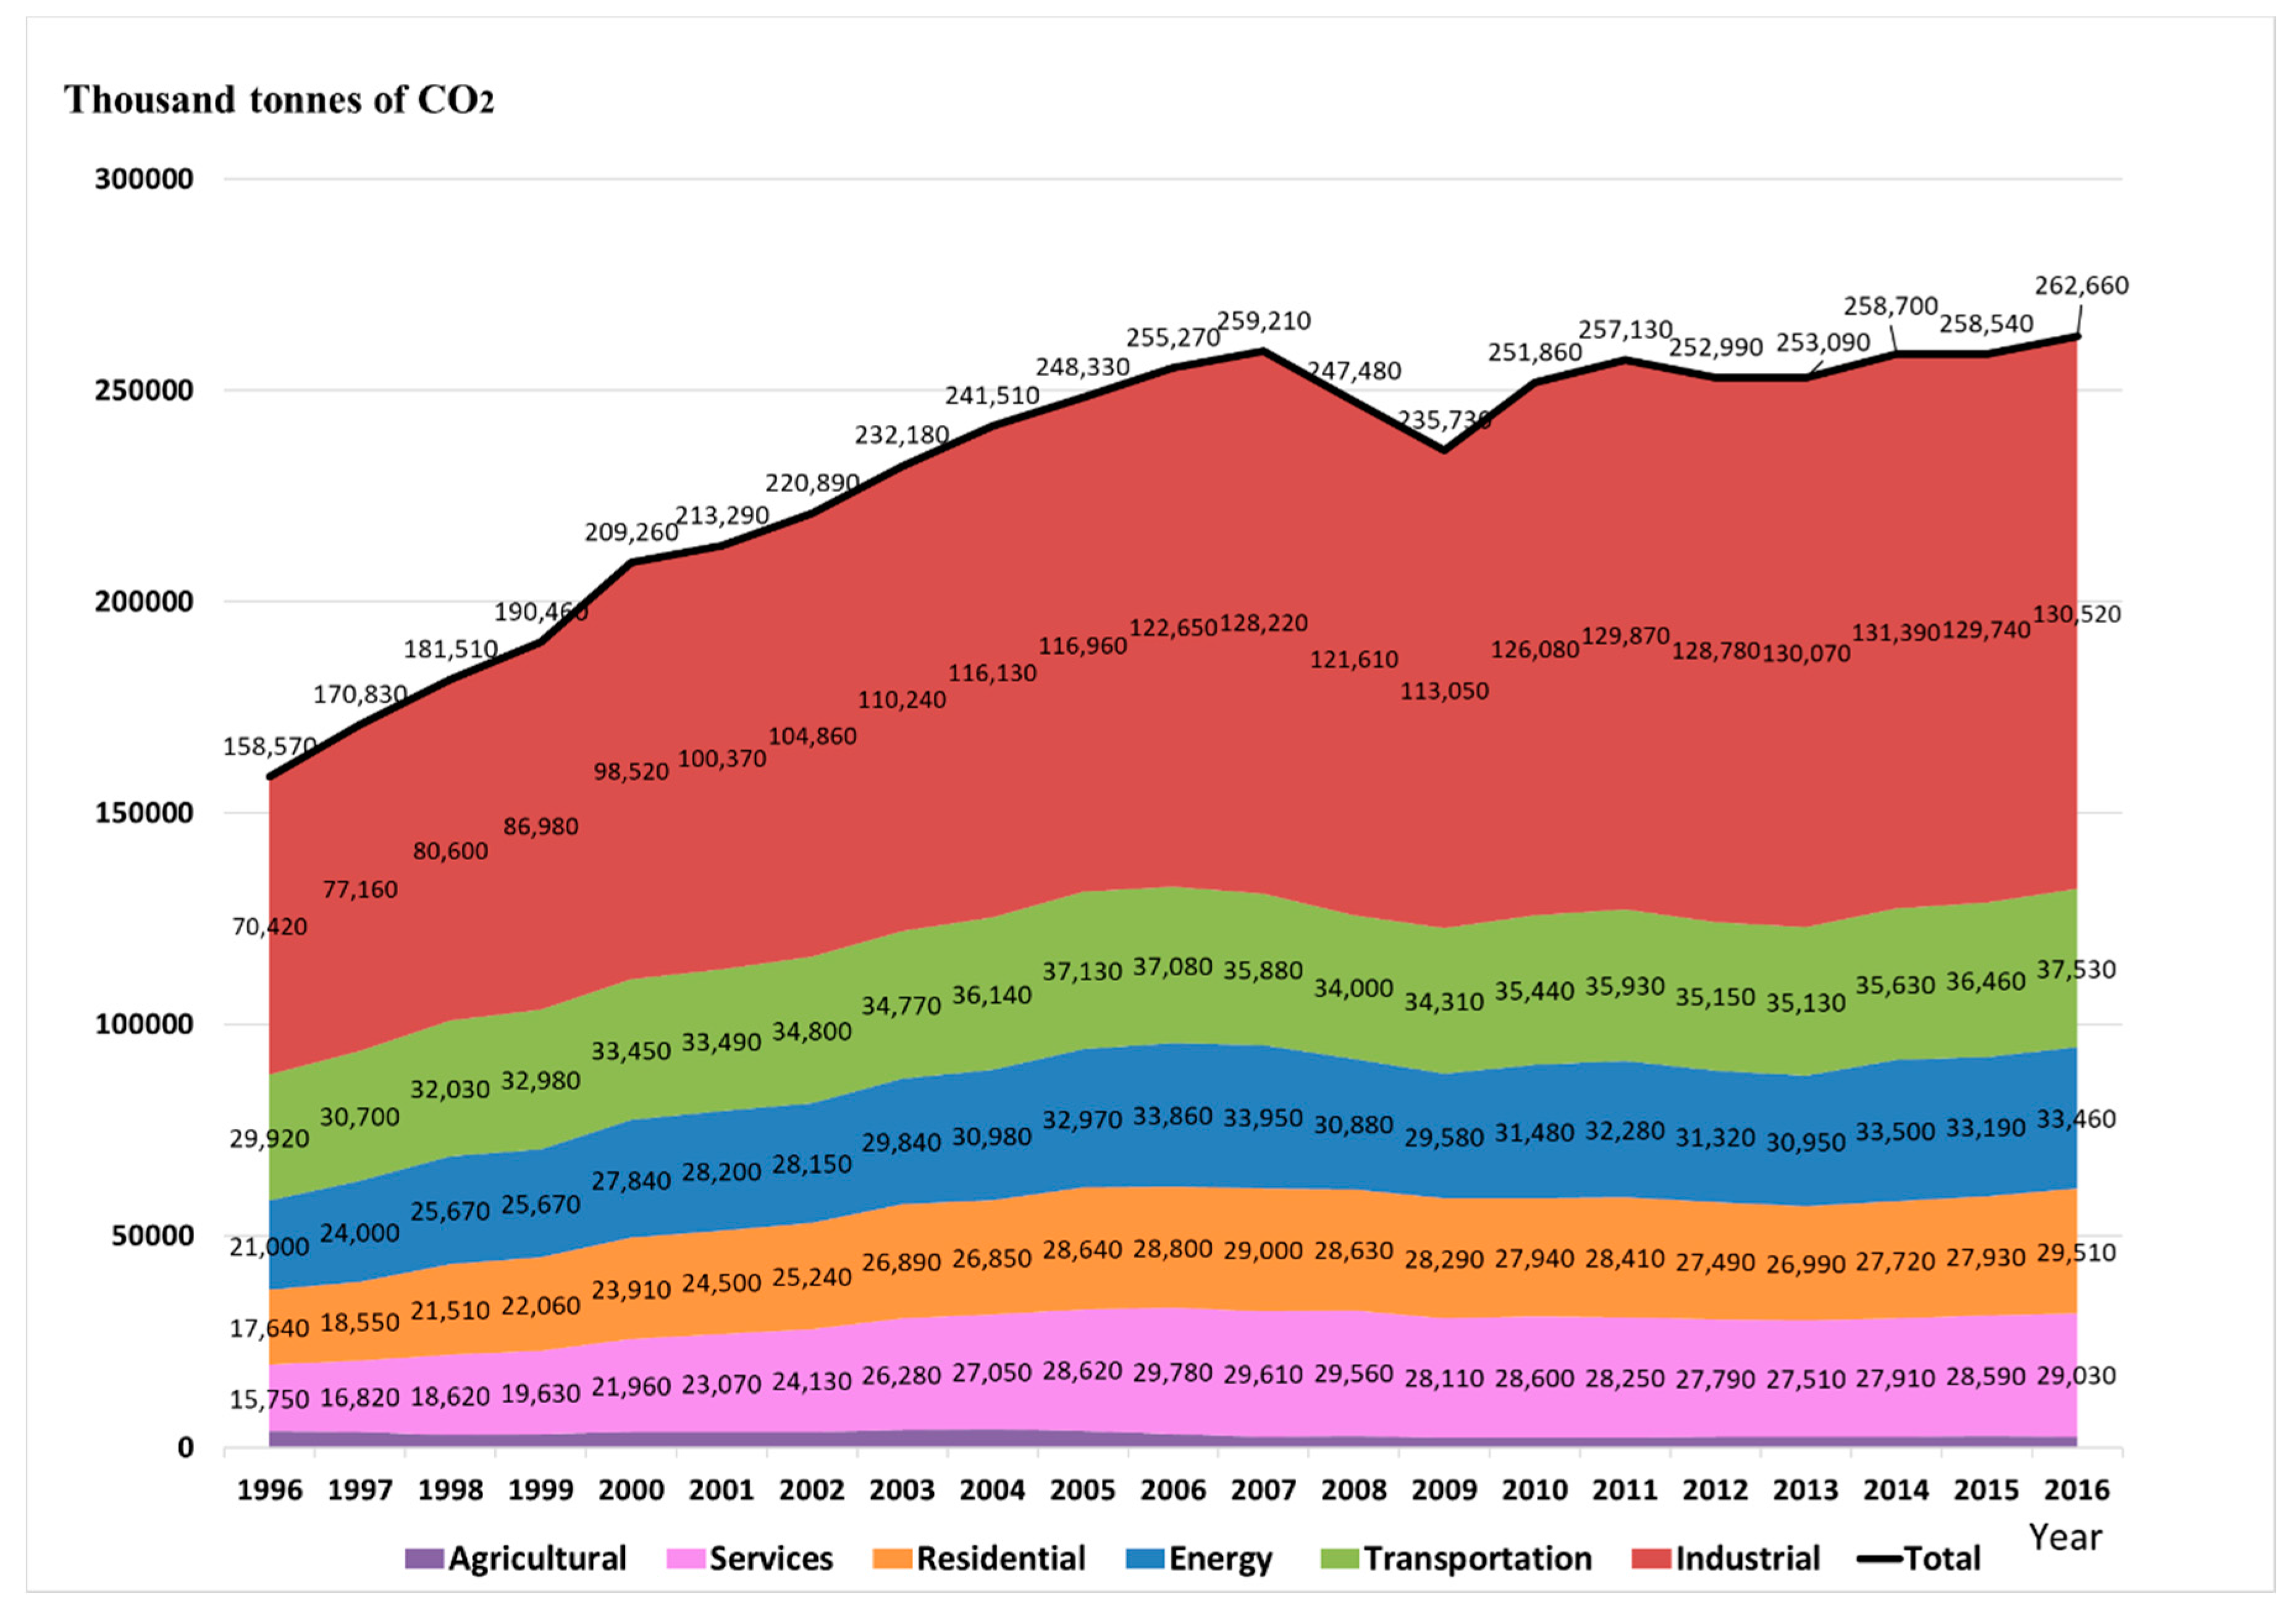
15] showed that in the past 20 years, Taiwan’s carbon emissions have grown by 111,860 kilotons, with the industrial sector accounting for 56.2% (62,940 kilotons) (
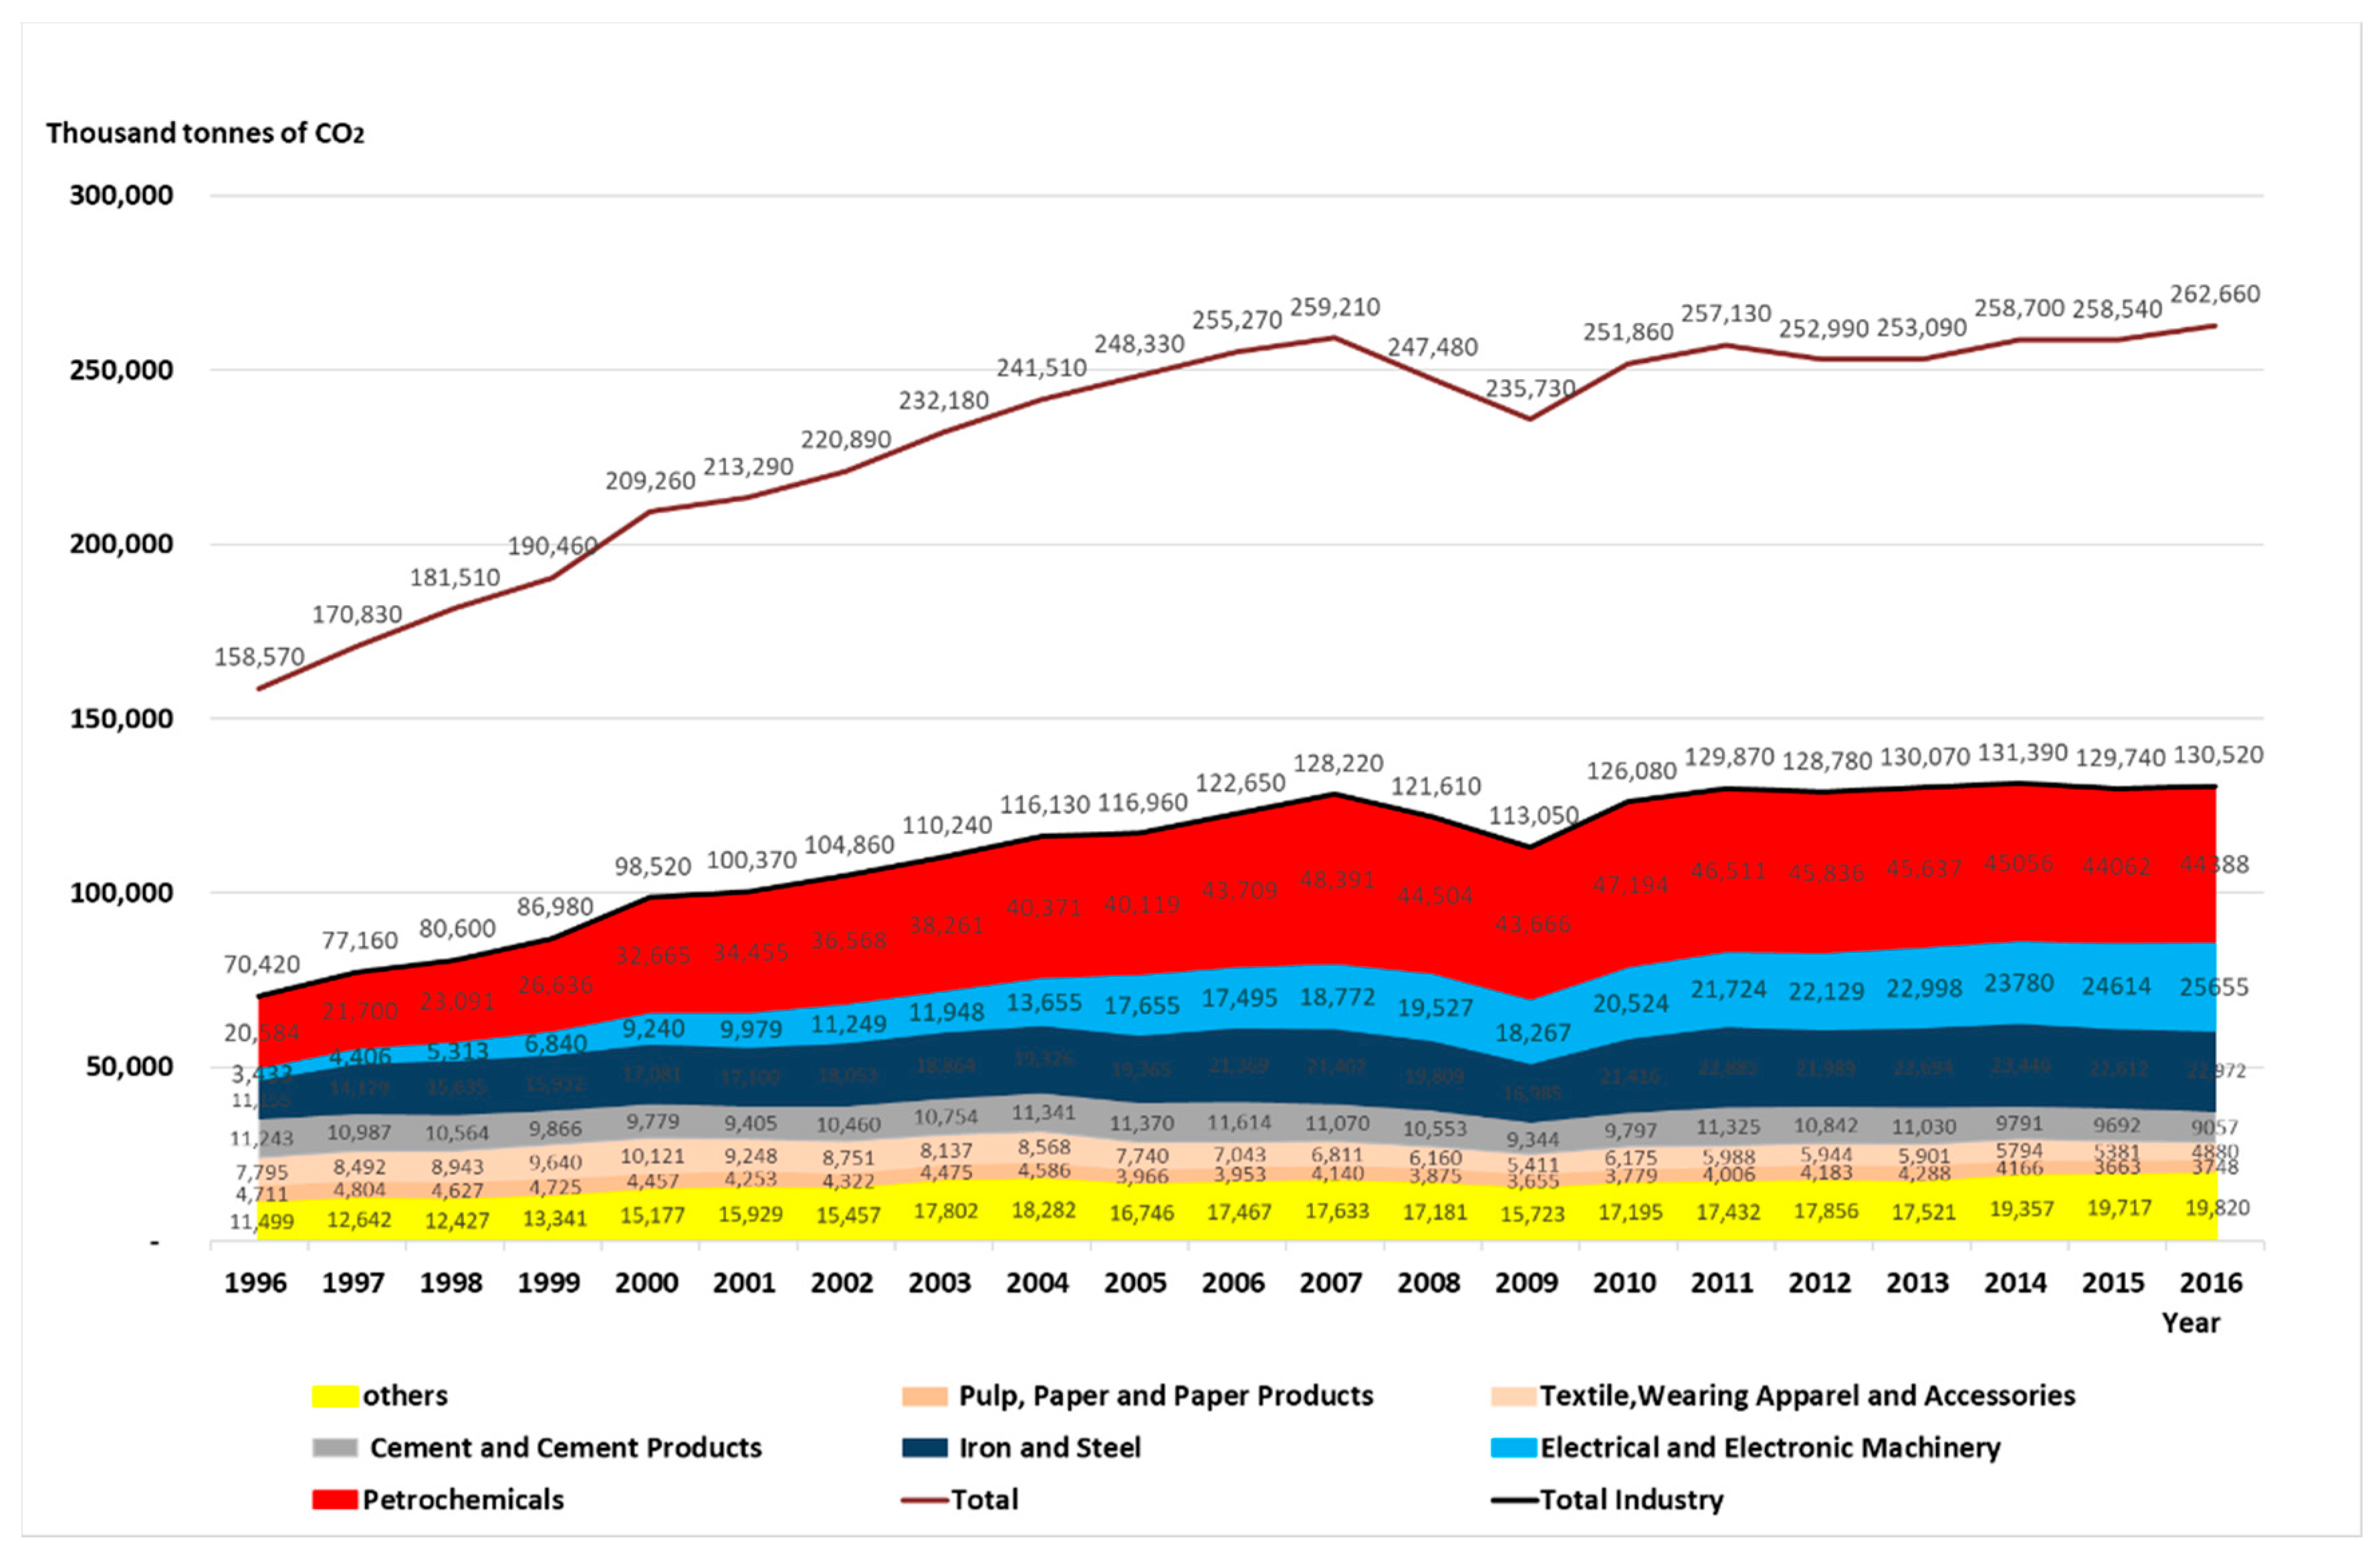
Figure 1). When looking at the industrial sector (Figure 2), the petrochemical industry accounted for 22.3% (24,916 kilotons), and the electronics industry accounted for 20.3% (22,717 kilotons), of which the growth of the petrochemical and electronics industries accounted for 42.6% of the country’s emissions and 75.7% of industrial emissions. It can therefore be said that the petrochemical and electronics industries have been the main contributors toward carbon emissions in Taiwan. However, the nature of Taiwan’s petrochemical and electronics industries are very different. The contribution of the electronics industry to Taiwan’s GDP has been increasing year after year, while the energy intensity has been decreasing every year, which means that the GDP efficiency of the electronics industry is better than the petrochemical industry. Since the main carbon emissions and electricity consumption of the electronics industry come mainly from electricity consumption, improving Taiwan’s energy composition and increasing the efficiency of energy consumption would be able to effectively reduce the carbon emissions from the electronics industry. Comparatively, the petrochemical industry, by its very nature, produces high carbon emissions and is highly energy intensive. As Taiwan currently faces a situation of high carbon emissions and electricity consumption by the petrochemicals and electronics industries, which are conundrums intertwined with the transformation of energy, environment, and industry, while at the same time being confronted by the dual pressures of international low-carbon and domestic environmental movements, the only solution for Taiwan therefore seems to be to reduce carbon emissions, energy demand, and pollution, in order to remain competitive [16]. Therefore, the key is in how to reform the structure of these energy-intensive industries to accommodate the high-value-added electronics industries.
Although Taiwan has introduced several successive policy programs to respond to international green conventions since 1998, it has continued to develop energy-intensive industries that produce high carbon emissions and use a high amount of energy [15] In addition, most of the carbon emissions from the electronics industry come from electricity use, of which, process carbon emissions made up 20% of ICT carbon emissions in 2009, but has since been reduced to 14.5% in 2015, which shows that the process energy efficiency in the electronics industry has turned toward a developmental trend based on innovative design in order to increase additional value. Research showed that the main drivers behind Taiwan’s low carbon transition, which relied on the internalization of external costs, such as via using carbon tax, environmental impact assessment, alternative energy development, and the promotion of an industrial transition, has lacked success [
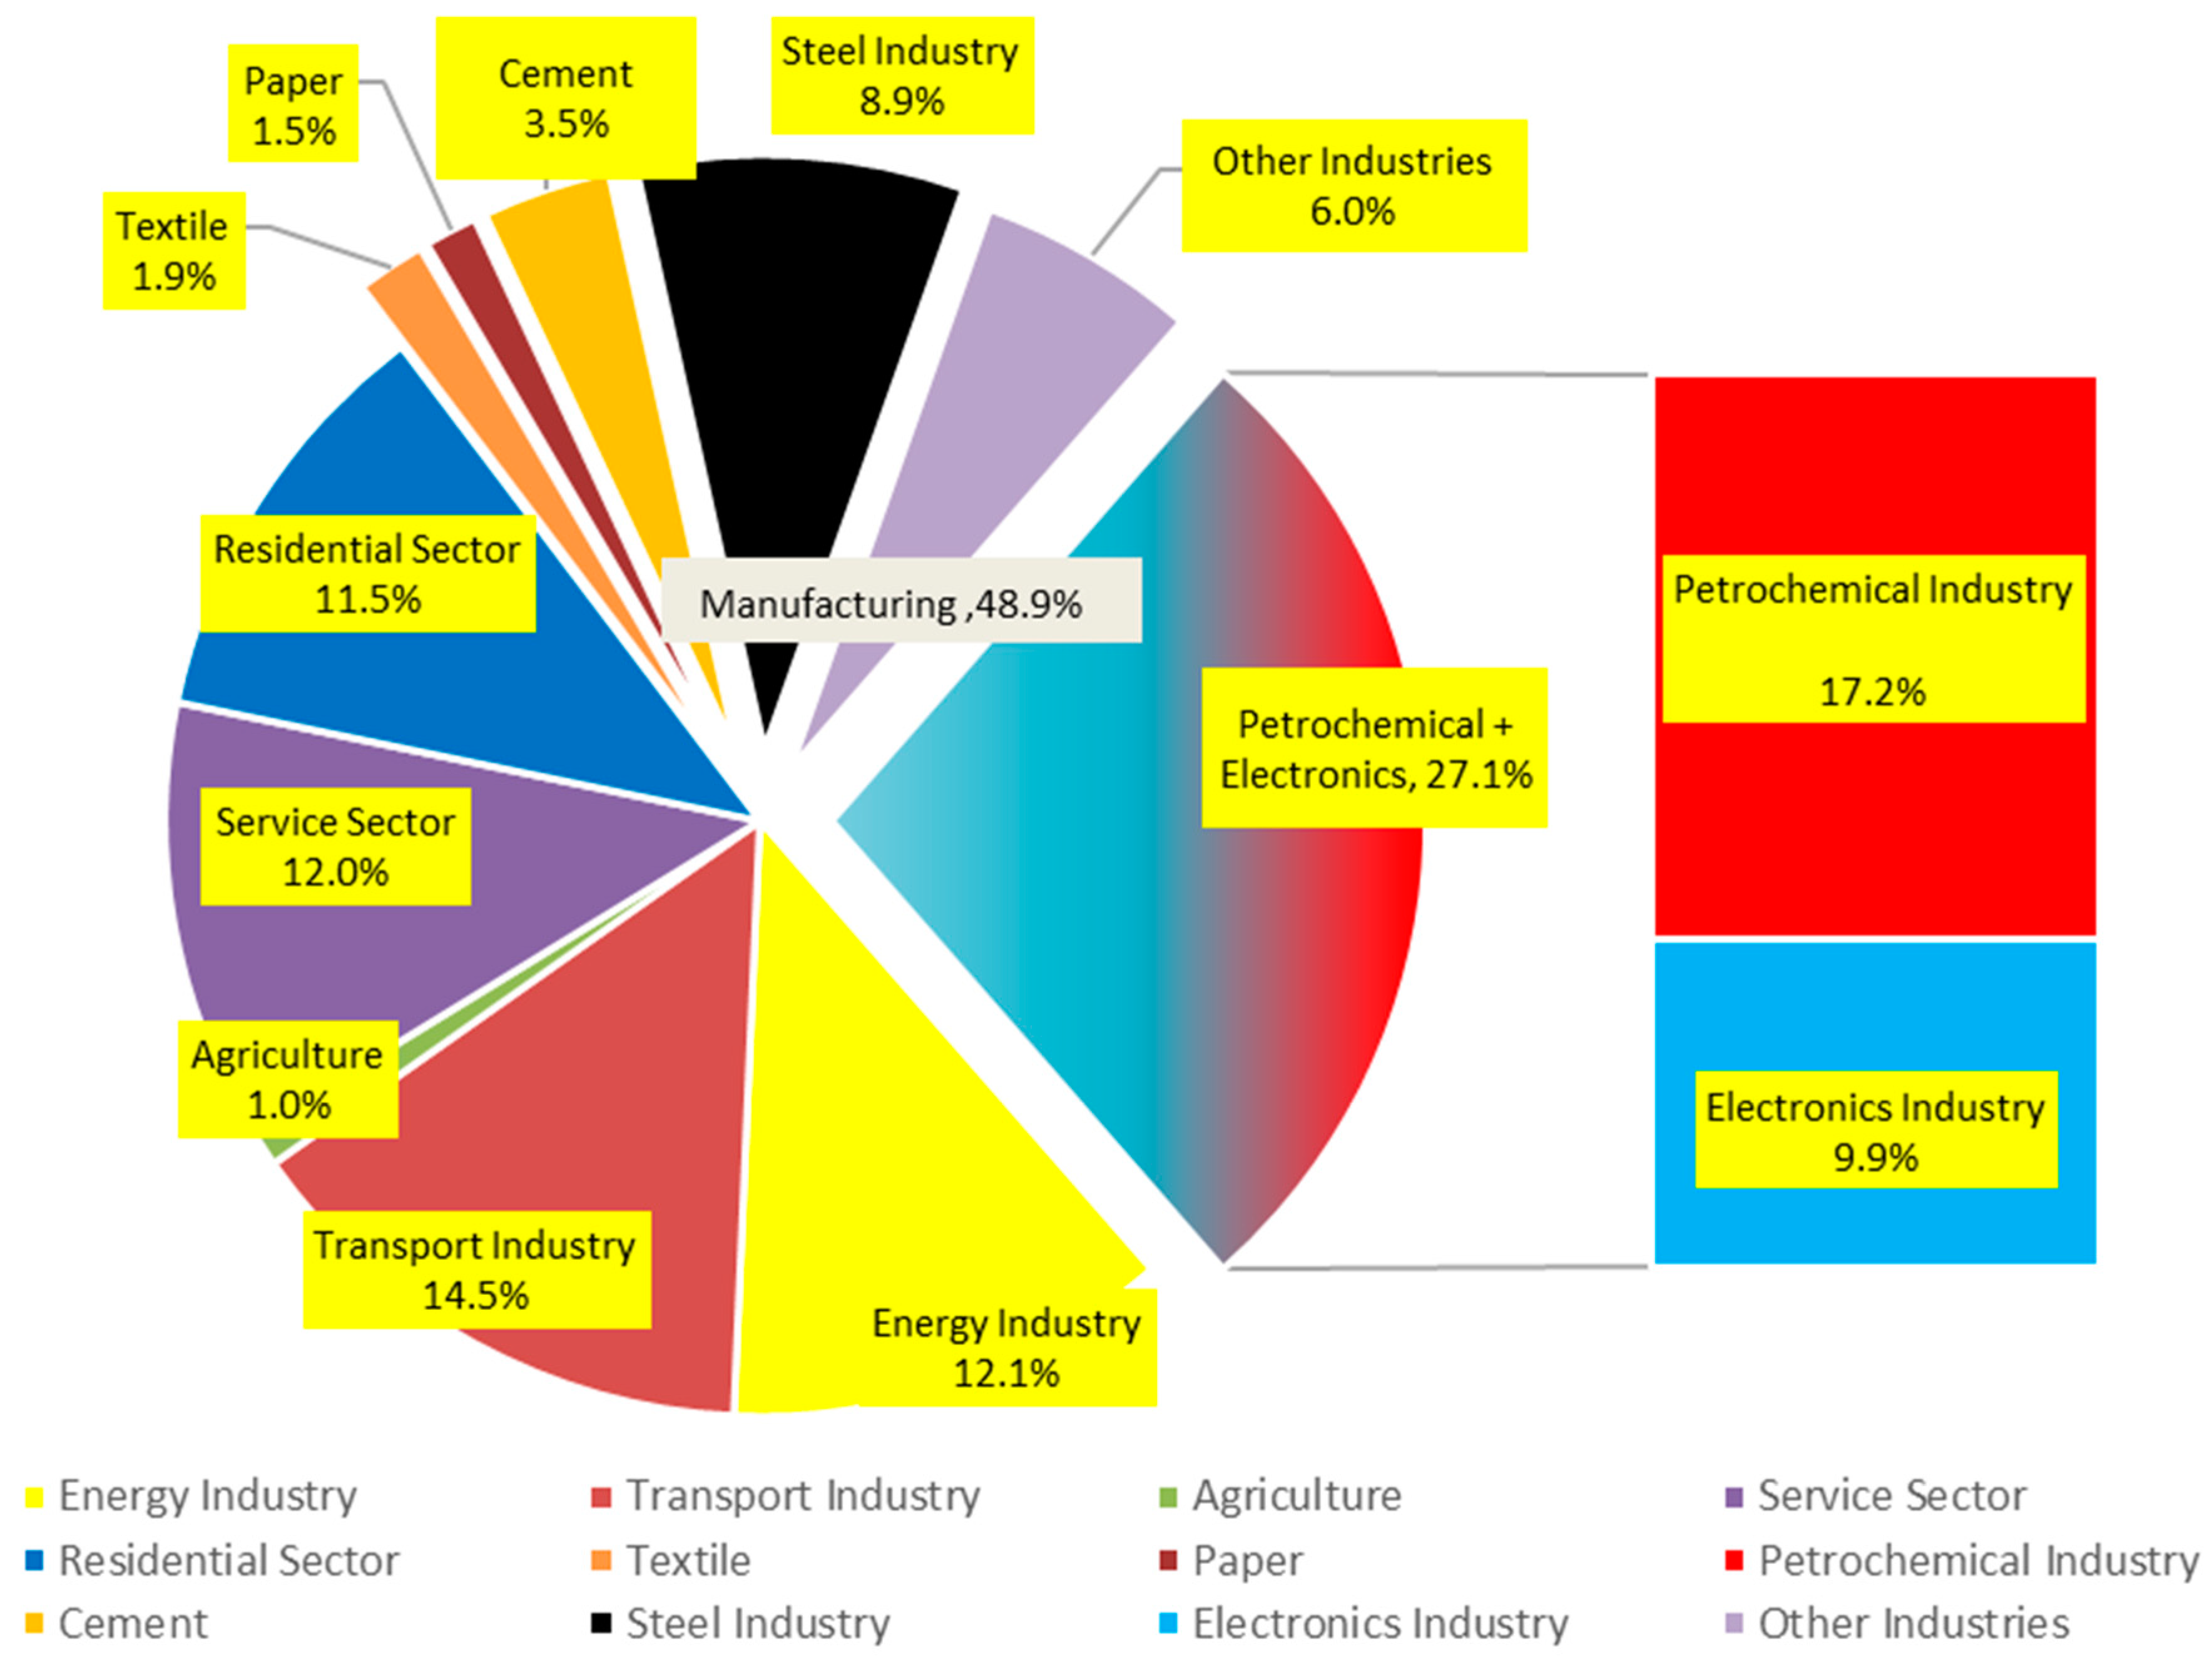
16]. As can be seen in Figure 3, among Taiwan’s main carbon sources, industrial sources accounted for 48.9%, of which, more than half were from the petrochemical industry and electronics industry, which accounted for 27.1% of Taiwan’s carbon emissions in 2016, whereas other industries accounted for only 21.8%. In other words, more than a quarter of the carbon emissions in Taiwan are produced by the petrochemical industry and the electronics industry. The carbon emissions by the energy and transportation sectors accounted for another quarter (26.6%), and the residential, services, and agriculture sectors made up the remaining quarter.
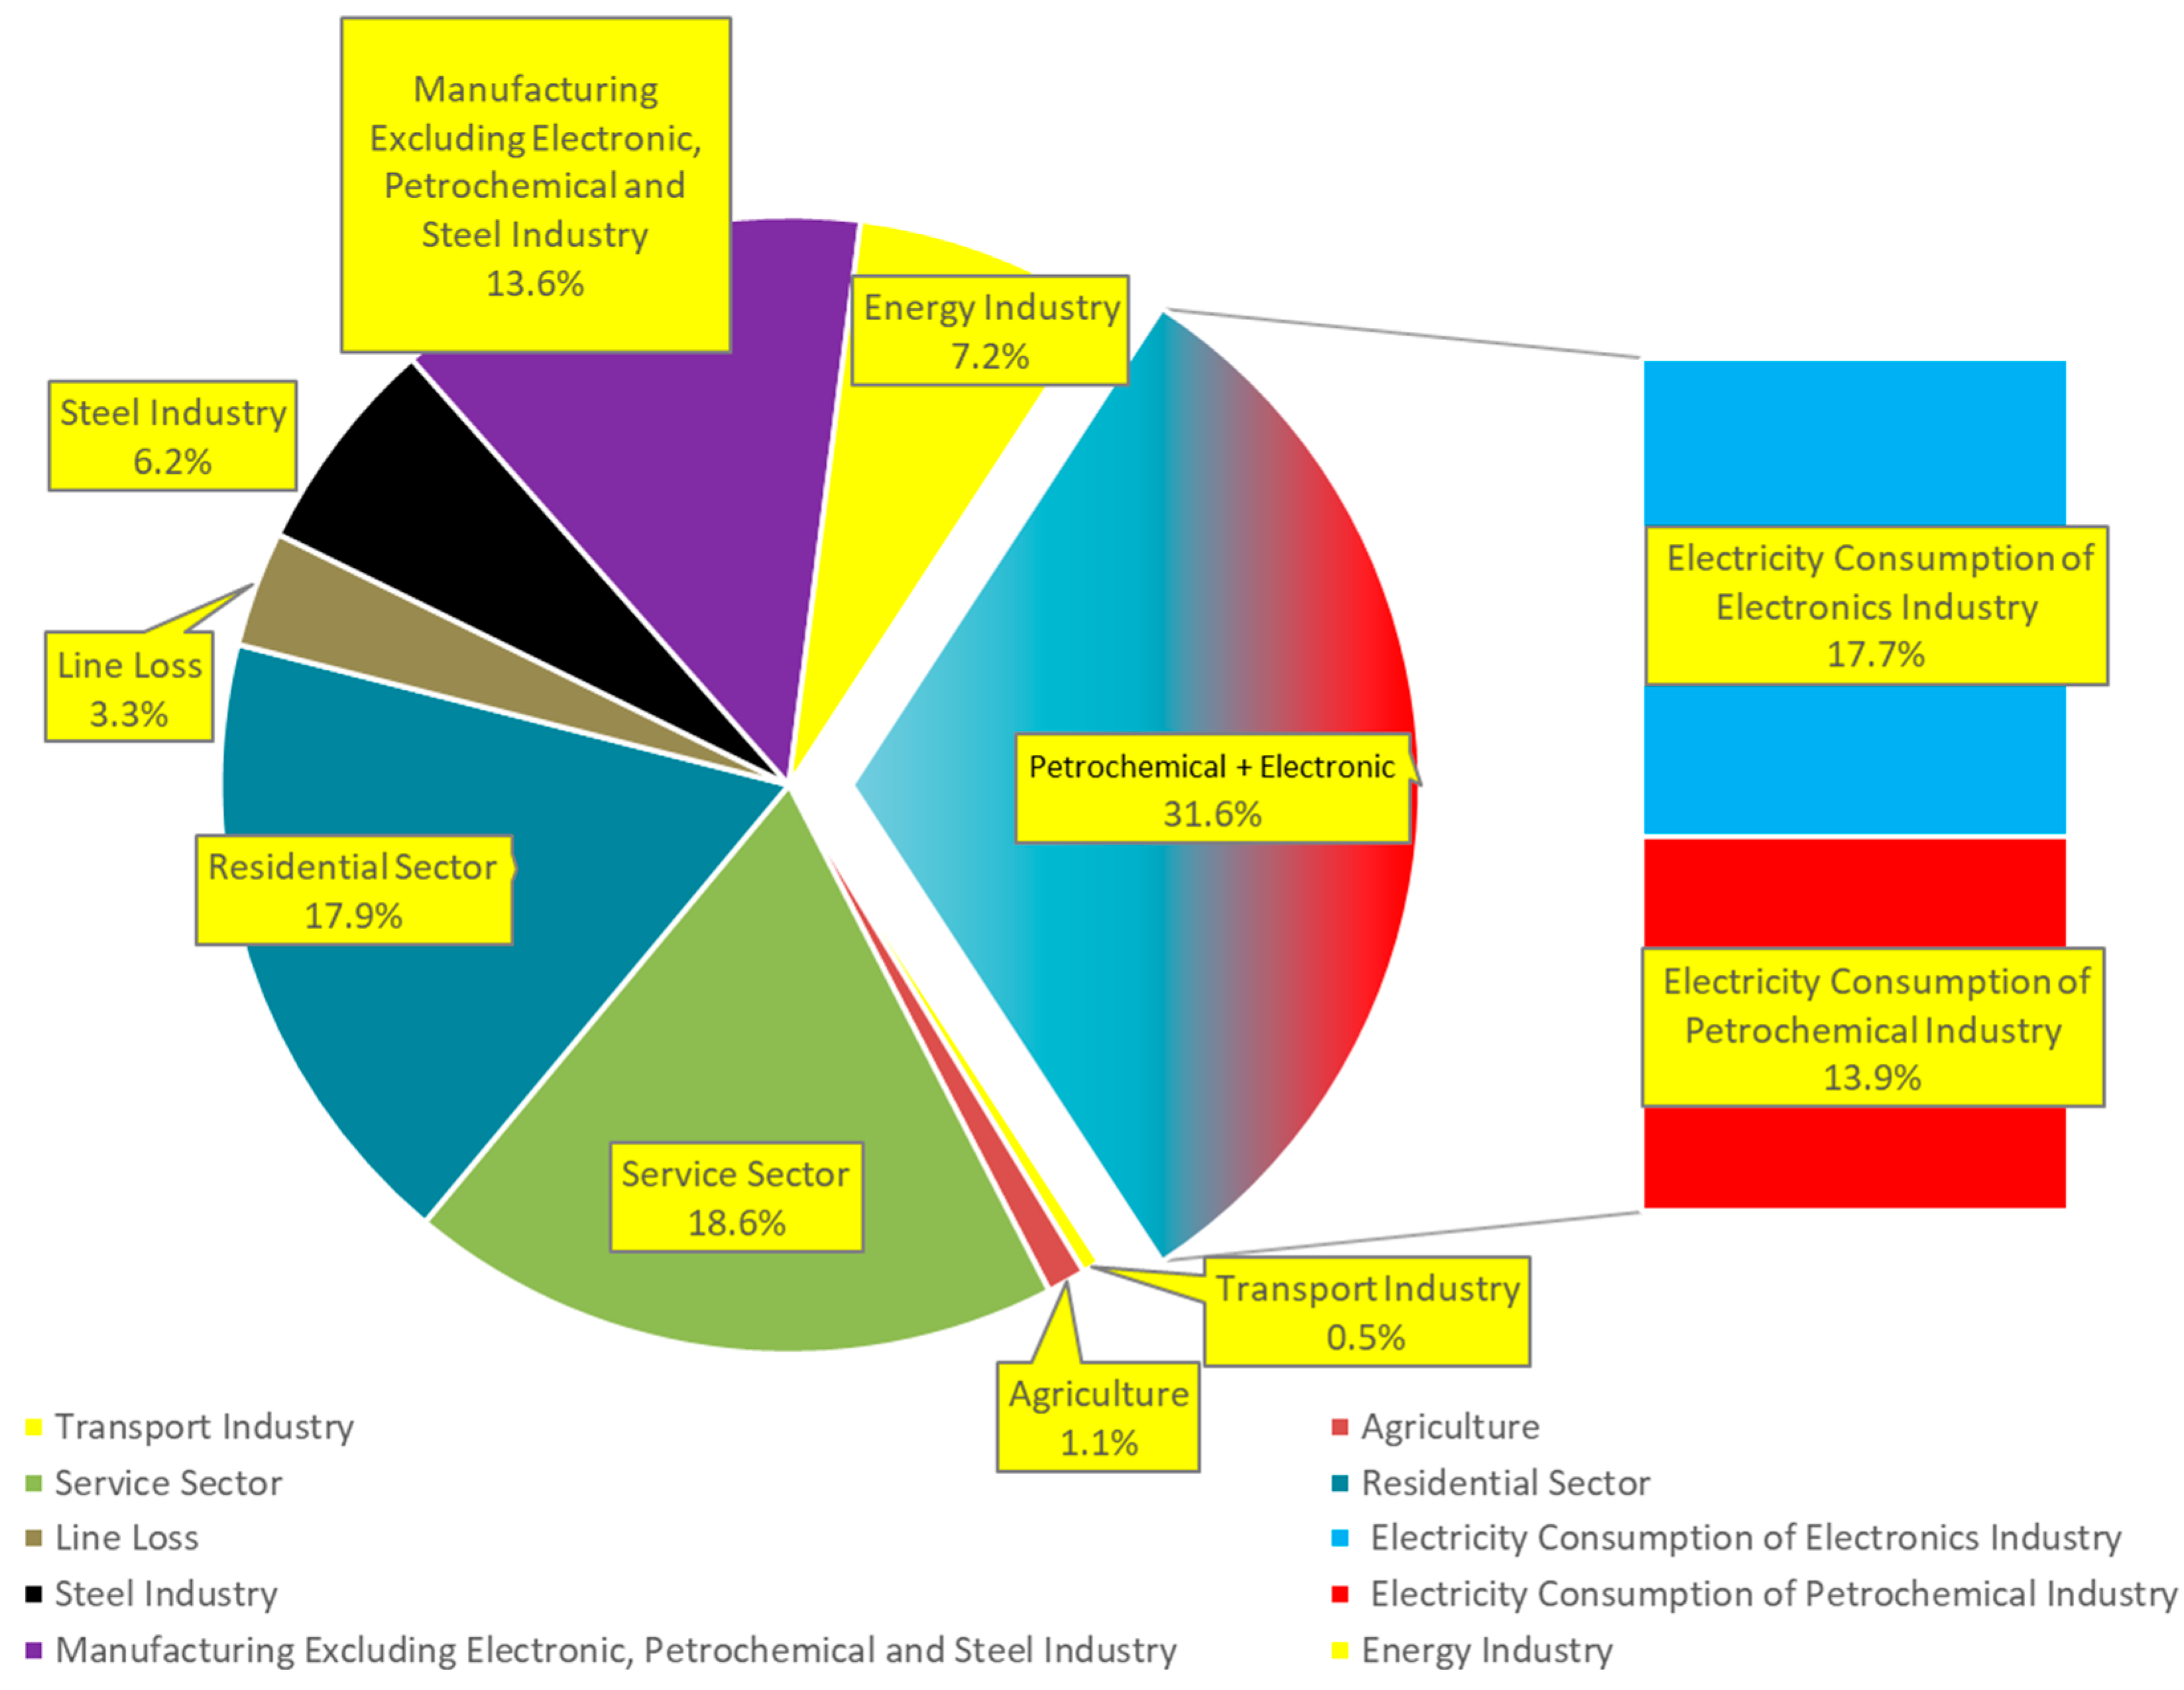
Figure 4 shows that the petrochemical and electronics industries made up the bulk of the total electricity consumption in Taiwan in 2016, with a consumption of 31.6%. The electricity consumption by the energy sector and by industries other than the petrochemicals industries made up 27.0%, which means that the energy consumption by the industrial and energy sectors comprised 58.6% of Taiwan’s electricity use and produced 62% of the carbon emissions. From the above analysis, it can be seen that for Taiwan to be able to effectively reduce carbon emissions and electricity consumption, whilst maintaining Taiwan’s international competitiveness, the key therefore lies in managing the high carbon emissions and high electricity consumption of the petrochemical and electronics industries. On the whole, the carbon emissions of 44,388 kilotons from the petrochemical industry is higher than the 25,655 kilotons from the electronics industry by about 1.7 times. In terms of electricity consumption, the electronics industry consumed 1.3 times that of the petrochemical industry.
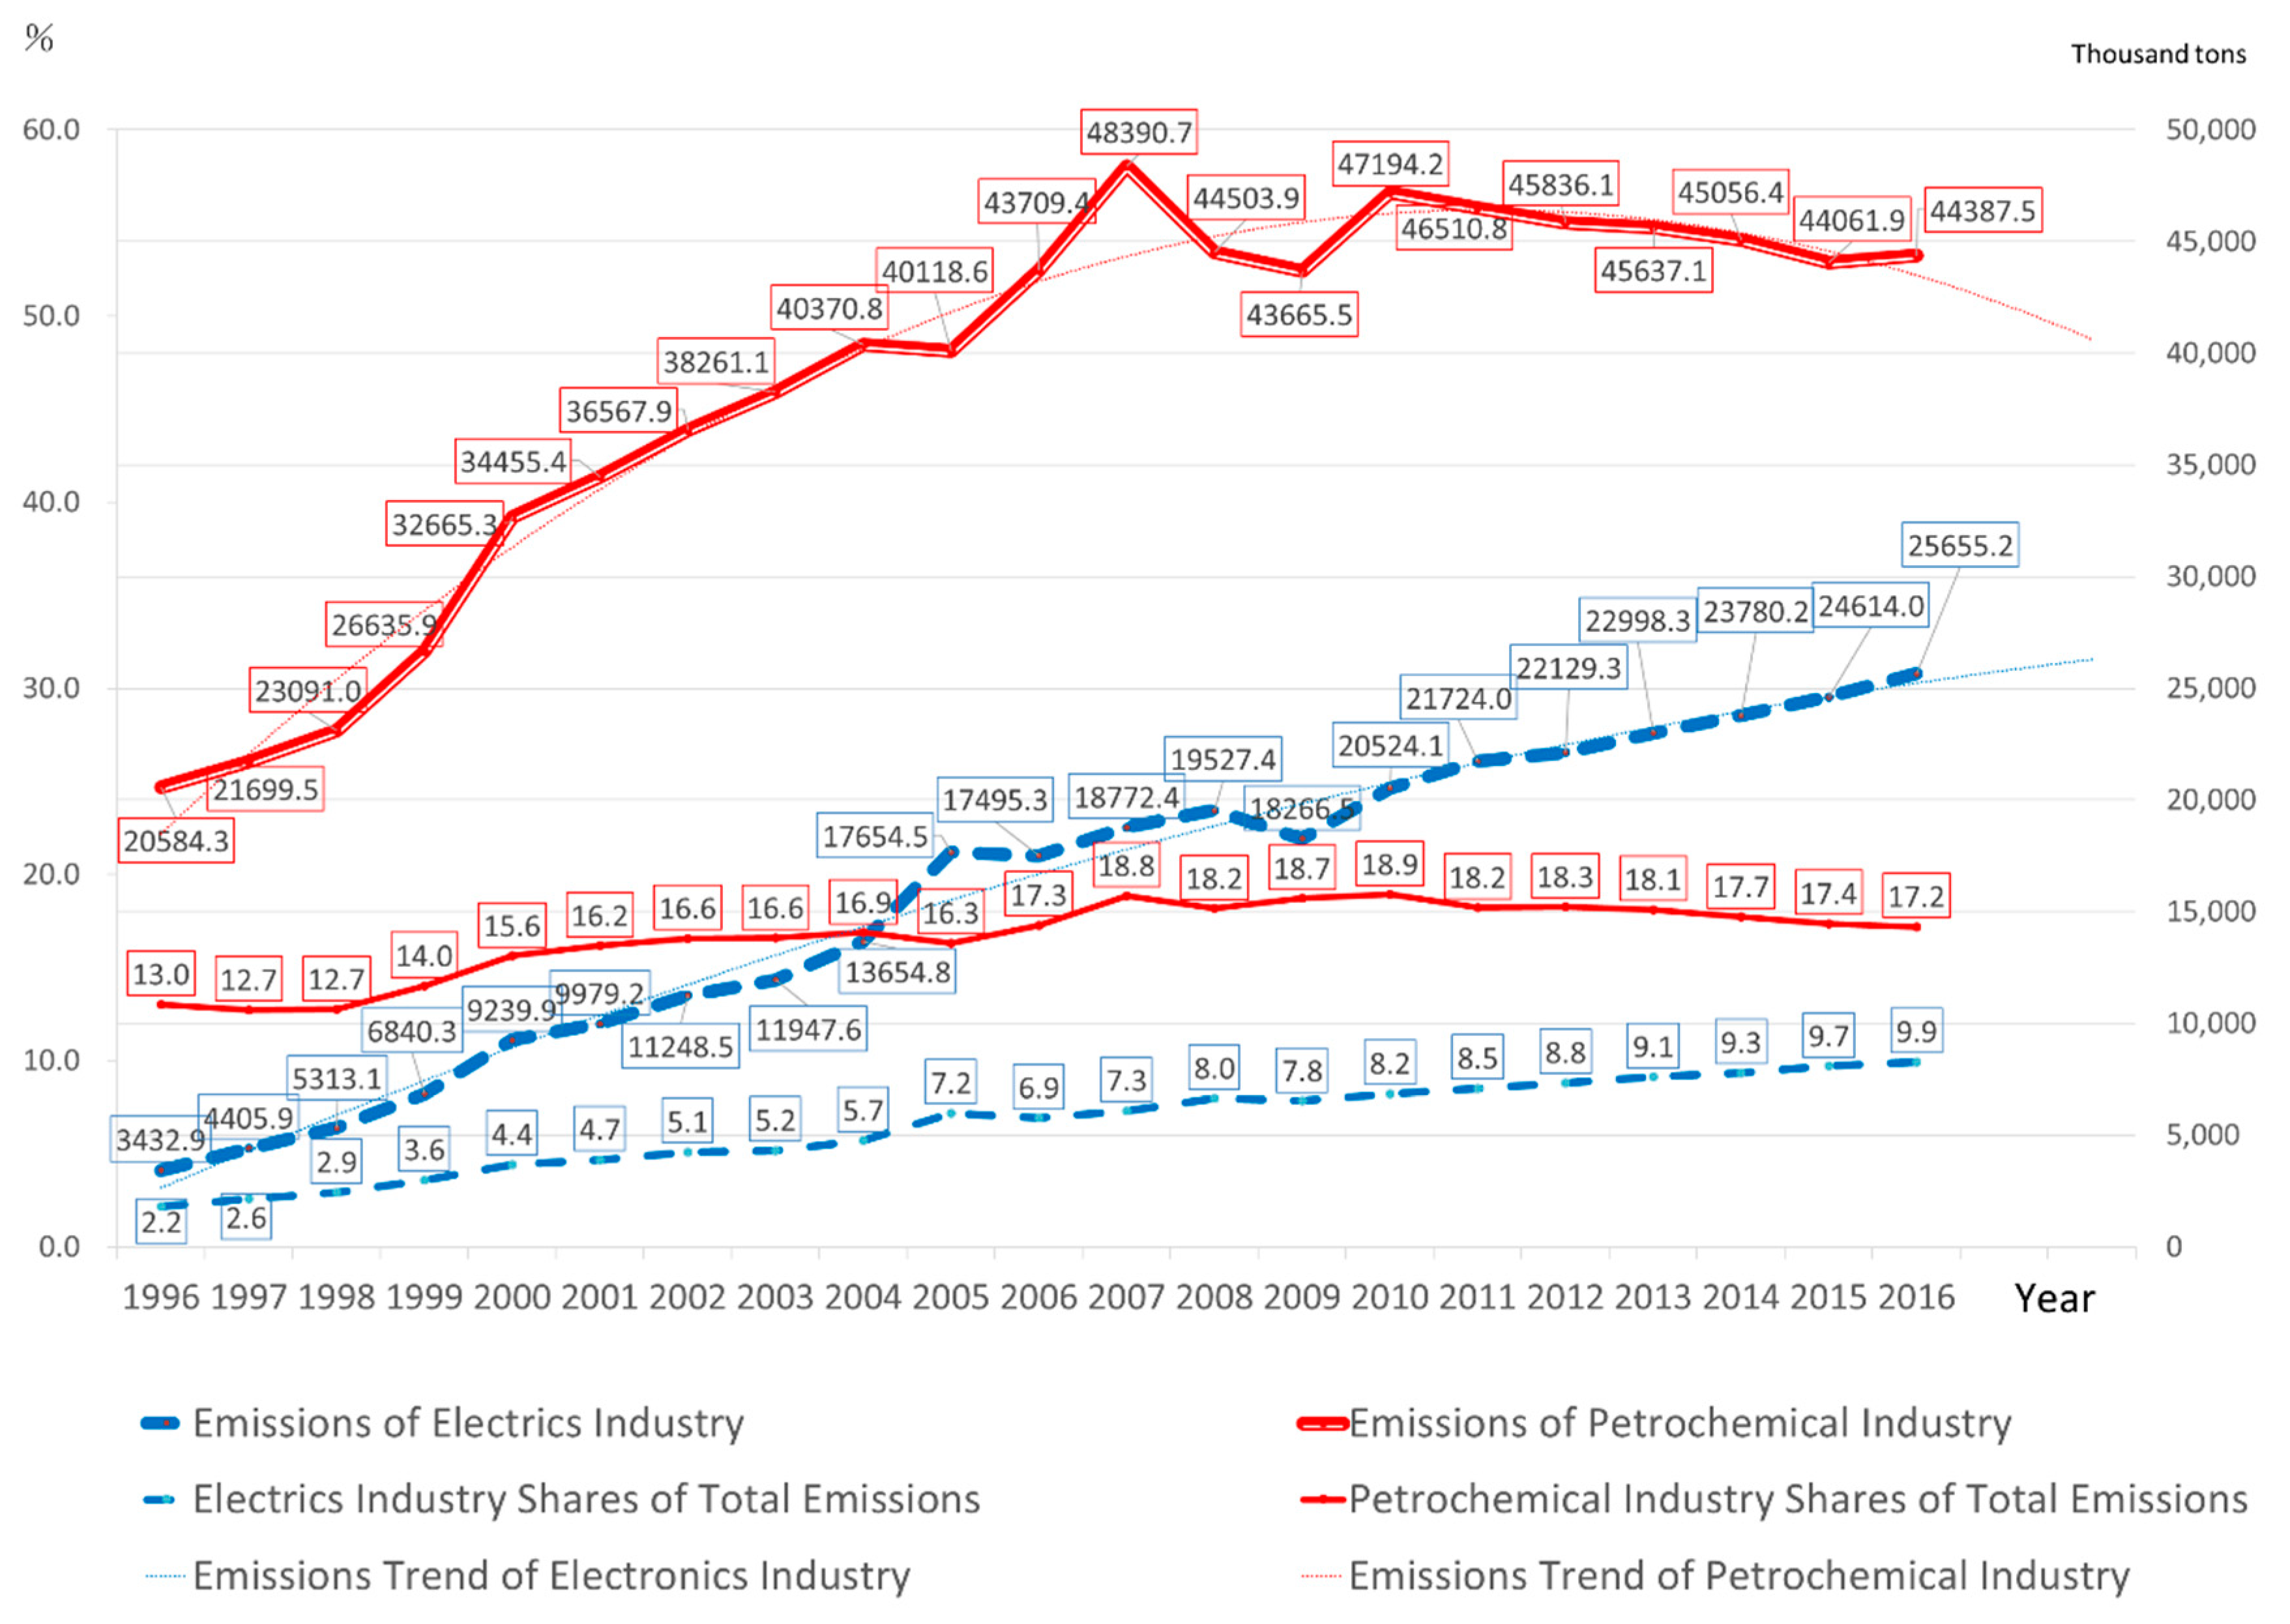
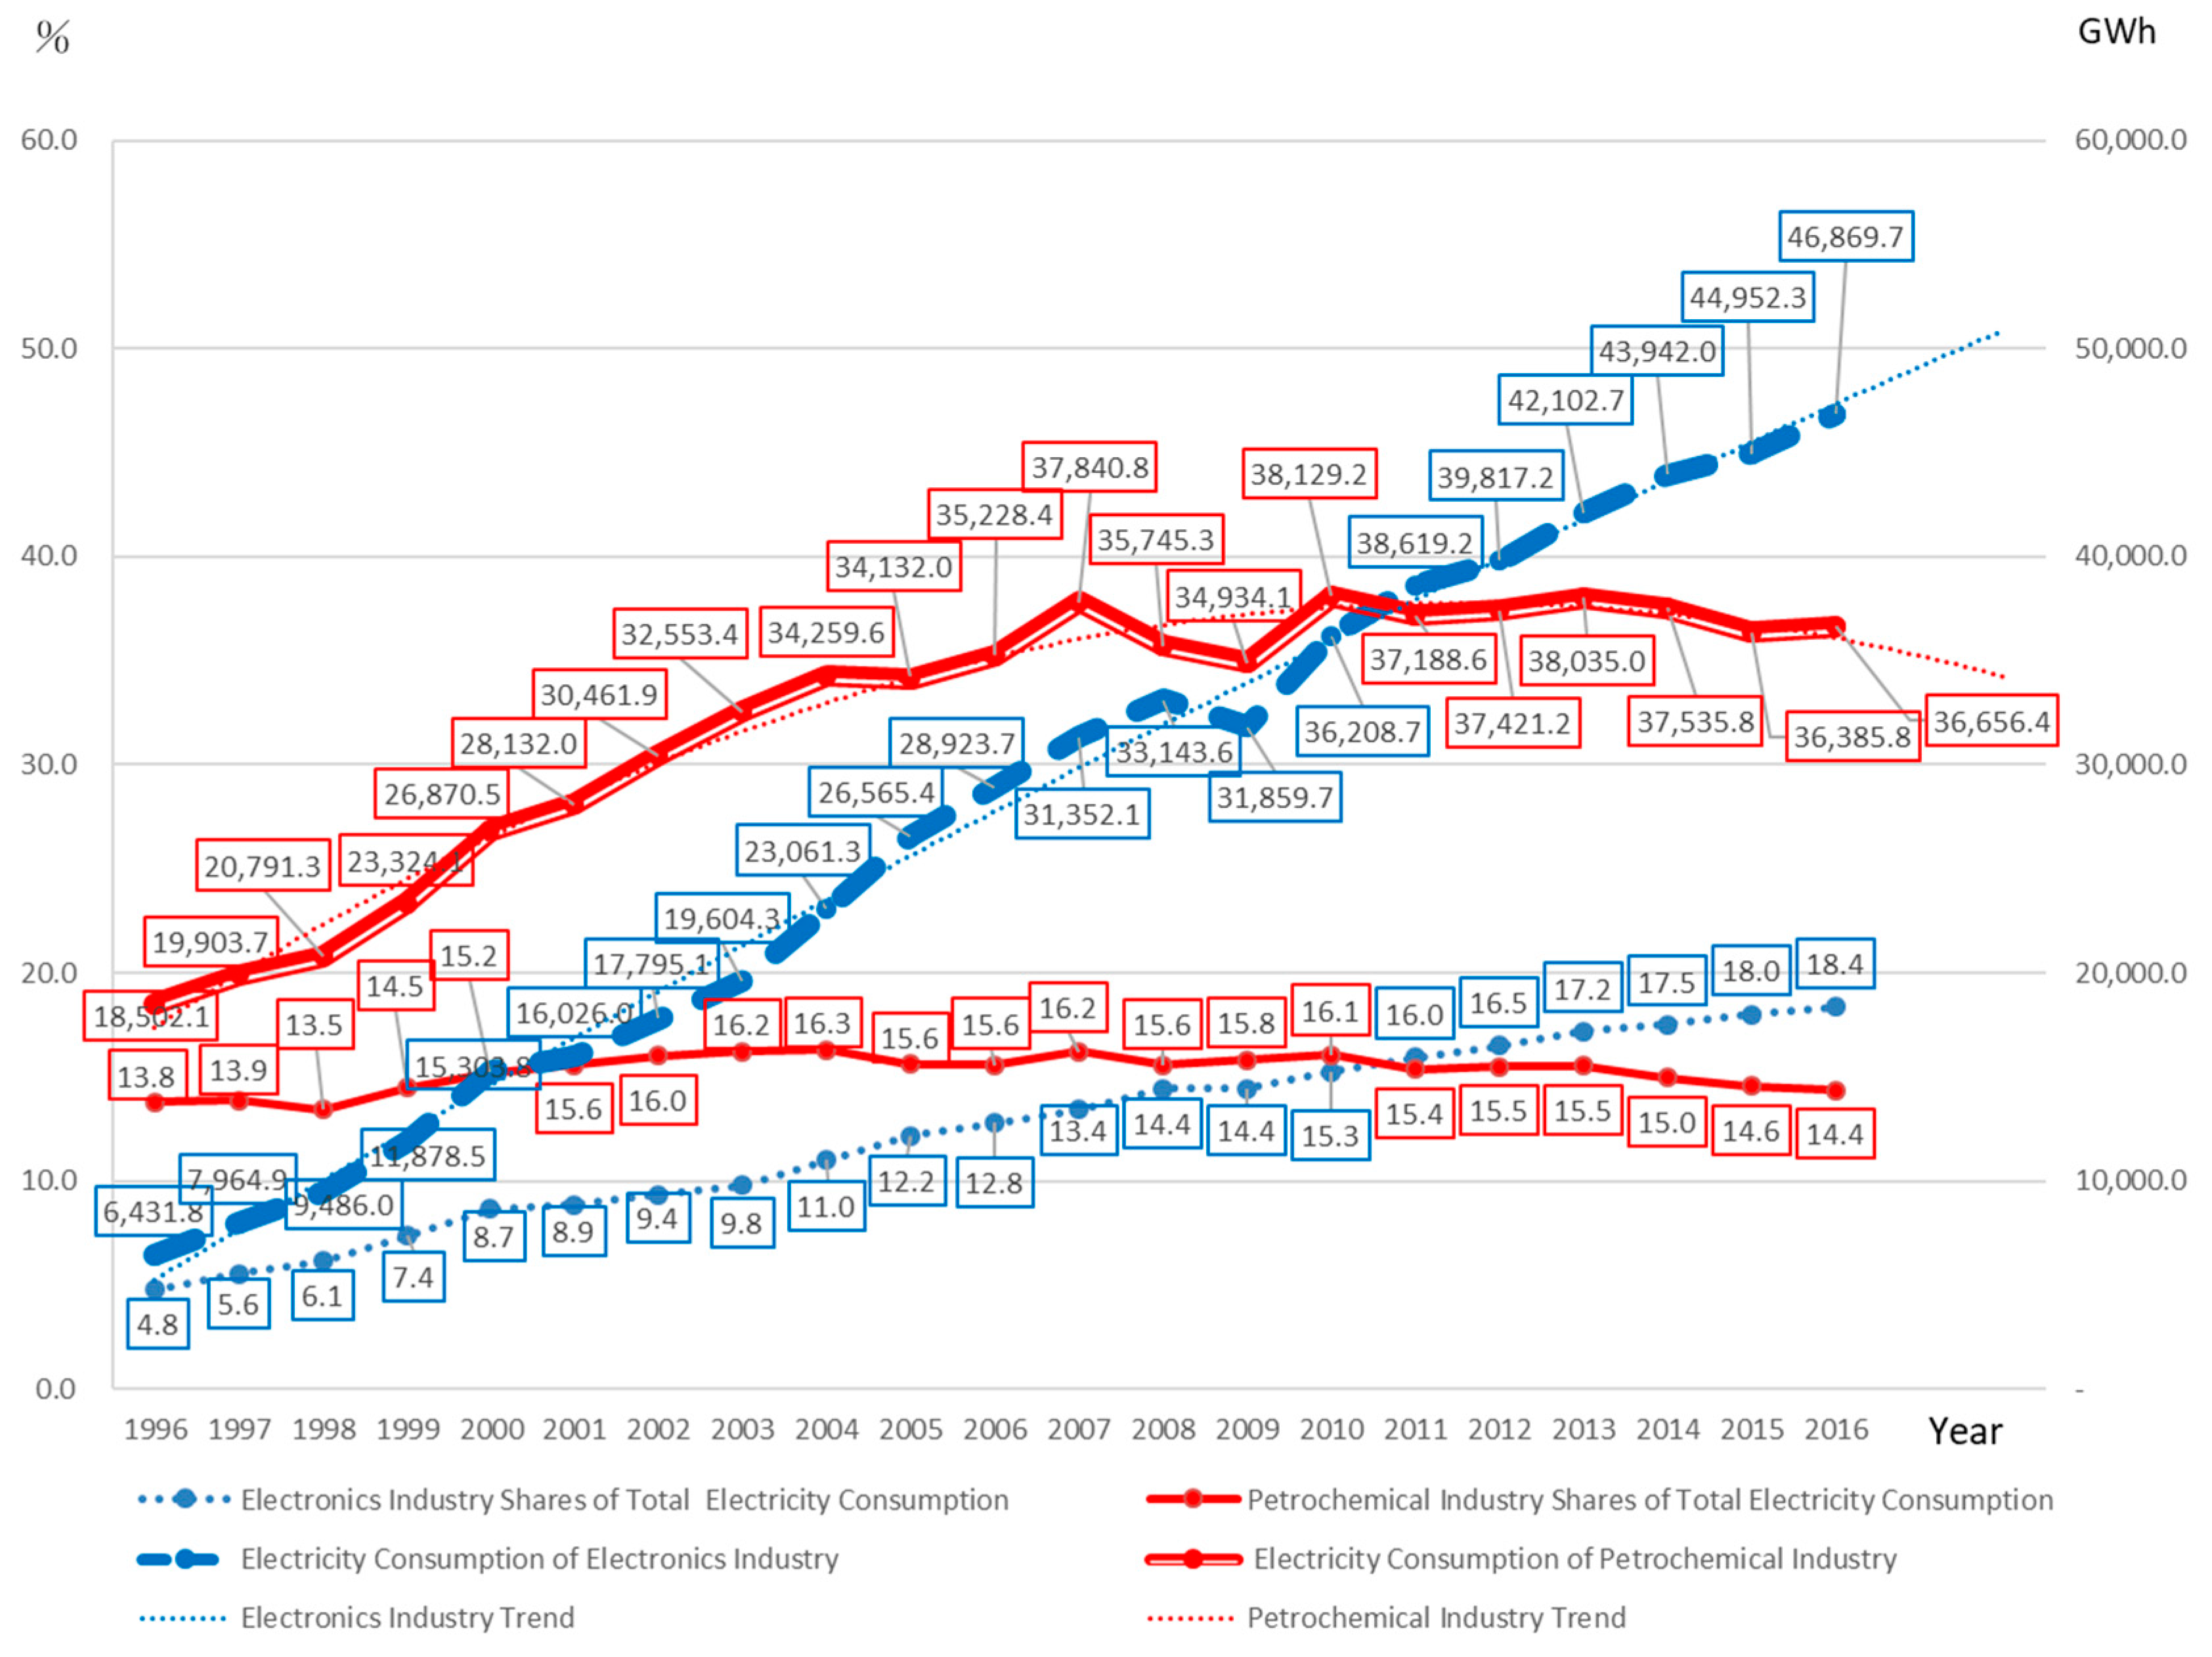
 Figure 5 and Figure 6 show that over the past 20 years, the carbon emissions and electricity consumption of the chemical materials manufacturing (petrochemical and chemical materials manufacturing industries) and electronics (ICT) have been gradually increasing, though in recent years, chemical materials manufacturing has reached saturation. The current trend therefore suggests that carbon emissions and electricity consumption in the electronics industry will continue to rise [17].
Based on available data, the TSMC is projected to consume about one-third of the total electricity consumption in Taiwan in the foreseeable future. Subsequently, along with a key process technology of the semiconductor industry, namely extreme ultraviolet lithography (EUV), electricity consumption will continue to increase. TSMC estimated that the electricity consumption of the 5-nm manufacturing process will be 1.48 times that of the current mainstream manufacturing process [5] As TSMC had planned for mass production using the 5-nm manufacturing process in 2020, it would lead to a surge in electricity consumption, which would outpace the original electricity consumption plan. Thus, according to the policy, it would therefore be necessary to do an environmental impact assessment. Toward this end, the increase in projected power demand is extremely alarming, from the original plan of 1.52 GW to 2.22 GW, which is a substantial increase of 46%.
Under the latest national industrial development plan in Taiwan, the “five plus two industrial innovation plan,” the semiconductor industry lies at the foundation for the plan. For the five plus two industrial innovation plan, the Smart Machinery Industry Promotion Plan, the Asian Silicon Valley Development Plan, the Green Energy Technology plan, along with the biomedical, national defense, and new agriculture industries, as well as in the adoption of the circular economy, plus the two ICT-related investments under the Smart Machinery Industry Promotion Plan and the Asian Silicon Valley Development Plan, the government has invested 4 billion USD, with private investment amounting to about 1.7 billion USD. The electronics industry is also the basis from which new future applications, such as artificial intelligence and the internet of things, will develop from. Therefore, the future of the electronics industry will be the backbone of Taiwan’s economic development. However, for the electronics industry to continue to be developed in Taiwan, its electricity consumption will continue to grow, and in turn, lead to higher carbon emissions. The government therefore needs to think about how to sustain the development of the electronics industry whilst trying to meet the national carbon reduction targets within a limited energy supply and power generation capacity. As such, the biggest challenge that Taiwan is facing in its economic development is whether Taiwan’s energy transition can cope with the needs of its industrial development.
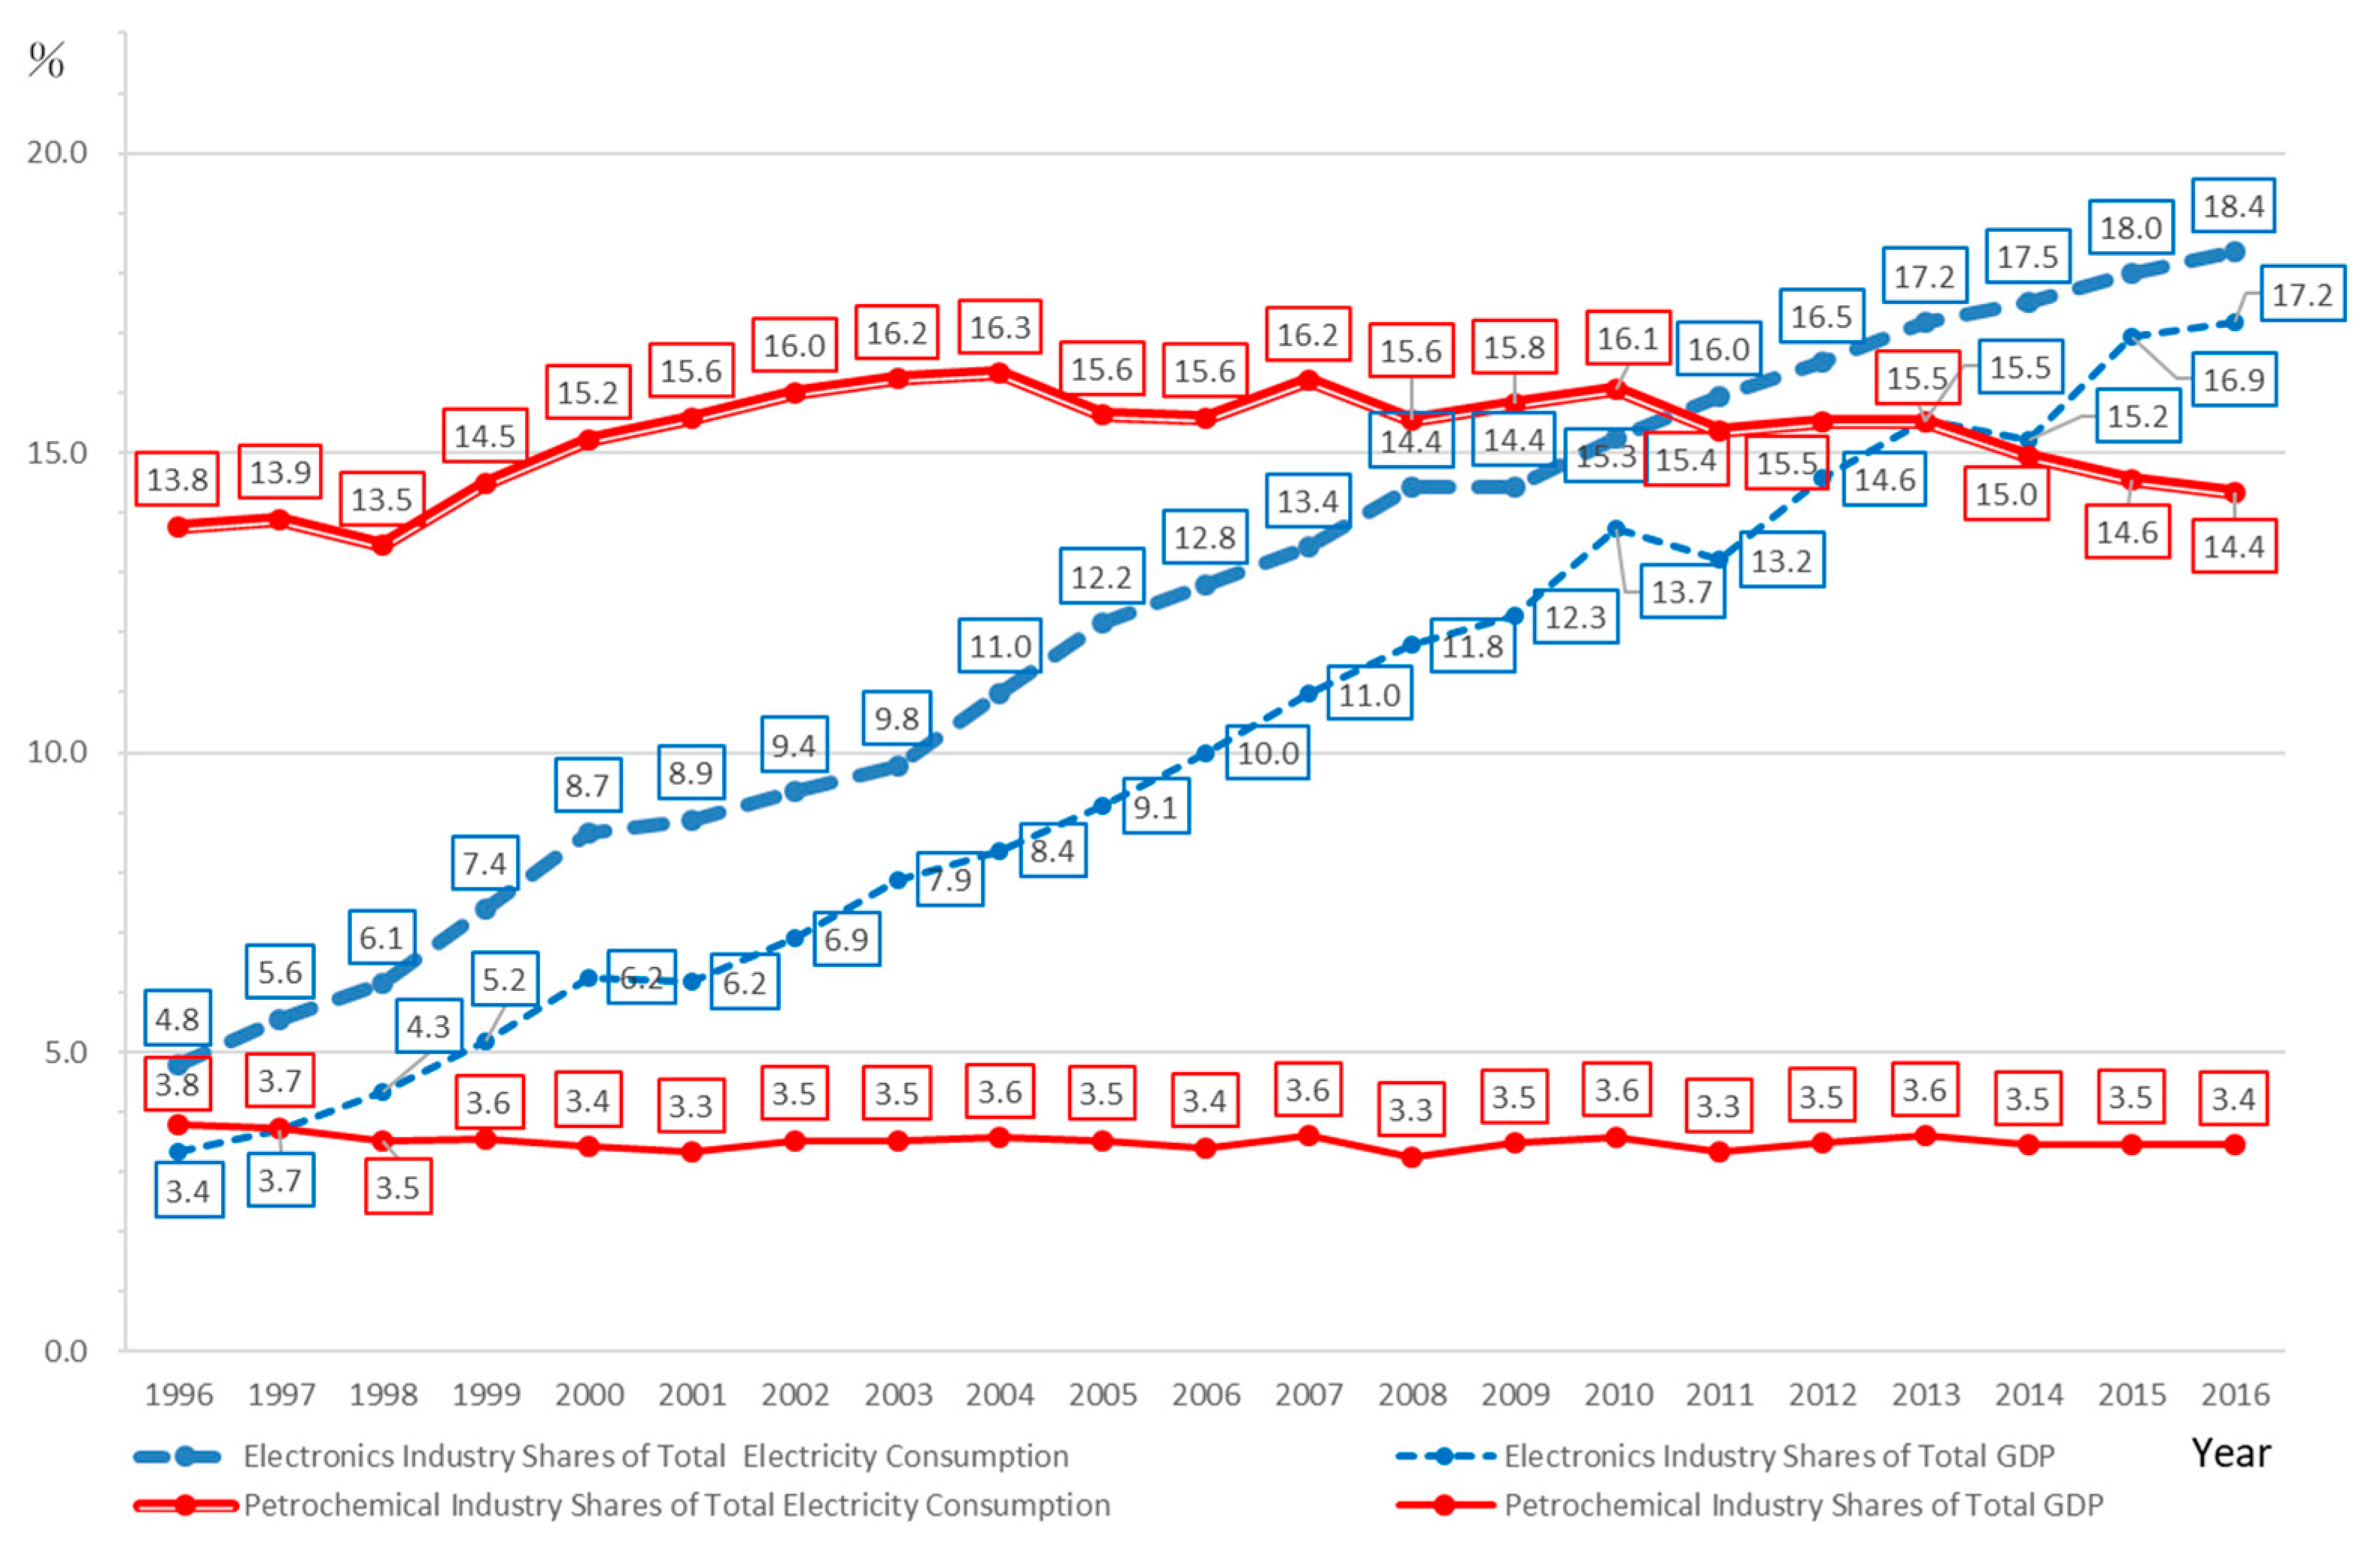
Since the contribution of the electronics industry to Taiwan’s economy is built on a high electricity consumption that leads to high carbon emissions and energy consumption, Taiwan’s economic policy therefore needs to weigh the trade-offs and consider how the electronics industry can continue to contribute greatly to the economy under the limited power generation and environmental capacity of Taiwan. The clue to this might lie in the incomplete industrial transformation that began in the 1980s, which would now need to be restarted. As a background, the industrial characteristics of the electronics industry and the chemical materials manufacturing industry (petrochemical industry) are different, and their contributions to Taiwan’s GDP are also vastly different. From 
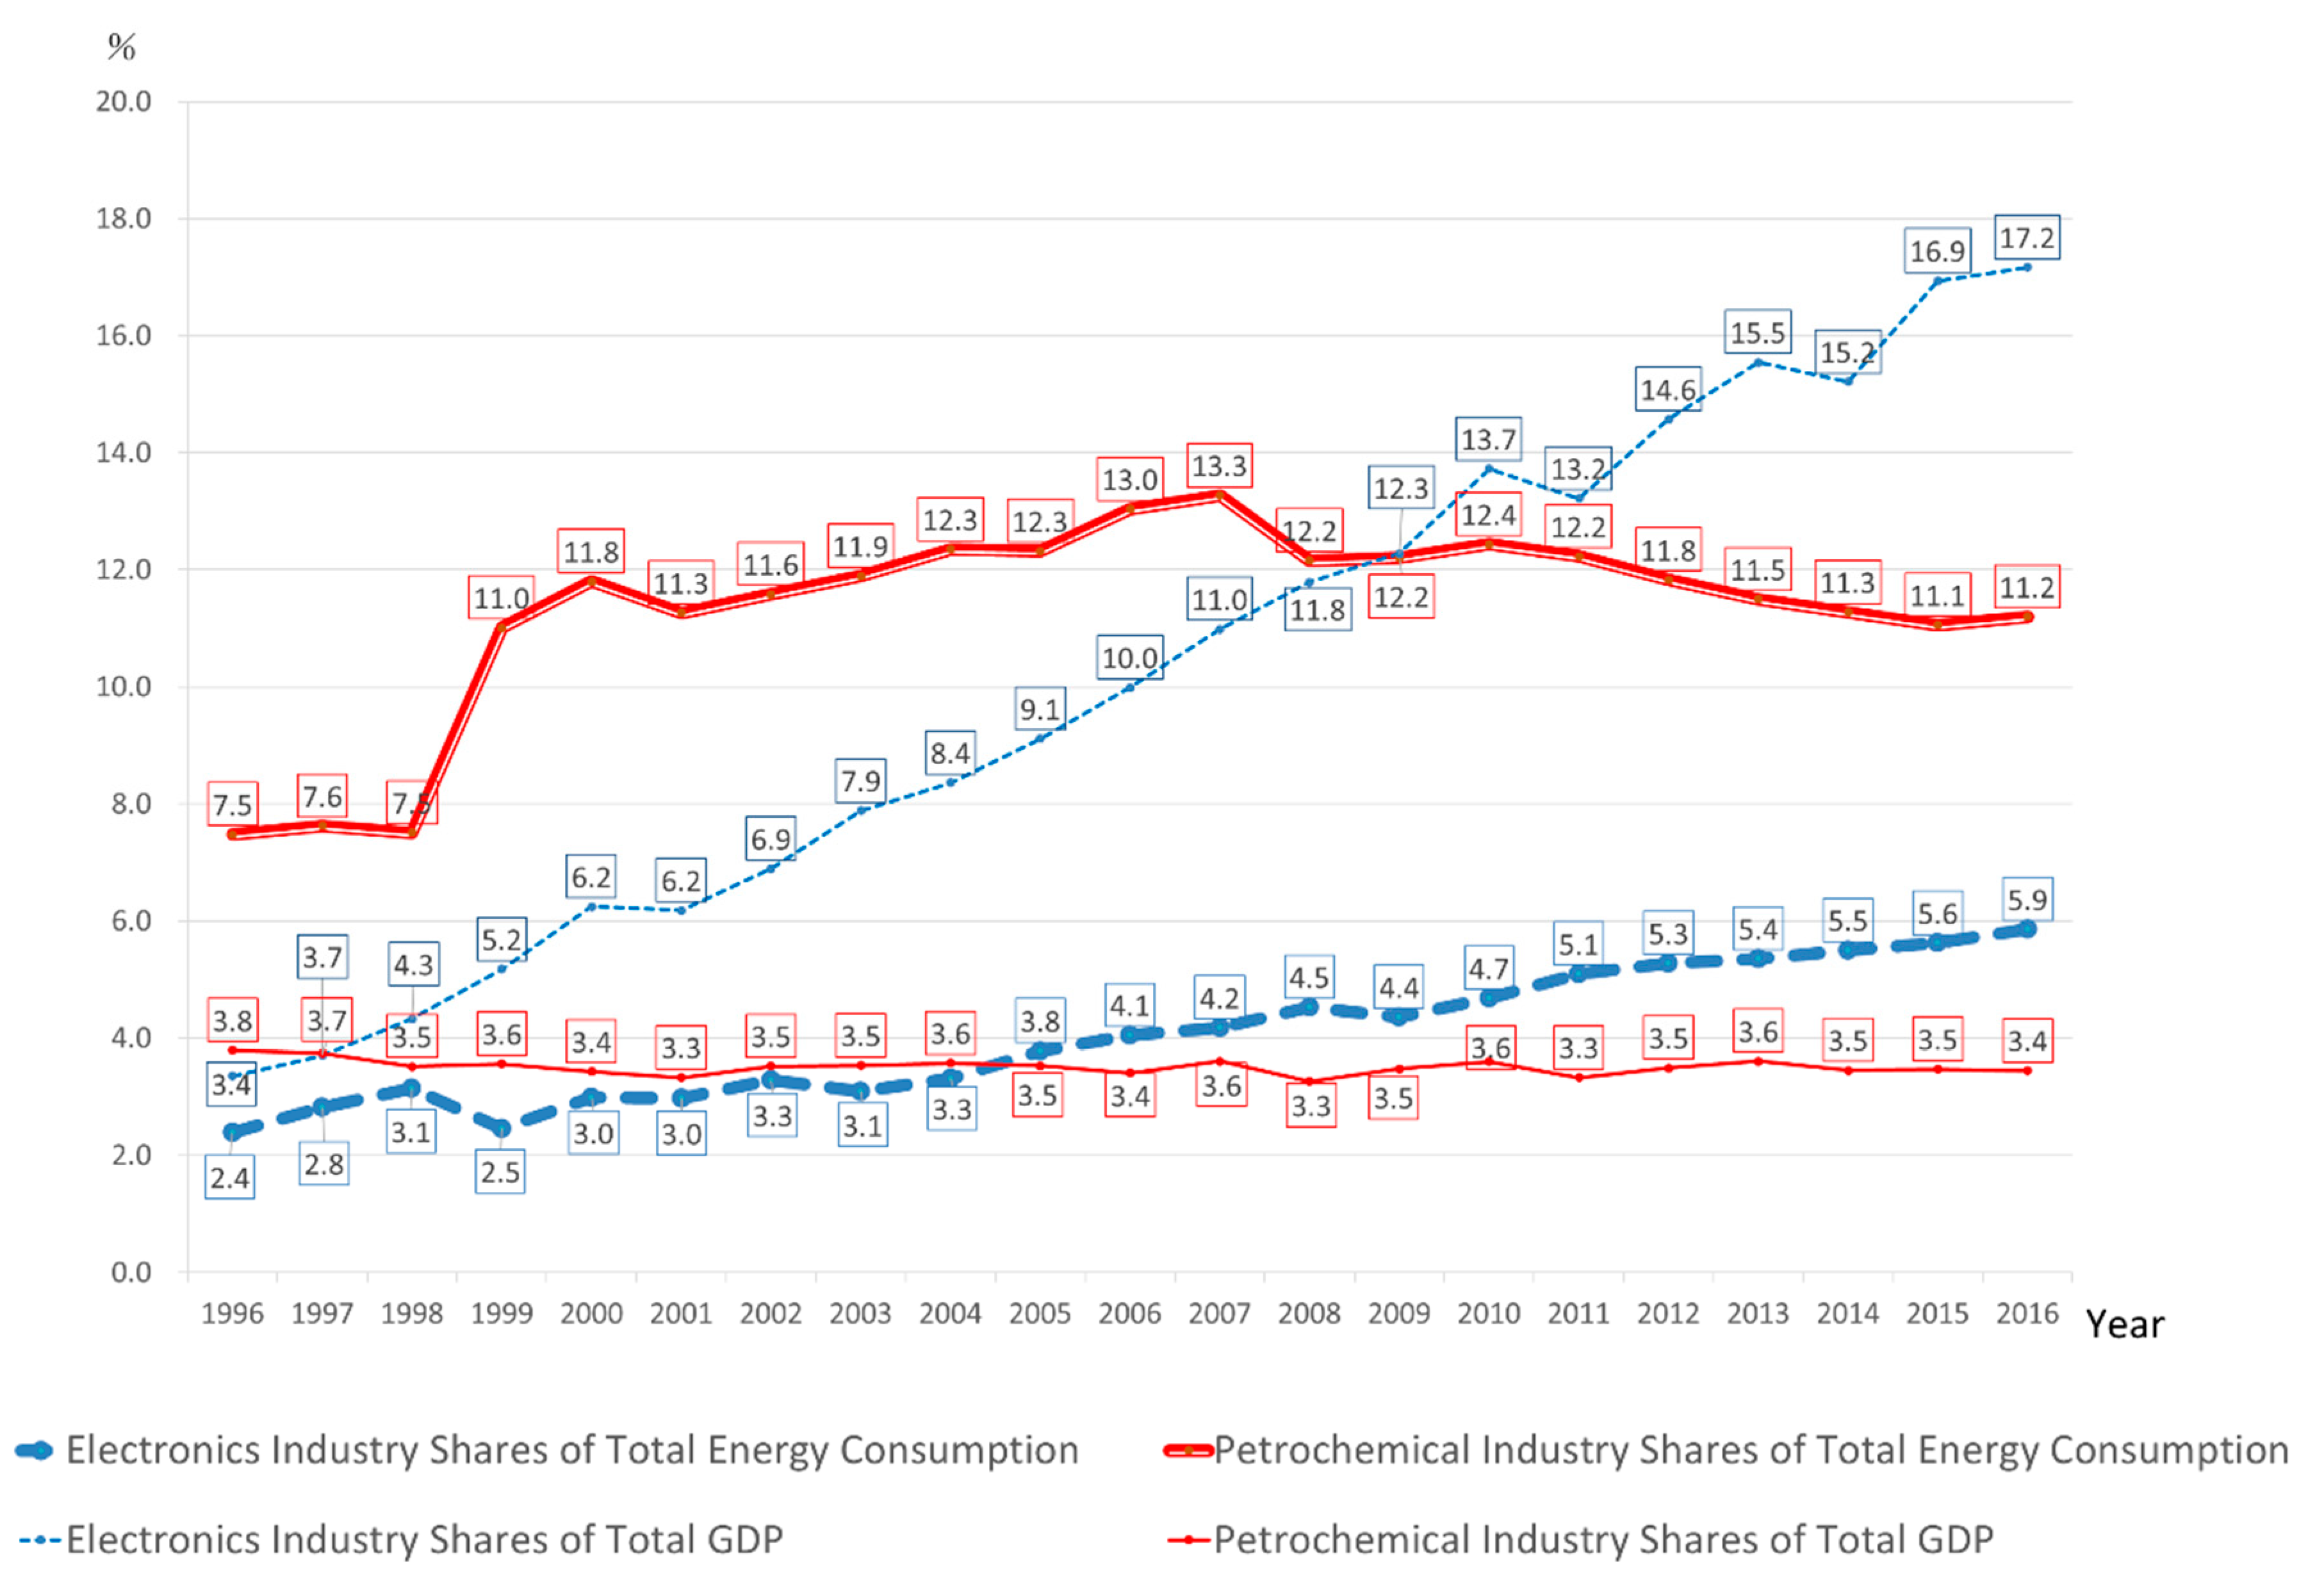
Figure 7, it can be seen that in the past 20 years, the electricity consumption and demand of the electronics industry has grown by 3.8 times and by 5.5 times as a percentage of GDP, and by 2016, reached 18.4% and 17.2%, respectively. The Formosa petrochemical corporation’s Sixth Naphtha Cracking Project in the petrochemical industry was successively completed during the first phase (1998–1999), second phase (2000), third phase (2003), and fourth phase (2007), and during this period of construction, it reached a peak in electricity consumption, at 16.3% in 2003 and 2007, but since then, this had fallen slightly to 14.4% by 2016. However, while the petrochemical industry dominated a high proportion of electricity consumption, its contribution to GDP was only 3.4%, having declined from 3.8% in 1996. Meanwhile, its electricity consumption in 2016 was high, at 14.4%. In comparison, electricity consumption in the electronics industry was high as well (18.5%), but the GDP contribution was able to reach 17.2% in 2016. Therefore, the high electricity consumption and power demand in the electronics industry brings about a higher contribution to the GDP, but the petrochemical industry is more energy intensive yet its contribution to the GDP is low.
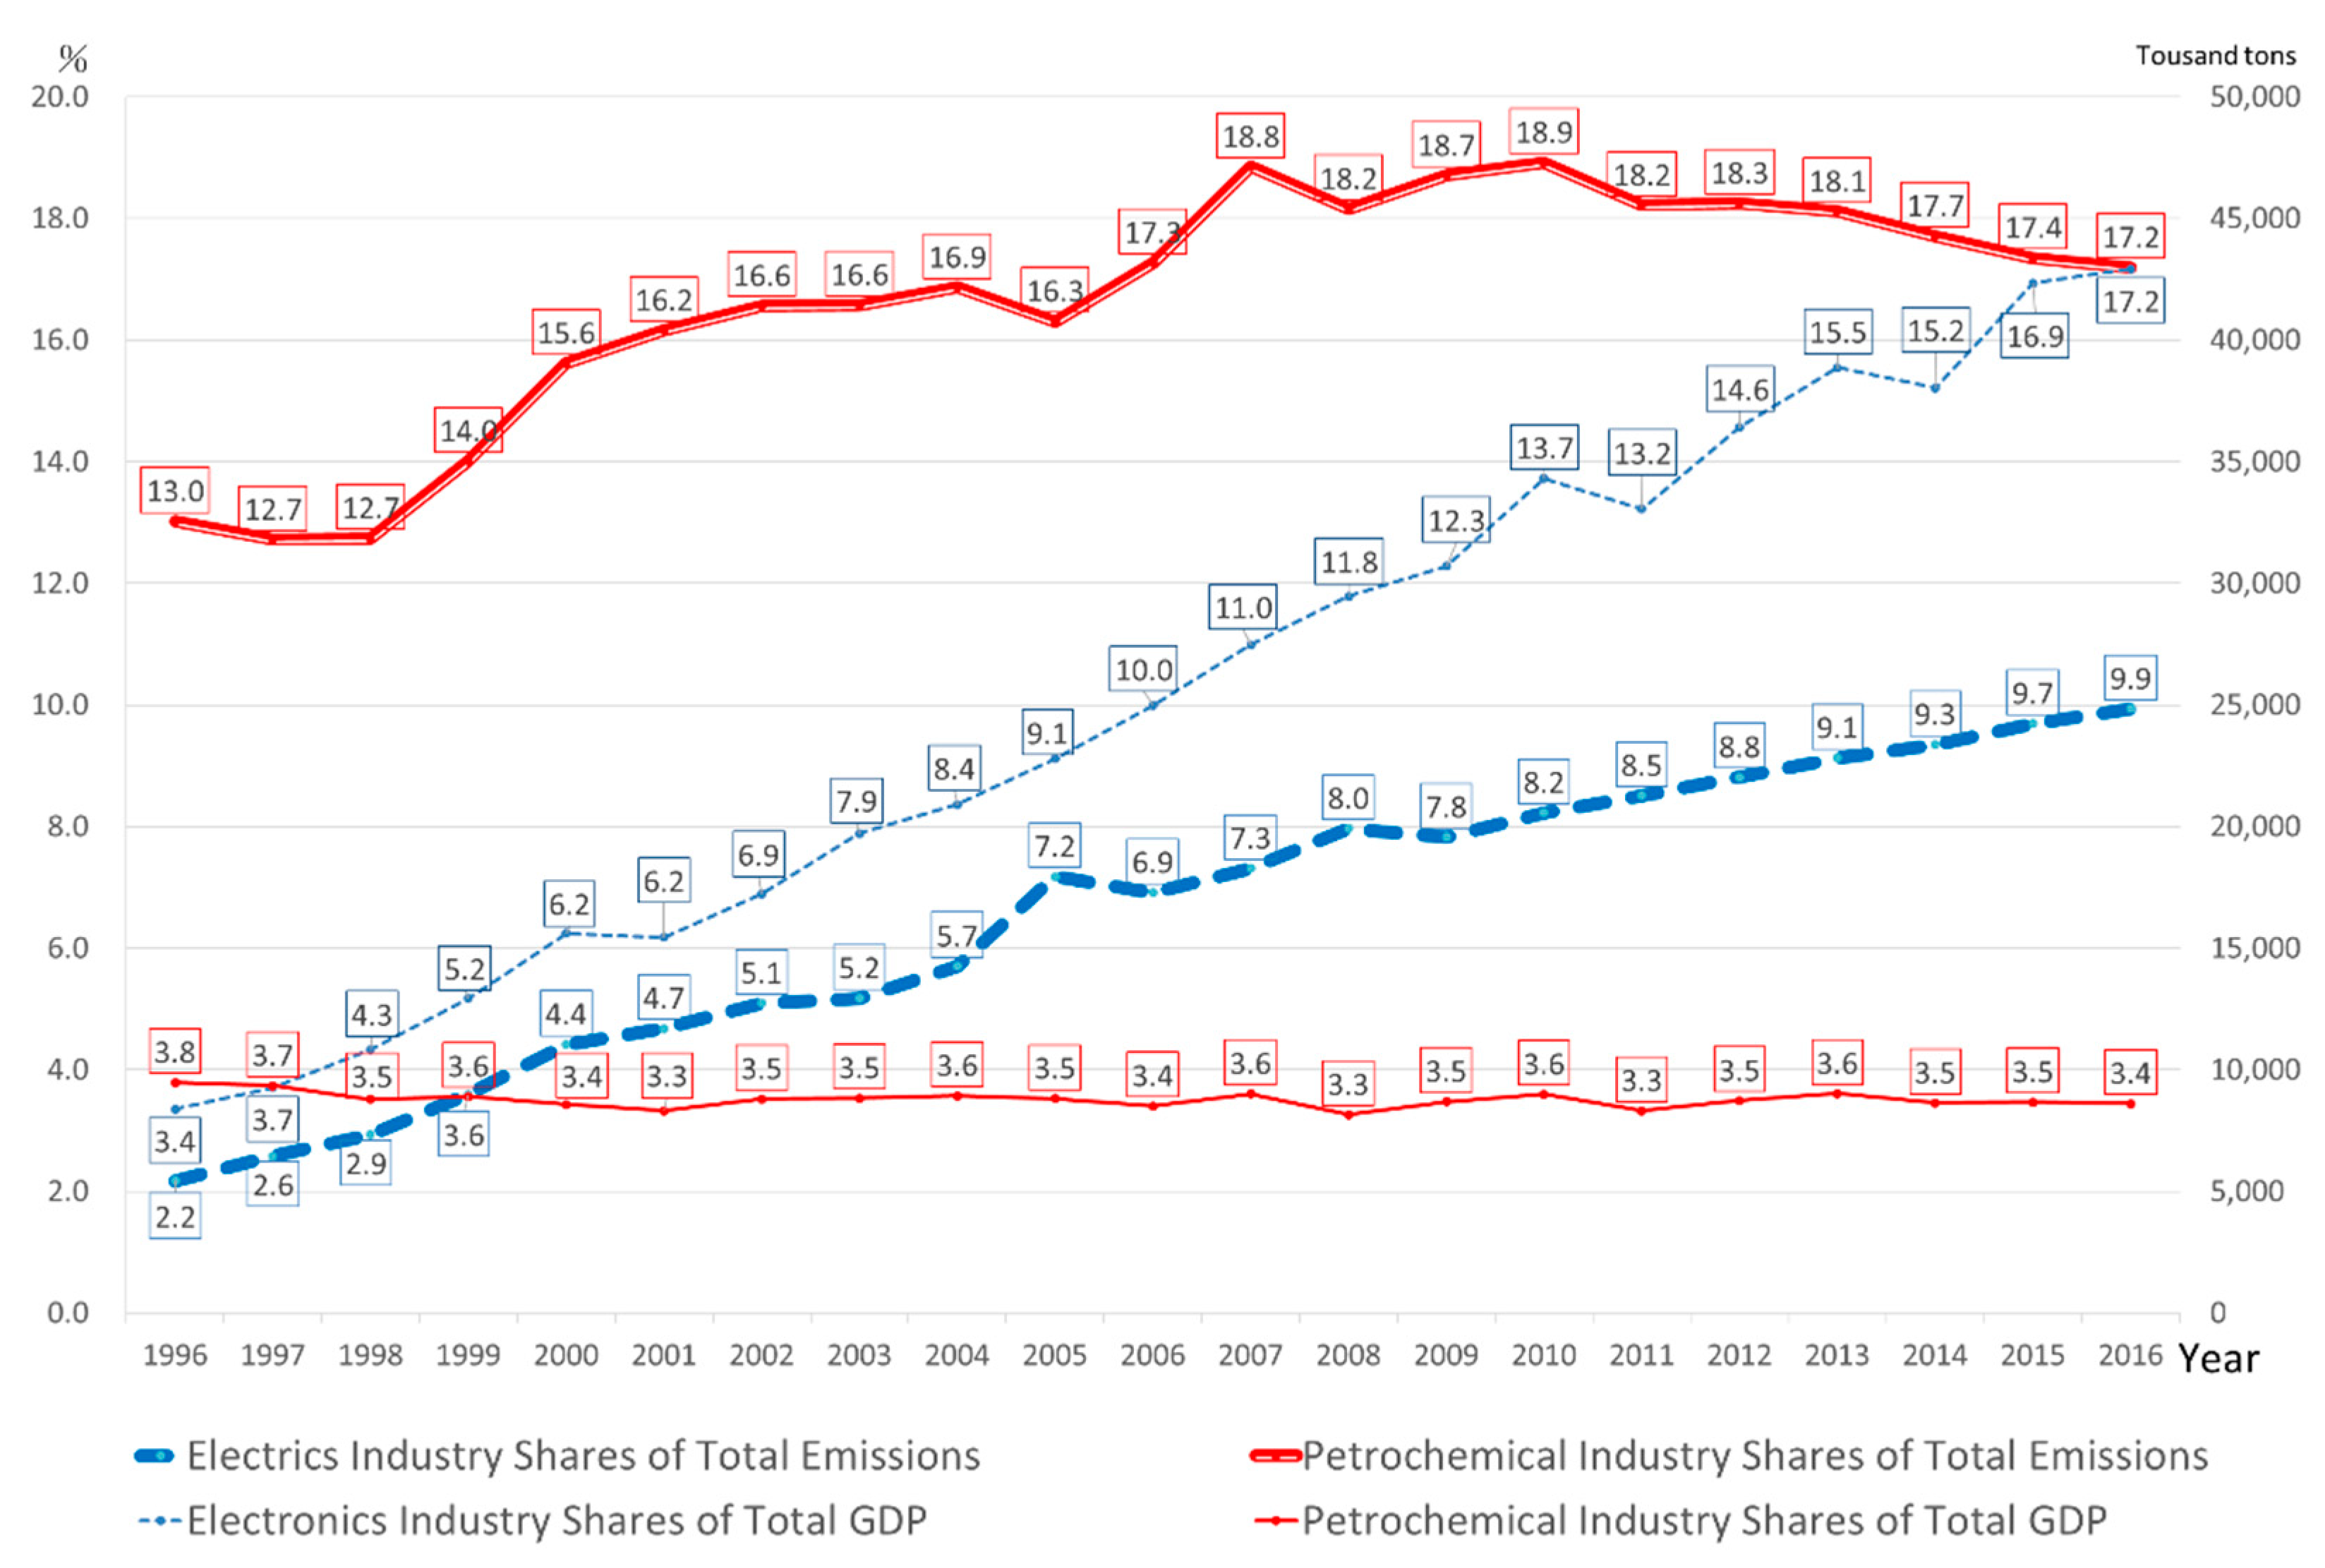
Next, we looked at the ratio of carbon emissions to GDP in Figure 8. As the carbon emissions in the petrochemical industries is not only due to its electricity consumption, but also due to the process of fossil fuel burning, which also resulted in a large amount of carbon emissions, its carbon footprint as a proportion of the country’s carbon emissions is therefore higher than that for electricity consumption, reaching 17.2% of carbon emissions in the country, compared to 9.9% in the electronics industry. It is worth noting that the GDP growth rate of the electronics industry is faster than that of its carbon emissions, and the gap between the gradient of the lines is also increasing, which therefore demonstrates that the carbon emissions in the electronics industry is gradually decoupling from GDP.
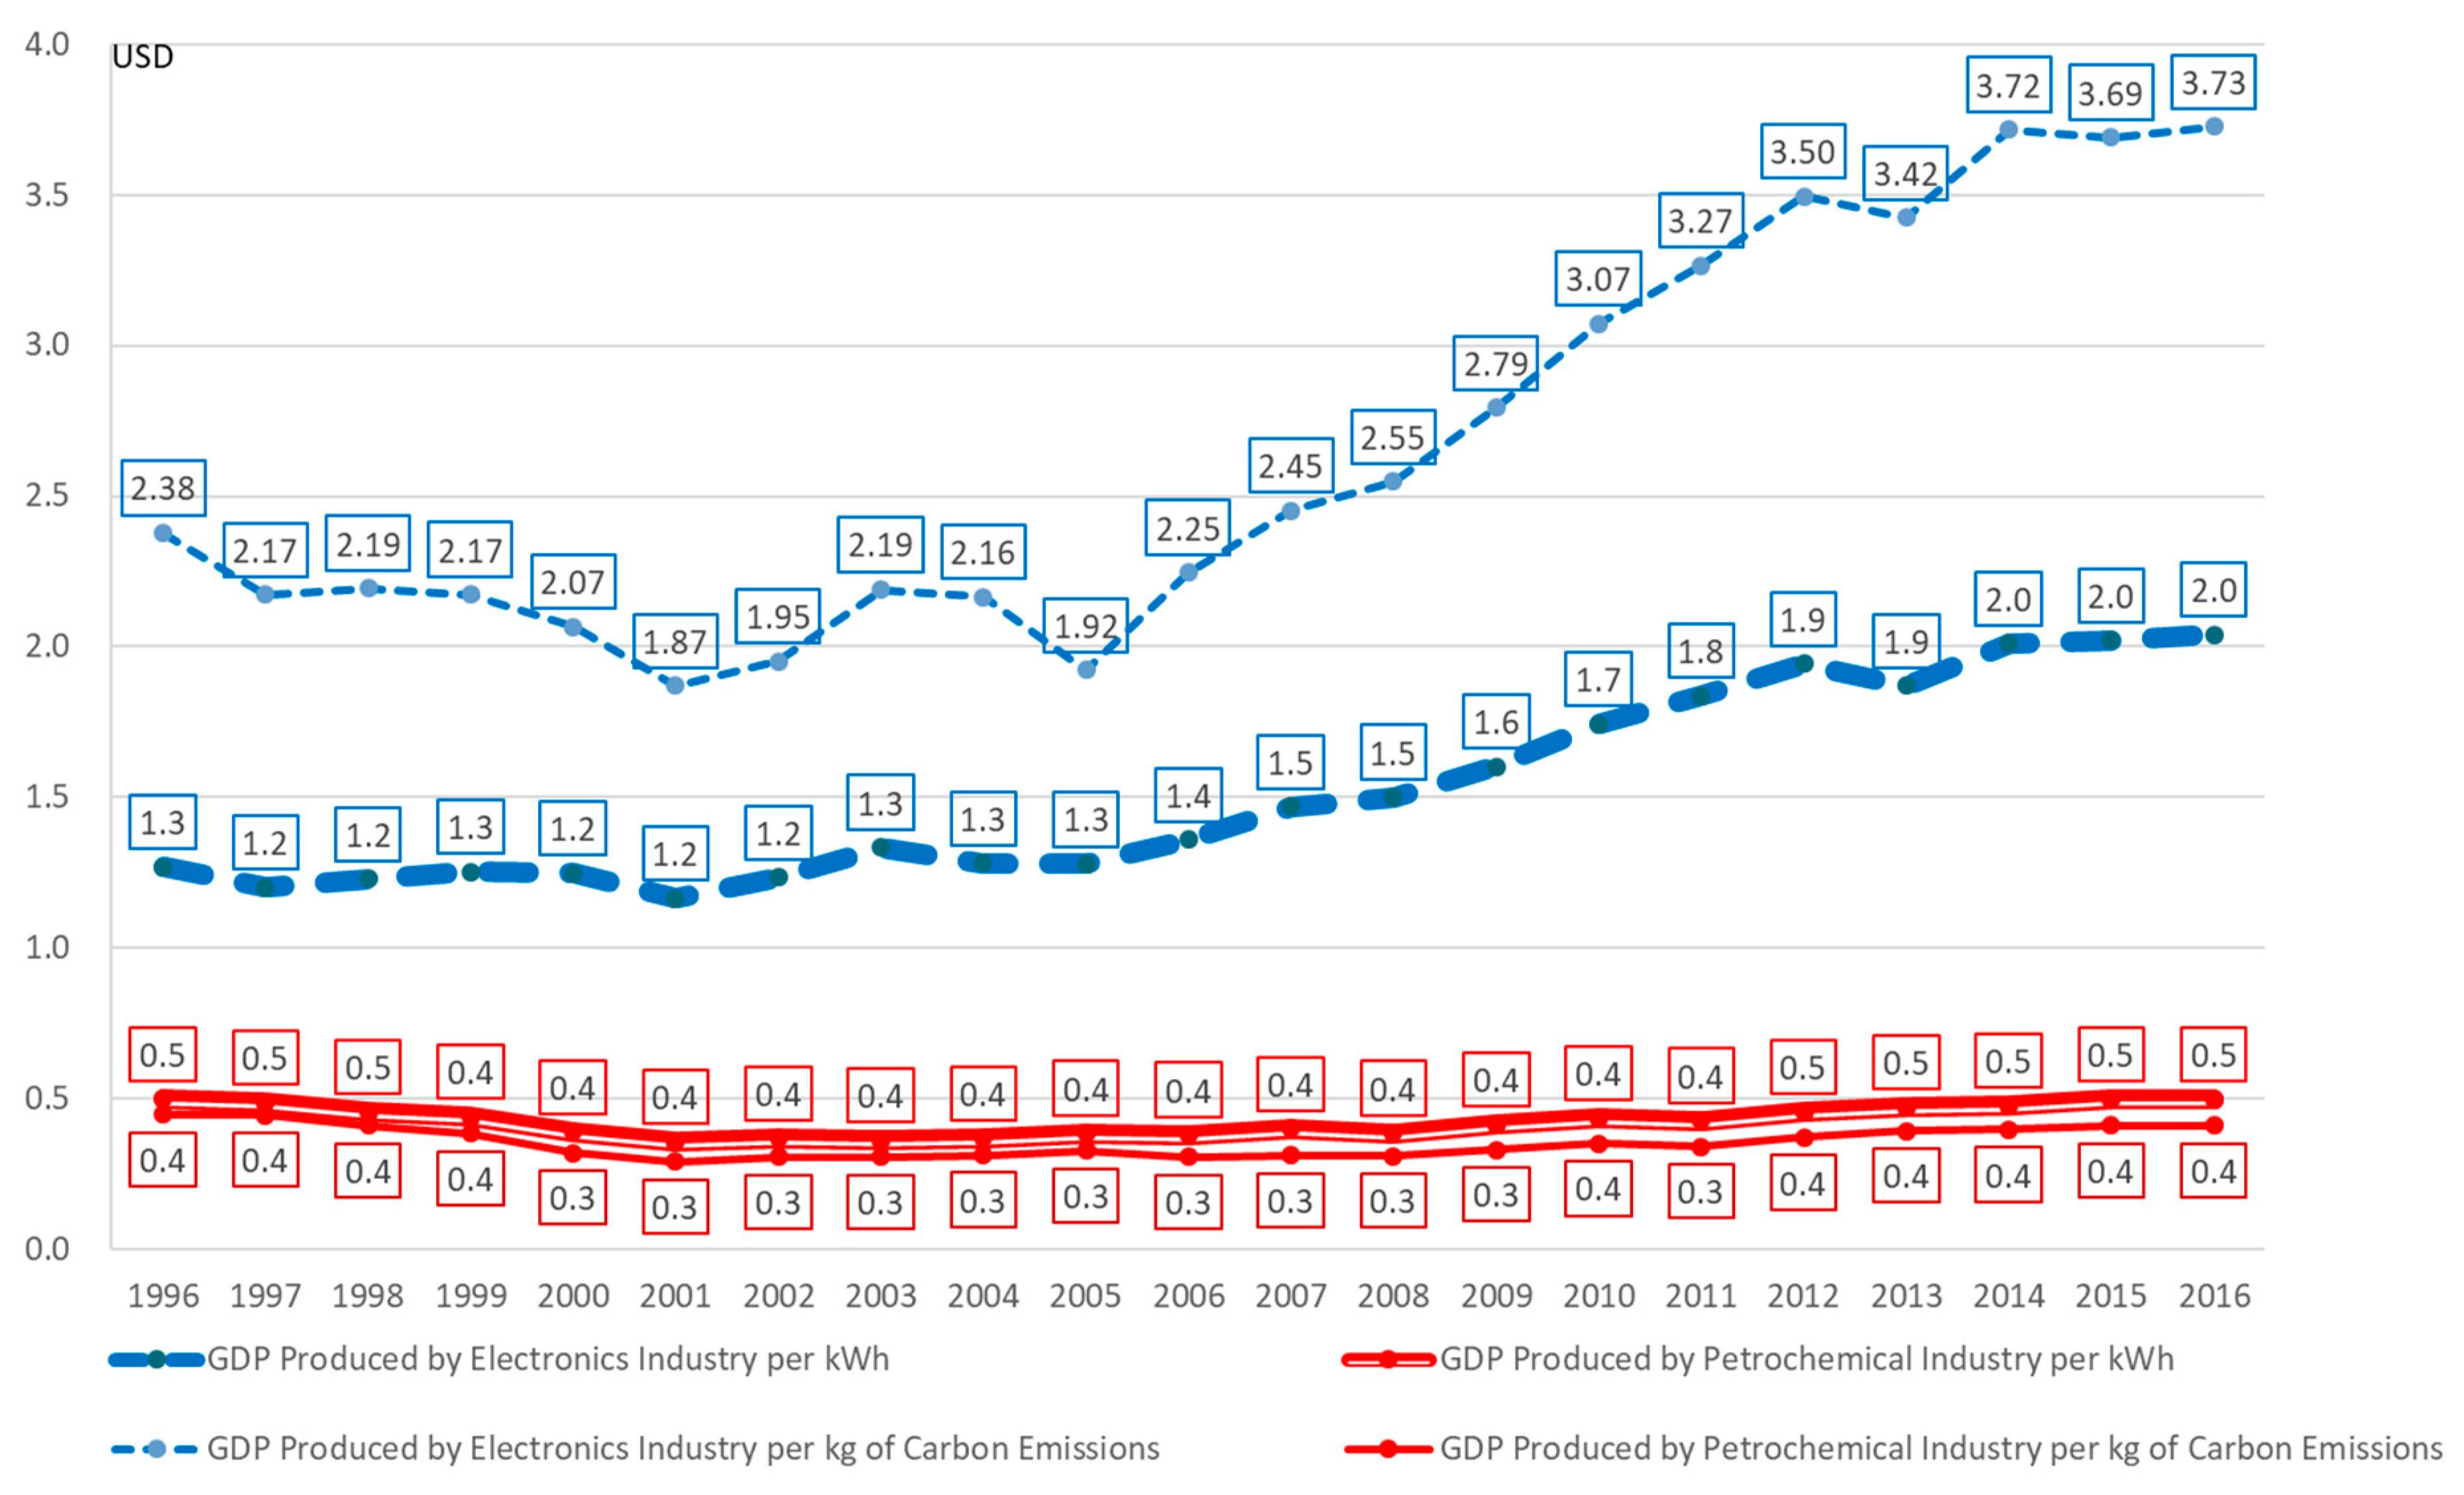
Figure 9 compares the GDP per kilogram of carbon emissions in the electronics and petrochemical industries with the GDP per kilowatt-hour, which clearly shows the GDP efficiency from carbon emissions and energy use. In 1996, the electronics industry produced 1.3 USD of GDP per kilowatt hour, and by 2016, it generated 3.73 USD per kilowatt-hour. The GDP efficiency from energy use therefore increased by 1.6 times in 20 years. The petrochemical industry produced only about 0.4 to 0.5 of GDP per kilowatt-hour from 1996 to 2016. Therefore, the GDP produced by the electronics industry with every kilowatt-hour of electricity was 4.1 times that of the petrochemical industry, and the GDP produced per kilogram of carbon emissions was 9.8 times that of the petrochemical industry.
In addition, as can be seen from Figure 10, the petrochemical industry itself consumes a lot of fossil fuels, resulting in the high carbon emissions. As seen from the perspective of electricity consumption (calculated as a barrel of oil equivalent), the difference between the electronics industry and the petrochemical industry becomes even more obvious. In 2016, the electricity consumption in the electronics industry accounted for 18.4% of the country’s consumption and 9.9% of carbon emissions, but energy consumption accounted for only 5.9% of the country’s consumption. For the petrochemical industry, electricity consumption comprised 14.4%, carbon emissions made up 17.2%, and energy consumption comprised 11.2%. In terms of the overall energy consumption, it can therefore be seen that the contributions of the electronics industry’s GDP had already decoupled from its energy consumption. This decoupling can be seen from the GDP per unit of energy use (change in the ratio between the two), which 
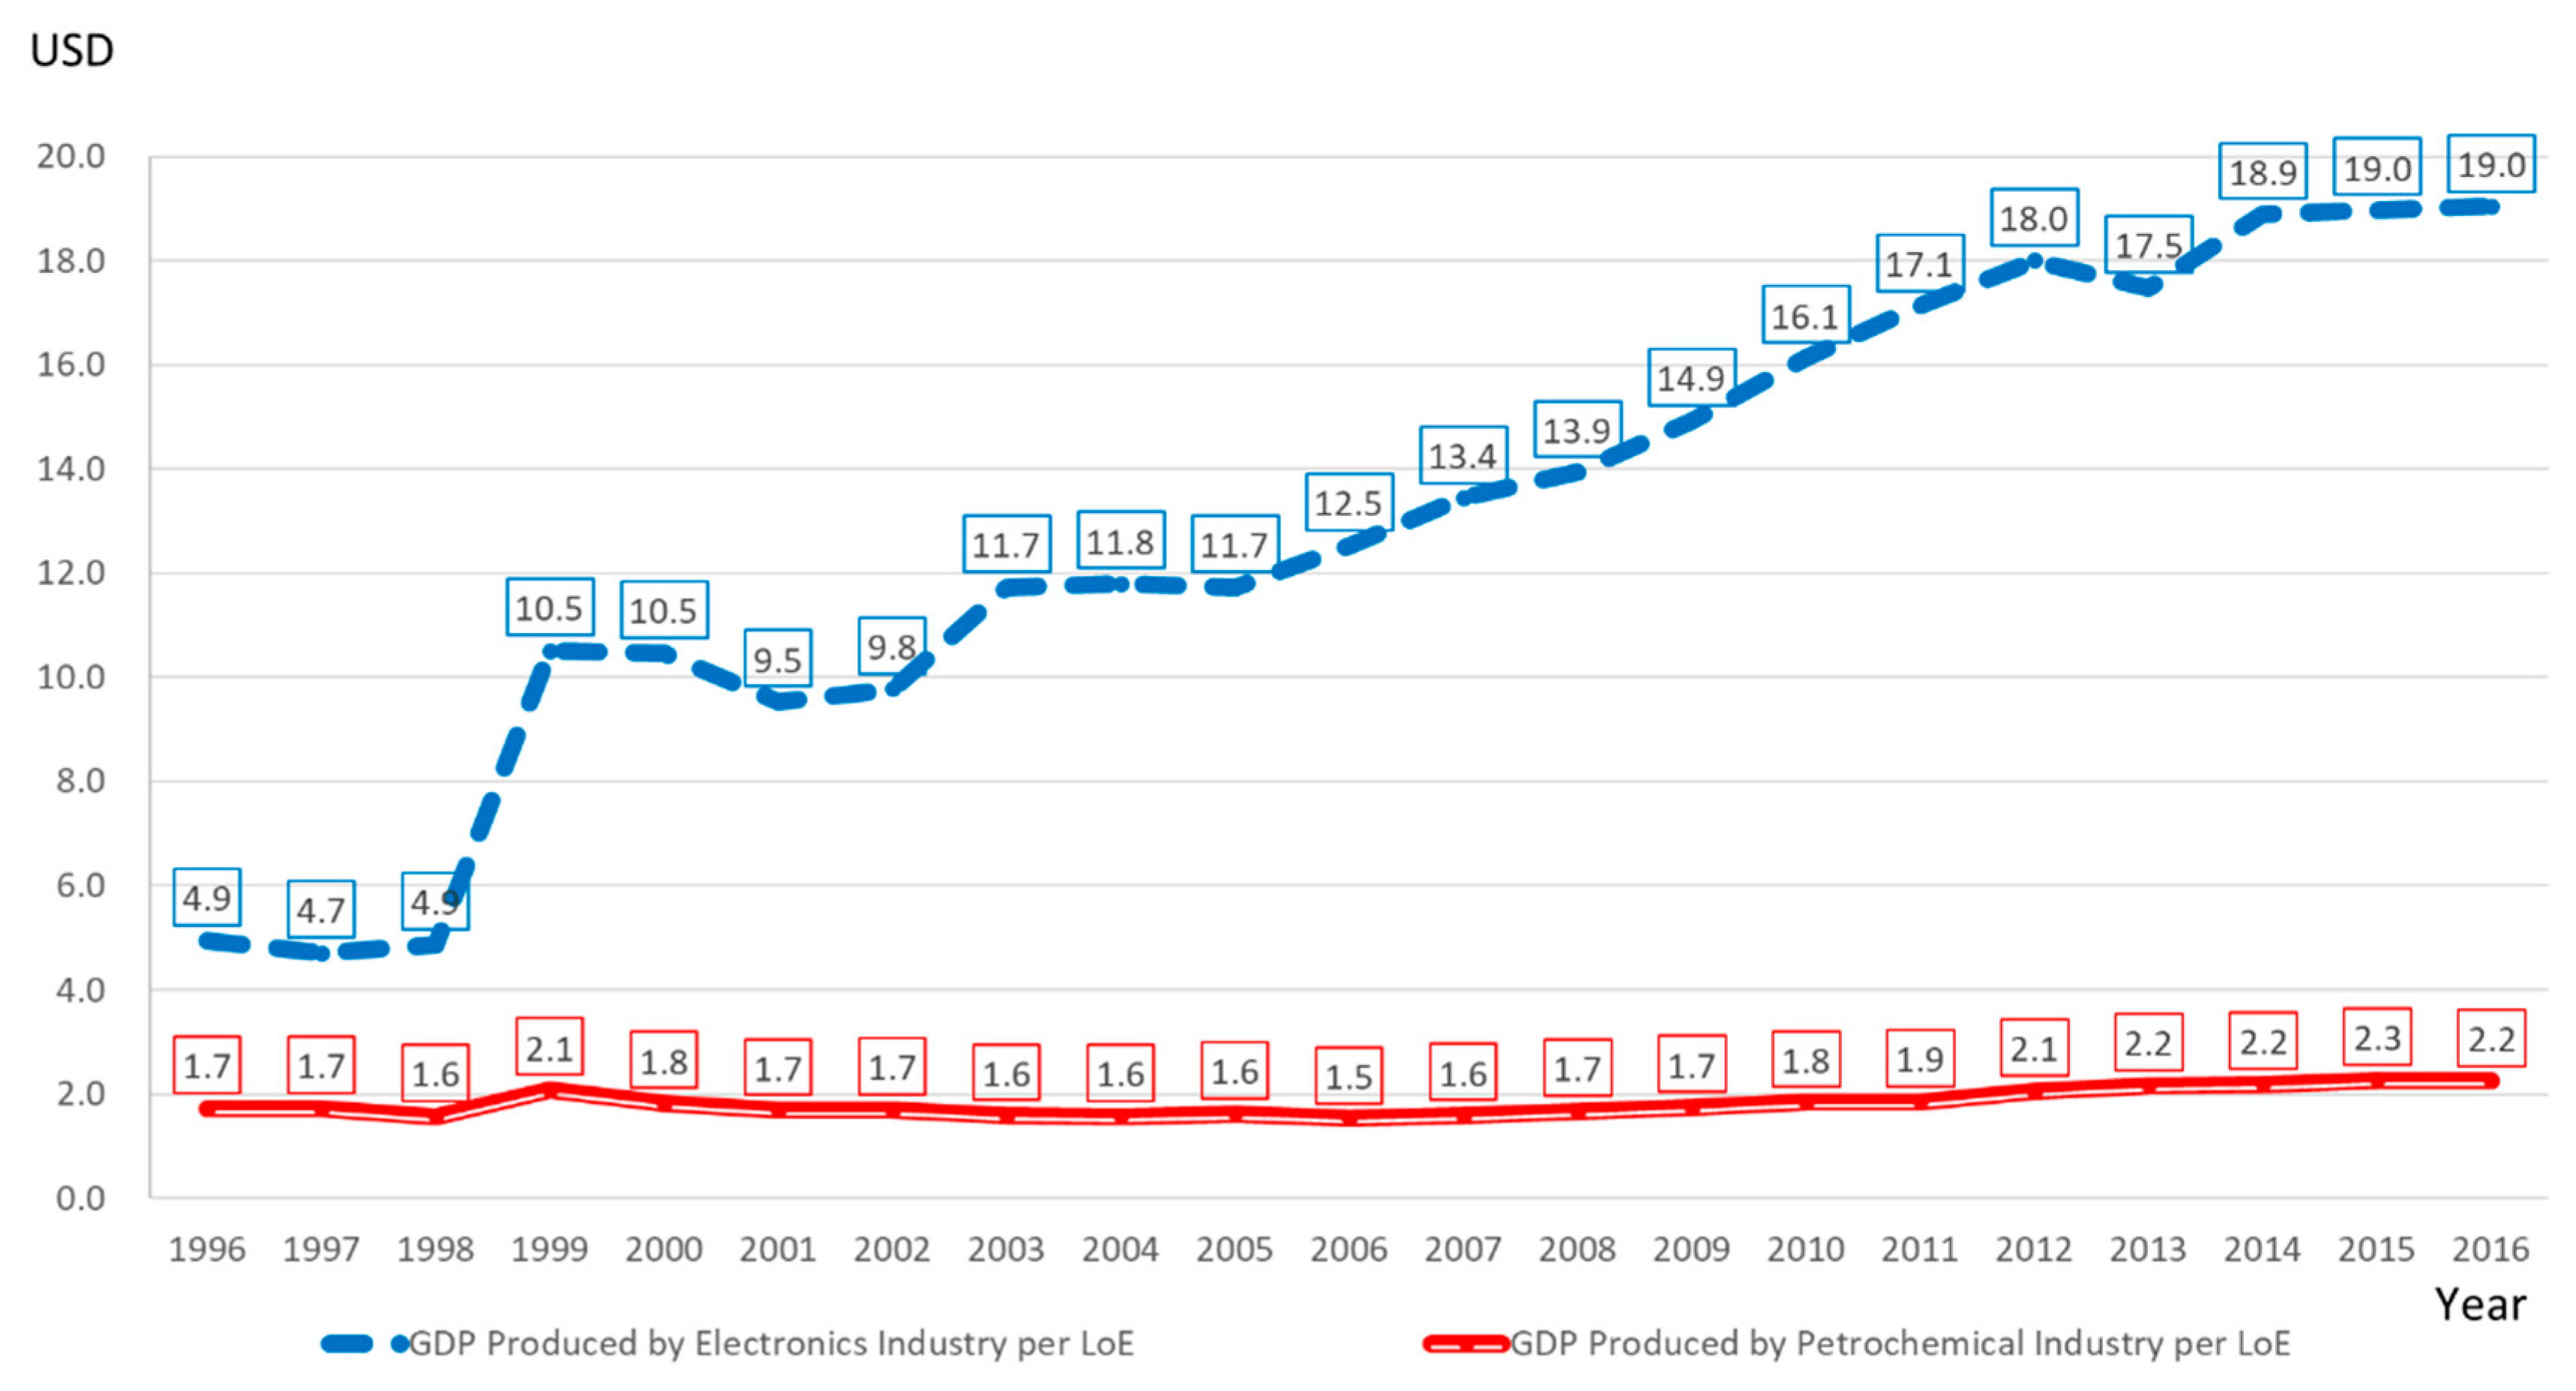
Figure 11 clearly shows: for every liter of oil equivalent energy use, the electronics industry produced a GDP of 19 USD, but this was only 2.2 USD for the petrochemical industry, with the difference being almost 8.4 times more.
As can be seen from the various data sets above, the two industries with the highest electricity consumption and carbon emissions in Taiwan are the electronics and petrochemical industries. In addition, the GDP per unit of carbon emissions and the GDP per unit of energy use (per liter oil equivalent, LoE) in the electronics industry is nearly 10 times higher than that of the petrochemical industry (see Figure 9 and Figure 11), while the GDP per unit of electricity used in the electronics industry was 4.1 times higher than the petrochemical industry (Figure 9). It can thus be seen that as long as the electronics industry in Taiwan is able to find a solution to mediate its high electricity consumption, it will be able to grow under the limits of the energy and environmental constraints in Taiwan, and continue to significantly contribute to Taiwan’s GDP. In comparison, the innate processes of the petrochemical industry require high energy consumption but contributes less to the GDP. In addition to having to resolve the issue of electricity consumption and the innate characteristics of the industries that impact on electricity consumption, it would therefore also require an industrial transition to find a solution to the problem of high carbon emissions, and high electricity and energy consumption. In view of the fact that the energy supply is highly reliant on imports, and with so many industries that are dependent on energy as their raw material, they would therefore only be able to maintain their production profitability by relying on fossil fuel subsidies, which results in external costs being underestimated (unlevied carbon and energy taxes), and the environment being sacrificed.

4.3. Countermeasures: Reducing the Energy Consumption of the Petrochemical Industry to Maintain the Growing Electronics Industry

Although Taiwan was unsuccessful in weaning off its reliance on the heavy chemical industry during the industrial transformation in the 1990s, by 2016, Taiwan’s semiconductor exports had already accounted for 13.6% of global exports (ranking third in the world), and the semiconductor industry has thus gained more importance than the chemical industry in becoming the lifeblood of Taiwan’s economic development. The vertical integration of Taiwan’s semiconductor industry is highly flexible in the various processes of integrated circuit (IC) design, foundry production to package testing, and other fields. In 2016, the production value of Taiwan’s semiconductor industry reached 81 billion USD, and is expected to grow by 3.5% this year to reach 84 billion USD. Meanwhile, while Taiwan’s patent advantage lies in the integrated circuit technologies (ICT) industry, it is also mainly in the semiconductor industry and basic communication processing. Electronic information products have grown to produce the highest output value in Taiwan’s manufacturing industry. Taiwan’s ICT industry accounts for nearly 40% of Taiwan’s total exports and 20% of its GDP, of which 55% is exported to China (and Hong Kong).
TSMC has a current capital of 8.6 billion USD, which is the largest on Taiwan’s stock exchange, and its market value accounts for as much as 19.5% of the market. Based on the current development trend of Taiwan’s electronics industry, it is inevitable that the electronics industry will need to urgently address the issues of carbon emissions and power supply capacity in Taiwan [17]. As the carbon emissions from the electronics industry comes mainly from electricity consumption, the key to the sustained development of the electronics industry therefore lies in the supply of electricity. Taking the Fourth Stage of the Central Taiwan Science Park as an example, AU Optronics’ power demand at the science park was 700 MW, and when including the upstream and downstream manufacturers located in the park, the power demand was 1.2 GW. In comparison, TSMC requires 1.1 GW of power load from the Taiwan’s power system every day, and accounts for 3% of the peak load in Taiwan (of about 36 GW). According to TSMC’s plans for new factories and other facilities, its power demand will increase by 1.1 GW over the next 10 years, and will account for 6% of the total power demand in Taiwan by then. Earlier this year, TSMC announced that it has planned for the mass production of chips based on its 5-nm process by 2020, which would increase its power demand by 720 MW [3]. It was reported previously that the power demand of TSMC’s 3-nm chip factory was about 2.1 GW, and is currently at 1.25 GW, but this is still 1.7 times that of the 5-nm chip factory, and about three times the power generation capacity of Taichung’s power plants. It is estimated that TSMC’s overall power demand will also increase to 3 GW due to the 3-nm process, exceeding Taiwan’s overall power supply capacity by 10% [5].
In terms of regional supply and demand, there is ample power supply in the central and southern regions. When not considering the power supply capacity of the first nuclear plant, the power supply capacity in the northern regions could be lower than the peak demand in the same regions (570 MW). Although the power supply capacity in the southern region is currently greater than the load demand, the remaining power was 1.68 GW in 2017, and as the plants are successively retired, it is estimated that TSMC’s current expansion will increase the power load in the south, which could greatly increase the strain on carbon emissions and power load in the southern regions [17].
From the analysis above, it can be seen that the greatest strain on Taiwan’s electricity and carbon emissions comes from the electronics and petrochemical industries. In addition, the electronics industry also represents a significant contribution to Taiwan’s GDP and will continue to be the mainstay of Taiwan’s economic development, with the government and the private sector also focused on investments in the electronics industry. The high energy consumption and high carbon emissions in the petrochemical industry are also produced due to the innate processes of the petrochemical industry, which requires the burning of large quantities of fossil fuel, in addition to requiring high amounts of electricity. On the other hand, Taiwan’s economy has moved toward types of industries like electronics, where manufacturing is based on knowledge, innovation, and increasing added value. The IC manufacturing industry has also moved from assembly and original equipment manufacturer (OEM) production to projects based on IC design, precision technologies, and system integration (such as TSMC, Largan Precision, and HTC). This is also why the electronics industry is also not considered part of the energy-intensive industries, as the GDP produced per kilowatt-hour of electricity use is 4.4 times that of the petrochemical industry, and 12 times in terms of the GDP per kilogram of CO2 emissions, and 13 times in terms GDP per liter of oil equivalent production. Therefore, the key to whether the electronics industry can continue to achieve favorable development in Taiwan lies with an industrial transition, and whether the government is able to transit away from the petrochemical industry, otherwise the development of the ICT industry will be constrained. It is of course necessary to consider whether the affected groups and social support system can withstand the impact of the production reduction of the petrochemical industry or the transition away from it, which would require social impact assessments be conducted and adjustment measures designed for the most vulnerable groups. However, considering the current situation in Taiwan, the government is faced with the dilemma of how to proceed.
Research shows that Taiwan’s low-carbon and energy transition plans over the last 20 years have been mutually contradictory [15]. From the perspective of the post-development theory, the economic orientation that Taiwan’s government has adopted has led to it lagging behind other industrialized countries, but this has come at the sacrifice of the environment and people’s health, and resulted in the economy being driven by energy-intensive industries. However, from the rapid economic growth of Taiwan in the 1970s to Taiwan’s GDP per capita breaking through $US10,000 in 1992, Taiwan’s competitive edge no longer lies in low-cost labor, nor does it lie in a sacrificial system based on low production costs that plunders the environment and health of the people. Environmental awareness has been gradually improving and the country has turned its attention to environmental and labor rights and interests, while at the same time, petrochemical capital from the United States and Japan was also gradually being withdrawn from Taiwan. Therefore, since the “Economic Construction Plan” created in 1976, strategic industries have been supported with a policy direction, especially in the electronics industry, that was intended to replace the heavy and chemical industries [19]. However, under the political influence of the private sector, which continued to engage in downstream petrochemical processing and raw material exports, this has resulted in the transition away from the heavy and chemical industries being only half-complete. In the 1980s, the electronics industry grew rapidly in the science parks and became an important bedrock for Taiwan’s economy. However, from when the fifth naphtha cracker plant commenced production in 1994 to the completion of the sixth naphtha cracker plant in 1998, the national policy continued to promote the petrochemical industry, which resulted in the existence of two high energy-using industries in Taiwan: the electronics and petrochemical industries. The policies at that time resulted in the petrochemical industry reducing the space for the electronics industry to compete in, thereby threatening Taiwan’s economic development. How these two industries should be transformed is not only a question for Taiwan’s energy transition and greenhouse gas reduction plans, but more importantly, is a key challenge for the future development of Taiwan.
Taiwan should therefore reduce the actual emissions and electricity consumption of the petrochemical industry, and not only in terms of its contribution rate to the GDP. The analysis in this section shows that the petrochemical industry has a large amount of direct emissions. According to the Ministry of Economic Affairs, the best available control technology (BACT) has been achieved for direct emissions from large facilities [
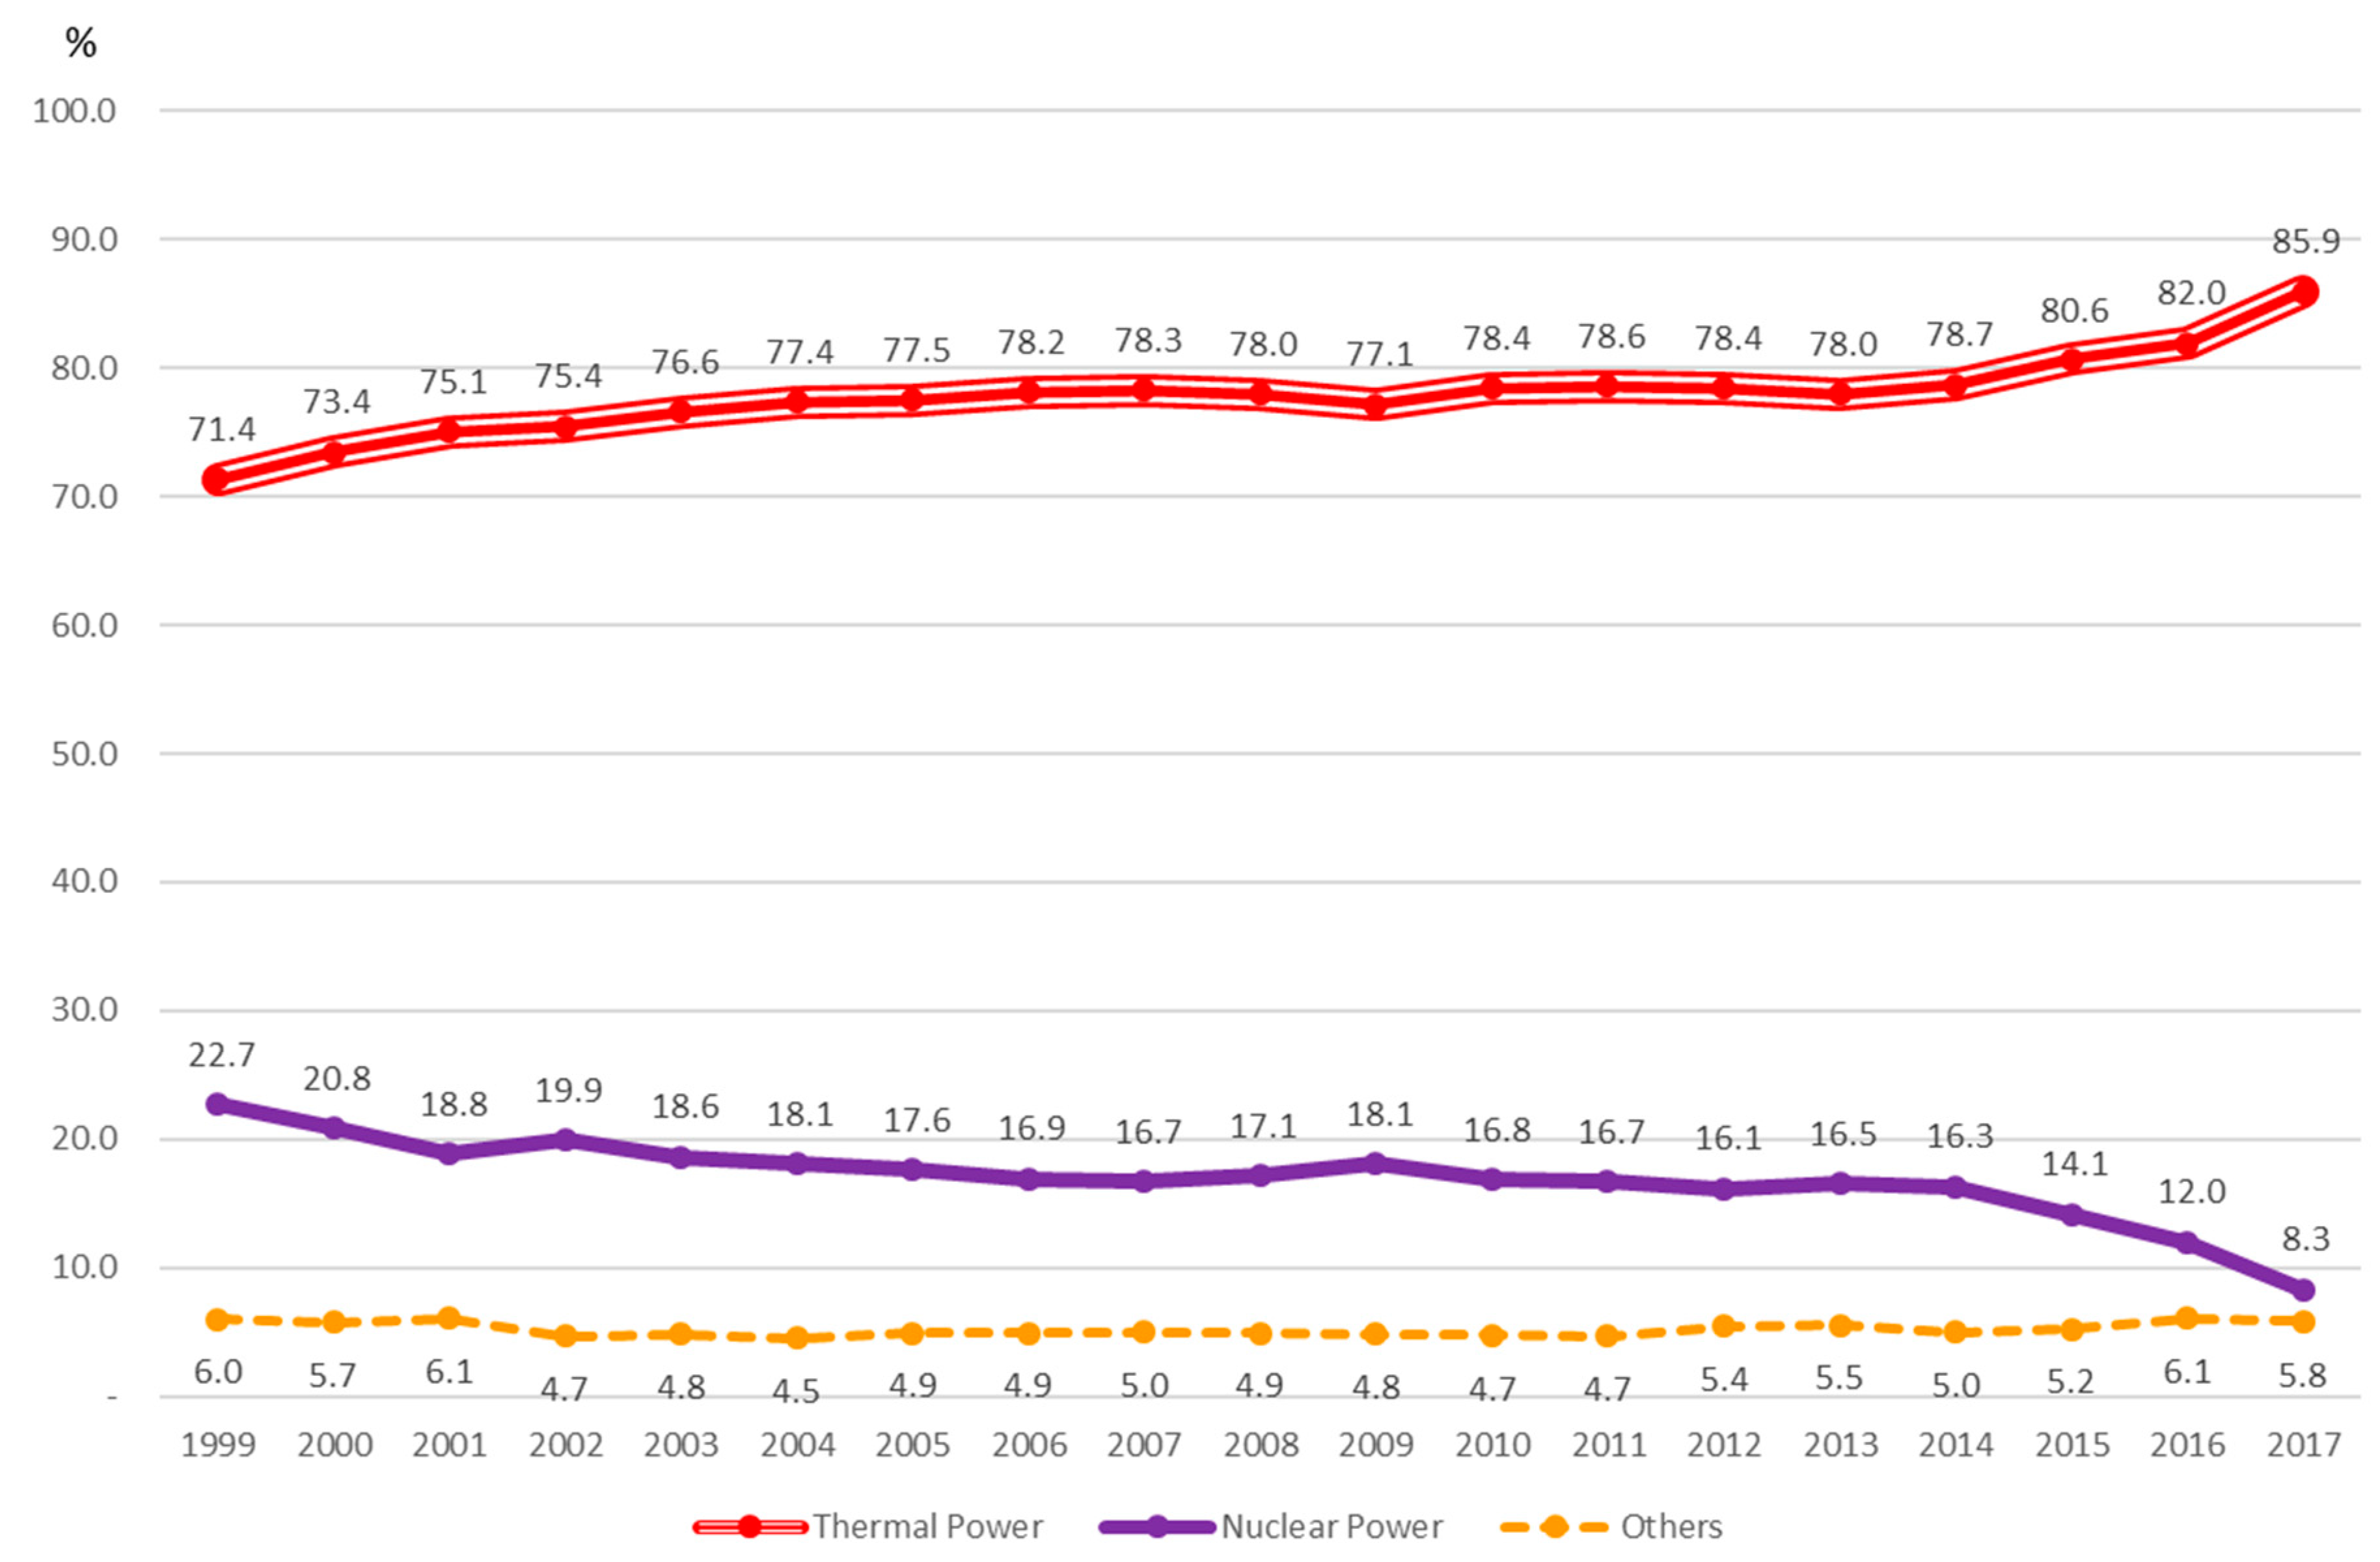
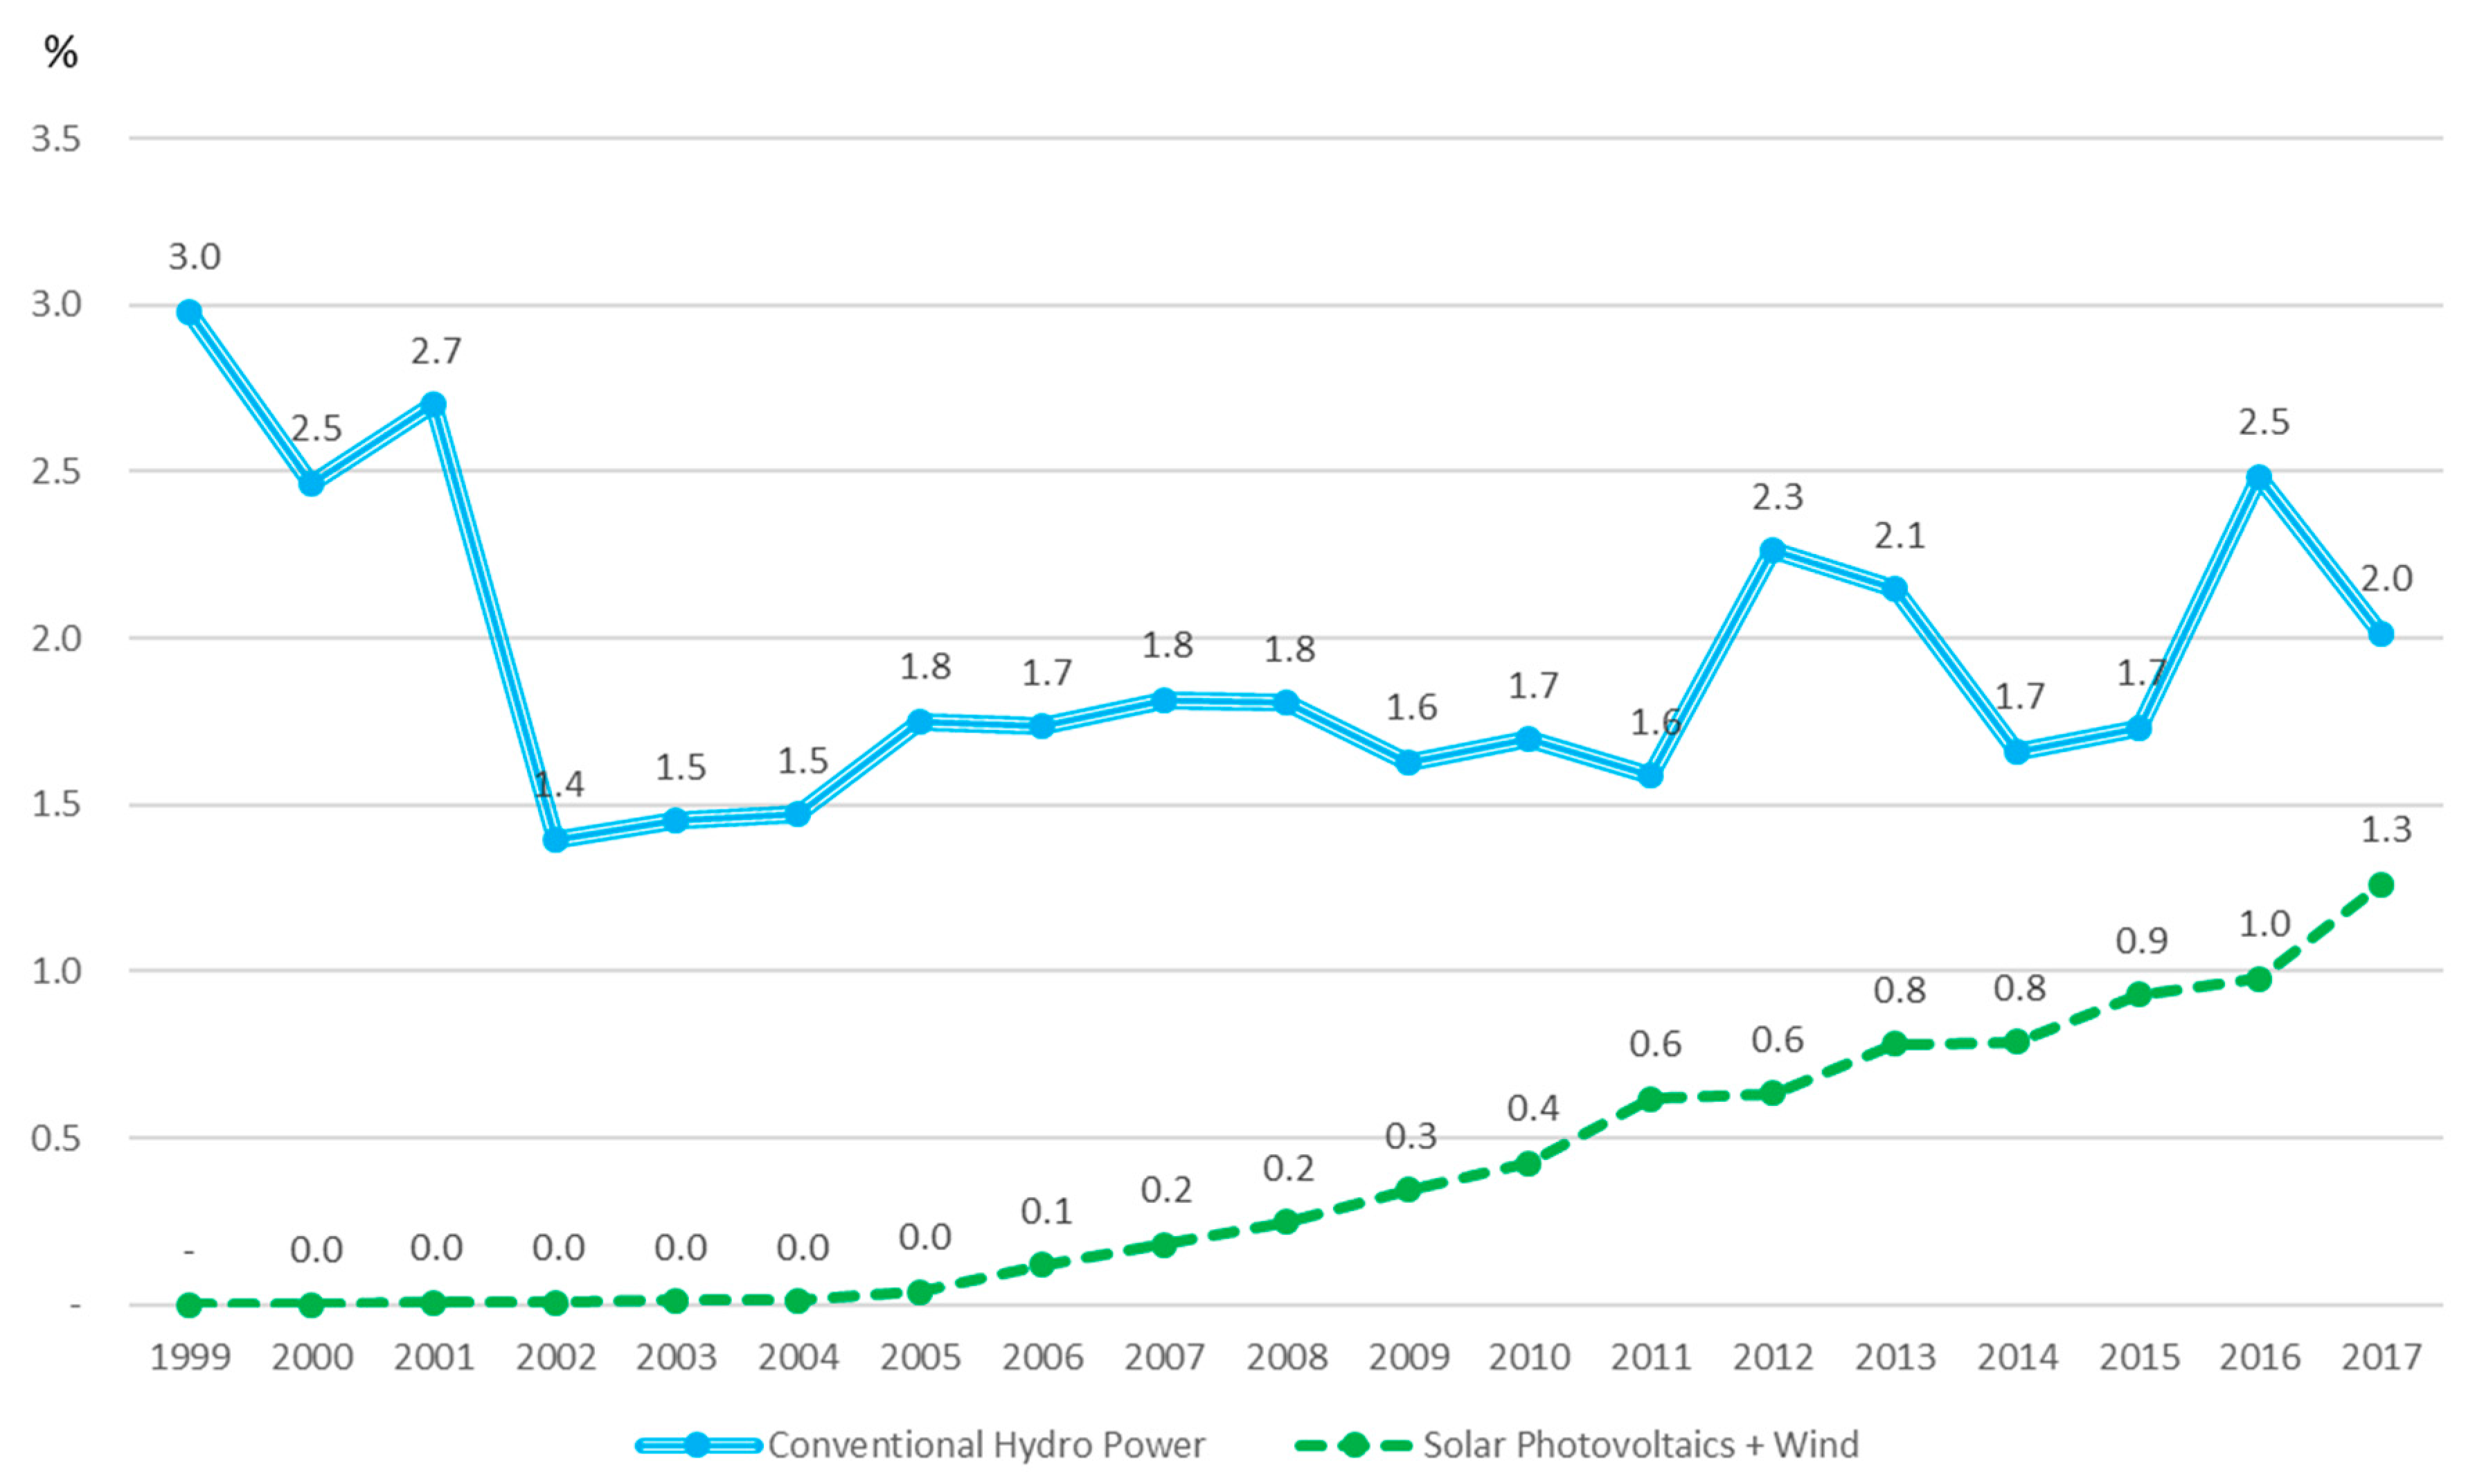
20]. However, industry representatives believe that the reduction target may hinder Taiwan’s industrial development and damage Taiwan’s international competitiveness. Therefore, the hands of the government are tied and it feels constrained in its ability to tackle the core of these problems. Relatively speaking, the carbon emissions of the electronics industry are mainly produced via the electricity generation of the energy sector. As such, the next section will focus on looking at how Taiwan’s energy composition can be improved to reduce carbon emissions.

5. The Predicament of Energy Transition in Taiwan

The electronics industry uses a high amount of energy and produces high carbon emissions, due mainly to its electricity consumption, and in 2015, the carbon emissions produced by the electricity consumption of the electronics industry accounted for 85.5% of the entire production process, which is to say that carbon emissions in the electronics industry can be effectively reduced by improving its energy composition and efficiency. However, the progress of Taiwan’s energy transition is currently slow-moving, and therefore needs to be strengthened.

5.1. The Setbacks and the Slow Progress of the Transition of Taiwan’s Energy Composition

According to the electricity emission factor announced by the Energy Bureau, Ministry of Economic Affairs, in 2017, Taiwan’s average CO2 emissions per kWh of electricity generated is 0.554 kg CO2e, which is an increase of 0.024 kg CO2e from 2016. The reason for the high electricity emission factor is because 85.9% of Taiwan’s electricity comes from thermal power generation (emission factor of 0.71 kg per kWh in 2015), of which, coal combustion generated the highest emissions at 46.6% (emission factor of about 0.925–0.926 kg per kWh), followed by natural gas at 36.6% (carbon emission factor of about 0.415 kg per kWh), with oil accounting for 4.7% (about 0.772 kg per kWh). Emissions produced solely from the power generation sector accounted for 65.23% of Taiwan’s total emissions [21]. As the electricity consumption by the electronics industry comprised 18% of the country’s consumption, the levels of carbon emissions and energy consumption were second only to the petrochemical industry. In other words, changing the energy composition would be able to change the situation of carbon emissions and energy consumption in Taiwan for the better, while maintaining the electricity demand of the electronics industry. As can be seen from Figure 9, not only is the efficiency in the GDP per unit of energy use and carbon emissions in the electronics industry much higher than that of the petrochemical industry (2.07 USD as compared to 0.49 USD in 2016), but as the electronics industry has remained competitive even as it continued to grow, the efficiency of the petrochemical industry in generating GDP has paled in comparison compared to two decades ago, due in part to the improvements to the labor and environmental conditions in Taiwan.
As can be seen from Figure 12, the excessive proportion of thermal power generation has resulted in the CO2 from the fuel combustion of Taiwan’s electricity generation to be as high as 93.69% [14], with industrial processes accounting for 6.26%. Therefore, there is a strong relationship between electricity consumption and carbon emissions in Taiwan 2017. As such, faced with the pressure of having to reduce carbon emissions, the solution should be targeted at the electricity needs of the electronics industry. In comparison, most of the production process in the petrochemical industry involves the burning of fossil fuels due to the nature of the petrochemical industry, and as such, the problem of its carbon emissions can only be solved via an industrial transition to reduce the environmental impact in Taiwan. Therefore, in the search for alternative energy sources, we would need to first develop renewable energy, and to reduce coal-fired power and thermal power generation (using natural gas as a possible means of transition), with these being the most important tasks of Taiwan’s energy transition. However, such a target would depend on whether renewable energy can successfully reach 20% of electricity generation, as has been the goal set by the government for 2025.
Figure 13 shows that in the last 18 years, Taiwan’s nuclear energy use has decreased by 14.4% from 22.7% to 8.3% due to the anti-nuclear movements and the nuclear-free homeland policy. However, in preparation for the decline of nuclear power generation, Taiwan should have developed alternative low-carbon and low-polluting energy sources at the outset, but as can be seen in Figure 14, solar and wind energy have only grown by 1.3% in the last 18 years since 1999, and hydroelectric power has remained at 2.0%, with total renewable energy sources still not surpassing 3.5% in 2016. In order to make up for the reduction in nuclear power, Taiwan has instead increased its thermal power generation, resulting in this proportion increasing by 14.5%, from 71.4% in 1999 to 85.9% in 2017, which contributes to higher carbon emissions and pollution.
In 2016, Taiwan had a change of government. The ruling Democratic Progressive Party (DPP) proposed an energy mix of 50% natural gas, 30% coal-fired power, and 20% renewables by 2025, and stipulated in the revised Electricity Act, passed by the Legislative Yuan (the congress of Taiwan) on 11 January 2017, that nuclear energy use will cease by 2025 [4]. However, the ruling party faces the conundrum of the interdependence between carbon reduction and energy use in Taiwan. In the past 18 years, Taiwan has had two changes of government, but it has still not been able to rid itself of the high-polluting and high-energy intensive thermal power generation, and the highly-controversial nuclear power generation, to effectively develop alternative energy sources. The development of wind and solar energy in Taiwan has also been slow in the past, and hydroelectric power has also reached a saturation point. Figure 14 shows that renewable energy only comprised 3.5% and 3.3% of Taiwan’s power generation in the past two years (in 2016 and 2017, respectively). Chou [16] pointed out that the contradictions in Taiwan’s energy and industrial policies, and its carbon reduction policies, have resulted in an inertia in Taiwan’s energy transition. In 2017, solar and wind power grew by 30% compared to the previous year, but on the whole, it still only reached 1.3%. Therefore, the challenges faced by the ruling party in its energy policy and revised Electricity Act became more apparent in 2018.
In 2018, the government anticipated that the electricity demand by the electronics industry could increase, due in part to the trade war between the United States and China, which resulted in companies moving their factories from China to Taiwan, leading to an increase in electricity use, which therefore prompted the government to accept arguments of possible power shortages in Taiwan. The government hence sought to restart the Shen-ao coal-fired power plant where construction had previously been suspended as an emergency response to the power shortage, and passed an environmental impact assessment on 14 March 2018, but this was met with strong public backlash that affected the performance of the ruling party at the local elections in November 2018, even as the Premier had also abruptly announced the suspension of the Shen-ao Power Plant on 5 October prior to the elections. Although the 2011 Fukushima nuclear disaster brought Taiwan’s pursuit of a nuclear-free homeland to a high point, which resulted in the enactment of Paragraph 1 of Article 95 in the Electricity Act for the provision to achieve a nuclear-free homeland by 2025, because the government’s development of renewable energy as a replacement was slow, this resulted in the talk of power shortages becoming more widespread in 2018, resulting in some members of the public calling for the reactivation of the Fourth Nuclear Power Plant (of which construction had been deferred), which therefore provided support for the referendum to repeal this new paragraph in the Electricity Act. The referendum was held on 24 November 2018, of which 10.83 million voted, with 5.89 million votes in support of the repeal, accounting for 54.42% of the votes, and 4.01 million who did not, or 37.05% of the votes. This result is inconsistent with the past attitudes of Taiwanese who had favored a nuclear-free homeland in support of green energy, but it was partly also due to other political factors that could be attributed to the local elections, which were held alongside the referendum. The more fundamental reason, however, was the slow development of renewable energy, and the inability of the ruling party to demonstrate that renewable energy can act as a replacement for coal-fired and nuclear power, due in part to their short time in government, thereby giving rise to concerns over power shortages and leading to more and more people who were willing to accept that the goal of a nuclear-free homeland had to be delayed. Faced with the setbacks and the delayed energy transition, as well as the conundrum of the interdependence between carbon emissions and energy use, the aim to decouple carbon emissions from economic growth had become even more difficult.

5.2. The Way toward Decoupling: Accelerating the Development of Renewable Energy and Power Grids

As early as 2009, the Energy Management Act was revised to tighten efficiency standards and the Renewable Energy Development Act was passed in June of that year. However, renewable energy has not seen significant growth. Chou [16] mentioned that from the angle of path dependency, be it in terms of value, cognition, administration, and technology, the government and people have been held back by nuclear myths, and have not committed themselves to developing renewable energy (such as by proposing a clear target in terms of the energy composition). Therefore, even with the Renewable Energy Development Act, renewable energy as a proportion of power generation has remained at very low level, with the energy composition changing little and still largely based on thermal power generation, and ignoring the trends in global climate change and the rapid developments among the international community in the energy and low-carbon society. It was only when a DPP government advocated for a nuclear-free homeland in 2016, where it proposed the 50–30–20 electricity generation goal by 2025—50% in natural gas, 30% in coal-fired power, and 20% in renewable energy—and then also amended the Electricity Act, which was in addition to its stipulation for the nuclear-free homeland policy. More importantly, the DPP also removed the monopolization of electricity transmission, distribution, and sales, so that the market became further diversified; market mechanisms were introduced to promote the development of renewable energy. In other words, it was only in 2017 that Taiwan began to possess the basic regulatory conditions to accelerate the development of renewable energy installations and power grids. However, although the Electricity Act is intended to promote renewable energy, its targets are focused on the electricity and carbon emission factor, and not on the proportion of electricity generation. In the absence of an energy tax in Taiwan, the market drivers for renewable energy development are still limited, and Taiwan has to therefore rely on government policies to intervene to encourage investment.
The 2017 Energy Transition White Paper pointed out that the national energy strategy is to implement the 50–30–20 goal of clean energy power generation in order to achieve an energy mix that is efficient, autonomous, and diversified, and to stabilize the power supply. However, the government’s plan formulation, policies, and measures to ensure a stable supply of electricity from the Taiwan Power Company is scattered and lacks an integrated strategy, which gave ample reason for businesses and the public to be concerned about a shortage of power. The misgivings over a shortage of power is indeed also reflected in the results of the 2018 referendum. Nevertheless, what needs to be strengthened is the national large-scale project that the ruling party planned for in 2016, namely the forward-looking infrastructure program that covers energy creation, energy conservation, energy storage, and the stabilization of the power supply. However, under the section on the construction of energy storage systems in the White Paper, it listed only the timeline for the commercialization of energy storage technologies, but did not clearly lay out a roadmap for the development of energy storage technologies. There is thus a need to strengthen energy storage capabilities and system integration. In the Smart Grid Master Plan proposed by the government in February 2017, the goals are based on a 20-year plan, and will only enter the stage of wider application in 2021–2030, which makes it difficult to try to integrate this plan with the 20% renewable energy target set for 2025. In the planning of the power grid, a total budget of 933 million USD has been set aside for smart power generation and its dispatch, distribution, and transmission for the duration of the plan, at an average of 46 million USD a year. In comparison, the budget for the new high-voltage power grid in Germany will cost 20 billion Euros (from 2012 to 2020), which at an average of 2.5 billion Euros a year, is 62 times that of Taiwan’s smart grid budget [22]. In terms of the overall development of renewable energy, the special budget in the forward-looking infrastructure program will increase by 810 million, or an average of 1.13 million USD a year. In contrast, a budget of 550 billion Euros was allocated for the reconstruction of Germany’s energy system in 2012, or an average of 15 billion Euros a year, but this is 154 times that of Taiwan’s budget. Germany’s territory is about 10 times that of Taiwan, and its population is about 3.6 times that of Taiwan; as such, the amount that Taiwan has invested in renewable energy can hardly be said to be enough.
In terms of the regulations, while the focus has been placed on increasing the proportion of renewable energy in power generation to 20%, there is still a need to put more emphasis on energy conservation and energy storage. The regulatory densities for rooftop solar energy, energy storage facilities, and the construction of regional power grids, among others, will also need to be strengthened. There also contain many obstacles to such development among old regulations. The regulations for energy storage facilities, including for fire control, safety, and others, still have not been perfected, and will also become obstacles to development. For example, Germany has introduced the Smart Meters Operation Act (MsbG) and the Act on the Digitization of the Energy Transition, which are aimed at providing oversight to the digitalization of the grid. What this means for Taiwan is that the government needs to invest financial resources in renewable energy in the future (especially in the power grid) and reform the regulations in order to catch up. Whether it is for the development of renewable energy or to use natural gas to replace coal-fired power, a period of transition is still required, and it would be very challenging for a latecomer to play catch up when it did not act as it should have in the past. Energy transition has created pressure for the government, and under such pressure, the government has chosen to compromise on the plan to abolish nuclear power. However, from a long-term perspective, there is still a need to speed up the development of renewable energy and change Taiwan’s energy composition as these are still the most effective methods for reducing carbon emissions, and only then will it be possible to decouple the interdependence between carbon emissions, energy, and economic growth.
In addition, under the current plan for energy conservation, Taiwan would be able to conserve 16.46 billion kWh by 2025, which when compared with 2016, would account for 6% of the planned power generation. The use of natural gas to replace coal-fired power is expected to reduce the total carbon emissions by more than 10%, thus it is possible to achieve the reduction target by 2025. However, taken as a whole, the specific measures and regulatory strength for energy conservation under the Energy Transition White Paper is still insufficient, and there exist challenges to to be overcome so the target of 6% can be achieved. Due to market incentives, Taiwan has been unable to levy an energy tax to date, and as such, it has been impossible for the external costs of the power generation from fossil fuels to be internalized, and with insufficient incentives available to shift the power supply market to renewable energy, it would be difficult to achieve a 20% renewables contribution [23], which would then have a knock-on effect on the effectiveness of the electricity supply to reduce carbon emissions. Furthermore, even if the carbon reduction target could be achieved by 2025, for the 2030 carbon reduction target (of reducing carbon emissions by 20% from 2005 levels), there is still a need to confront the issues presented by the electronics and petrochemical industries, and to create additional capacity in the current carbon emissions and electricity consumption to absorb the higher growth that is expected from the electronics industry in the future; otherwise, the petrochemical industry will become the stumbling block in the development of the electronics industry if it continues to squeeze out the capacity needed. Furthermore, even if the referendum has resulted in the deadline to achieve a nuclear-free homeland being suspended, nuclear power is no longer a reasonable option for Taiwan’s energy policy within the next 10 years. Therefore, the incentive mechanism to support energy conservation and the electricity market would still need to be strengthened. Even so, the most fundamental solution that Taiwan should undertake right now would be to reduce the carbon emissions and electricity consumption in the petrochemical industry, and increase the proportion of renewable energy, and only then will it be possible for Taiwan to achieve its long-term carbon reduction target.

6. Conclusions

Decoupling economic growth and carbon emissions is the goal of many industrialized countries. Many studies have compared transnational data, as well as the domestic economic and carbon emission structures and models across countries, to identify whether decoupling has occurred [7,8,9]. However, the literature review shows that the different stages of economic development in different countries require completely different decoupling policies for energy production and consumption, and because of the limitations of these excellent studies, they do not provide specific policy recommendations for the industrial and energy transitions for these countries [10,11,12]. In this article, other than quantitative longitudinal studies, qualitative analysis of the industrial and energy development policies are therefore important analytic objects to support and interpret the outcomes of the longitudinal studies. The analysis in this article surmised that the largest contributors to Taiwan’s carbon emissions and energy consumption come from the electronics and petrochemical industries. From the policy point of view, the electronics industry will continue to grow in the future and the contribution to GDP of the petrochemical industry will decline to be much lower than the electronics industry. The carbon emissions in the electronics industry mainly comes from electricity consumption. Therefore, changing the energy structure and reducing the carbon emissions and electricity consumption in the petrochemical industry have become the key to decoupling economic growth and carbon emissions in Taiwan. The research approach adopted in this study can act as a reference for domestic and international studies of decoupling in other countries. The first step would be to compare the sectoral and industrial carbon emissions and electricity consumption structures of individual countries, followed by an analysis of their power generation structures to understand the local problems, and thereby the appropriate decoupling policies necessary for each country.
Taiwan’s electronics industry occupies an important position in the global supply chain and contributes significantly to the country’s domestic GDP. Meanwhile, it is also the key industry for the future of a Taiwan economy based on a foundation of innovation and research and development, but at the same time, it is also the industry with the highest energy consumption. Because the public was so concerned about power shortages while the country underwent an energy transition, they therefore rejected the goal of achieving a nuclear-free homeland by 2025 during the referendum on 24 November 2018. A number of literature reviews have pointed out that it is possible to achieve both economic growth and carbon reduction by improving the energy- and carbon-use efficiency. If Taiwan remains ineffective in its carbon reduction, then when faced with international requirements regarding carbon footprint reduction in the future, Taiwan’s electronics industry will still meet with obstacles to its development. Taiwan is facing two main challenges: the first being that adjustments would need to be made to the high carbon emissions and electricity consumption in the petrochemical industry; in addition, there needs to be a decoupling between carbon emissions and electricity consumption, so that it will be possible to decouple the economic growth brought about by the electronics industry from carbon emissions.
Taiwan’s carbon emissions have been growing for the past 20 years. The contribution of the electronics industry to Taiwan’s GDP has been increasing year by year, but the energy intensity has been correspondingly decreasing, which means that the efficiency in the GDP per unit of energy use has also been increasing. The GDP produced by the electronics industry per kWh of electricity use is 4.4 times that of the petrochemical industry, and 12 times in terms of the GDP per kg of CO2 emissions, and 13 times in terms of the GDP per liter of oil equivalent production. The efficiency in the GDP per unit of energy use and carbon emissions in the electronics industry is not only far higher than the petrochemical industry, but the electronics industry is also able to maintain its competitiveness as it grows. Comparatively, due to the improvements to the labor and environmental conditions in Taiwan, the GDP efficiency of the petrochemical industry has paled in comparison to 20 years ago. Therefore, the petrochemical industry needs to reduce its carbon emissions and electricity consumption; otherwise, under the carbon reduction pathway, the petrochemical industry will compete with the electronics industry for space for development and will constraint the space for the electronics industry to further develop in the future.
From the analysis in this article, it is therefore not difficult to understand that one of the key issues for Taiwan in terms of its ability to reduce carbon emissions are due to the way the petrochemical and electronics industries work. As mentioned above, official data shows that most of the petrochemical and power generation industries are already using the best available control technology (BACT), so there is limited room for improvement within the existing petrochemical industry and power plants. Most of the carbon emissions caused by the electronics industry is due to its high electricity generation. Therefore, the most important carbon reduction strategies in Taiwan would have to rely on the energy transformation strategies currently undertaken and the acceleration of renewable energy development.
On the other hand, solar and wind energy have only increased by 1.3% in the last 18 years, since 1999, and together with the 2% generated by hydroelectric power, means that the proportion of renewable energy did not even crossed 3.5% in 2016. Based on the 2025 plans for energy conservation and energy composition, the short-term reduction targets are achievable. However, as the measures and enforcement control for energy conservation, and the incentives for renewable energy development are insufficient (for example, Taiwan has still not levied energy taxes), it is still a question as to whether Taiwan’s long-term plans can be realized. Even if the carbon reduction target can be achieved by 2025, the space for the development of the electronics industry, which is expected to see high growth, will inevitably be inhibited by the petrochemical industry and the latter’s high carbon emissions and electricity generation, which will therefore pose challenges to Taiwan in meeting the 2030 carbon reduction targets (of reducing carbon emissions by 20% from 2005 levels). There is therefore a need to strengthen the incentive mechanism to support energy conservation and the electricity market, but at the most fundamental level, carbon emissions and electricity consumption of the petrochemical industry still needs to be reduced and the proportion of renewable energy increased, so that Taiwan will be able to achieve its long-term carbon reduction target and work toward sustainable development.

Author Contributions

Conceptualization, D.W., K.C. and H.L.; Methodology, D.W., K.C. and H.L.; Resources, D.W., K.C. and H.L.; Data Curation, D.W., K.C. and H.L.; Writing-Original Draft Preparation, D.W., K.C. and H.L.; Writing-Review & Editing, D.W., K.C. and H.L.; Visualization, D.W., K.C. and H.L.; Supervision, K.C. and H.L.; Project Administration, K.C. and H.L.; Funding Acquisition, K.C. and H.L. (The authors have equal contributions).

Funding

This research was funded by Ministry of Science and Technology, grant number MOST 107-3011-F-002-005.

Acknowledgments

We would like to thank Roy Ngerng for his assistance in the translation and proofreading of the article.

Conflicts of Interest

All authors declare they have no conflict of interest regarding this research.

References

  1. Bureau of Foreign Trade. Statistics of Trade. 2017. Available online: https://www.moeaboe.gov.tw/ECW/populace/content/wHandMenuFile.ashx?file_id=5356 (accessed on 26 April 2019).
  2. Energy Bureau. Statistics and Analysis of CO2 Emissions from Fuel Combustion. 2018. Available online: https://www.moeaboe.gov.tw/ECW/populace/content/wHandMenuFile.ashx?file_id=5356 (accessed on 8 Febuary 2019).
  3. Ou. Lack of Long-Term Stable Power, TSMC 3 nm New Plant Might Leave. 2017. Available online: https://ec.ltn.com.tw/article/breakingnews/2155439(accessed on 13 February 2019).
  4. EPA. Republic of China National Greenhouse Gas Emissions Report. Available online: http://unfccc.saveoursky.org.tw/2018nir/ (accessed on 13 December 2018).
  5. Chen, L.-R. Fantasy Technology: TSMC New Plant Uses Electricity to Surpass the Entire East Taiwan Common Wealth Journal. 2017. Available online: https://www.cw.com.tw/article/article.action?id=5084341 (accessed on 30 January 2019).
  6. Liou, H.M. Carbon Emission Reduction of Taiwan’s Electric Power Industry. J. Adv. Clean Energy 2015, 2, 18–34. [Google Scholar]
  7. Fankhauser, S.; Jotzo, F. Economic growth and development with low-carbon energy. Wiley Int. Rev. Clim. Chang. 2018, 9, 1–16. [Google Scholar] [CrossRef]
  8. Zoundi, Z. CO2 emissions, renewable energy and the Environmental Kuznets Curve, a panel cointegration approach. Renew. Sustain. Energy Rev. 2017, 72, 1067–1075. [Google Scholar] [CrossRef]
  9. Nordin, S.K.B.S.; Kun, S.S. Investigating the Relationship on CO2, Power consumption and Economic Growth: A Panel Data Approach. Chem. Eng. Trans. 2018, 63, 715–720. [Google Scholar]
  10. York, R.; Mcgee, J.A. Does renewable energy development decouple economic growth from CO2 emissions? Socius 2017, 3, 2378023116689098. [Google Scholar] [CrossRef]
  11. Wu, Y.; Zhu, Q.; Zhu, B. Decoupling analysis of world economic growth and CO2 emissions: A study comparing developed and developing countries. J. Clean. Prod. 2018, 190, 94–103. [Google Scholar] [CrossRef]
  12. Schandl, H.; Hatfield-Dodds, S.; Wiedmann, T.; Geschke, A.; Cai, Y.; West, J.; Owen, A. Decupling global environmental pressure and economic growth: Scenarios for energy use, materials use and carbon emissions. J. Clean. Prod. 2018, 132, 45–56. [Google Scholar] [CrossRef]
  13. Babbie, E.R. The Practice of Social Research; International Thomson Publishing Services: Connecticut, UK, 1998. [Google Scholar]
  14. Energy Bureau. Energy Statistics Inquiry System. 2018. Available online: https://www.moeaboe.gov.tw/wesnq/Views/B01/wFrmB0102.aspx (accessed on 8 February 2019).
  15. Chou, K.-T. Predicament of Sustainable Development in Taiwan: Inactive transformation of high power consumption and high carbon emission industries and policies. JACE J. Adv. Clean Energy 2015, 2, 44–68. [Google Scholar]
  16. Chou, K.-T. Tri-Helix Energy Transition in Taiwan. In Energy Transition in East Asia; Chou, K.T., Ed.; A Social Science Perspective; Routledge: Abingdon-on-Thames, UK, 2018; Chapter 2; pp. 34–54. [Google Scholar]
  17. Wang, Y.-H. Electricity Growth of 1.5%, Taiwan is under Great Pressure. China Times. Available online: https://www.chinatimes.com/newsarticles/20181119000581-260110 (accessed on 4 February 2019).
  18. National Statistics, R.O.C.s Taiwan. Accounting Office Database. Available online: https://www.stat.gov.tw/np.asp?ctNode=452 (accessed on 8 February 2019).
  19. Tsai, W.-H. The Political-Economic Analysis about the Development of Taiwan’s Petrochemical Industry. Soochow J. Polit. Sci. 1997, 8, 157–224. [Google Scholar]
  20. Ministry of Economic Affairs Industry Bureau. Environmental Regulation Trend Analysis. 2014. Available online: https://proj.ftis.org.tw/eta/epaper/PDF/ti107-1.pdf (accessed on 23 March 2019).
  21. Energy Bureau. Emission Intensity and Power Plant Emissions Factor. 2018. Available online: http://www.cier.edu.tw/site/cier/public/data/181-051-054-%E8%87%BA%E7%81%A3%E7%B6%93%E6%BF%9F-%E9%84%AD%E7%9D%BF%E5%90%88%E9%84%AD%E7%BF%94%E5%8B%BB.pdf (accessed on 5 September 2018).
  22. Chueh, T.-H. The Current Status and Prospects of Germany’s Energy Transformation-Released to the 2016 Energy Planning Blueprint, Continuing Reforms in Various Fields such as Renewable Energy. Industrial Technology Research Institute (ITRI), 2017. Available online: https://km.twenergy.org.tw/ReadFile/?p=Reference&n=201611884549.pdf (accessed on 23 December 2018).
  23. Nee, M.-T.; Lin, M.-X. Towards the Road to Energy Transformation-Environmental, Social and Democratic Aspects of Electricity Act; RSPRC: Taipei, Taiwan, 2017. [Google Scholar]
Figure 1. CO2 emissions by sectors in Taiwan (1996–2016). Source: Energy Bureau [2]. Chart drawn by the authors.
Sustainability 11 05664 g001
Figure 2. CO2 emissions by industries in Taiwan (1996–2016). Source: Energy Bureau [2]. Chart drawn by the authors.
Sustainability 11 05664 g002
Figure 3. Main sources of carbon emissions in Taiwan (2016). Source: Energy Bureau [2]. Chart drawn by the authors.
Sustainability 11 05664 g003
Figure 4. Main sources of electricity consumption in Taiwan (2016). Source: Energy Bureau [14]. Chart drawn by the authors.
Sustainability 11 05664 g004
Figure 5. Carbon emissions of the petrochemical and electronics industries (1996–2016). Source: Energy Bureau [2]. Chart drawn by the authors.
Sustainability 11 05664 g005
Figure 6. Electricity consumption of the petrochemical and electronics industries (1996–2016). Source: Energy Bureau [14]. Chart drawn by the authors.
Sustainability 11 05664 g006
Figure 7. Electricity consumption and GDP contribution of the electronics and petrochemical industries (1996-2016). Source: Energy Bureau [14] and National Statistics, R.O.C, Taiwan [18]. Chart drawn by the authors.
Sustainability 11 05664 g007
Figure 8. Carbon emissions and GDP contribution of the electronics and petrochemical industries. Source: Energy Bureau [2] and National Statistics, R.O.C, Taiwan [18]. Chart drawn by the authors.
Sustainability 11 05664 g008
Figure 9. GDP produced by the electronics and petrochemical industries per kWh of electricity consumption and per kg of carbon emissions. Source: Energy Bureau [2] and National Statistics, R.O.C, Taiwan [18]. Chart drawn by the authors.
Sustainability 11 05664 g009
Figure 10. Energy consumption and proportion of GDP produced by the electronics and petrochemical industries. Source: Energy Bureau [14] and National Statistics, R.O.C, Taiwan [18]. Chart drawn by the authors.
Sustainability 11 05664 g010
Figure 11. GDP produced by the electronics and petrochemical industries for every unit of energy used. Source: Energy Bureau [14] and National Statistics, R.O.C, Taiwan [18]. Chart drawn by the authors.
Sustainability 11 05664 g011
Figure 12. Composition of electricity generation in Taiwan (2017). Source: Energy Bureau [14]. Chart drawn by the authors.
Sustainability 11 05664 g012
Figure 13. Power supply composition change in Taiwan (2017). Source: Energy Bureau [14]. Chart drawn by the authors.
Sustainability 11 05664 g013
Figure 14. Percentage of Taiwan’s renewable energy (2017). Source: Energy Bureau [14]. Chart drawn by the authors.
Sustainability 11 05664 g014

