1. Introduction
The road lighting system is very important for road travel. It uses a large amount of electricity and has a long-distance that causes power loss in the electrical transmission line. To solve this problem, the idea of combining the power generation system and the road lighting system is presented to reduce power loss in the transmission line. In the same way, if too much electricity is produced for the use of the road lighting system, it may be sent back to the grid for sale. This concept is called “A nano-grid system”. The concept of creating a nano-grid road lighting system has been presented in several research works [
1,
2,
3,
4,
5,
6,
7,
8,
9,
10,
11,
12,
13]. The combination of power-generation and electrical-load systems results in a concept referred to as nano-grid system. Each country has different power sources that are suitable for use in each nano-grid system.
In addition, the road lighting system is developed in the lighting and communication control between each pole in many researches. For the lighting control, the CEN/TR 13201 standard is the heart of the street lighting system. In the research of C.B. Soh et al. [
14,
15], the intelligent street lighting is designed by using the Arduino Mega Board with ATmega1280 chip to communicate with sensors and control the lighting dimmer. The Xbee module is used to be the wireless communication board between street lighting models. Four different lighting dimming schedules are presented in this research including: economic, intense, balance, and no dimming. The economic schedule can reduce 126 kWh/year/lamp of the street lighting energy consumption. L.T. Doulos et al. [
16] presented that LEDs should be used in the street lighting system due to its low power requirements and low CO
2 emission. The methodology for evaluating a lighting tender is presented to select the most energy efficient equipment and replace the existing luminaires with new LED luminaires. The fluctuation of the indicators depends on the geometric characteristics of each grid. The Installation Lighting Factor (ILF) should be between 0.8 and 1.3 for M classes (National roadways) and The Utilance (U) factor should be more than 50%. L.T. Doulos et al. [
17] present the control system of tunnel lighting systems. The control systems are classified into four scenarios: existing control switching (Scenario A), proposed control switching (Scenario B), LED retrofit 10% step control dimming (Scenario C), and LED retrofit continuous control dimming (Scenario D). The scenario B can save energy 35%. The replacing of existing luminaires with LEDs (Scenario D) energy savings can reach 54%. In Pasolini et al.’s research [
18], the infrastructure architecture and main task are designed for the smart street lighting system. the street lighting system consists of the LEDs lamp control system, communication system, and data center. The light controller (LC) is used to turn on/off and dim the LED lamp. The internet of thing (IOT) is a main part of this research. The power line communication (PLC), narrowband-IoT (NB-IoT), the long-term evolution (LTE), the low-power wide-area network (LPWANs), the long-range (LoRa), and sigfox are discussed about the advantages/disadvantages of each method to find the most suitable method. The overall saving of 80% energy and operations costs. In the research of Wojnicki Igor et al. [
19], Applying dynamic control results in energy savings, which have been verified for both 2004 and 2014 standards. It is far greater for the 2014 one and reaches 40.82%. They can significantly increase energy consumption due to additional lighting requirements for such areas. Thus, decreasing the consumption by the dynamic control becomes more and more important. The research of Wojnicki Igor and Kotulski Leszek [
20] presented the suitability of traffic density and energy detection parameters used in street lighting systems to reduce the cost of installing control systems, data collection, and electricity system. The data collection cost consists of the devices, data transmission, communication hardware, storage and software licensing. Therefore, properly designed working frequency of the traffic density detection system can help to reduce the electricity cost of streetlights and data collection costs. From the above research, all of the street lighting system researches focus on developing the technology, but the power quality and the electrical interference are also the main topic for the efficient street lighting system.
This nano-grid system supplies the electric power to an LED luminaire directly, so there may be some electromagnetic noises caused by the nano-grid system being sent to the LED luminaire. Electromagnetic noises are divided into 3 main frequencies: harmonics (0–2,100 Hz), conducted emission electromagnetic interferences (CE EMI: 150 kHz–30 MHz), and radiated emission electromagnetic interferences (RE EMI: 30 MHz–1 GHz). In general, the harmonics are reduced from the low pass filter circuit within the inverter because it affects the output waveform of the alternating current and it is easy to observe and measure. On the other hand, the electromagnetic interference (EMI) has a high frequency, so it is difficult to measure and needs specific tool to measure the EMI. In the nano-grid road lighting system, the conducted emission (CE) is a great importance interference because the nano-grid system is connected to the LED luminaire and the grid system directly. The CE from the nano grid can result in LED luminaire control system malfunction, shorten LED luminaire life, and grid relay malfunction. To prevent this problem, CE characteristics must be studied and analyzed in form and cause of the signal to design and apply appropriate CE attenuation methods. The CE is divided into two modes according to the current flow of signals; a common mode (CM) and a differential mode (DM) [
21].
The use of the nano-grid system as an electricity generation system requires to consider the CE caused by the nano-grid system. the CE will affect various electrical devices connected to the nano-grid system. The study of CE characteristics is very important. It can be used to consider appropriate CE attenuation methods. The research of Hirofumi Akagi et al. [
22] explains that EMI is divided into two forms according to the frequency range: conducted range and radiated range. Regarding the electrical system, the CE from a device, which is connected to the system through the conductor, is a major disturbance to the system. Hirofumi Akagi et al. investigated the CE of an inverter-driven motor, rated at 400 V and 15 kW, theoretically and experimentally. The CE could interfere with other electronic equipment through power lines, while the radiated emission could cause malfunctions, particularly to radio-controlled devices in the vicinity of the noise source. In the research of Di Han et al. [
23,
24], the comparison between output CM chokes for SiC drive operating at 20 kHz–200 kHz switching frequencies is present. Both 20 kHz and 200 kHz CM chokes are used to reduce the CE in variable speed drives (VSDs) and each frequency CM choke is varying a CM inductance (L
CM) included 2 mH, 10 mH, and 50 mH. Higher impedance CM inductor is needed to attenuate the noise at an increased switching frequency. The present research focuses on the CE characteristics from the nano-grid system in each duration. In the literature, several concepts have been studied the CE characteristics in the other systems and there is no analysis in each working period. Therefore, it is not conclusive for the CE characteristics from the nano-grid system which is difficult to design and implement the CE attenuation technique. In the present work, a grid-connected system and a stand-alone system of the nano-grid system were studied in terms of CE including CM and DM characteristics in order to design and apply the appropriate CE attenuation methods in the future.
In this research, the CE characteristics of the nano-grid system will be presented. This research focuses on the CE comparison from the grid-connected micro-inverter and the stand-alone micro-inverter in the nano-grid system of the road lighting system. The measurement results were collected in 3 forms: total CE, CM, and DM. The total CE is compared with the CISPR 14-1 standard [
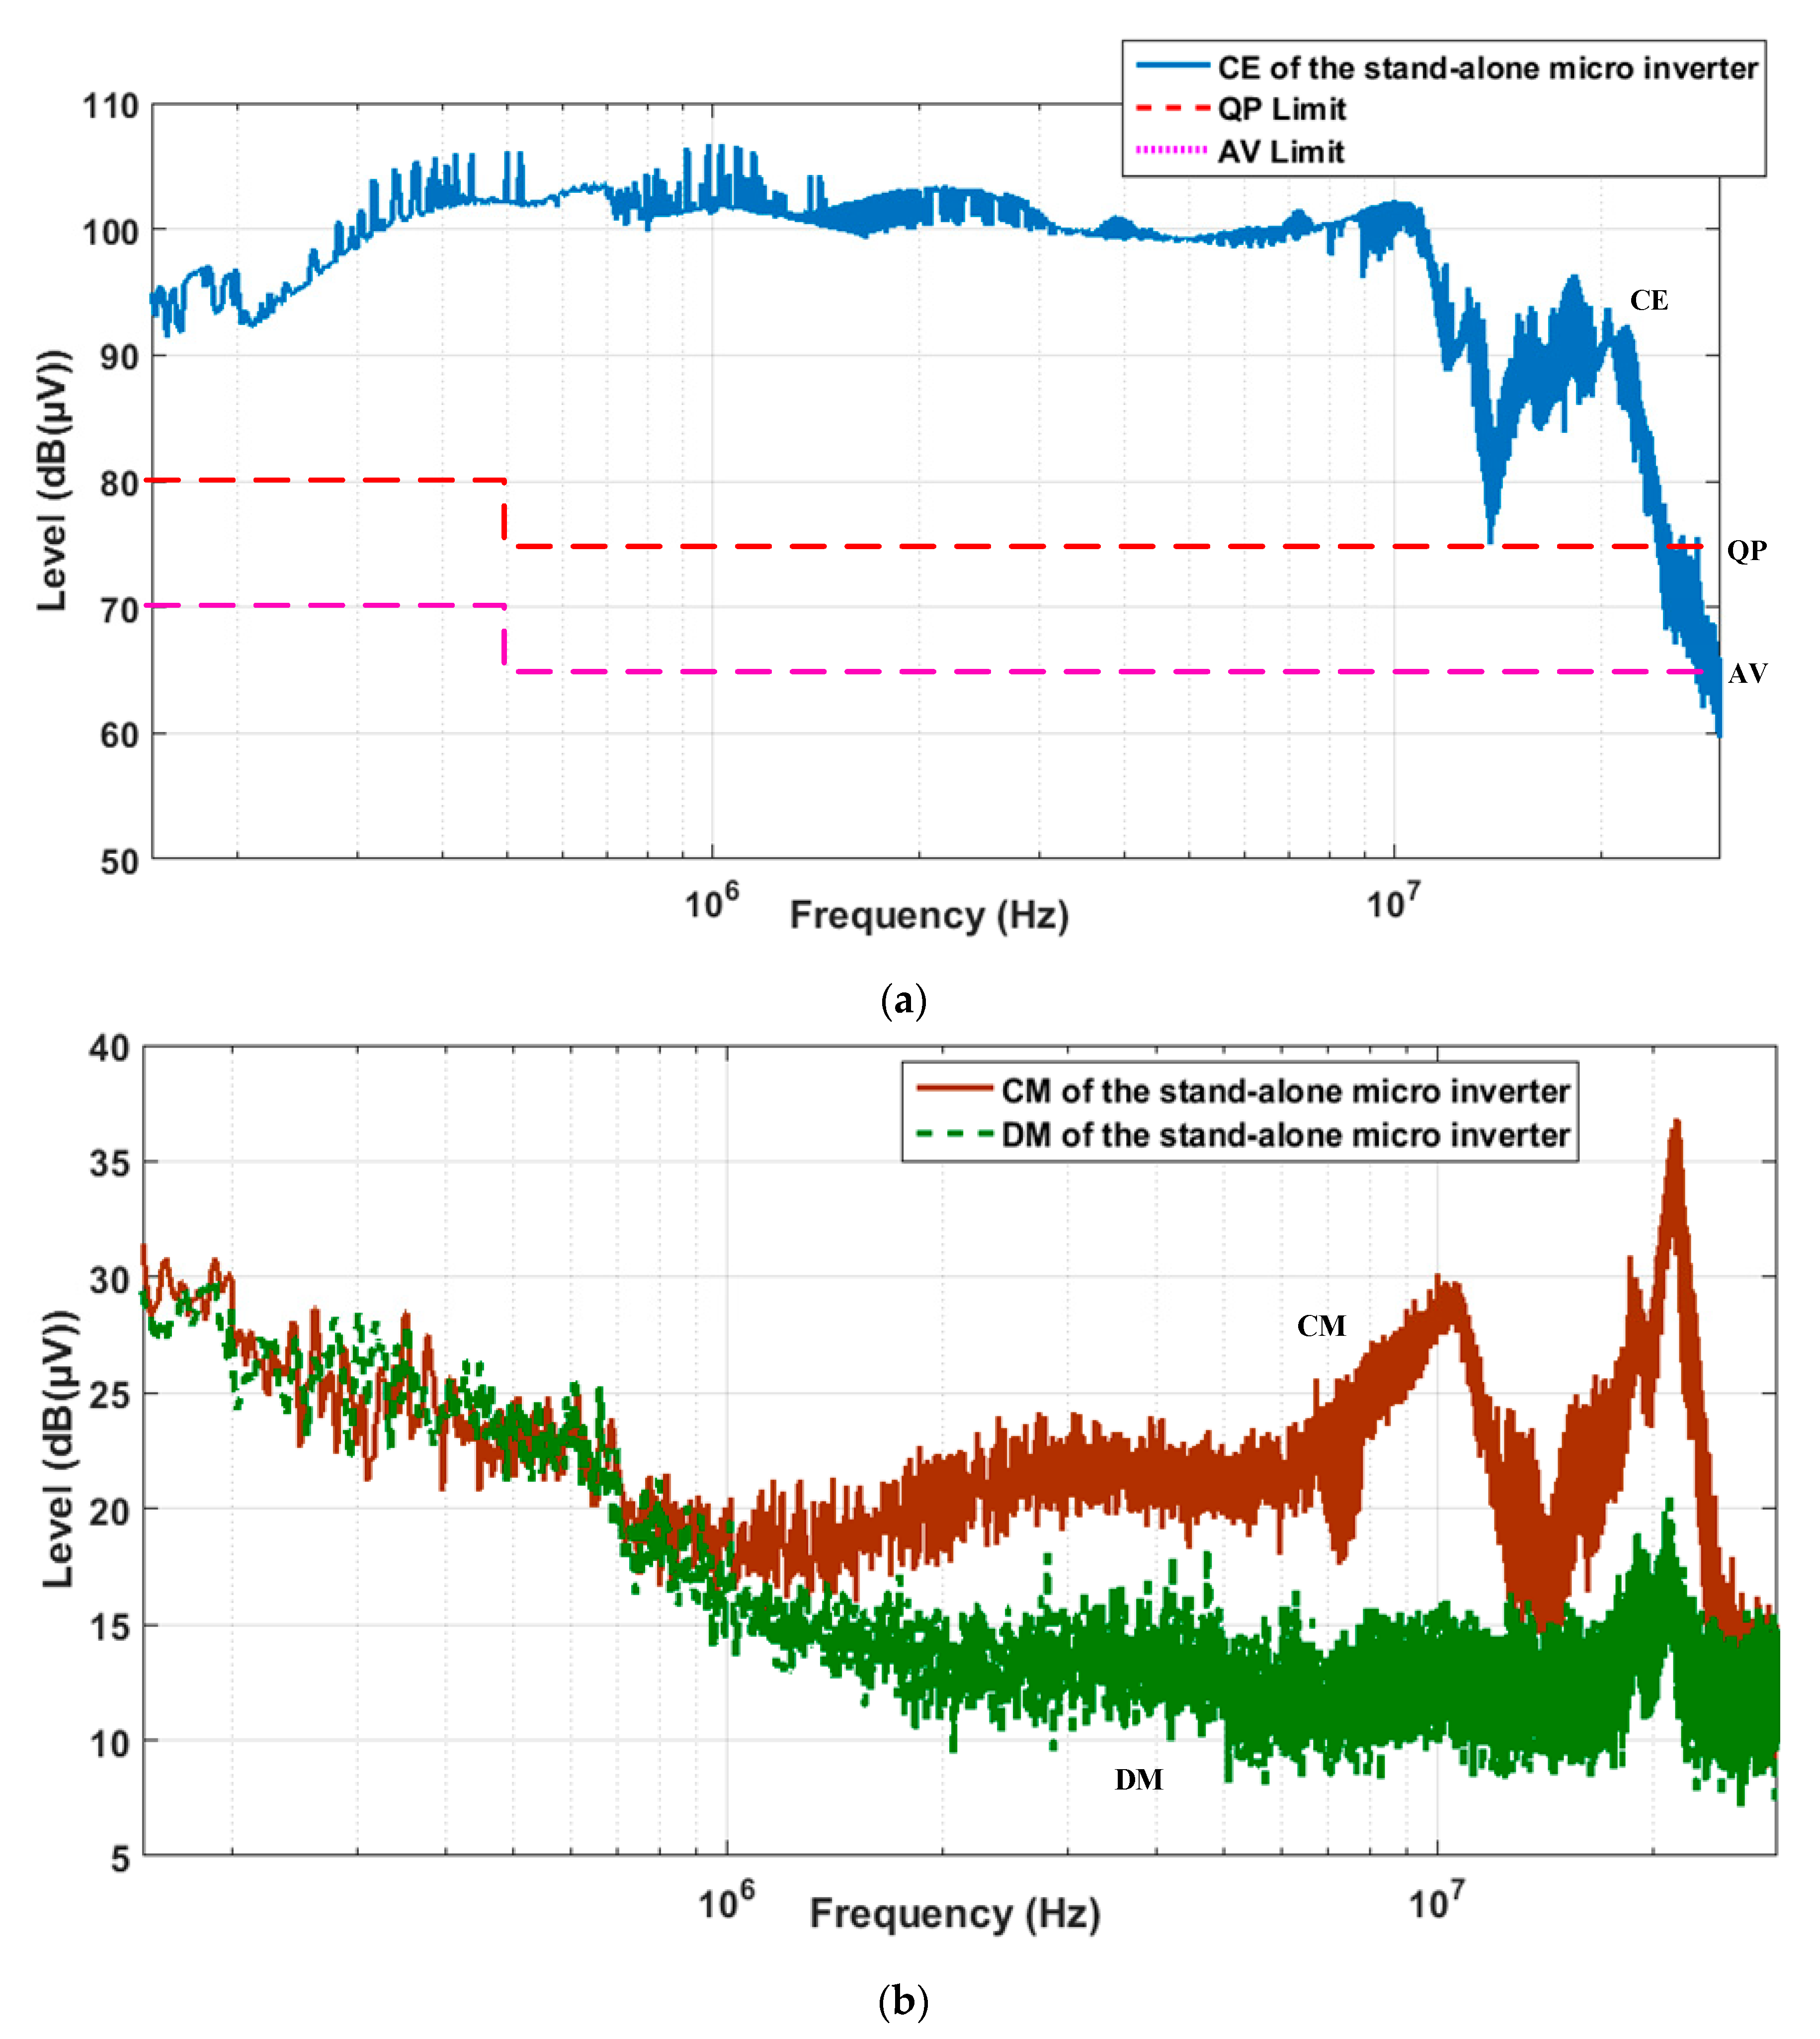
14] and compared between the grid-connected system and the stand-alone system. The result is found that the total CE in the stand-alone system is higher than the grid-connected system in the high-frequency range that may result in more radiated interference. In the CM and DM measurement, the CM and DM affect the CE directly, but in the stand-alone system the CM is higher than the DM considerably. In the road lighting system, LED luminaire is used to be a load of the system. The CE from the nano-grid system will affect the LED luminaire directly. In the result, the CE of the nano-grid system exceeds the CISPR 14-1 standard [
21]. In the daytime, the CE of the grid-connected system will affect the LED luminaire and the CE of the stand-alone system will affect the LED luminaire in the nighttime. Therefore, in future the CE attenuation should be applied to this system along the day, especially during the nighttime which has the highest CE level.
This paper is organized into five sections as follows. The nano-grid system is simulated into the laboratory experimental setup and the CE measurement method will be explained in
Section 2. In
Section 3, results of CE from the grid-connected micro-inverter and the stand-alone micro-inverter will be presented and separated into CM and DM. Finally, the conclusion will be presented in
Section 4.
2. Experimental Setup and Testing Methods
2.1. The Road Lighting System
Mainstreaming Energy Efficiency in Thai Municipalities presents the pilot project to improve energy consumption and lighting quality of roadway lighting in Thailand [
25]. In this plan, the conventional road lighting systems are carried out to replace 250-watt HPS luminaires with 120-watt LED luminaires due to HPS luminaires providing poor average illuminance and uniformity values, and they being lower than the standard, as the conventional lighting systems were installed and used for a long time, leading to deterioration of the luminaire and lamp efficiency, hence decreased lighting quality. Papers [
26] present a positive effect on LED luminaire installation, which can improve lighting quality and energy efficiency of road lighting in Thailand.
Thailand is located near the equator which has high sunlight irradiance and the sunlight throughout the year, so the solar power generation is the most suitable. It is found that solar power potential in Thailand is 17–20 MJ/m
2 per day or with an average of 1000 W/m
2 for roughly 5 h per day [
27]. For this reason, the integration of solar systems into road lighting systems is presented in terms of overall performance, charge controller, life cycle assessment, environmental impact, and economic feasibility [
27,
28,
29]. However, paper [
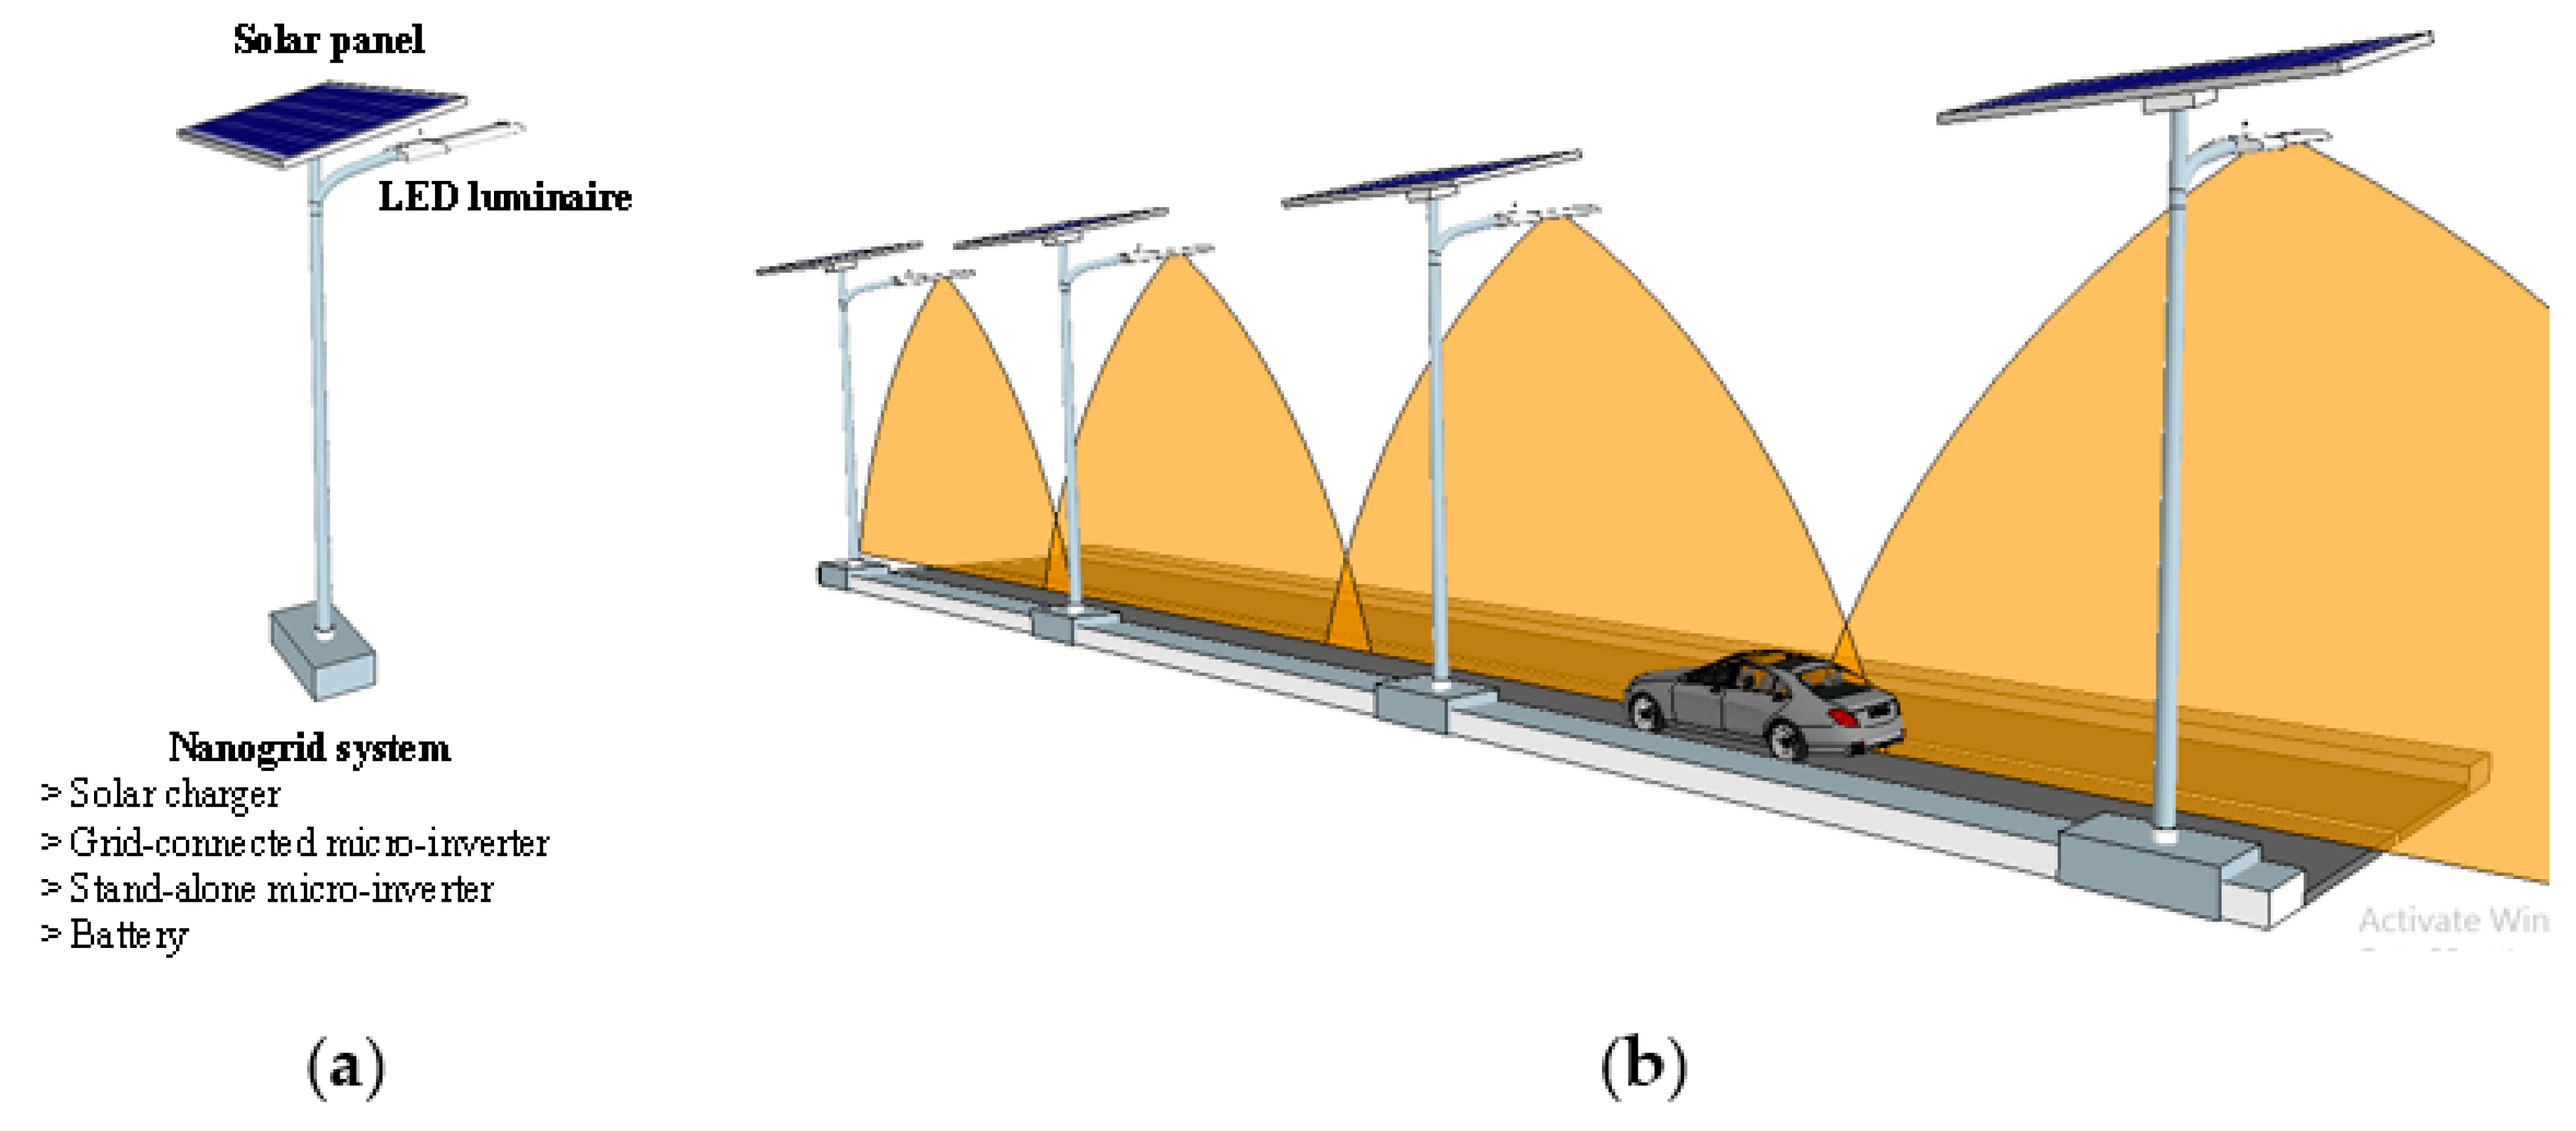
29] showed that using stand-alone solar road lighting systems causes high initial installation costs from energy storage system. As a result, a nano-grid road lighting system which is a road lighting system that uses a solar system to generate electrical energy, enabling operation in a stand-alone mode and a grid connection mode is presented in order to provide outstanding of using solar energy for road lighting systems as shown in
Figure 1.
2.2. The Nano-Grid System of the Road Lighting System
The concept of a nano-grid road lighting system is a road lighting system that uses solar energy to produce electrical power, enabling operation in a stand-alone mode and a grid connection mode. During the day, the system generates electricity from the solar energy installed on the top of light poles and then stores it in batteries. If the energy produced from solar energy exceeds consumption or the batteries are full, the surplus energy is sent to the electrical grid. During the night, the system draws the electricity from the batteries to supply the road lighting systems. However, when the solar power is low due to rainy or cloudy days, there is not enough electricity to supply the road lighting systems. Thus, the electricity from the electrical grid is used to supply the road lighting system. It is found that the nano-grid road lighting system does not need to install a number of batteries and solar panels, resulting in high flexibility and low cost of installation.
The main road lighting system in Thailand that has a moderate traffic volume (M2) is utilized in the study case. In this category, 120-watt LED luminaires are used, which are installed by staggered arrangements. The mounting height, overhang, and spacing between luminaires are determined to be 9, 1, and 36 m, respectively. In addition, the boom angle is 15°. Due to Thailand being located near the equator, this location receives high solar irradiance owing to high solar generation performance with an average of 1000 W/m2 for roughly 5 h per day. The road lighting systems need to cover lighting for 12 hours per day, leading to a load lighting system consuming energy of 1400 Wh for using a 120-watt LED luminaire. For this reason, a solar power of 300 W is enough for a road lighting system.
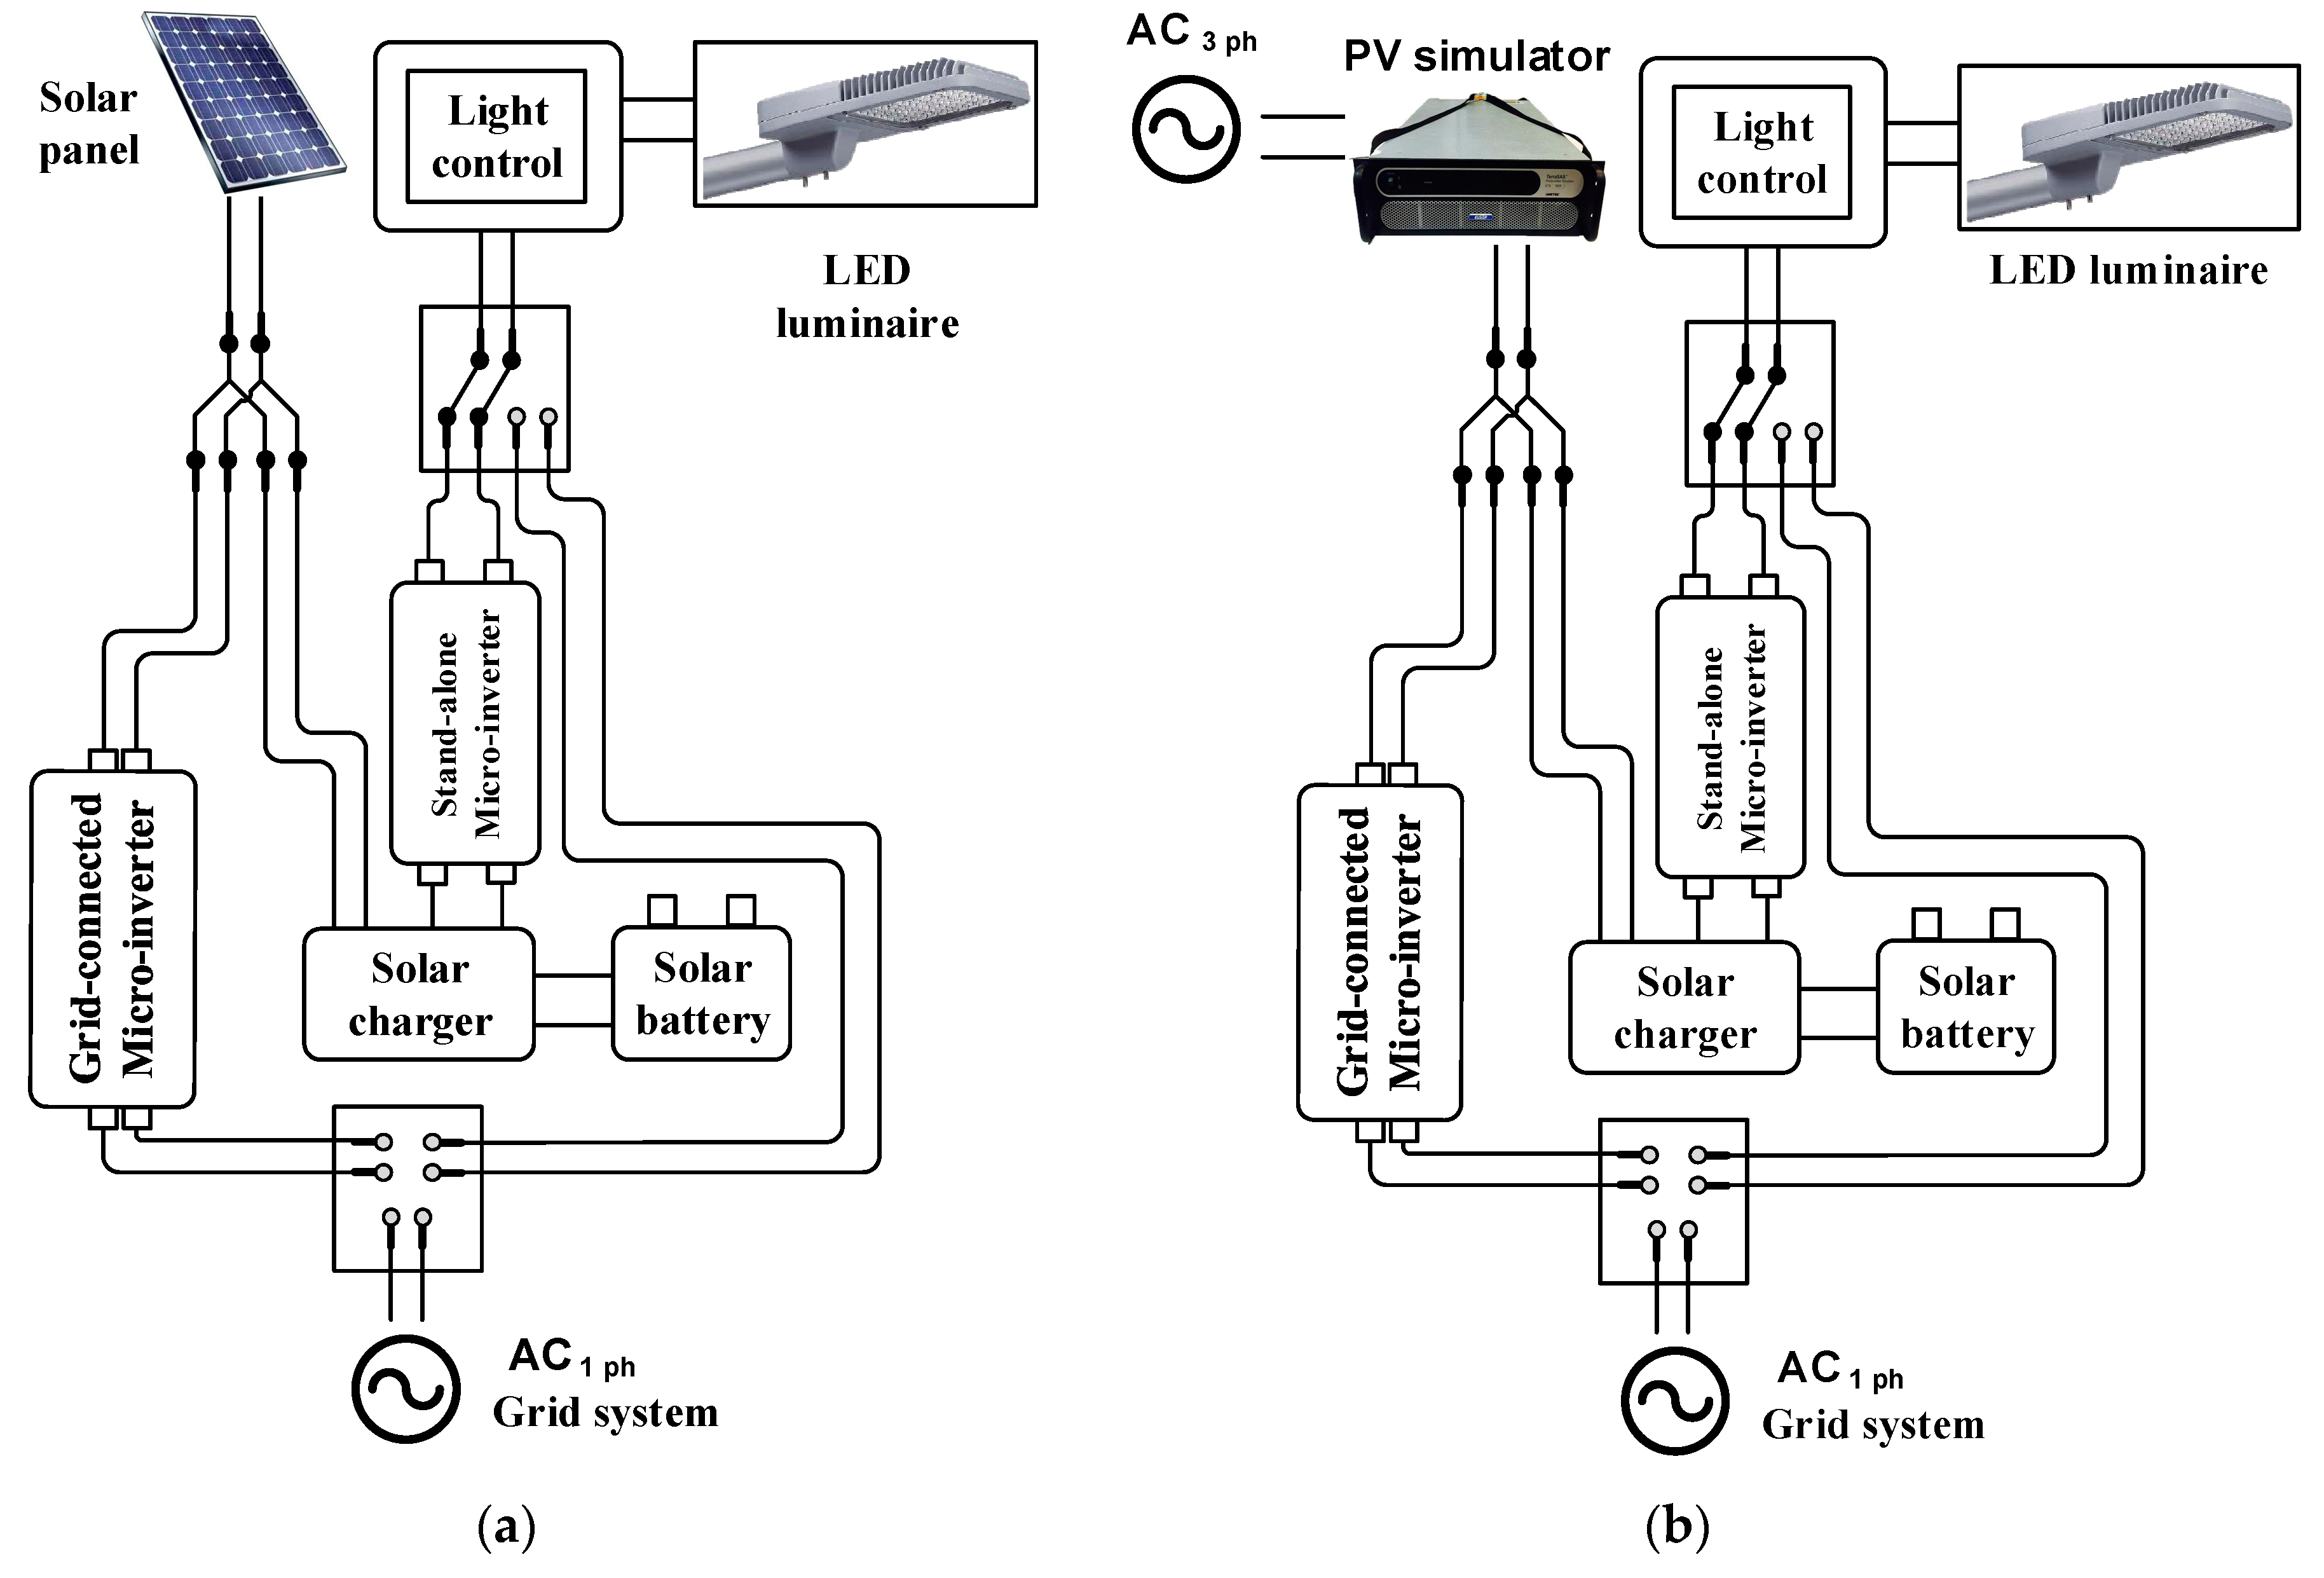
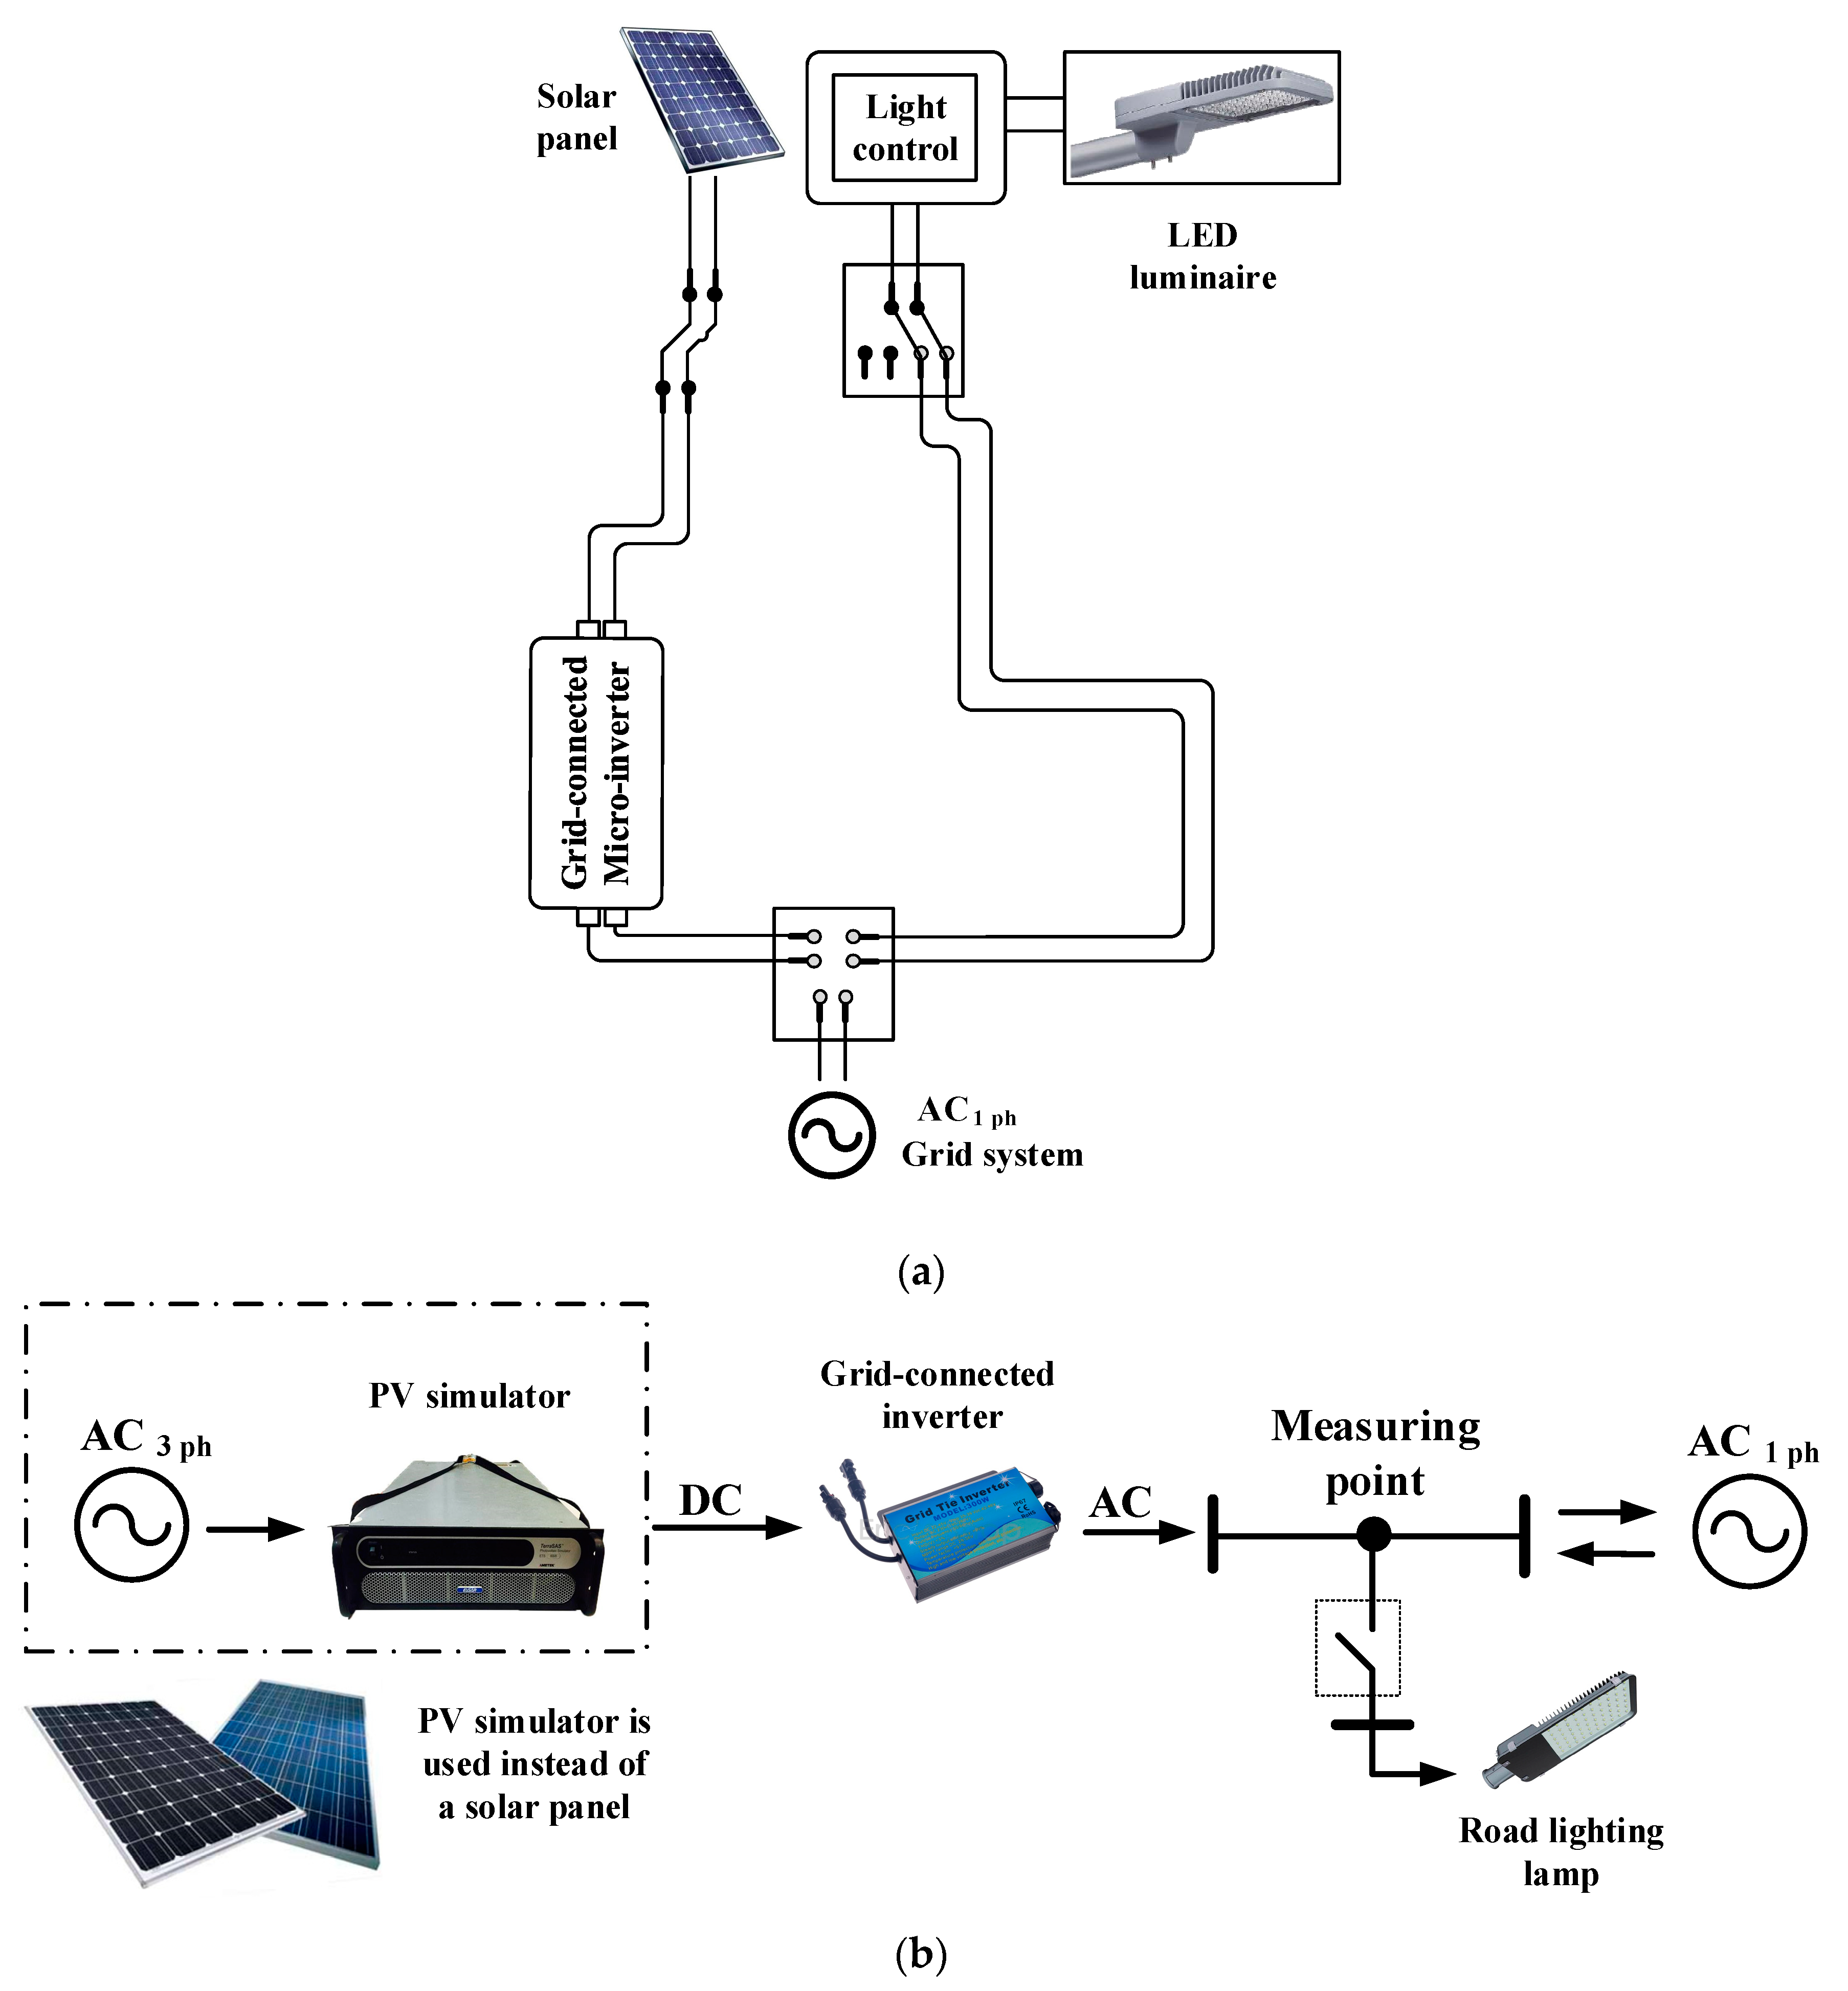
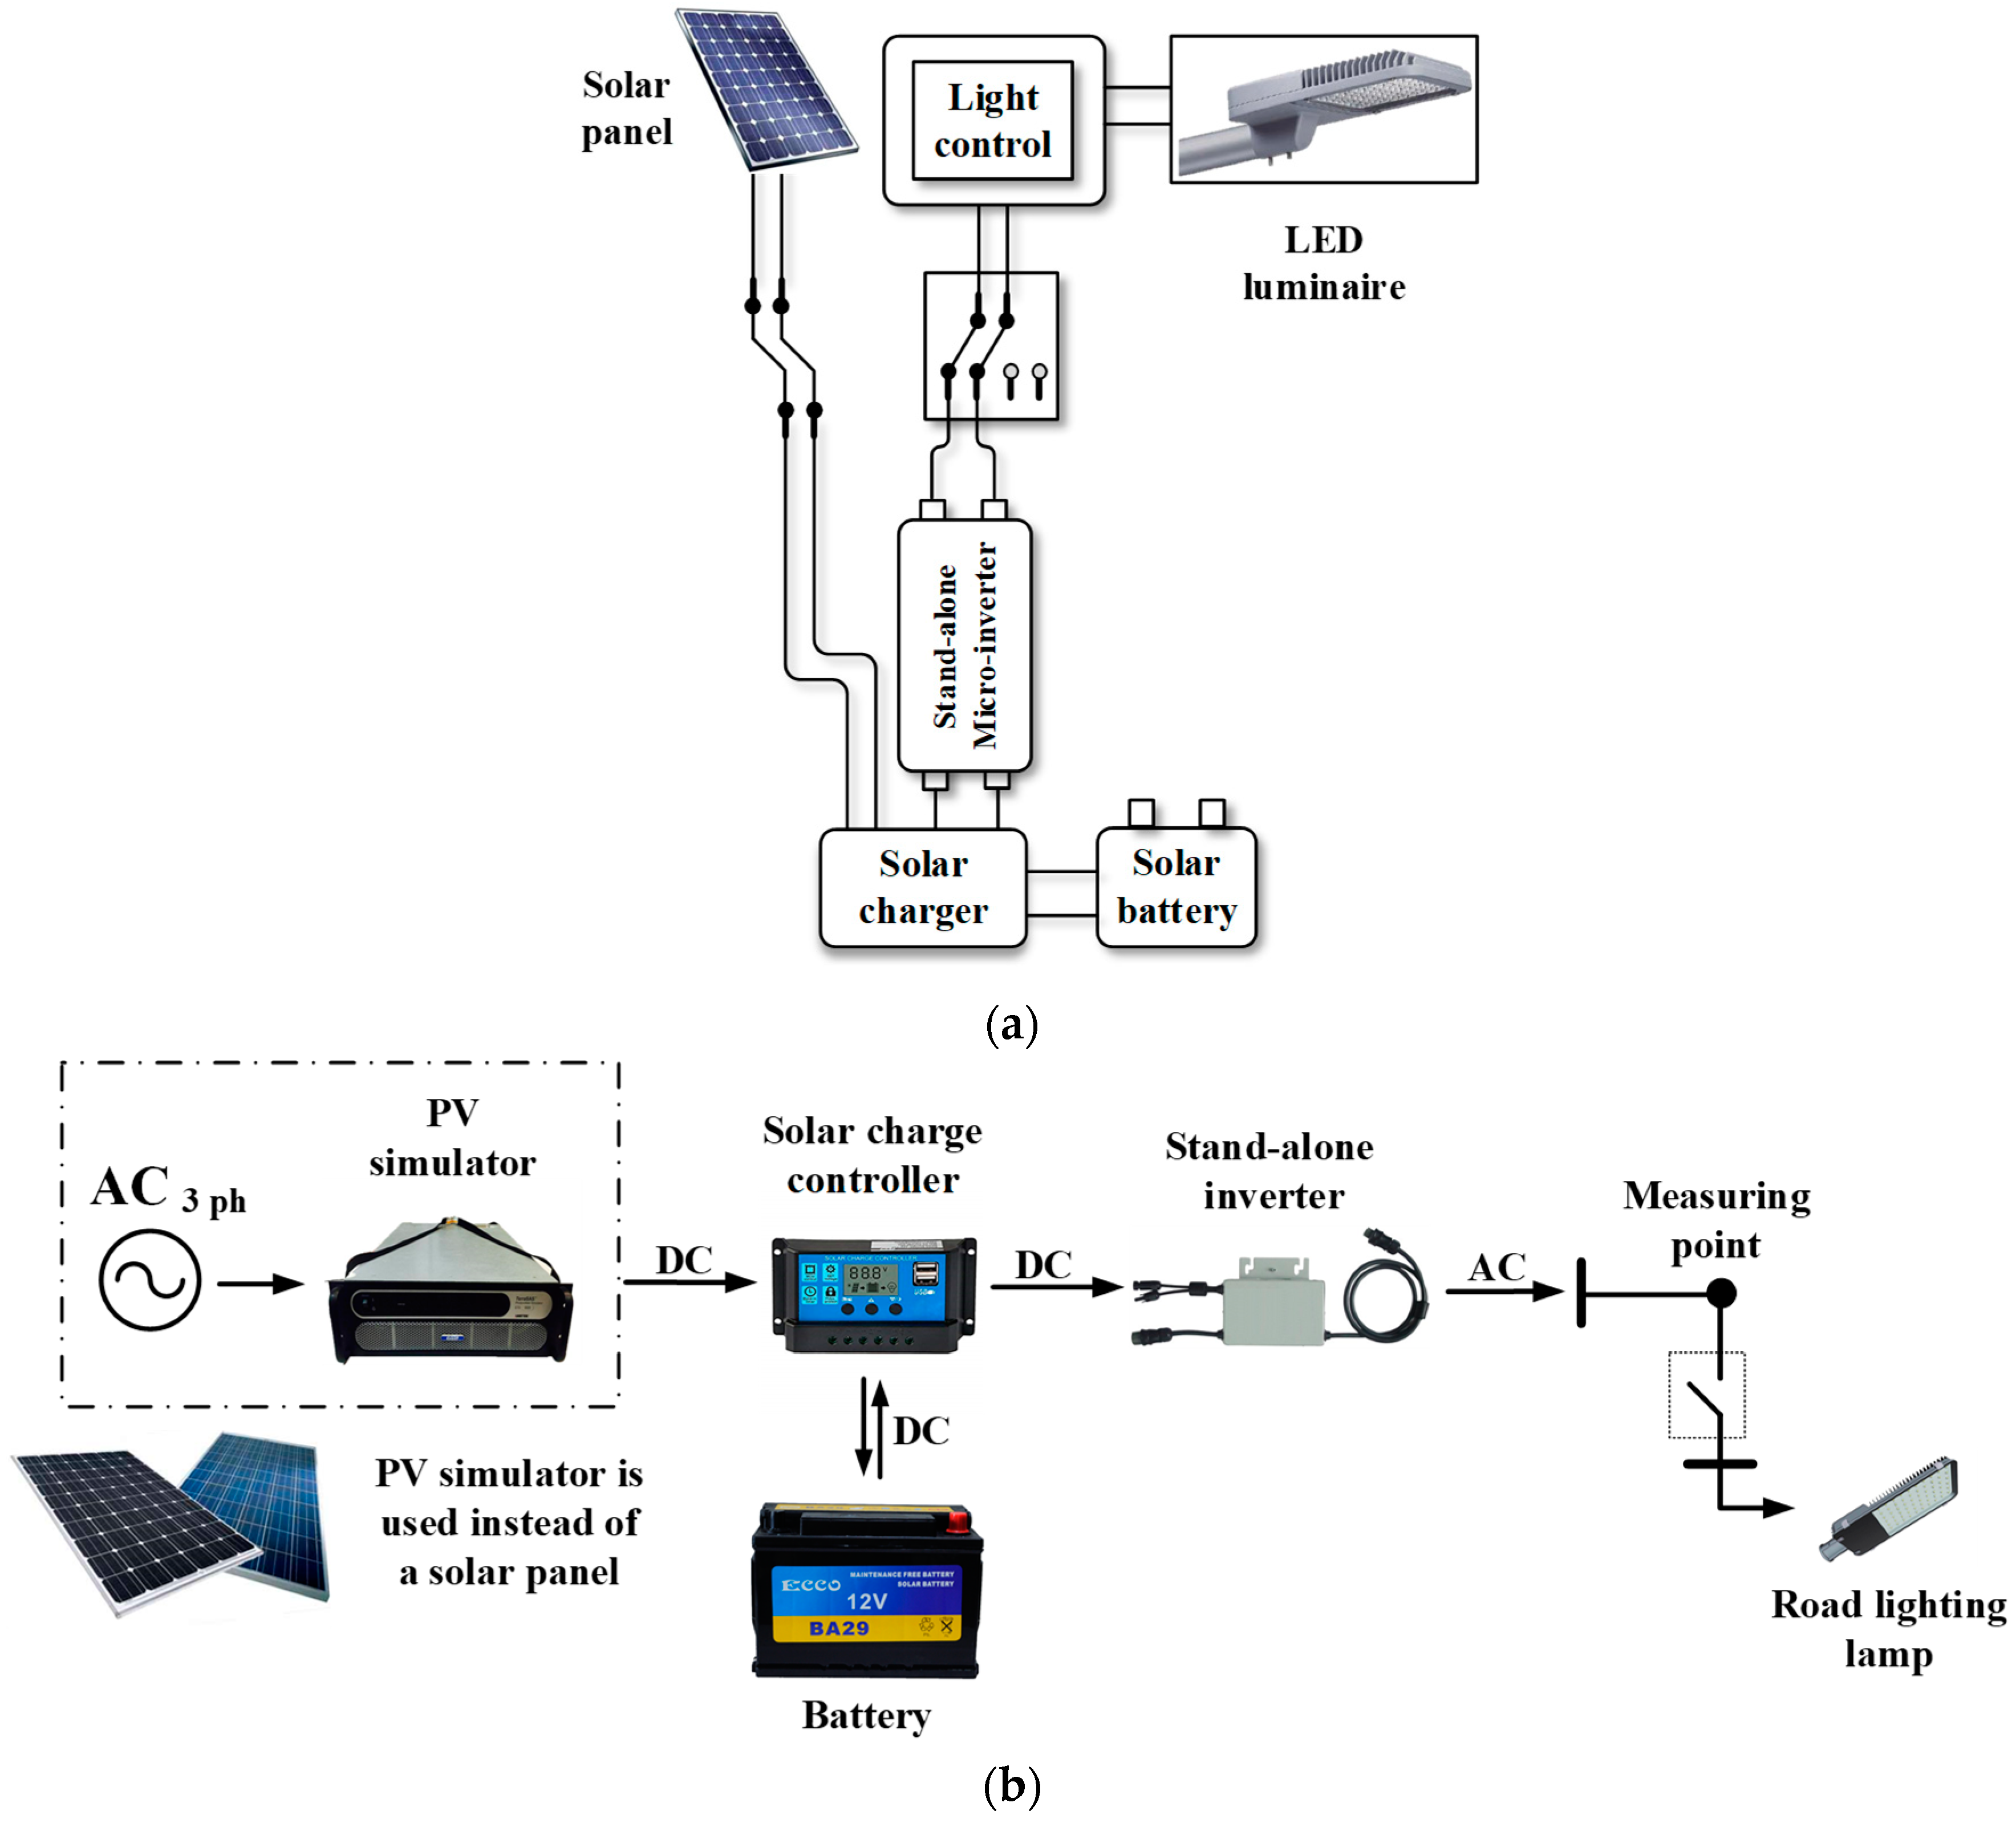
This nano-grid system of the road lighting system in the study case is divided into two sub-systems; a grid-connected system and a stand-alone system. Considering the
Figure 2, a 300 W solar panel generates the direct current power from sunshine and send it to the grid-connected system and the stand-alone system. In the grid-connected system, a grid-connected micro-inverter is employed to convert the direct current into an alternating current power and sends the power to a grid system or a road lighting system. On the other hand, the stand-alone system uses a stand-alone micro-inverter to convert the power, and then sends it to the road lighting system only. Both the grid-connected system and the stand-alone system are intended to supply power to the road lighting system.
This nano-grid system in
Figure 2a is modelled by using an experimental setup, but the test is operated in the shielded room and takes long time, so it is difficult to use the solar panel. A Photovoltaic (PV) simulator is used instead of the solar panel because it can supply the electric power as a solar panel and control voltage, current, irradiance, and temperature of the solar panel all day as shown is
Figure 2b. In this research, the PV simulator is used to supply the 28.8 V 300 W direct current power and makes irradiance and temperature of the solar panel constant during the test.
2.3. The CE Measuring Method and the CISPR 14-1 Standard
Generally, when the electric power is suppled to a load, noises from the power source would also be sent to the load. This nano-grid system is a solar power generation system, so it must use an inverter, which is a switching device, to convert the electric power and cause of electromagnetic interference (EMI). The EMI is a harmful noise in sensitive electrical/electronic systems. The EMI can be divided into two types according to the frequency range; a conducted EMI (0.15 MHz–30 MHz) and a radiated EMI (30 MHz–1000 MHz). For the conducted EMI, conducted emission (CE) is popularly considered in several research [
21,
22,
23,
24]. The CE is a spreading out noise signal from the interested device which may affect to the other equipment. Impacts of CE are LED luminaire interference, electrical protection system interference, and nano-grid system interference. Therefore, the study of the CE characteristics is very important.
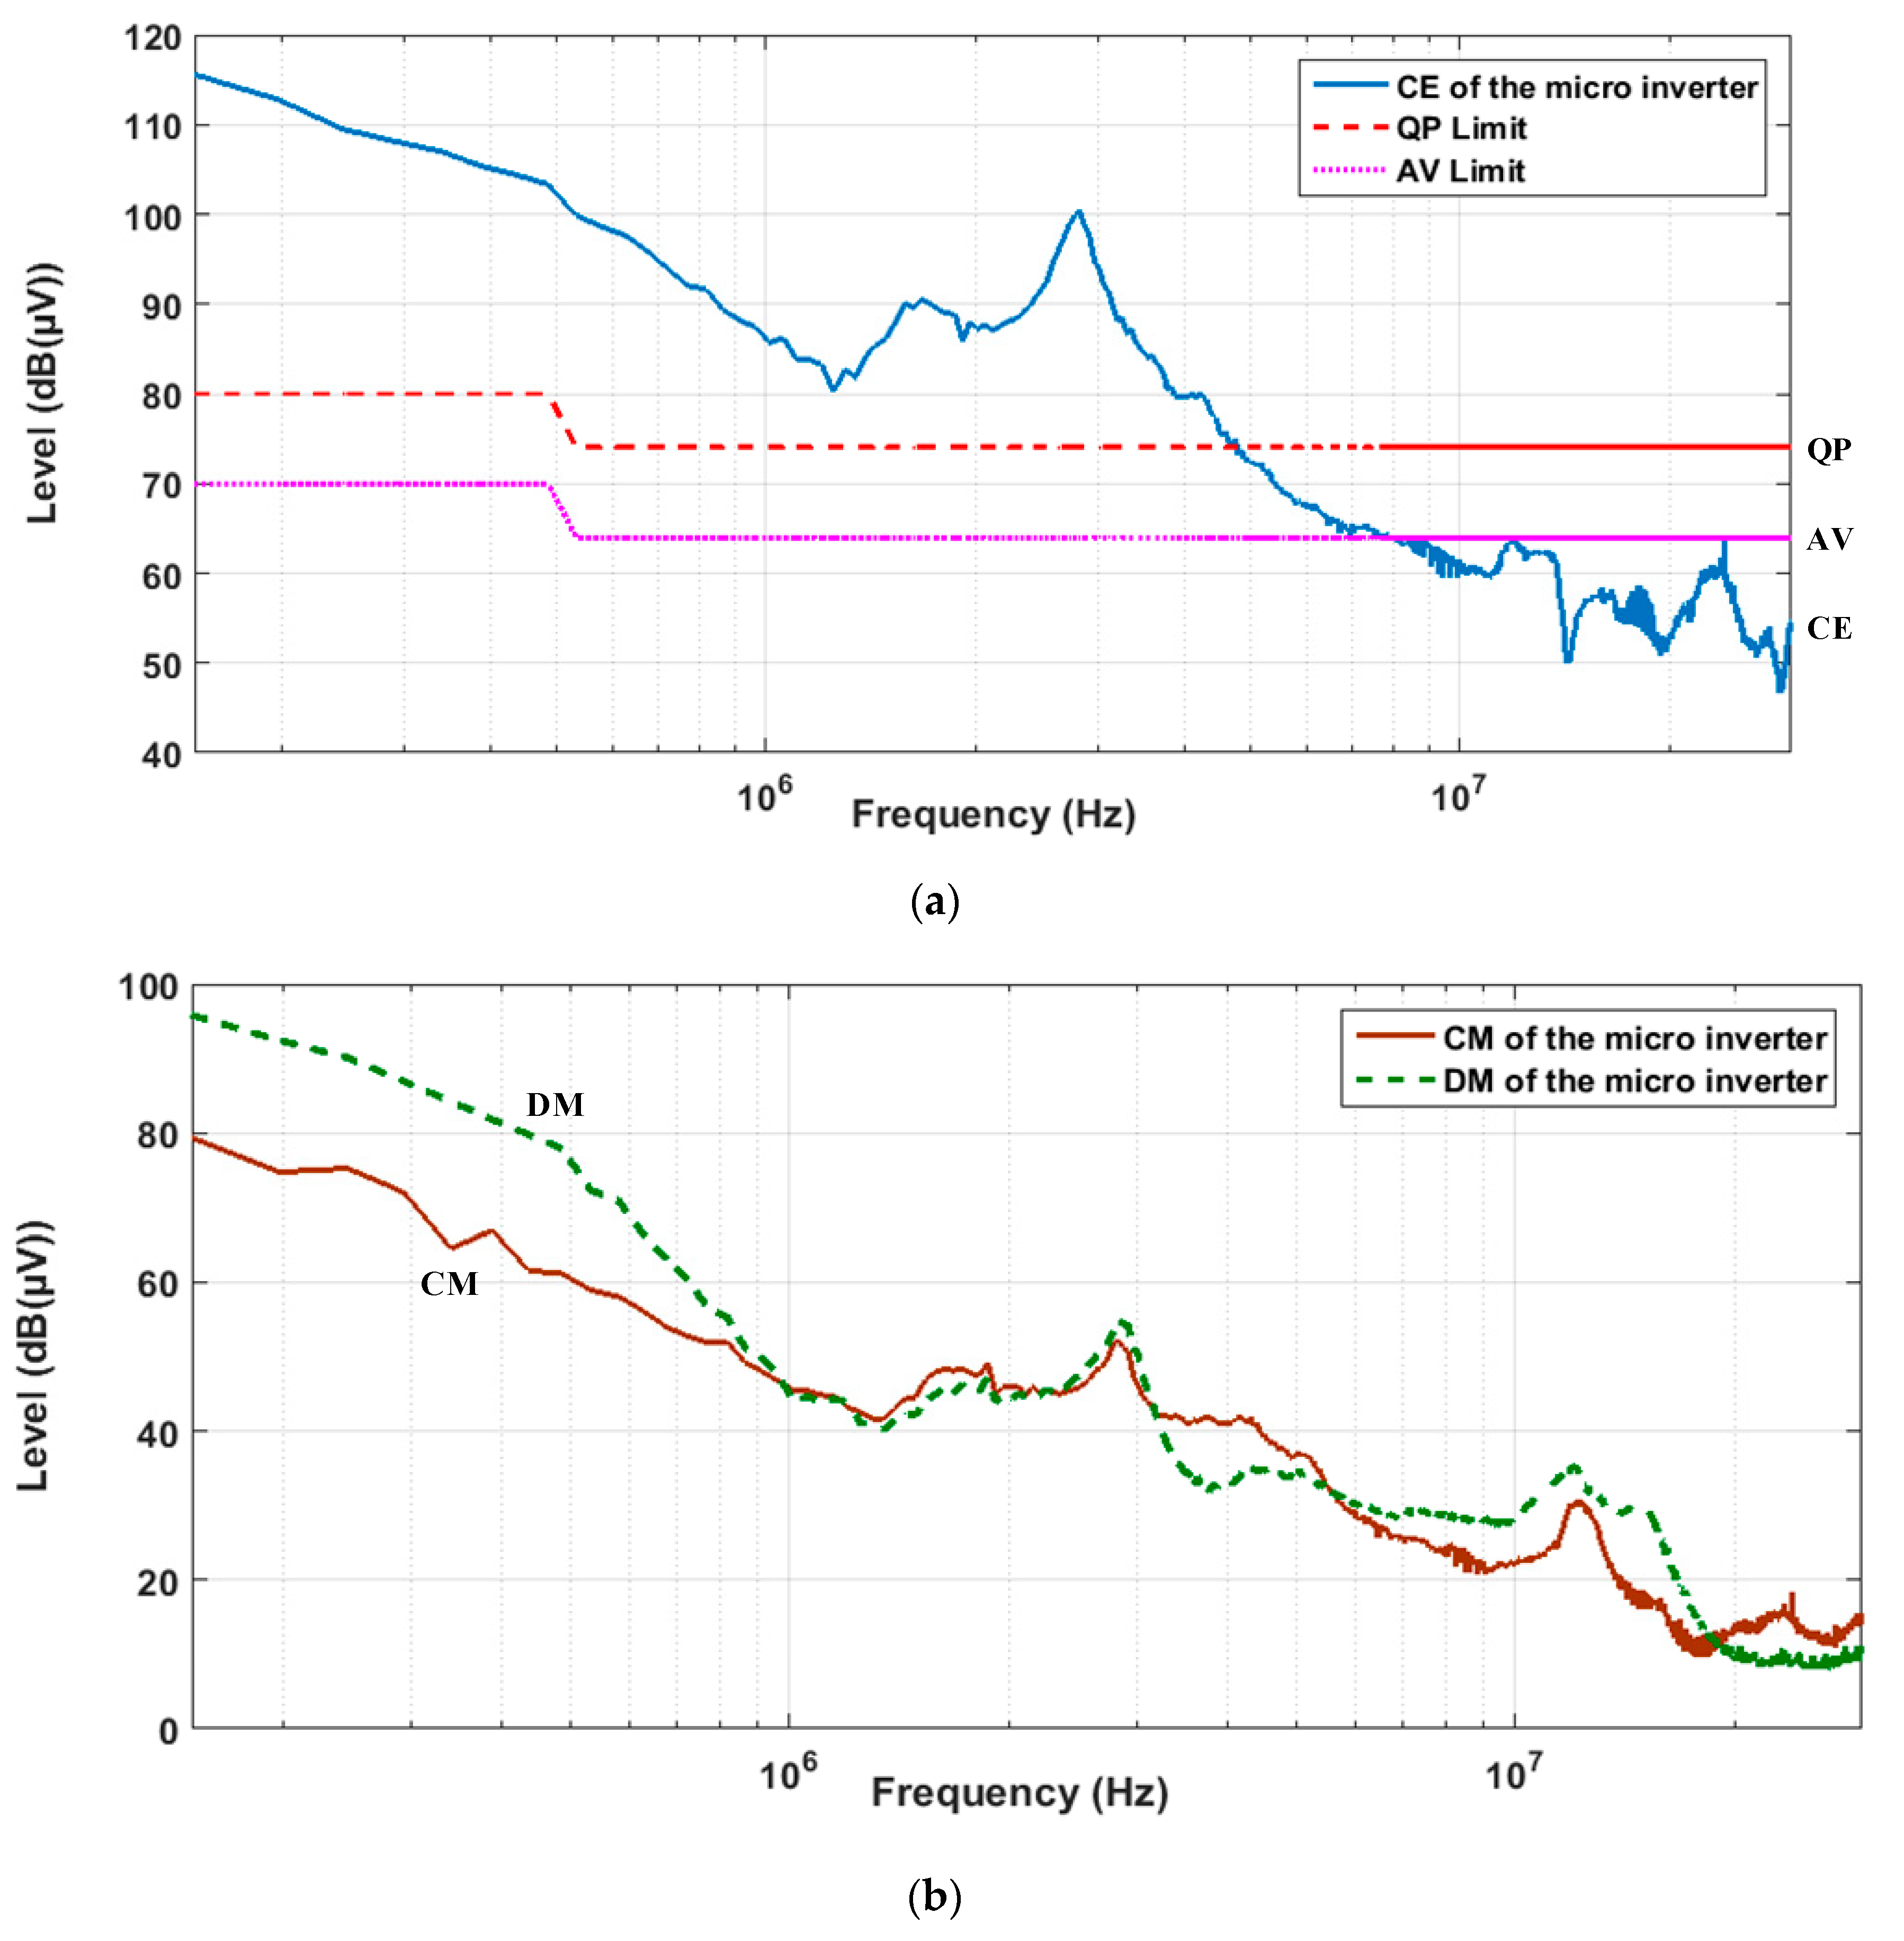
This research focuses on the CE characteristics of the grid-connected micro-inverter and the stand-alone micro-inverter because both micro-inverters have switching device components which are the cause of the CE. The study of the characteristics and origin of CE will make CE attenuation easier and more efficient in future. This CE test is compared with the CISPR 14-1 standard [
21] as shown in
Table 1, which is the requirement for household appliances, electric tools and similar apparatus (Part 1: Emission). The CISPR 14-1 consists of a quasi-peak limit and an average limit. The CE must be lower than the quasi-peak limit, it will be considered to pass the CISPR 14-1 standard [
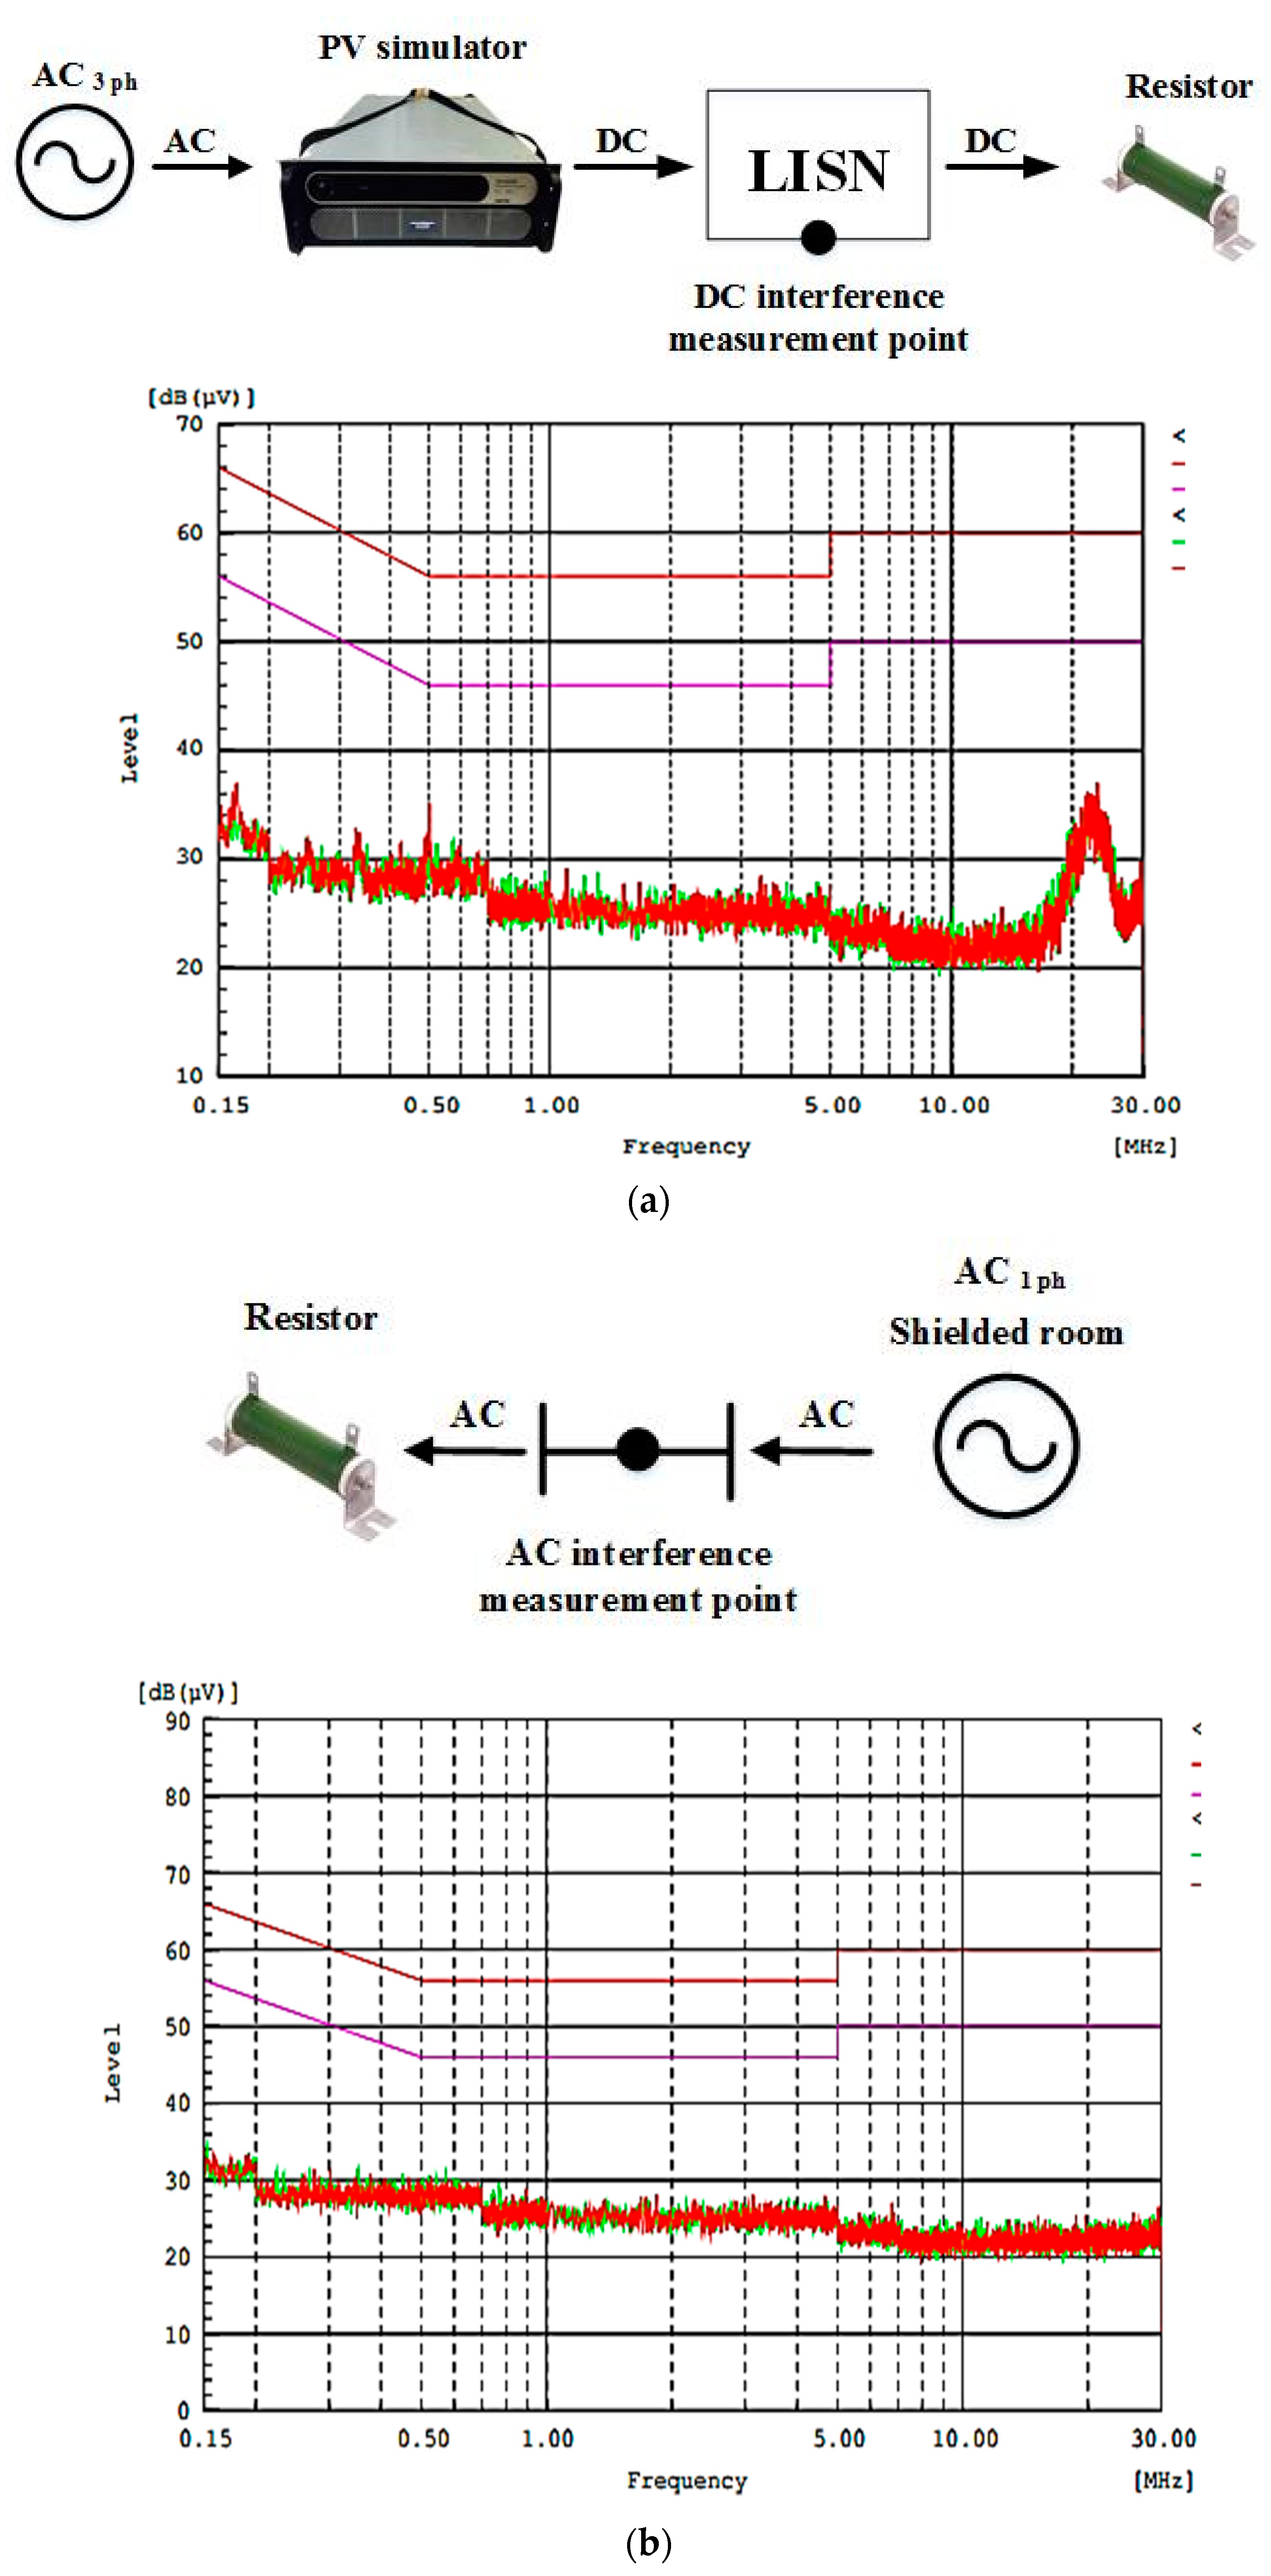
21]. To make the test results meet the standards, the electrical systems of the shielded-room and other devices are tested on the effects that will have on the nano-grid system.
Figure 3 shows that the CE of the PV simulator and the shielded-room electrical grids have a low level and do not affect the nano-grid system.
The CE can be separated into two modes: a common mode (CM) and a differential mode (DM). The CM is an interference signal which appears on the two signal lines simultaneously in the same direction and phase. The signal on each line returns through a common ground. On the other hand, the DM is a signal that appears on two lines of a closed loop, but current flow is in opposite directions. CM and DM may have different characteristics, but both directly affect the CE. Therefore, the CE attenuation requires consideration of CM and DM signal characteristics.
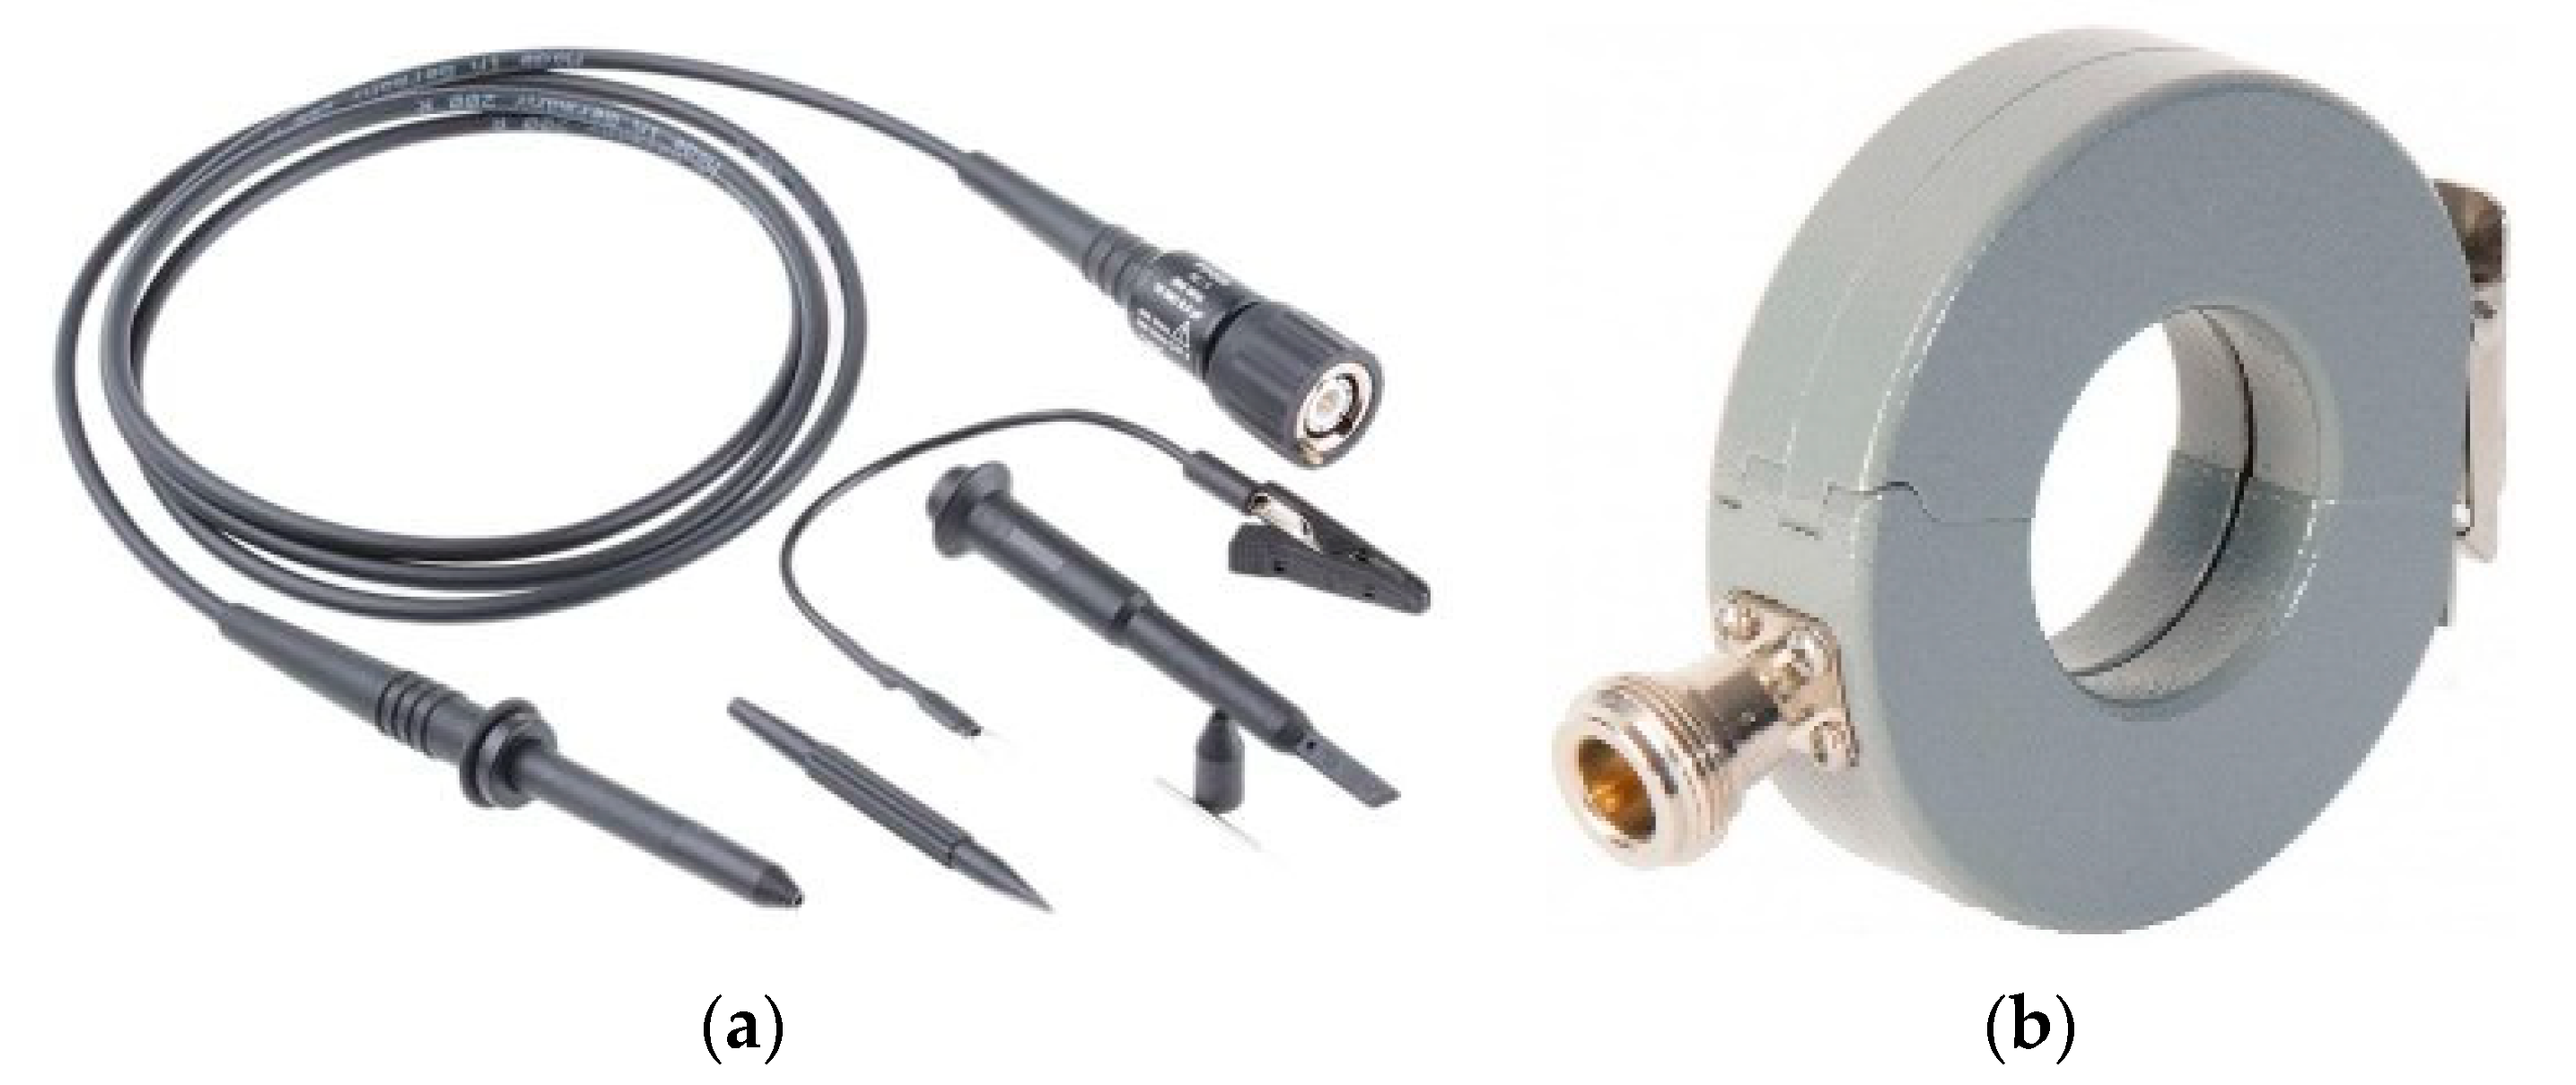
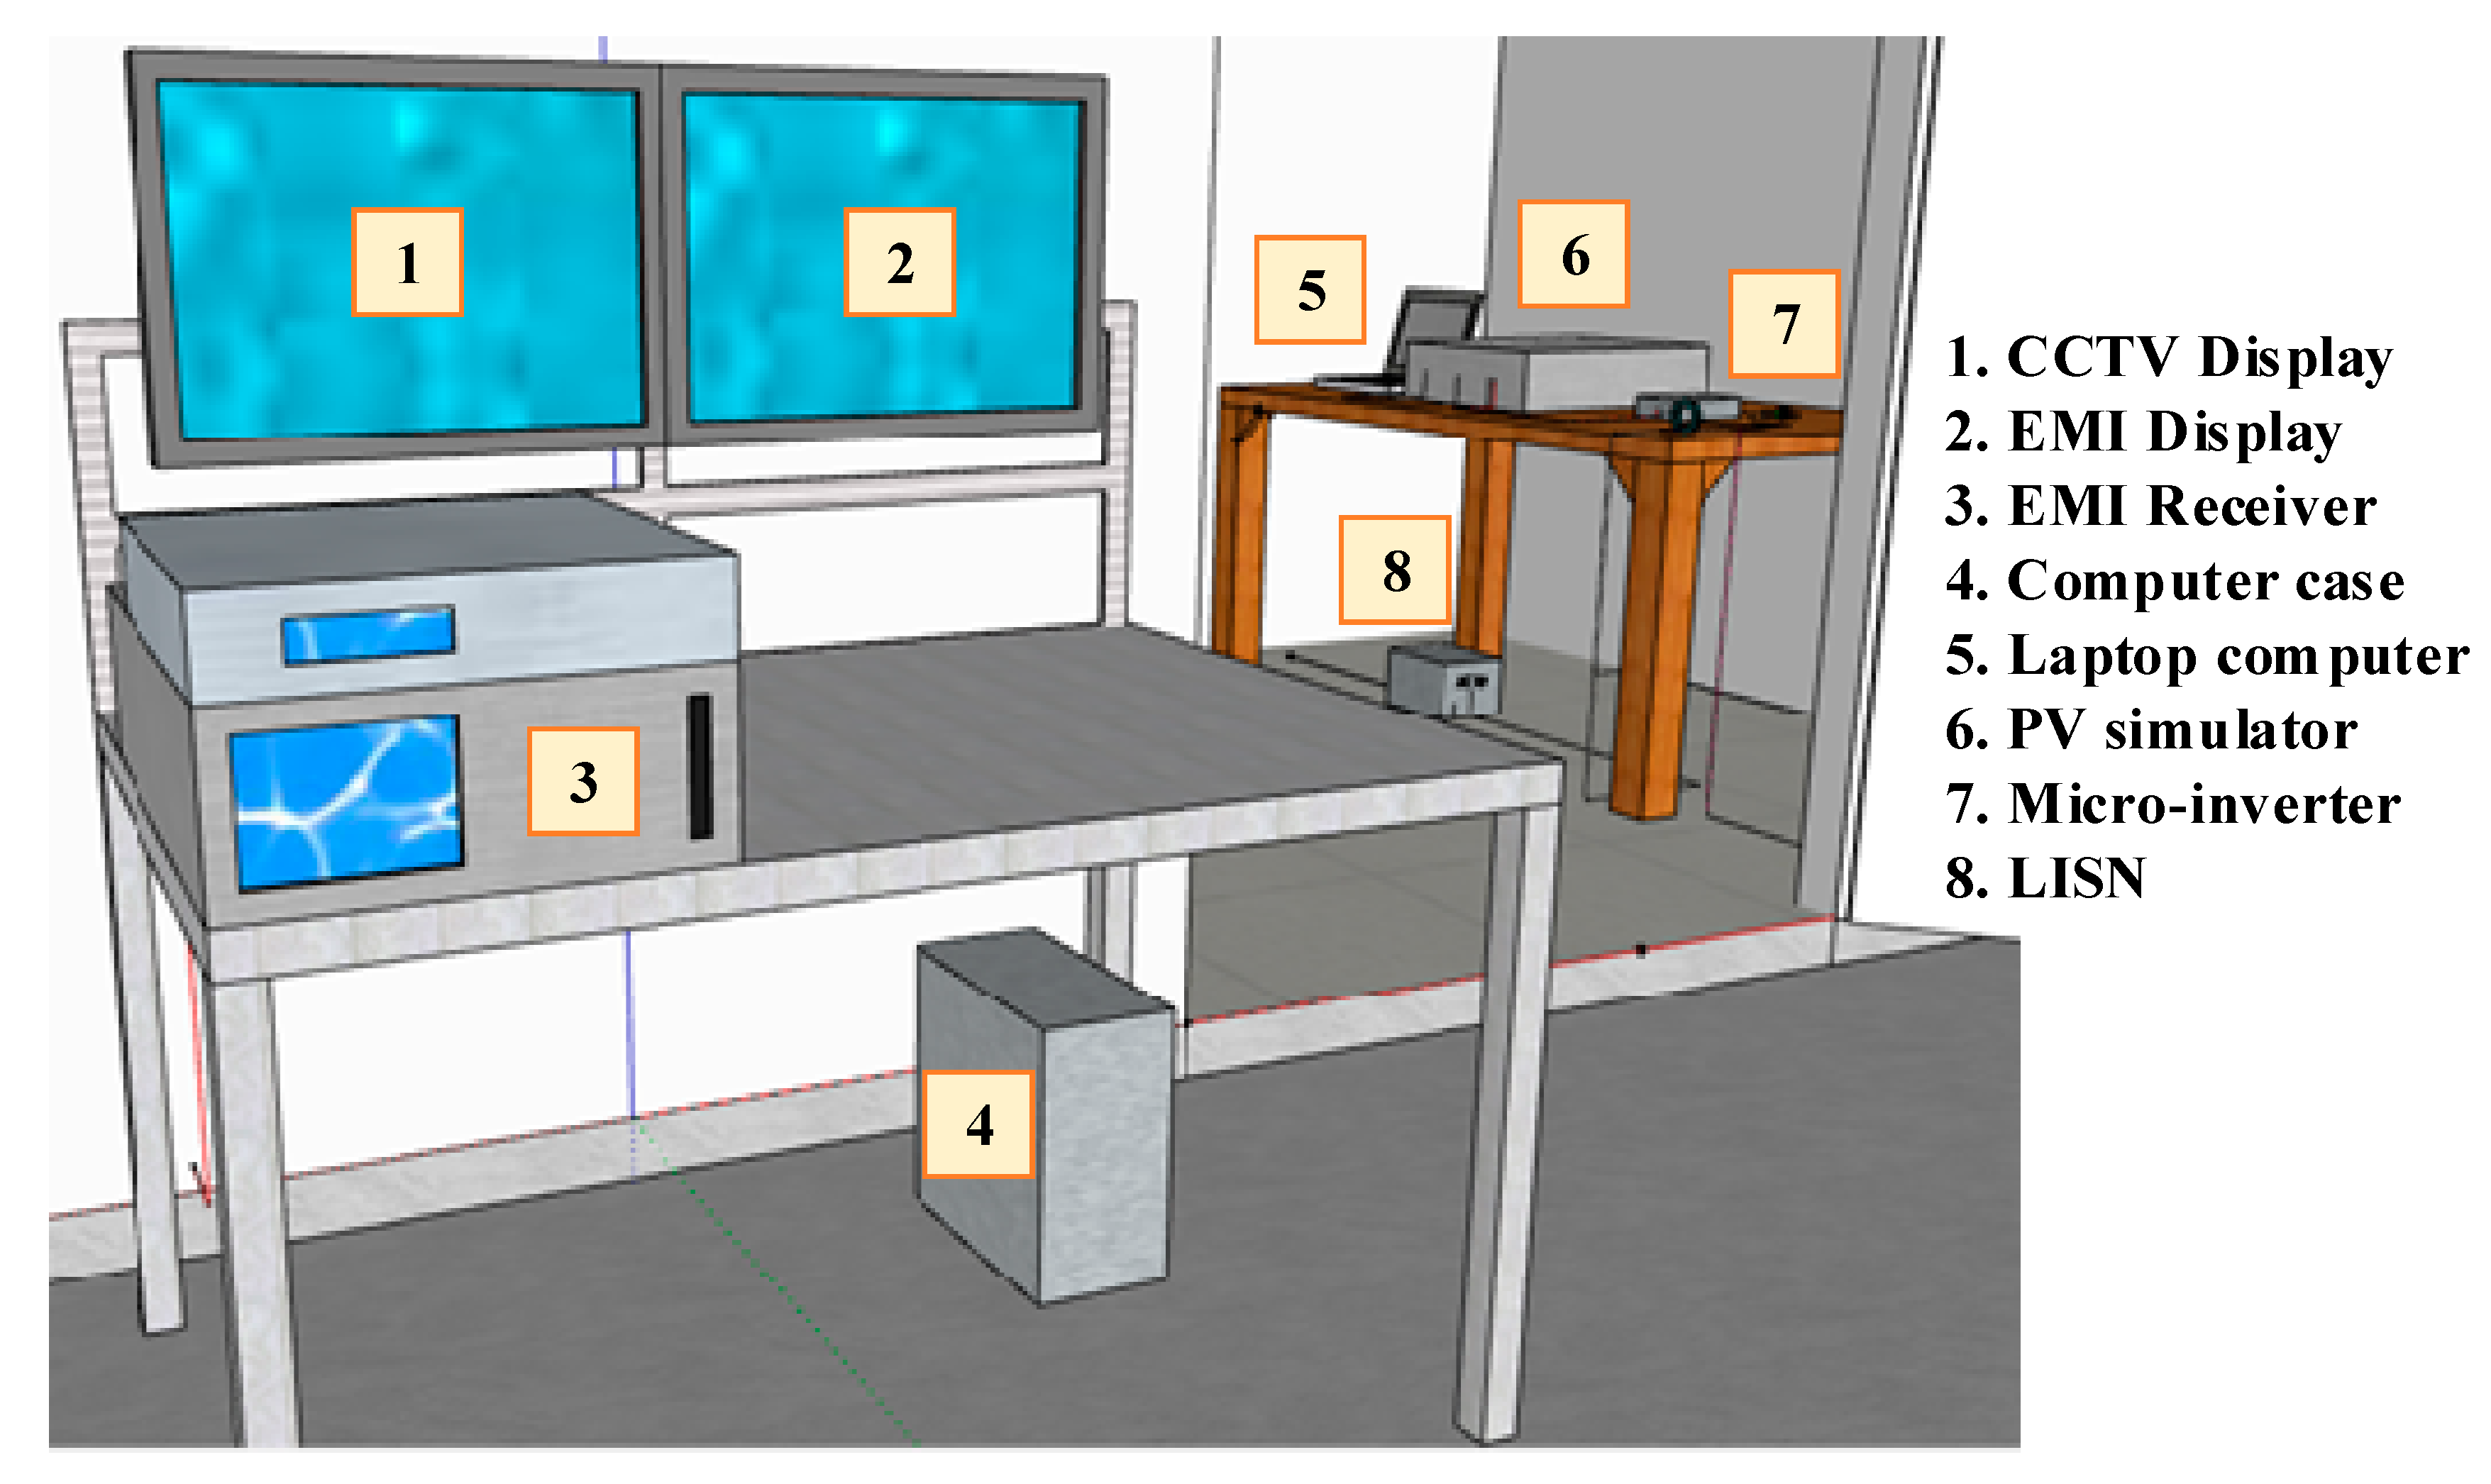
This research is operated in a shielded room. A passive probe in
Figure 4a is used to measure the CE and a RF current probe in
Figure 4b is used to measure the CM and the DM separately. The RF current probe is probe of the Fischer Custom Communications, Inc. (FCC) with bandwidth 10 kHz–1 GHz (P/N: F-65 and S/N: 161362). The signals from both probes are sent to the EMI receiver and shown on an EMI monitor as depicted in number 2 and 3 of
Figure 5. In number 8 of
Figure 5, the LISN is a low-pass filter placed between a grid system and the equipment under test (EUT) to create a known impedance and to provide a radio frequency (RF) noise measurement port. It also isolates the unwanted RF signals from the shielded-room single-phase grid system. In addition, the LISN can be used to predict conducted emission for diagnostic and pre-compliance testing.
4. Discussion
In this research, both the grid-connected system and the stand-alone system work together. Normally, in the daytime, the electrical energy from the solar panel is sent to the solar charger controller to be stored in batteries, but, when the energy storage is full, the electric power will be sent to the grid-connected system. Then, it is converted into the alternating current by the grid-connected micro-inverter and supplied to the grid system or the road lighting system. At nighttime, the electrical energy from the energy storage is disbursed via the solar charger controller to the stand-alone micro-inverter. The alternating current from the stand-alone micro-inverter is supplied to turn on the LED luminaire.
The CE of both the grid-connected system and the stand-alone system exceed the CISPR 14-1 standard [
21]. The grid-connected system has a high CE level in the low frequency range and the stand-alone system has a high CE level throughout the measurement frequency range. Therefore, the road lighting system will get the CE signal throughout the day and the heaviest during the night. This issue is very important because the LED luminaire of the streetlight is sensitive to noise and over-voltage, so this issue may cause the LED luminaire to deteriorate or damage. In the future, this problem may be solved by applying a grounding, an EMI filter, a ferrite bead, and a shielding cover with inverters, the LED luminaire, or electrical devices which are connected to this nano-grid system by an electric wire. Each method is suitable for each frequency range.


