A Novel Evaluation Approach of County-Level City Disaster Resilience and Urban Environmental Cleanliness Based on SDG11 and Deqing County’s Situation


Abstract
:1. Introduction
- (1)
- With the continuous strengthening of human activities on the environmental impact, the risk of disasters in human settlements is increasing [12]. Due to the urbanization and accumulation of wealth, the occurrence of catastrophes can produce Domino Effect. It turns isolated disaster into catastrophic events, even those last for a short time. Many elements of human settlement construction are affected by natural disasters. Therefore, the 2030 Agenda emphasizes the urgent need for humans to mitigate disaster risks, especially for strengthening the disaster resilience of cities and human settlements. It is necessary for city managers to reconsider the effects of climate change, reasonably reduce disaster risk and build resilience to natural disasters when building human settlements. Through studying on explaining the determinants of disaster resilience, the ability to measure resilience is increasingly being identified as a key step toward disaster risk reduction [13].
- (2)
- Improving environmental quality is critical to accelerate the process of urban resilience. It has also become a mandatory goal to implement the 2030 Agenda for the Chinese government. By optimizing the management of natural resources, human can reduce the possibility of natural disasters and the possibility of large-scale outbreaks of environmental pollution caused by disasters. The current high consumption economic model will bring a lot of pressure to the environmental carrying capacity. The positive impact of environmental factors in “2030 Agenda” needs to be used to address the challenges posed by climate change, environmental pollution and waste management [14,15,16].
2. Materials and Methods
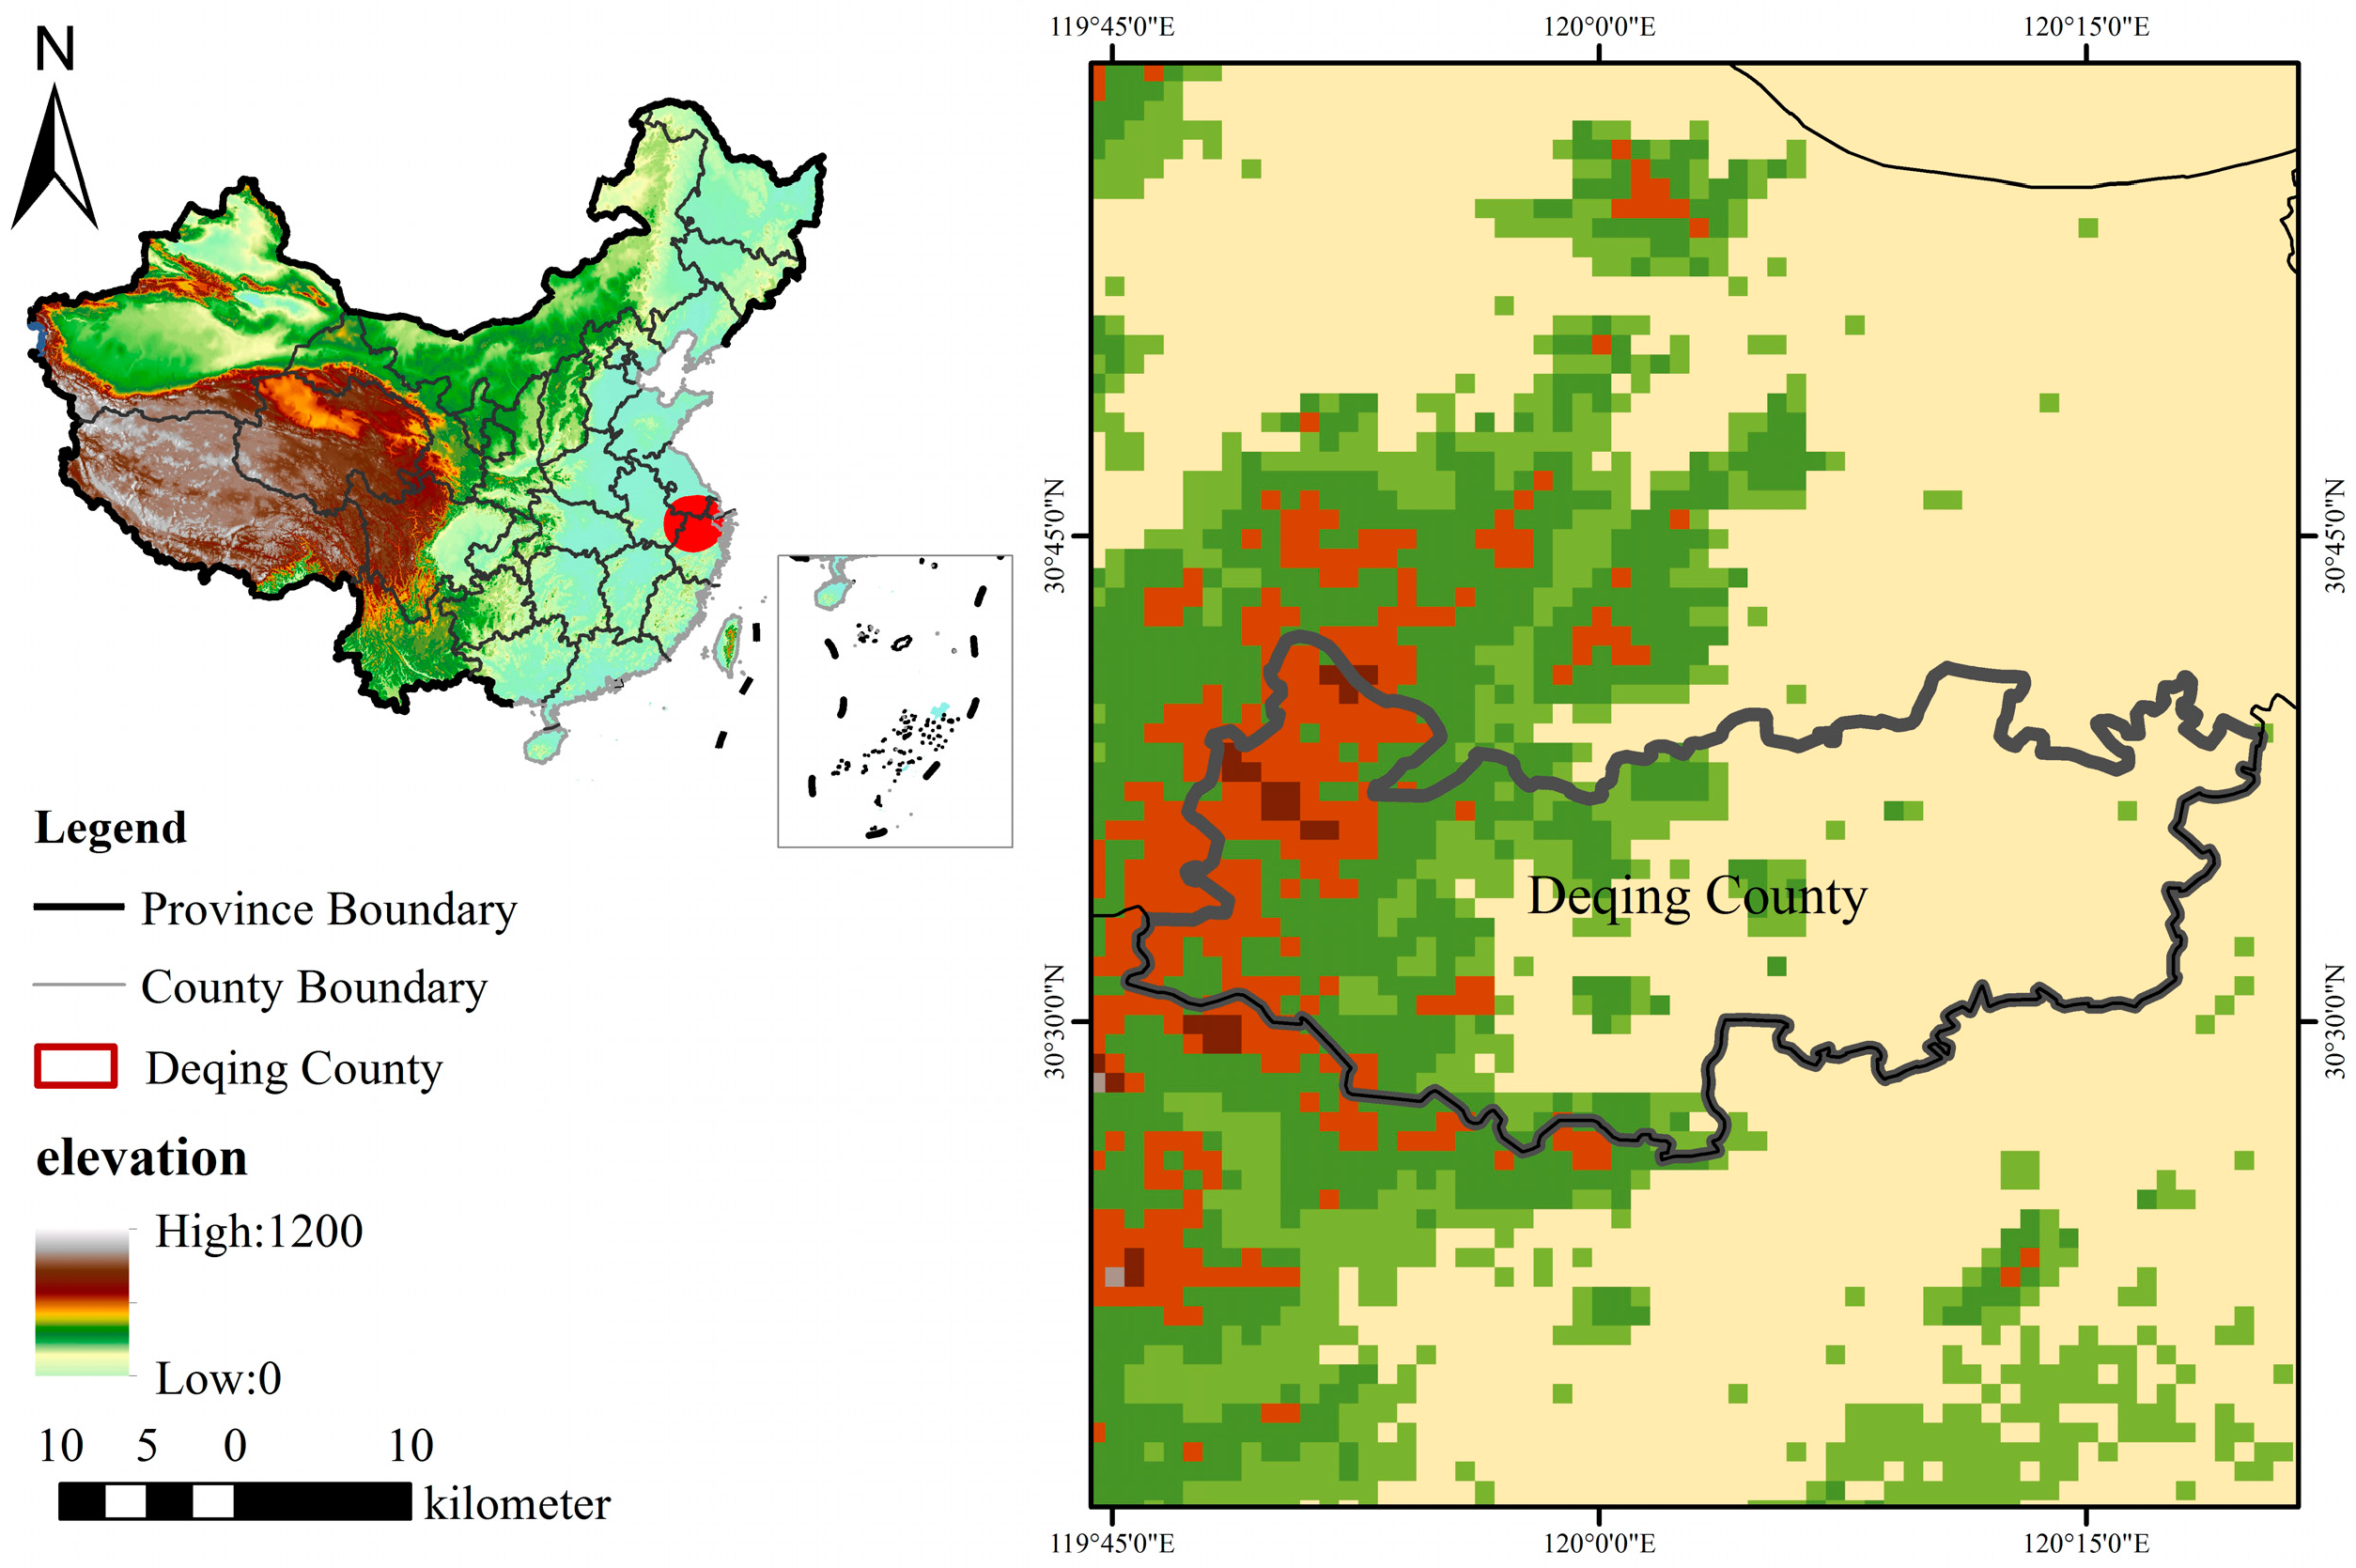
2.1. County Situation Introduction
2.2. Data Collection
2.3. Methodology
2.3.1. Localization of Indicators
2.3.2. Calculation of Localized Indicators
2.3.3. Grey Time-Series Prediction Model
- (1)
- Sample of population and environmental pollutant concentration has N available ata: ,a new sequence can be generated by accumulation [39]. The corresponding differential equation of GM (1,1) is:Among them: α is called development gray number; μ is called endogenous control gray number.
- (2)
- Let be the parameter vector to be estimated: , which can be solved by the least squares method. The solution is:By solving the differential equation, the prediction model of per capita environmental impact can be obtained:
3. Results
3.1. Evaluation Results
3.2. Prediction Results of Urban per Capita Environmental Impact
4. Discussion
5. Conclusions
Author Contributions
Funding
Conflicts of Interest
References
- Hou, X.; Liu, J.; Zhang, D. Regional sustainable development: The relationship between natural capital utilization and economic development. Sustain. Dev. 2019, 27, 183–195. [Google Scholar] [CrossRef]
- Zinkernagel, R.; Evans, J.; Neij, L. Applying the SDGs to Cities: Business as Usual or a New Dawn? Sustainability 2018, 10, 3201. [Google Scholar] [CrossRef]
- Orzes, G.; Moretto, A.M.; Ebrahimpour, M.; Sartor, M.; Moro, M.; Rossi, M. United Nations Global Compact: Literature review and theory-based research agenda. J. Clean. Prod. 2018, 177, 633–654. [Google Scholar] [CrossRef]
- Salvia, A.L.; Leal Filho, W.; Brandli, L.L.; Griebeler, J.S. Assessing research trends related to Sustainable Development Goals: Local and global issues. J. Clean. Prod. 2019, 208, 841–849. [Google Scholar] [CrossRef]
- Jacob, A. Mind the Gap: Analyzing the Impact of Data Gap in Millennium Development Goals’ (MDGs) Indicators on the Progress toward MDGs. World Dev. 2017, 93, 260–278. [Google Scholar] [CrossRef]
- Vandemoortele, J. From simple-minded MDGs to muddle-headed SDGs. Dev. Stud. Res. 2018, 5, 83–89. [Google Scholar] [CrossRef]
- Mbah, P.O.; Nzeadibe, T.C. Inclusive municipal solid waste management policy in Nigeria: Engaging the informal economy in post-2015 development agenda. Local Environ. 2017, 22, 203–224. [Google Scholar] [CrossRef]
- Diaz-Sarachaga, J.M.; Jato-Espino, D.; Castro-Fresno, D. Is the Sustainable Development Goals (SDG) index an adequate framework to measure the progress of the 2030 Agenda? Sustain. Dev. 2018, 26, 663–671. [Google Scholar] [CrossRef]
- Horn, P.; Grugel, J. The SDGs in middle-income countries: Setting or serving domestic development agendas? Evidence from Ecuador. World Dev. 2018, 109, 73–84. [Google Scholar] [CrossRef]
- Ulbrich, P.; Porto de Albuquerque, J.; Coaffee, J. The Impact of Urban Inequalities on Monitoring Progress towards the Sustainable Development Goals: Methodological Considerations. ISPRS Int. J. Geo-Inf. 2018, 8, 6. [Google Scholar] [CrossRef]
- Jun Chen, Z.L. Chinese pilot project tracks progress towards SDGs. Nature 2018, 563, 184. [Google Scholar] [CrossRef]
- Folke, C.; Kofinas, G.P.; Chapin, F.S. Principles of Ecosystem Stewardship; Springer: Berlin/Heidelberg, Germany, 2009. [Google Scholar]
- Burton, C.G. A Validation of Metrics for Community Resilience to Natural Hazards and Disasters Using the Recovery from Hurricane Katrina as a Case Study. Ann. Assoc. Am. Geogr. 2014, 105, 67–86. [Google Scholar] [CrossRef]
- Zhang, H.; Wang, Z.; Zhang, W. Exploring spatiotemporal patterns of PM2.5 in China based on ground-level observations for 190 cities. Environ. Pollut 2016, 216, 559–567. [Google Scholar] [CrossRef]
- Bari, M.A.; Kindzierski, W.B. Characteristics of air quality and sources affecting fine particulate matter (PM2.5) levels in the City of Red Deer, Canada. Environ. Pollut 2017, 221, 367–376. [Google Scholar] [CrossRef]
- Shahsavari, A.; Akbari, M. Potential of solar energy in developing countries for reducing energy-related emissions. Renew. Sustain. Energy Rev. 2018, 90, 275–291. [Google Scholar] [CrossRef]
- Imamura, K.; Takano, K.T.; Mori, N.; Nakashizuka, T.; Managi, S. Attitudes toward disaster-prevention risk in Japanese coastal areas: Analysis of civil preference. Nat. Hazards 2016, 82, 209–226. [Google Scholar] [CrossRef]
- Koch, F.; Krellenberg, K. How to Contextualize SDG 11? Looking at Indicators for Sustainable Urban Development in Germany. ISPRS Int. J. Geo-Inf. 2018, 7, 464. [Google Scholar] [CrossRef]
- Boys, B.L.; Martin, R.V.; van Donkelaar, A.; MacDonell, R.J.; Hsu, N.C.; Cooper, M.J.; Yantosca, R.M.; Lu, Z.; Streets, D.G.; Zhang, Q.; et al. Fifteen-Year Global Time Series of Satellite-Derived Fine Particulate Matter. Environ. Sci. Technol. 2014, 48, 11109–11118. [Google Scholar] [CrossRef]
- Kanji, R.; Agrawal, R. Building a society conducive to the use of corporate social responsibility as a tool to develop disaster resilience with sustainable development as the goal: An interpretive structural modelling approach in the Indian context. Asian J. Sustain. Soc. Responsib. 2019, 4, 5. [Google Scholar] [CrossRef]
- Geng, G.; Zhang, Q.; Martin, R.V.; van Donkelaar, A.; Huo, H.; Che, H.; Lin, J.; He, K. Estimating long-term PM2.5 concentrations in China using satellite-based aerosol optical depth and a chemical transport model. Remote Sens. Environ. 2015, 166, 262–270. [Google Scholar] [CrossRef]
- van Donkelaar, A.; Martin, R.V.; Brauer, M.; Hsu, N.C.; Kahn, R.A.; Levy, R.C.; Lyapustin, A.; Sayer, A.M.; Winker, D.M. Global Estimates of Fine Particulate Matter using a Combined Geophysical-Statistical Method with Information from Satellites, Models, and Monitors. Environ. Sci. Technol. 2016, 50, 3762–3772. [Google Scholar] [CrossRef]
- Mochizuki, J.; Vitoontus, S.; Wickramarachchi, B.; Hochrainer-Stigler, S.; Williges, K.; Mechler, R.; Sovann, R. Operationalizing Iterative Risk Management under Limited Information: Fiscal and Economic Risks Due to Natural Disasters in Cambodia. Int. J. Disaster Risk Sci. 2015, 6, 321–334. [Google Scholar] [CrossRef] [Green Version]
- Cui, H.; Chen, W.; Dai, W.; Liu, H.; Wang, X.; He, K. Source apportionment of PM2.5 in Guangzhou combining observation data analysis and chemical transport model simulation. Atmos. Environ. 2015, 116, 262–271. [Google Scholar] [CrossRef]
- Lin, C.; Li, Y.; Lau, A.K.H.; Deng, X.; Tse, T.K.T.; Fung, J.C.H.; Li, C.; Li, Z.; Lu, X.; Zhang, X.; et al. Estimation of long-term population exposure to PM2.5 for dense urban areas using 1-km MODIS data. Remote Sens. Environ. 2016, 179, 13–22. [Google Scholar] [CrossRef] [Green Version]
- Gabbe, C.J.; Oxlaj, E.; Wang, J. Residential development and near-roadway air pollution: Assessing risk and mitigation in San Jose, California. J. Transp. Health 2019, 13, 78–89. [Google Scholar] [CrossRef]
- Takano, A.P.C.; Justo, L.T.; Dos Santos, N.V.; Marquezini, M.V.; de Andre, P.A.; da Rocha, F.M.M.; Pasqualucci, C.A.; Barrozo, L.V.; Singer, J.M.; De Andre, C.D.S.; et al. Pleural anthracosis as an indicator of lifetime exposure to urban air pollution: An autopsy-based study in Sao Paulo. Environ. Res. 2019, 173, 23–32. [Google Scholar] [CrossRef]
- Firoiu, D.; Ionescu, G.H.; Băndoi, A.; Florea, N.M.; Jianu, E. Achieving Sustainable Development Goals (SDG): Implementation of the 2030 Agenda in Romania. Sustainability 2019, 11, 2156. [Google Scholar] [CrossRef]
- Chen, Y.-L.; Tao, T.-H.; Ding, P. Spatial-temporal distribution characteristics of air quality in the urban agglomeration of the yangtze river delta. Resour. Environ. Yangtze Basin 2017, 26, 687–697. [Google Scholar]
- Wu, M.; Peng, H.; Fan, S.; Wu, D. Distribution characteristics of regional air quality in the pearl river delta. Environ. Sci. Technol. 2015, 38, 77–82. [Google Scholar]
- Breuer, A.; Janetschek, H.; Malerba, D. Translating Sustainable Development Goal (SDG) Interdependencies into Policy Advice. Sustainability 2019, 11, 2092. [Google Scholar] [CrossRef]
- Krellenberg, K.; Bergsträßer, H.; Bykova, D.; Kress, N.; Tyndall, K. Urban Sustainability Strategies Guided by the SDGs —A Tale of Four Cities. Sustainability 2019, 11, 1116. [Google Scholar] [CrossRef]
- Moonchai, S.; Rakpuang, W. A New Approach to Improve Accuracy of Grey Model GMC(1,n)in Time Series Prediction. Model. Simul. Eng. 2015, 2015, 1–10. [Google Scholar] [CrossRef] [Green Version]
- Zeng, B.; Luo, C.; Liu, S.; Bai, Y.; Li, C. Development of an optimization method for the GM(1,N) model. Eng. Appl. Artif. Intell. 2016, 55, 353–362. [Google Scholar] [CrossRef]
- Pao, H.-T.; Fu, H.-C.; Tseng, C.-L. Forecasting of CO2 emissions, energy consumption and economic growth in China using an improved grey model. Energy 2012, 40, 400–409. [Google Scholar] [CrossRef]
- Cheng-Ping, Z.; Chuan, L.; Hai-wei, G. Research on Hydrology Time Series Prediction Based on Grey Theory and [epsilon]-Support Vector Regression. In Proceedings of the 2011 International Conference on Computer Distributed Control and Intelligent Environmental Monitoring, Changsha, China, 19–20 February 2011; pp. 1673–1676. [Google Scholar]
- Şahin, U. Forecasting of Turkey’s greenhouse gas emissions using linear and nonlinear rolling metabolic grey model based on optimization. J. Clean. Prod. 2019, 239, 118079. [Google Scholar] [CrossRef]
- Wang, L.; Xie, Y.; Wang, X.; Xu, J.; Zhang, H.; Yu, J.; Sun, Q.; Zhao, Z. Meteorological sequence prediction based on multivariate space-time auto regression model and fractional calculus grey model. Chaos Solitons Fractals 2019, 128, 203–209. [Google Scholar] [CrossRef]
- Kayacan, E.; Ulutas, B.; Kaynak, O. Grey system theory-based models in time series prediction. Expert Syst. Appl. 2010, 37, 1784–1789. [Google Scholar] [CrossRef]


| SDG 11: Make cities and human settlements inclusive, safe, resilient and sustainable [32] | ||
| Target a | 11.5: By 2030, significantly reduce the number of deaths and the number of people affected and substantially decrease the direct economic losses relative to global gross domestic product caused by disasters, including water-related disasters, with a focus on protecting the poor and people in vulnerable situations. | 11.6: By 2030, reduce the adverse per capita environmental impact of cities, including by paying special attention to air quality and municipal and other waste management. |
| Indicator b | 11.5.1: Number of deaths, missing persons and persons affected by disaster per 100,000 people | 11.6.1: Proportion of urban solid waste regularly collected and with adequate final discharge out of total urban solid waste generated, by cities |
| 11.5.2: Direct disaster economic loss in relation to global GDP, including disaster damage to critical infrastructure and disruption of basic services | 11.6.2: Annual mean levels of fine particulate matter (e.g. PM2.5 and PM10) in cities (population weighted) | |
| Indicator localization c | 11.5.1: Number of deaths, missing persons and persons affected by disaster per 100,000 people | 11.6.1: Proportion of urban solid waste (living solid waste and industrial solid waste) regularly collected and with adequate final discharge out of total urban solid waste generated, by cities |
| 11.5.2: Direct disaster economic loss in relation to global GDP, including disaster damage to critical infrastructure and disruption of basic services | 11.6.2: Annual mean levels of fine particulate matter (e.g. PM2.5 and PM10) in cities (population weighted) | |
| Description d | 11.5.1: Adopted the original indicator | 11.6.1: Revised the original indicator |
| 11.5.2: Revised the original indicator | 11.6.2: Adopted the original indicator | |
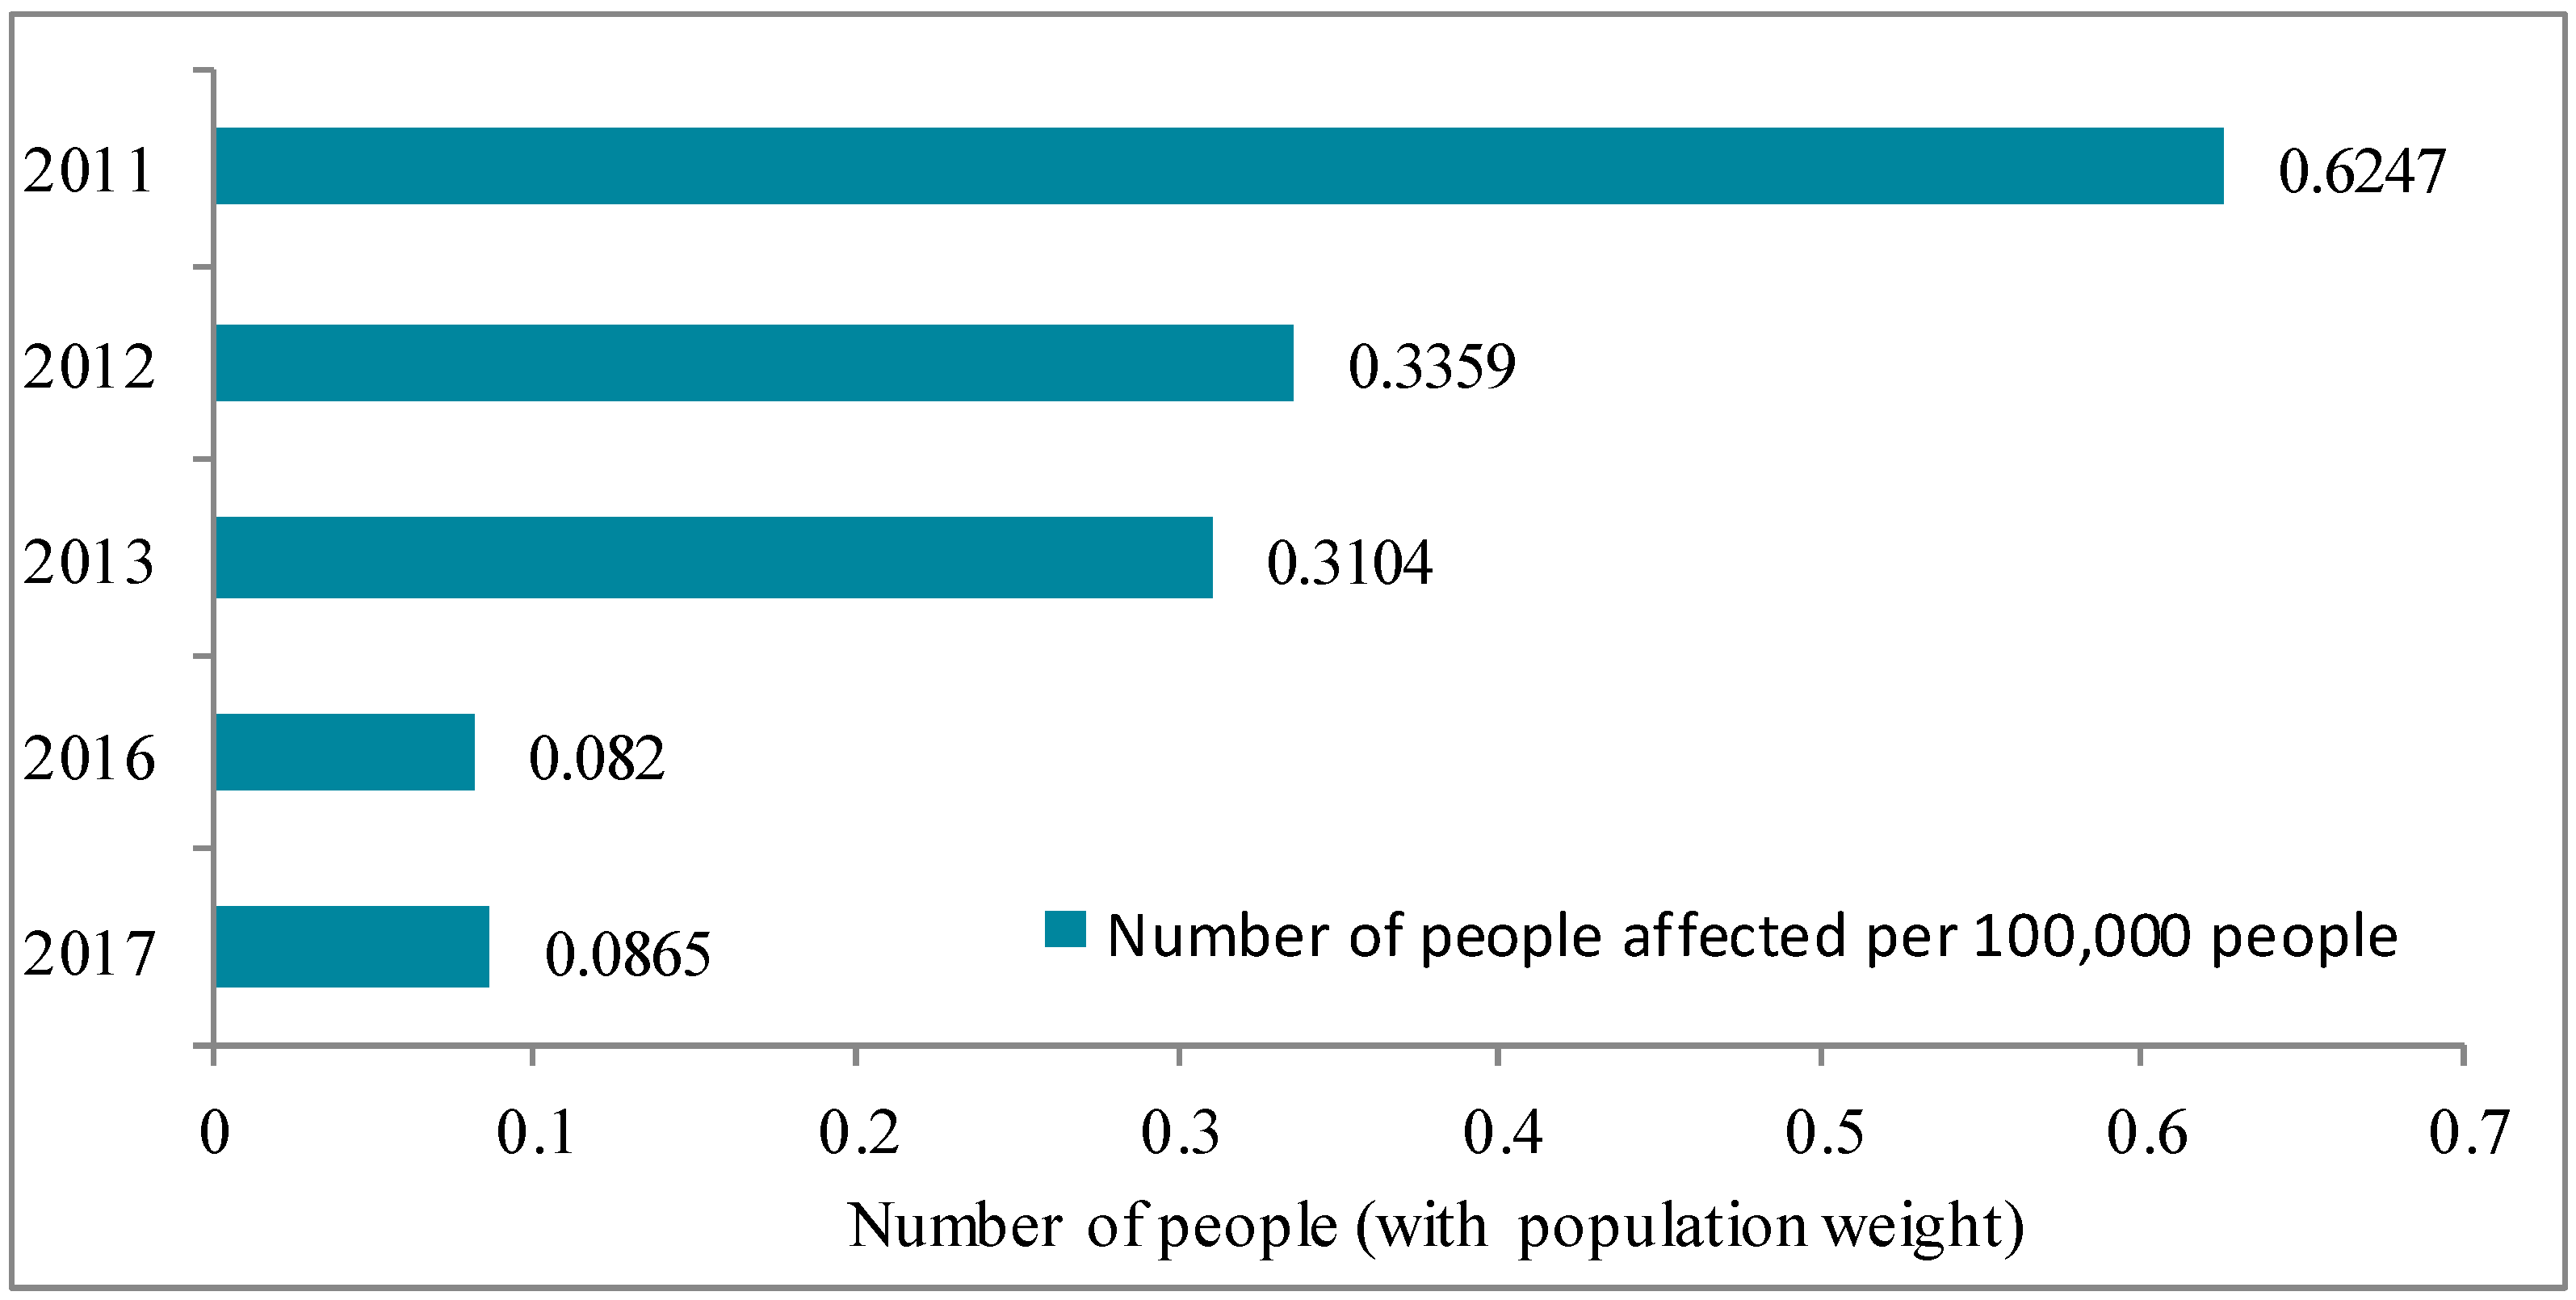
| Year | Percentage of Economic Losses Caused by Disasters |
|---|---|
| 2011 | 0.92% |
| 2012 | 0.22% |
| 2013 | 0.27% |
| 2016 | 2.69% |
| 2017 | 0.74% |
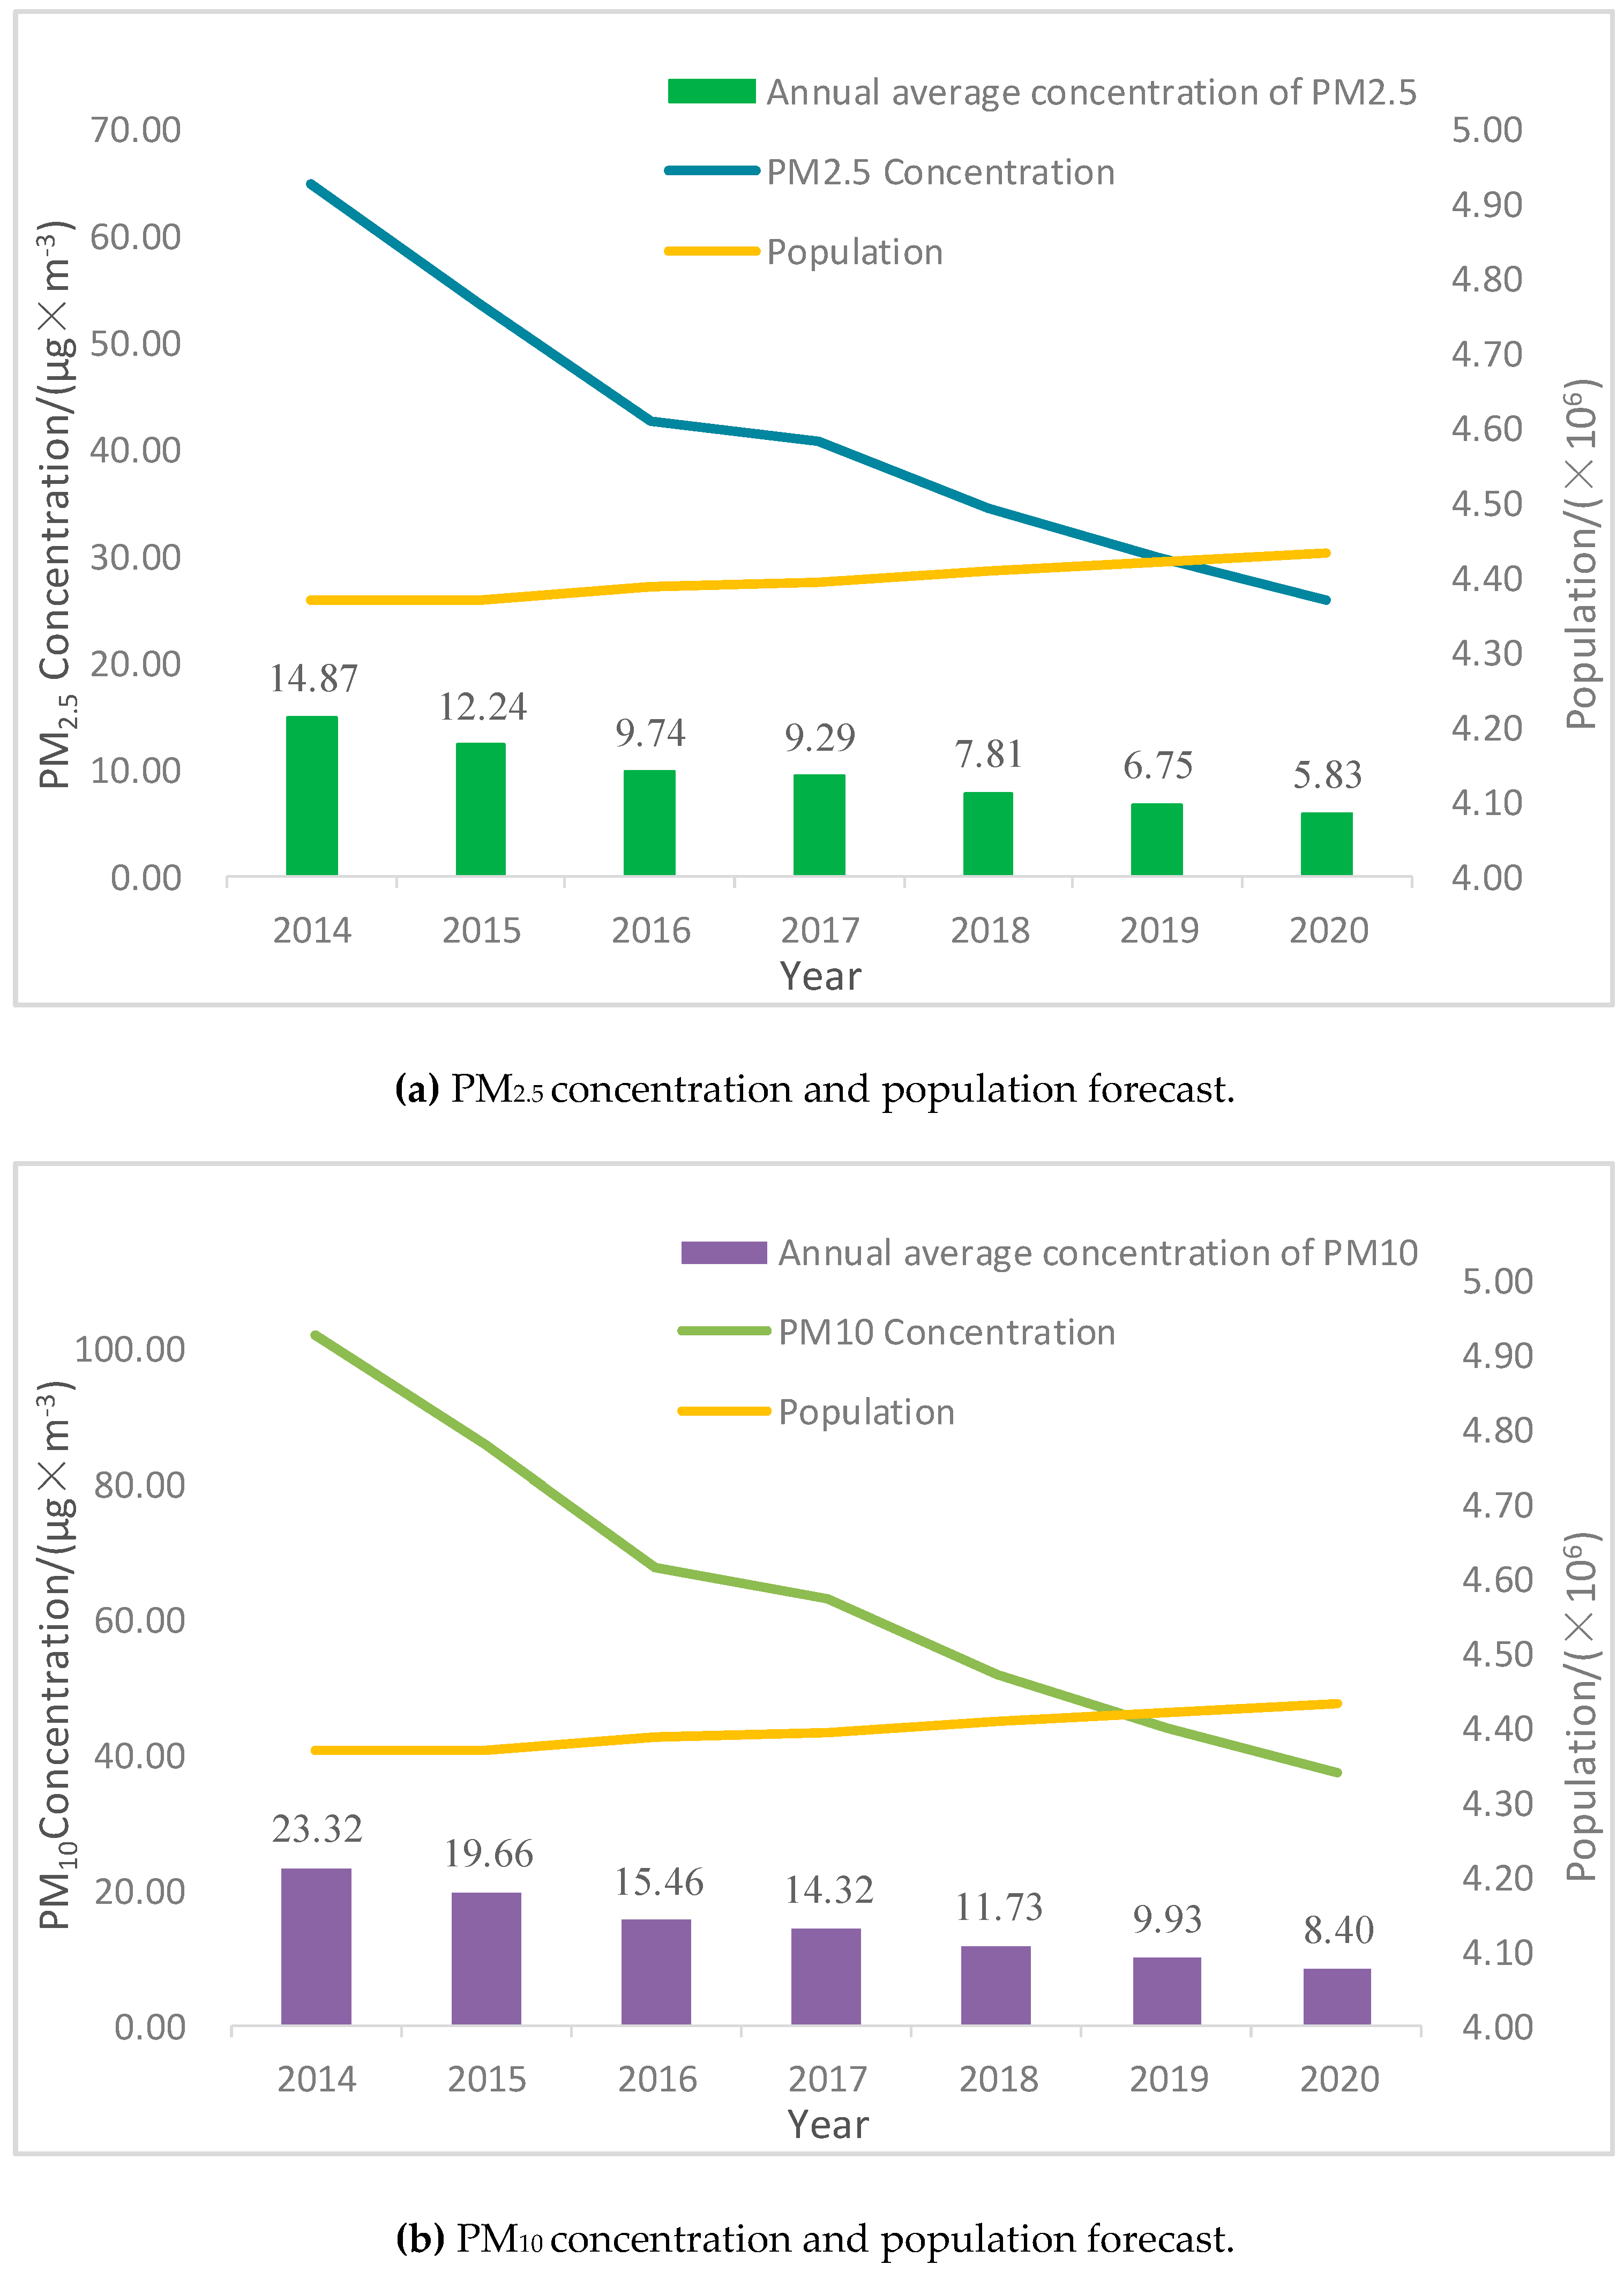
| Year | PM10 (with Population Weight)/ | PM2.5 (with Population Weight)/ |
|---|---|---|
| 2014 | 14.87 | 23.32 |
| 2015 | 12.24 | 19.66 |
| 2016 | 9.74 | 15.46 |
| 2017 | 9.29 | 14.32 |
© 2019 by the authors. Licensee MDPI, Basel, Switzerland. This article is an open access article distributed under the terms and conditions of the Creative Commons Attribution (CC BY) license (http://creativecommons.org/licenses/by/4.0/).
Share and Cite
Wang, Y.; Du, M.; Zhou, L.; Cai, G.; Bai, Y. A Novel Evaluation Approach of County-Level City Disaster Resilience and Urban Environmental Cleanliness Based on SDG11 and Deqing County’s Situation. Sustainability 2019, 11, 5713. https://0-doi-org.brum.beds.ac.uk/10.3390/su11205713
Wang Y, Du M, Zhou L, Cai G, Bai Y. A Novel Evaluation Approach of County-Level City Disaster Resilience and Urban Environmental Cleanliness Based on SDG11 and Deqing County’s Situation. Sustainability. 2019; 11(20):5713. https://0-doi-org.brum.beds.ac.uk/10.3390/su11205713
Chicago/Turabian StyleWang, Yani, Mingyi Du, Lei Zhou, Guoyin Cai, and Yongliang Bai. 2019. "A Novel Evaluation Approach of County-Level City Disaster Resilience and Urban Environmental Cleanliness Based on SDG11 and Deqing County’s Situation" Sustainability 11, no. 20: 5713. https://0-doi-org.brum.beds.ac.uk/10.3390/su11205713