Multisensor IoT Platform for Optimising IAQ Levels in Buildings through a Smart Ventilation System


1
Department of Architecture and Design, Politecnico di Torino, 10125 Turin, Italy
2
ICT for Smart Society, Department of Electronics and Telecommunications, Politecnico di Torino, 10129 Turin, Italy
*
Author to whom correspondence should be addressed.
Sustainability 2019, 11(20), 5777; https://0-doi-org.brum.beds.ac.uk/10.3390/su11205777
Submission received: 12 July 2019
/
Revised: 27 September 2019
/
Accepted: 15 October 2019
/
Published: 18 October 2019
(This article belongs to the Special Issue Assessing the Performance of Passive Houses in Mediterranean Climate Regions)
Abstract
:Indoor Air Quality (IAQ) issues have a direct impact on the health and comfort of building occupants. In this paper, an experimental low-cost system has been developed to address IAQ issues by using a distributed internet of things platform to control and monitor the indoor environment in building spaces while adopting a data-driven approach. The system is based on several real-time sensor data to model the indoor air quality and accurately control the ventilation system through algorithms to maintain a comfortable level of IAQ by balancing indoor and outdoor pollutant concentrations using the Indoor Air Quality Index approach. This paper describes hardware and software details of the system as well as the algorithms, models, and control strategies of the proposed solution which can be integrated in detached ventilation systems. Furthermore, a mobile app has been developed to inform, in real time, different-expertise-user profiles showing indoor and outdoor IAQ conditions. The system is implemented in a small prototype box and early-validated with different test cases considering various pollutant concentrations, reaching a Technology Readiness Level (TRL) of 3–4.
1. Introduction
Sick Building Syndrome (SBS) affects people who are subject to extended exposure to chemical, biological, and/or physical agents found in buildings with a low Indoor Air Quality (IAQ) level which is generally related to bad ventilation. Moreover, the World Health Organization (WHO) reported that IAQ is generally from 2 to 5 times worse than outdoor air quality thus increasing the risk of both short term effects, e.g., eye irritation or a decrease in productivity, and long term effects, e.g., increased risk of headaches, damage to central nervous system, or even cancer [1]. Furthermore, current life styles cause an increase in the number of hours spent indoors, taking up about 90% of our time [2,3]. Bad IAQ levels are related to several factors, including dampness and mould—see also [4]—and other pollutant concentrations in enclosed spaces. In Iceland, Switzerland and Norway the number of people affected by dampness was estimated to be about 80.4 million [3], while the WHO confirms that about 3.8 million people died annually due to household air pollution at a world level [5]. The study of low cost technologies to monitor IAQ levels and prevent, by actuating actions, the persistence of critical conditions is an essential part of this research. Especially in highly insulated buildings, such as the ones that use the passivehaus approach, a mechanical/hybrid ventilation system is needed [6], while a smart activation of the same is suggested to prevent excessive consumption. Furthermore, when this approach, principally adapted for cold locations, is extended to temperate climatic conditions, solutions to guarantee low-cost ventilation are needed to reduce overheating [7]. The solution proposed in this paper is adapted to face this challenge and can be integrated with detached and traditional mechanical systems or used alone in a hybrid, natural prevalent ventilation solution, with special regard to residential properties and small offices or to public buildings (e.g., school rooms).
The sources of indoor pollution include combustion of solid fuels in indoor environments, especially in developing countries; tobacco smoke; outdoor air pollutants; construction materials and furnishing sources [8]; bad maintenance of ventilative and air conditioning systems; but also cleaning products, cosmetics, and equipment (e.g., printers)—see also [9]. The main indoor pollutant substances are Carbon dioxide (CO2), Carbon monoxide (CO), Nitrogen oxides (NOx), Ozone (O3), Pentachlorophenol (PCP), Polycyclic Aromatic Hydrocarbon (PAH), Tobacco smoke, and Volatile Organic Compounds (VOCs), but also PM values inherited from outdoor air or from indoor fuel combustion, e.g., [10], polycyclic aromatic hydrocarbons; radon and other similar pollutants are considered in health guidelines, e.g., [11]. The Harvard School of Public Health recently published a new study about the negative impact of CO2. The study found that high concentrations of CO2 can reduce decision-making performance [12]. On the other hand, VOCs are emitted as gases from certain solids or liquids that include a variety of chemicals, some of which may have adverse short and long term health effects. Focusing on relative humidity, and referring to [13], it should be remembered that “Relative humidity also affects the rate of gassing of formaldehyde from indoor building materials, the rate of formation of acids and salts from sulphur and nitrogen dioxide, and the rate of formation of ozone”. The influence of relative humidity on the abundance of allergens, pathogens, and noxious chemicals suggests that indoor relative humidity levels should be considered as a factor of indoor air quality.
Among studies on monitoring solutions for IAQ, it is worthwhile noting previous theoretical research which was aimed at defining a metadatization approach to develop real-time sensor networks based on diffuse semi-open platforms for to connect and share low-cost Internet of Things (IoT) nodes—e.g., Arduino or RaspberryPi driven ones [14]. This study defines a method to classify and describe in diffused networks the nodes used that allow users to easily include metadata which are able to define the sensor accuracy, errors, monitored variables, etc. Furthermore, a sample application of three nodes in different parts of a city was tested—see also [15]. Nevertheless, commercial applications are now available on the market, such as the Netatmo series of sensors and the related open weathermap service, with which it is possible to access real-time monitored environmental parameters, including outdoor temperatures, relative humidity, atmospheric pressure, and wind direction and velocity [16]. This data source principally shares environmental data. Furthermore, other solutions, including IAQ variables, were developed by the Libelium Company. In particular, the SmartGases Pro system [17] is noteworthy as it involves a plug and sense platform to monitor most air quality parameters including CO, CO2, O2, O3, NOx, SO2, NHx, H2, ETO, luminosity, relative humidity, atmospheric pressure, and temperature. Each station can act as a node of a network which communicates according to several protocols including Wi-Fi and 4G radio. Other configurations are possible, including smart city ones, e.g., analyzing PMx levels, noise and other additional variables [18]. Specific applications were also defined in other references, such as [19], in which a modular IoT platform for IAQ is presented in consideration of the mentioned sensor interface board (Gas Pro) while detecting CO2, CO, SO2, NO2, O3, Cl2, temperature and relative humidity. These solutions are devoted to air monitoring and are not directly coupled with actuators.
Furthermore, with regard to the connection between IAQ variable level detection and ventilation system activation we should mention the study [20] which refers to a control strategy for demand-controlled ventilation systems (DCV) based on CO2 detection in multi-zone office spaces. The approach was tested on a very large office building in Hong Kong and works in combination with air handling units (AHU) using an intelligent building management and integration platform. Similarly, in Ref. [21] a study on the automatic activation of an energy recovery ventilation (ERV) system based on a CO2 detection system was introduced. Generally, ERV are manually controlled, causing potential risks of both insufficient ventilation rates, especially during night time (users’ sleeping time), and/or overventilation with consequent heat losses in the cold season. For these reasons, the authors of this study [21] developed a solution to automate the ERV system based on CO2 levels. An analysis of CO2 sensor localization in residential apartments was performed, and suggested using the living room to control the entire flat. Another study focuses on the reduction of requested airflow in DCV systems based on CO2 level detection in indoor spaces to avoid excessive energy consumption when IAQ levels are at the comfort threshold [22]. Furthermore, this research focuses on the usage of simple motor flaps instead of more widely-used variable air volume boxes. Pressure drops are here defined with respect to a developed model and coupled with a CO2 concentration model, showing a good potentiality in reducing energy consumption, by defining air exchanges in compliance with the model. Another interesting work on a CO2-based control approach for ventilation systems was proposed in [23]. This reference, unlike other approaches, considers outdoor CO2 levels as not constant, but fluctuating around daily quasi-periodical variations. In this case, ventilation rates are estimated without directly monitoring CO2 in the building, showing high-resolution results. Nevertheless, outdoor pollutants may affect the potential of ventilation under certain conditions—see for example [24].
All these studies demonstrate, on the one hand, continuous attention to the development of solutions to control ventilation systems for IAQ purposes, and on the other hand, that the majority of the efforts involve mechanical integration solutions with potentially high installation costs or advanced modelling approaches to avoid sensor usage. Considering residential houses and small offices, only a few commercial solutions adopt IAQ sensing (e.g., CO2) coupled with ventilation control systems—e.g., detached mechanical ventilation—and include a user interfaces. An example is the mechanical ventilation system Healthbox® produced by RENSON, which connects a multi-zone extractor system with CO2 zone detection. Inlet air supply is driven naturally in this solution—see [25]. Nevertheless, in the current era of information, with increased access to low-cost sensors the need to develop correlated platforms to integrate sensing with actuating in simple low cost systems is evident, especially if they can be connected to user interfaces to inform and receive feedback.
1.1. Paper’s Objectives
This paper focuses on CO2, Total VOC, and relative humidity, which are some of the main pollutants produced indoors which influence IAQ. Furthermore, the temperature is also detected and used as a risk index to combine IAQ ventilation purposes with ventilative cooling ones, see for example IEA EBC Annex 62 reports [26,27]. In order to act on IAQ levels to maintain acceptable conditions, it is important to have a real-time measurement of the indoor air quality to avoid and prevent related problems in time. The visualization and storage of historical environment data enables understanding and anticipation of current and future situations. Also the use of both environmental and indoor measurements leads to a faster dilution of pollutants thus leading to better comfort levels by knowing air mixing conditions. All these aspects are considered in the proposed system.
The main objectives of this project are as follows:
- to develop an IoT system for to monitor and visualize indoor air quality;
- to adopt a user-friendly approach to present monitored data by using an Indoor Air Quality Index (IAQI) which is able to process different pollutants at the same time and which can be represented on a user-friendly colour scale.
- to carry out a proper ventilation action, by activating a fan-assisted ventilation system, to improve indoor air quality and maintain the desired IAQI level;
- to control fan velocity for IAQI by balancing the external and internal conditions of all pollutants thanks to monitored data;
- to develop devoted user interfaces by using app mobile visualization and data storage for different user profiles (simple users, color scale index; and expert ones, sensor monitored levels);
- to test the IoT system under prototype conditions to reach a Technology Readiness Level (TRL) between 3 to 4.
Additionally, the described approach faces a didactical and methodological issue related to teaching and learning multidisciplinary issues in the building and ICT fields in the context of smart city and smart society problem solving. The Authors come from different backgrounds including telecommunication engineering, data analysis, and environmental and technological building design, under the Interdisciplinary Project activity of the Master Degree in ICT for SmartSociety of the Politecnico di Torino University.
1.2. Paper’s Structure
Section 2 of the paper describes the materials and methods adopted to develop the proposed IoT system. In particular, the backend approach is detailed in Section 2.1, the hardware components are introduced in Section 2.2., the mobile app in Section 2.3, and the adopted IAQI index in Section 2.4. Meanwhile, Section 3 is devoted to describing system design and implementation. Section 3.1 focuses on detailing the system architecture, while Section 3.2 and Section 3.3 focus respectively on the system’s Hardware and Backend definitions. Furthermore, Section 3.4 describes the developed Mobile application and Section 3.5 the developed control strategy. Section 4 focuses on early experimental testing of the system using a prototype based on two-nodes, one outdoor and one indoor and a platform backend which are all connected to the cloud. This section is sub-divided into (i) early validations on single aspects of the platforms (Section 4.1), (ii) prototype box testing considering each pollutant individually under high concentrations, and (iii) continuous prototype box testing producing different pollutants in realistic concentrations. The TRL reached with these tests is between 3 and 4. Finally, Section 5 reports discussions and conclusions, focusing on potential further development steps and details the main outcomes of the paper.
2. Materials and Methods
As shown in Figure 1, this project implements an IoT system to be installed in residential or small office spaces to control IAQ levels based on monitored data. A sample IoT application was also developed to be tested in a small room prototype box. The proposed solution monitors the indoor and outdoor environmental conditions by considering the following parameters: CO2, VOCs, atmospheric pressure, relative humidity, and temperature. Using these measurements, the IAQI index is computed and the obtained values are used in a ventilation control algorithm to provide the best indoor comfort level. Moreover, a mobile app is developed which provides functionalities of device management, real time measurement observations, and analytics of environmental measurements. The system consists of four main components: Backend, Hardware, Mobile App, and IAQI computation. The following sub-sections are devoted to introducing the methods and materials used for these four components.
2.1. Backend
The backend should be developed for the distributed internet of things platform in order to handle the sensor data, perform visualization issues, and manage control algorithms. For the purpose of this paper, the considered backend main features are listed here below:
- Device management
- Sensor microcontroller interface
- Sensor data communication
- Control algorithms
- Data storage and aggregation
2.1.1. Design Methodology
The Micro-service architecture approach was selected for the backend design to achieve the objective of a distributed and scalable system. This architecture allows us to structure the proposed application as a collection of loosely coupled services. Modularity makes the application easier to understand, develop, and test. Furthermore, it becomes more resilient to architectural erosion. All the backend features are defined as independent services that can communicate with each other and provide the required functionalities for the other system components.
2.1.2. REST APIs
Using the MicroService design methodology, the system’s features are provided as REST Web APIs using HTTP requests. Each Application Programming Interface (API) will provide a feature and can be accessed using HTTP requests to either get, edit or manage operations and data. Python language was chosen to develop the APIs due to the wide availability of required libraries and the simplicity, and scalability of its code. In order to implement the functionalities of the HTTP requests, CherryPy can be used [28]. CherryPy is an object-oriented web application framework which uses the Python programming language. It is designed for the rapid development of web applications by wrapping the HTTP protocol but stays at a low level.
2.1.3. Sensor Data Communication Protocol
Environmental data generated by the sensors are transmitted to calculate the air quality index and to feed control algorithms. Furthermore, the monitored data are also used in the mobile application for real-time data visualization, and they are stored in the database for further aggregations. To achieve these requirements, MQTT communication protocol was used. MQTT is an extremely simple and lightweight publish/subscribe messaging protocol, designed for constrained devices and low-bandwidth, high-latency, or unreliable networks [29]. The design principles of the proposed system are to minimize network bandwidth and device resource requirements whilst also attempting to ensure reliability and some degree of assurance of delivery. These requirements make the protocol MQTT ideal to enable the sensor to publish the data to different subscribing MicroServices in a reliable way.
The implementation of the MQTT protocol requires an MQTT broker, Eclipse Mosquitto Broker [30] was used since it supports MQTT protocol versions 5.0, 3.1.1 and 3.1. It is lightweight and suitable for use on all devices from low power single board computers to full servers. As for the programming of the MQTT clients, Eclipse Paho MQTT library was used to provide all the functions and classes needed to configure a subscriber or publisher application.
2.1.4. Database
The developed IoT platform functionalities require the storage of (i) system configuration; (ii) device information; and (iii) sensor data. MongoDB is a cross-platform document-oriented database program that allows for these functionalities [31]. Classified as a NoSQL database program, MongoDB uses JSON-like documents with schemata. MongoDb supports large volumes of structured, semi-structured, and unstructured data models, allowing us to perform the needed requirements for the proposed IoT application considering data storage functionalities to be used in the micro-services’ architecture.
2.2. Hardware
The following hardware components were used for the embedded system and the sensor network.
2.2.1. The Embedded System
RaspberryPi and Arduino. Raspberry Pi—see Figure 2a—is a credit card sized single board computer running Linux Raspbian and is used in the developed IoT system to allocate all microservices and processing power into one stand-alone unit. In particular, the Raspberry Pi 3B+ board was chosen as the master unit to control the operation of the whole system. Moreover, the need for a unit which is compatible with several communication protocols and digital and analog I/O pins has led to the choice of using Arduino Uno R3 shields—see Figure 2b. This specific microcontroller board is compatible with all used sensors and is powerful enough to handle all the acquisition and pre-processing tasks for the slave units, both localized indoor and outdoor.
Ventilation system: Artic P12 PWM—see Figure 3a. The Artic P12 is a PC fan controlled by pulse width modulation (PWM) signal. It has a speed range of 200–1800 RPM and can generate an airflow of 95.65 m3/h (@1.800 RPM). For the purpose of this paper, this fan was used to simulate the assisted ventilation system implemented in a prototype box.
LCD05—I2C/Serial LCD—see Figure 3b. The LCD05 is a LCD display that adds additional features in comparison with other displays, being fully compatible in both software and pin-out. For the purpose of the developed IoT system, it was used to display useful messages to support the development phases.
2.2.2. Sensors
BME680. The DFRobot BME680 Environmental Sensor (DFRobot, Shanghai, China)—see Figure 4a—is a lowpower sensor based on the BOSCH BME680 (Bosch Sensortec, Reutlinger, Germany). It is a 4-in-1 environmental sensor, which integrates a total VOC (Volatile Organic Compounds) sensor, a temperature sensor, a relative humidity sensor, and a barometric pressure sensor. This specific hardware component is characterized by a large availability of libraries which facilitate the acquisition of data and the development of the specific code. Pressure absolute accuracy is ±0.6 hPa, relative humidity one ±3%, temperature ±0.5 °C (at 25 °C), ±1 °C (full range), VOC 2–5% depending on specific VOCs [32].
The CO2 Gas Sensors used are illustrated in Figure 4b. Two of them are used to detect the CO2 levels of the indoor air and of the environmental air. This specific device is based on the MG-811 gas sensor (DFRobot, Shanghai, China), which shows high sensitivity to CO2 levels and less sensitivity to alcohol and CO presence. It is characterized by low relative humidity and temperature dependencies. The industrial quality of this component makes it sufficiently robust and stable despite its low-cost. Moreover, it is characterized by a measurement range of 350–10000 ppm, while its accuracy is within the range of 1% of the measurement scale. The proposed system is, however can also be connected to different sensors, such as the analogy infrared CO2 Gravity sensor for Arduino, which is more accurate (50 ppm + 3% reading).
2.3. Mobile App
An Android application was designed to allow users to monitor and control the system. Two main user profiles were adopted: on the one hand, users with limited technical knowledge of IAQ indexes and parameters; on the other hand, operational users with specific technical backgrounds. The former access to a colored graphical interface which classifies the IAQI value for each parameter on a scale based on four classes—see the following Section 2.4. For the latter the app reports the monitored values for each variable by considering temperature [°C], relative humidity [%], atmospheric pressure [hPa], CO2 levels [ppm], and TVOC (Total Volatile Organic Compounds) concentration [ppm]. Both user profiles may have access to indoor and outdoor data, even if for the non-technical profile indoor conditions are of most interest.
The main features of the app are listed below.
- Device management: it allows us to create a list of the installed devices for each specific application (e.g., a specific building, a specific zone) and to set a desired ventilation time to report indoor conditions in threshold value for each device;
- Real time data visualization: data from all sensors of a connected device are visualized on a single screen, thus permitting the users to always have an overview of the quality of the air, be they expert or non-expert users
- Statistical data: daily or weekly data graphs for each sensor are shown for both user profiles.
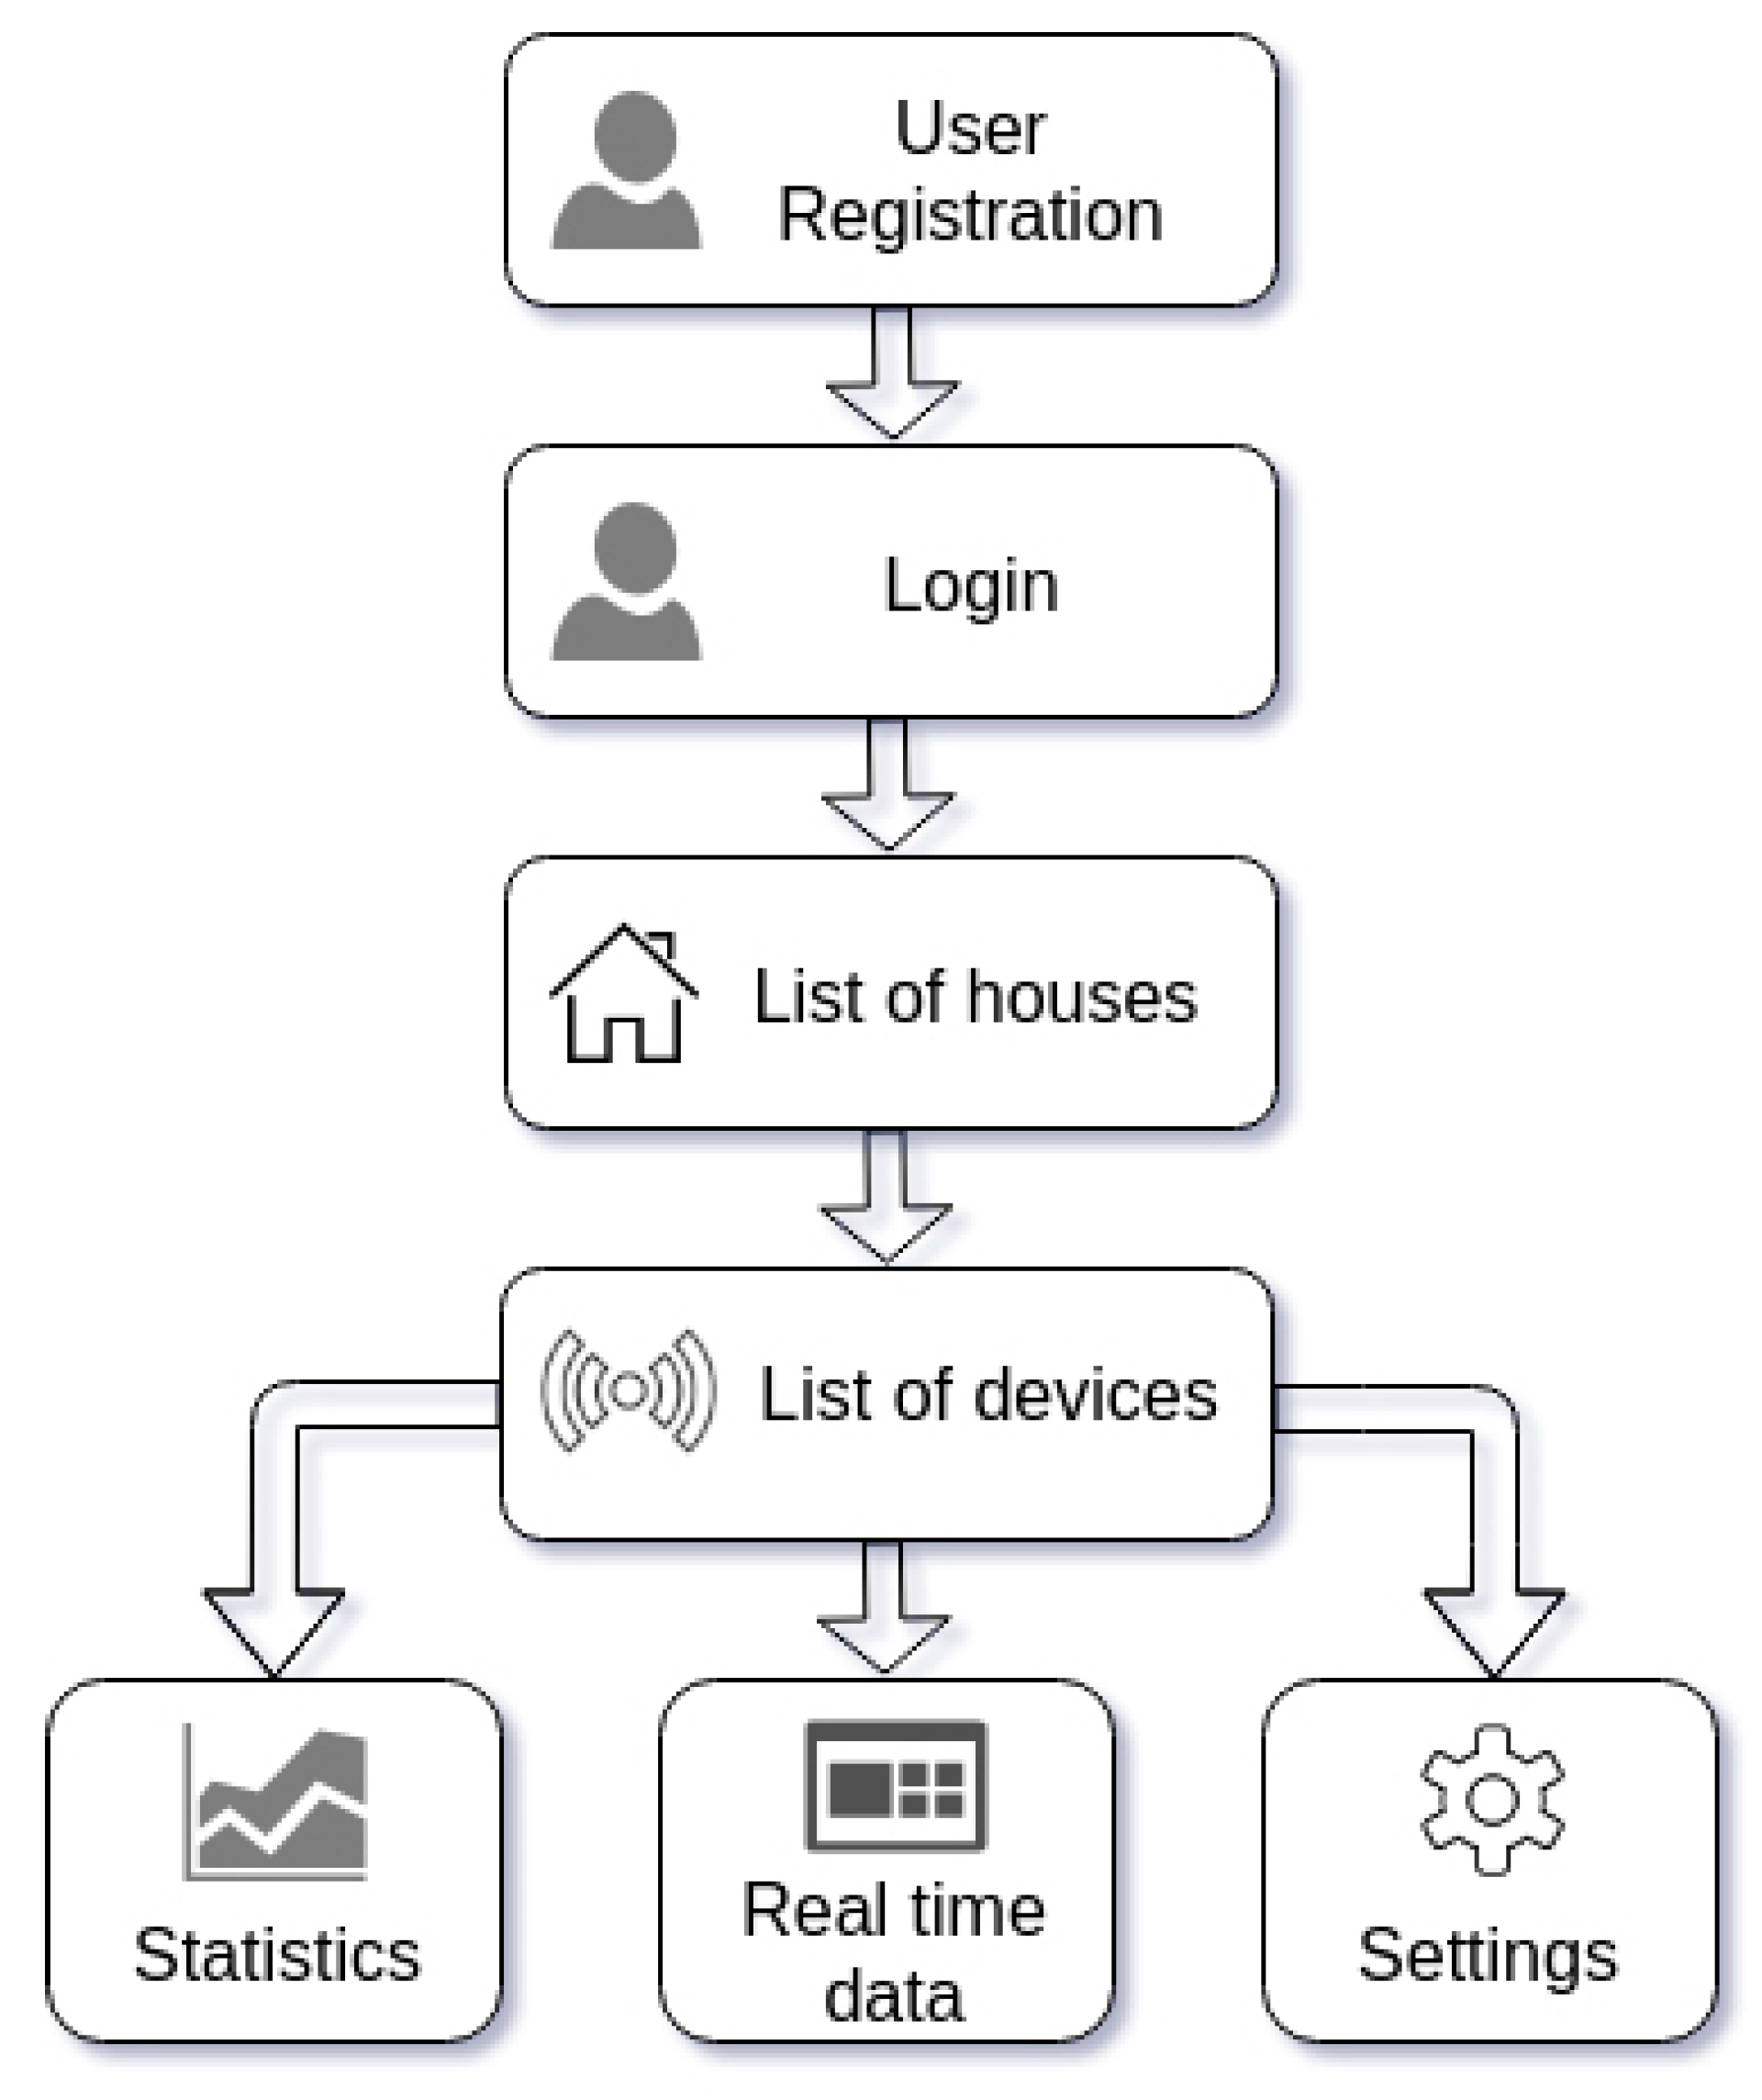
Figure 5 shows the developed mobile app navigation flow between main app components.
2.4. Indoor Air Quality Index Computation
Considering the variables monitored in the proposed system, each has its own specific unit of measurement. Hence, relative humidity is measured in percentages [%], temperature is measured on the Celsius scale [°C], the concentration of CO2 and of TVOC are converted into parts per million [ppm]. If these values can be easily read by the expert user profile, the non-expert user may have difficulty in understanding these results. For instance, if the concentration of CO2 is 700 ppm, it’s hard to understand if the air quality is good or not when users are not experts on specific standards. For this reason, it is necessary to make the measurements more readable and understandable for people who do not have specific background knowledge. To face this challenge, the developed system labels the concentration of CO2 and of the other considered variables by using intuitive categories (good, bad, very bad, etc.) in line with the Air Quality Index (AQI) approach. This index was developed by the United States Environmental Protection Agency (US EPA) in 2006 focusing on outdoor conditions [33]. Nevertheless, an indoor version of this index was recently presented [34] and is here adopted to compute the IAQ level. The AQI approach converts measurements of different pollutants in consideration of their specific unit of measurement into the AQI code—see for example [33,35]. In particular, for the purpose of this study, the break point table for indoor environment IAQI classification reported in [34] was adopted—see Table 1. IAQI is, in fact, a numerical classification scale ranging from 100 (perfect condition) to 0 (worst condition) and also a color code, which divides the numerical classification into several specific ranges (good, moderate, unhealthy, hazardous). AQI index describes not only the pollution level but also the potential risk level for people’s health, such as was illustrated in [33]. The adopted threshold values were defined in accordance with reference standards [34]. For example, for carbon dioxide, the same ranges are proposed by [36], while 1000 ppm is assumed as a limit by [37], which also introduces a lower class for optimal (below 800 ppm), by [38], and is used as reference by [21]. ASHRAE standard 62-1989 also consider 1000 ppm as target concentration level even if it does not consider this threshold as a standard requirement—see also [39]. Furthermore, 1500 ppm is a breakpoint for schools in the UK [40]. Nevertheless, potential variations can be considered for local standard adaptations or to adopt specific thresholds. For example, the temperature thresholds can follow an adaptive comfort approach when the system works in non-conditioned buildings—see for example [41]. In addition, the IAQ standard EN 13,779 classifies the CO2-related IAQ level into four classes while considering a carbon dioxide concentration which is above that of the outdoor air (i) less than 400 ppm, (ii) in the range 400–600 ppm, (iii) between 600–1000 ppm, and (iv) above 1000. The same standard suggests typical CO2 outdoor air ranging from 350 ppm in rural areas to 450 ppm in city centres. AS is illustrated in Table 1, the IAQI values and status are divided into four categories: Good (100–76), Moderate (75–51), Unhealthy (50–26) and Hazardous (25–0). Depending on different IAQI values for each pollutant, proper control strategies will be adopted to improve IAQ.
Formulas to Support System Control and Analysis
The proposed IoT system uses simple well-known expressions to support the decision process of the algorithm. In order to define the proper action to control the ventilation system, two main parameters are considered: the time span chosen to reach a sufficient IAQ level (ventilation system operation time) and the airflow rate. Users will directly set the optimal time threshold to reach a good IAQ level by activating the ventilative system and thus releasing pollutants from the inner environment. For this reason, only the airflow rate has to be set automatically by the platform. Firstly, the ventilation rate Q [m3/s] needs to be calculated. Referring to [21,22,23,42], the following expressions—see Equations (1) and (2)—were adopted to calculate the required Q to obtain, within the set time, sufficient pollutant dilution.
where t is the ventilation time [s], V is the zone volume (e.g., the prototype box) [m3], Q is the ventilation rate [m3/s], and var is the considered variable (temperature [°C] or relative humidity [%]). Subscripts in refers to current indoor environmental conditions, and out refers to current environmental (outdoor) conditions, while final refers to the final required condition.
where C is the concentration value of the considered pollutant (TVOC or CO2) expressed in [ppm], G is the indoor generation rate of pollutant [m3/h], Q the ventilation rate in [m3/h], and t the ventilation time in [h]. Furthermore, V is the zone volume [m3], while subscripts are the same as in Equation (1). Nevertheless, the pollutant emission rate is not commonly known, especially if human occupancy is not fixed or monitored. For this reason, for the sample prototype box, the generation rate of CO2 is set to zero, and the generating rate G for VOC is negligible, fixed emission sources not being present. The adopted testing approach focuses on dilution of high level of quickly produced pollutants to demonstrate the effect of the system under stressful conditions rather than under the continuous production of a small amount of them, such as under fixed human occupancy profiles where CO2 production can be predicted. In fact, when pollutants are placed inside the prototype box, the generation rate will vary all the time, and it is hard to calculate the correct value, unlike under real conditions. In this case, the generation rate is not considered for further analysis. On the other hand, calculations are based on conditions where indoor and outdoor air mix to reach the desired indoor IAQ in the given time.
For temperature, CO2 and TVOC, the required ventilation rate Q can be calculated directly by applying Equations (1) and (2). Nevertheless, for relative humidity (RH), the measurements should be converted before performing calculations because RH is a function of temperature, atmospheric pressure, and moisture content (X) [kg/kg]. For this reason, indoor and outdoor measured values cannot be directly compared to define the airflow needed to reach the desired threshold, considering that indoor temperature and/or moisture content could be different from those outdoors. Relative humidity is defined as the ratio of the water vapour pressure (Pw) [Pa] to the saturation water vapor pressure (Pws) [Pa] at a given temperature:
Psychrometric expressions are used to define saturation water vapour, water vapour, and moisture content. Cetiat tables of the humid air or other comparable approaches may be used—see for example [43].
where ϑ is the monitored air temperature [°C], while A, B, and C are constants. In the −0 °C … +40 °C domain A, B and C were assumed to be respectively 17.438, 239.78, and 6.4147, in line with Cetiat suggestions [43]. The moisture content may be calculated according to the well-known expression (5):
The reverse formula (6) allows us to estimate the RH by knowing the air moisture content and the air temperature. This expression can be used to roughly estimate the RH that the outlet air would reach if sensibility treated, such as under the effect of high efficiency heat recovery systems, like the ones installed in passivehauses.
Then the required ventilation rate for relative humidity is calculated through Equation (1) by using indoor measurement and the converted outdoor measurement. According to these formulas, the required ventilation rate for each pollutant can be calculated within the expected ventilation time.
According to the required ventilation rate Q [m3/s], it is possible to define the required air velocity, qfan, to be performed by the fan [m/s]. This can be calculated by applying the following expression (7):
where Afan is the net opening area of the fan [m2].
To control the fan speed, different PWM signals should be fed to the device (fan). Pulse width modulation (PWM) is a method which reduces the average power delivered by an electrical signal. The delivered average power is controlled by changing the duration of the pulse, which leads to different duty cycles. The higher the duty cycle, the larger stronger the average power [44]. In order to feed a proper PWM signal to the fan, the relationship between the set PWM and the produced air velocity is very important. An anemometer was employed to correlate the produced air velocity of the fan with different PWM signals in the prototype box. Figure 6 shows the values obtained, while the conversion between the fan air velocity and PWM signal is achieved based on the plotted graph.
3. Design and Implementation
3.1. System Architecture
The developed IoT system consists of four main levels as is shown in Figure 7. The User Interface level is represented by the mobile application that manages all devices and configurations, and furthermore displays sensor data. The Backend level provides functionalities of data storage, APIs for platform management, analytics, and real time sensor measurement storage. Meanwhile, the gateway level is responsible for controlling and accessing the hardware level and connecting it with the backend. On this level, control strategies are implemented to process the environmental data and apply algorithms to calculate the IAQI index and control fan operation.
3.2. Hardware
3.2.1. Wired and Wireless Connections
For the main unit (Raspberry Pi 3B+), the most used functionalities were the GPIO pins, WiFi, and USB ports. The GPIO pins supporting I2C protocol are used to connect the board with a LCD screen, the screen is employed to show actual indoor conditions (Figure 8c). As regards the software, different Python scripts are run on the board to manage, monitor, control, process, and store data. Moreover, Arduinos are used to collect and pre-process the raw data from sensors while the processed data are further transmitted to the master unit (the Raspberry Pi) through serial communications. Outdoor unit connections are shown in Figure 8a. Through a pin socket, the fan is supplied up to 12 V DC by an external source and is controlled by one of the PWM pins of the indoor Arduino. It reacts to the master’s order by adjusting the speed signal. The deployment of sensors, fan, and Arduino board for an indoor unit is shown below in Figure 8b.
The WiFi functionality of Raspberry Pi is used to create a hotspot to connect microservices with an external device which runs the mobile application. The application is used to show the state of all the environmental conditions (indoor and outdoor) and to set up the user parameters for the operation of the system.
3.2.2. Working Flowcharts of the Indoor and the Outdoor Units
Figure 9 shows the working flowchart of indoor and outdoor units for raw data acquisition, data pre-processing, and serial communication. Indoor and outdoor units will pre-process sensor readings and transmit these data to the master unit. In the case of the indoor unit, the master unit (Raspberry Pi) sends back the control signal (PWM) in order to achieve the target established by the control strategy (implemented on the master unit) to maintain the indoor air quality at a good level.
3.3. Backend
The backend follows the Microservice architecture—see the backend overview in Figure 10. Therefore, an initial service “Resources/Services catalog” was implemented in order to manage events and data flow between microservices. Initially, each microservice should contact the Resources/Services catalog to get the list of available microservices and find the way to access these resources. The communication between microservices happens through REST and MQTT. As for the databases, the communication is managed through the Mongodb communication tunnel.
3.3.1. Database
The developed system consists of two independent databases based on Mongodb. Each database can be accessed independently through the Mongodb python connector from another microservice. The connection is guaranteed by using TCP on the port 27,017 and by specifying the installation IP address of the database. The two databases are described here below.
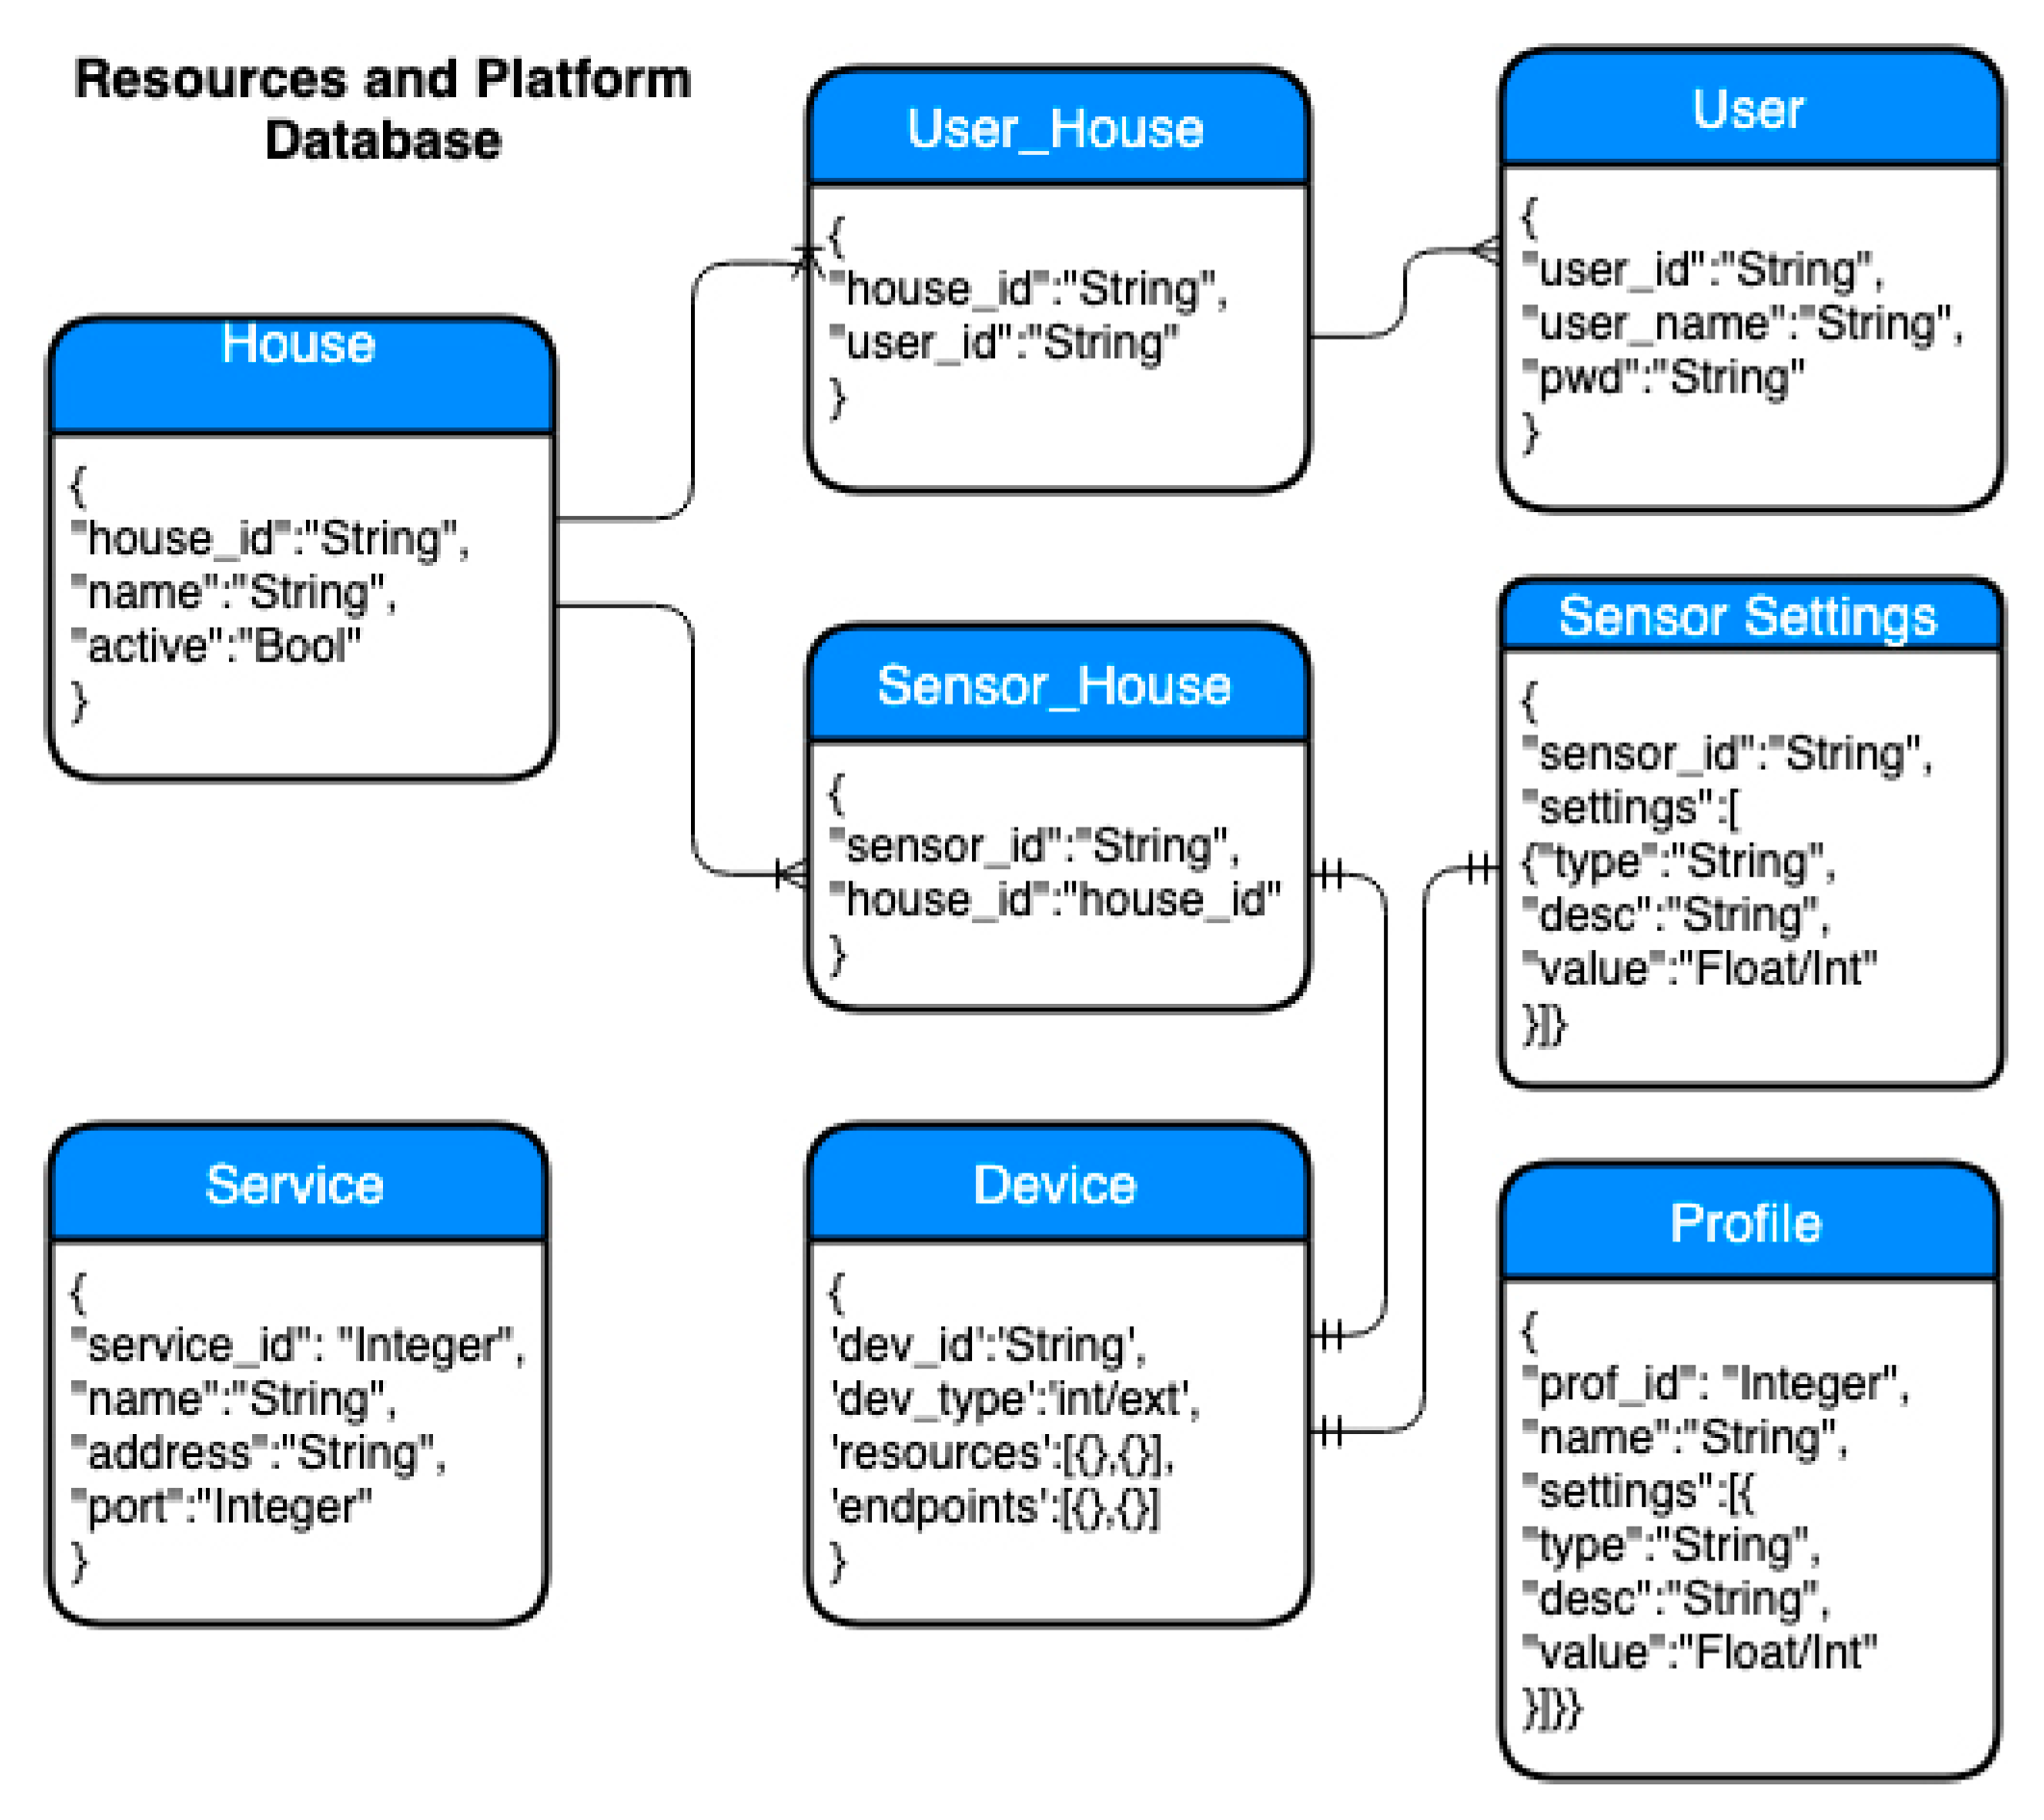
Resources and Platform Database: this database is used to store information about platform services and resources such as mobile application user management, devices, configuration profiles, and available services. The database is schematised in Figure 11. This figure shows the relations and the structure of each collection process. The house collection stores the information about the house/room in which the sensors are installed. The services’ collection stores information about the available system microservices and the related addresses for contact. Profile collection contains predefined room profile(s) of thresholds that provide the best comfort levels. Sensor settings’ collection stores the device configuration(s) and threshold(s) for a selected sensor. Device collection stores the information about a device how to access its resources. Finally, the sensor_house and user_house collections are responsible for defining the parent data collection to which the entity belongs.
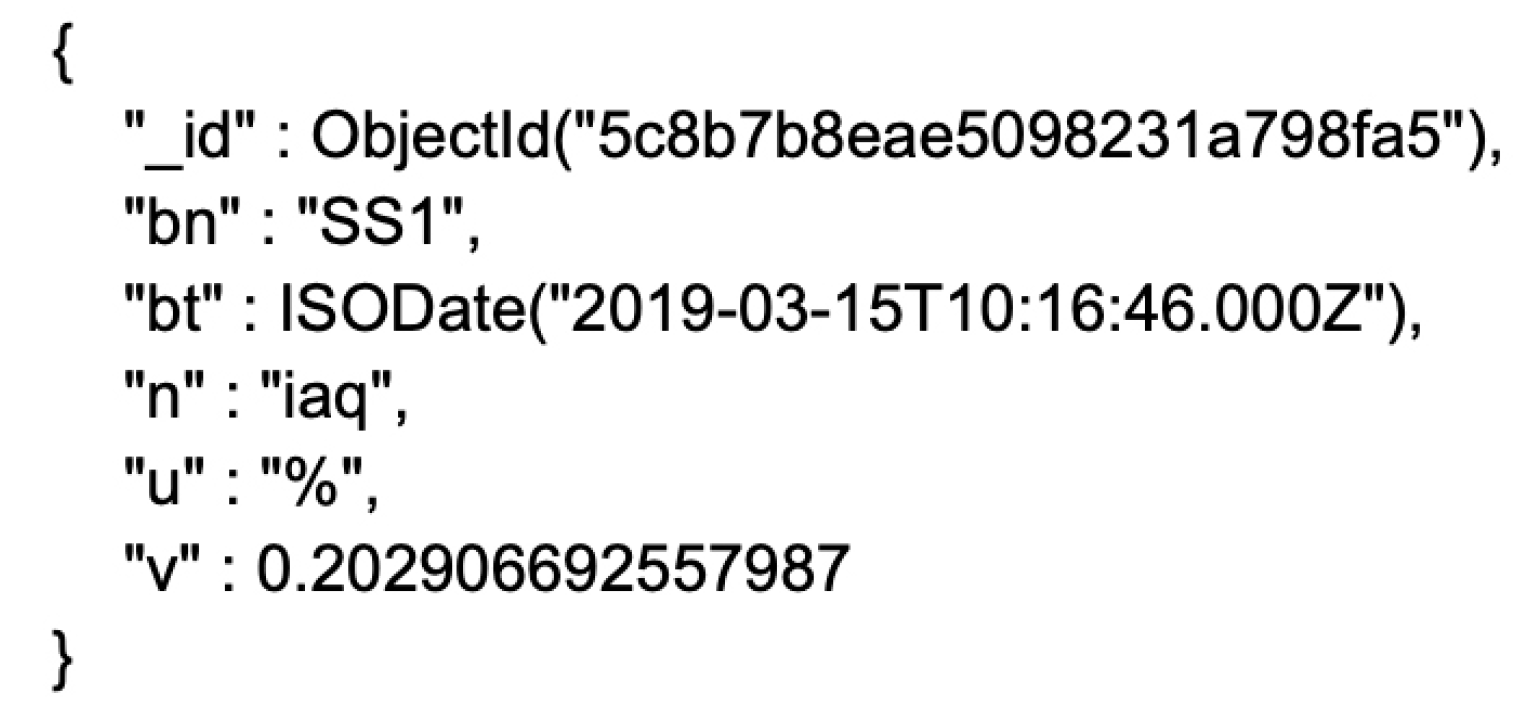
Sensor Data database: this database is used to store all sensor measurements inside the platform. It consists of only one collection called “data”. In this collection, the sensor measurements are stored in a consistent format as shown in Figure 12. The “bn”, “bt”, “n”, “u”, “v” expressions define the sensor id, time of measurement, type, unit and value. This format makes the platform more amenable to the introduction of new sensor types without impacting on the database structure.
3.3.2. Microservices
Microservices are python scripts which run independently and they can be accessed using REST calls provided by cherrypy. In particular, the following list of microservices was implemented.
- Resource and service catalog: the resource and service catalog microservice is the entry point to the system. It mainly provides the functionalities of device management as well as the list of services.
- Readings storage bridge: the main functionality of this microservice is to preprocess the incoming sensor measurement messages and store them in the sensor_readings database. It subscribes MQTT topic “Readings/#”, loads the incoming messages, pre-processes data into the proper format, and stores them in the database.
- Analytics API: this microservice provides sensor measurements from the database to the mobile app. The measurements are filtered by sensor type and aggregated by week or day. Instead of sending all the sensor measurements, the microservice allows us to access average aggregations to return average data value per hour or per minute of the day.
- Platform API: this microservice provides the main functionalities of the mobile app for user, house, and device management.
- Sensor and actuator: on the one hand, the sensor device is running a microservice that reads the measurement from the sensor and publishes it through MQTT to be stored in the database. On the other hand, this microservice requests the configurations and settings from the resource/service catalog.
3.4. Mobile Application
Android Studio IDE is used to develop the mobile application using Java programming language. The application communicates with the backend through a REST API and receives data from the devices through MQTT protocol as it is connected to Raspberry Pi hotspot.
To implement these communications, two libraries were used: Android Asynchronous HTTP Client for REST requests and Paho Java Client for MQTT communication. Furthermore, MP Android Chart library was used for the visualization of the graphs. Furthermore, the list of all mobile application functionalities is given here below.
- Service Catalog setting: during the first access to the app, users must insert the IP address of service catalog, so that the IP address of the platform can be retrieved and the app can connect to this platform. It is possible to access this setting at any time both from the list of houses and from the device list.
- Registration: Users can register themselves by defining username and password.
- Login: users may log into their system. If correct credentials are inserted, the list of profile-connected houses is retrieved.
- House management: the list of houses is the home page of the app. Users can register a new house or access an existing house (based on house id) in their lists.
- Device management: both internal and external devices are listed on the same screen. There are specific buttons to add a new device, to show statistics, and to change settings. During the registration of a device, a room profile (e.g., Kitchen, Bathroom, etc...) based on those available must be chosen. By clicking on an element in the list, the real time data page is visualized.
- Real-Time data visualization: Users can always monitor the quality of the air for both indoor and outdoor sensors. All the readings of a device are shown on a single screen, and different colors give an indication of the pollution levels in the air. This part of the app is based on two user typologies, as mentioned above in the paper. While non-expert users will access a coloured visualization screen which indicates current IAQI status, an expert user interface will show monitored data in consideration of the specific data in the devoted unit of measurement (e.g., ppm for CO2 and TVOC; hPa for pressure; °C for temperature, % for RH). To simplify these, two user profiles are shown one over the other in the current version of the mobile application—see Figure 13a.
- Statistics visualization: statistics for daily or weekly measurements can also be visualized. A spinner menu allows users to choose the specific measurement to be analyzed. See for example Figure 13b.
- Logout: from the main page or from the device page, users can logout from the system and get back to the login page.
3.5. Control Strategy
Depending on different pollution levels, indoor air quality (IAQ) can be improved by activating the mechanical ventilation system to let external air enter the living space. Ventilation time is quite an important parameter to be taken into account for ventilation activity. In fact, it not only affects the efficiency, but also the comfort level of people. If the required ventilation time is very short, the ventilation system could produce strong airflow velocity, which may not be comfortable for people. On the contrary, if the ventilation time is too long, the efficiency of the ventilation system may not be enough to guarantee sufficient pollutant dilution and to avoid stagnation and high pollution exposure. In the proposed system, the expected ventilation time can be set by users through the mobile application, while the fan speed is regulated dynamically with respect to different monitored pollution levels and the set ventilation time.
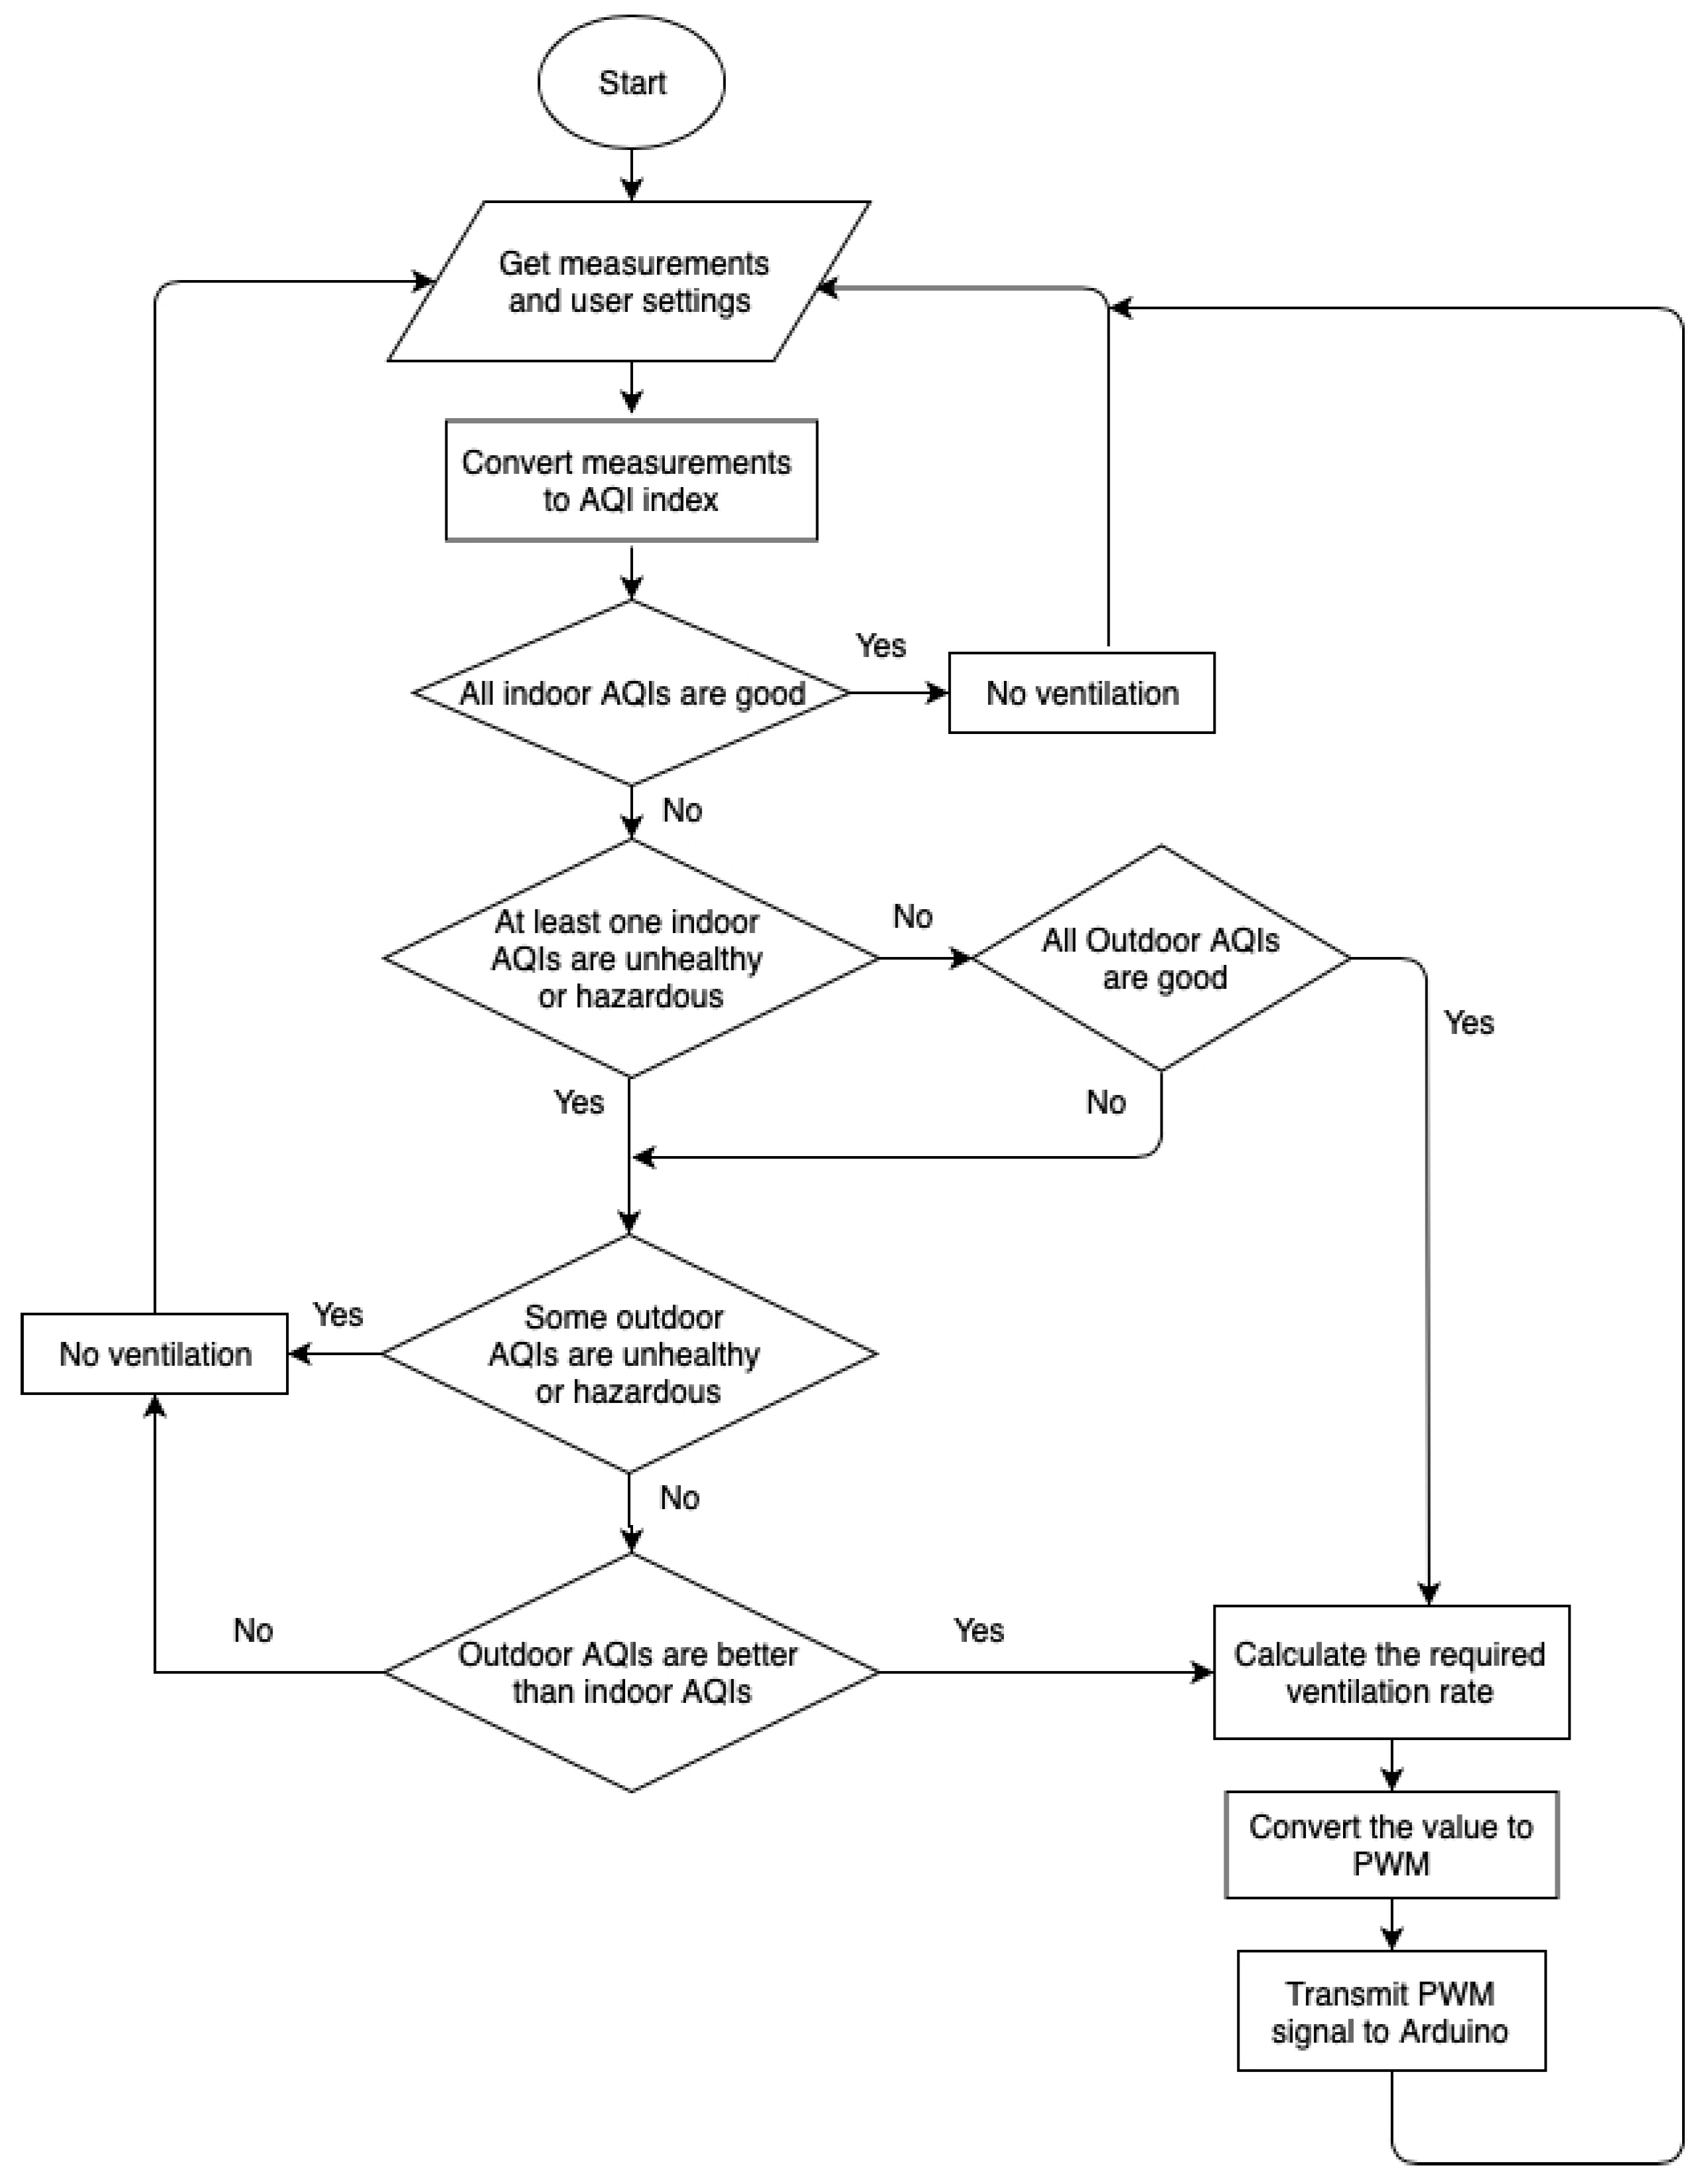
Figure 14 illustrates the ventilation decision process which compares the IAQI indexes of indoor and the outdoor air. If ventilation activity is computed to be necessary (e.g., the prototype box shows a high level of one/more pollutant/s), the calculation process will be activated in order to find the proper ventilation rate in order to set the fan system and dilute pollutants. According to expressions listed in Section 2.4., the system will compute the required ventilation rate for each pollutant. When the system gets different ventilation rates for different pollutants, it always selects the maximum ventilation rate from among these values to prevent insufficient ventilation. According to the selected ventilation rate Q [m3/s], the system calculates the airflow rate [m/s], and then the desired PWM value for fan activation is derived from the corresponding airflow rate by using room characterization—see Figure 6 for the considered prototype box. Finally, the PWM signal is transmitted to indoor units through serial communication to control the action of the fan.
4. Experimental Functioning of the System (TRL 3–4)
This section focuses on proving the feasibility of the developed IoT systems, with special regard to (i) testing single component’ functionalities, (ii) system early-validation in a prototype box which tests the system under high-pollutant concentration condition, and (iii) Prototype box test to check the system’s ability to constantly deal with a series of uncomfortable IAQI conditions in consideration of stressful situations that may arise in buildings, with special regard to residential and small office spaces with no mechanical ventilation systems. All of these tests are conceived to reach a TRL (Technology readiness levels) of 3 to 4, representing the first important step in order to plan for further development of the system.
4.1. Single Components’ Testing
To ensure the proper functioning of each component of the IoT system, several test cases were performed individually for each part. Each test focuses, in fact, on a specific step. The performed test cases are shown in Table 2. After these specific tests, the components were integrated together to check the behavior of each part when included in the whole system.
Firstly, sensors were connected to the Arduinos, and then the sensibility and the performance of each Arduino slave unit was tested with respect to different pollutants. In parallel, the script running on the master unit was probed. The master unit was connected to a laptop to check and correct the issues when they appeared. Furthermore, a wireless connection was created between the mobile application and the master unit to check both outputs of the stand-alone script, and the performance of the application once it got the data.
Following these implementations and tests, all the parts were connected together to perform the final test before deployment. For example, during this phase, one unit was found to be sending incorrect data to the master unit when it was plugged in, due possibly to a production problem in the analog input connectors. The problem was solved by substituting the board.
4.2. Sistem Tests Using a Prototype Box under High-Pollutant Concentrationsusing
After solving these issues, the whole system was deployed in the prototype box to test its efficiency in pollutant dilution when different stress conditions were simulated (e.g., release of TVOC, increase in RH%). The prototype box used for these tests was built in plywood (1.5 cm) and insulated with polystyrene panes (3 cm) which were positioned externally all along the box surface—see Figure 15. The ventilation system is made up of the extractor fan and an inlet mouth with the same net opening area positioned at the bottom of the façade opposite. The net box dimensions are 57 × 60 × 120 cm. Finally, a polycarbonate permanently sealed window for visual inspection is installed (29 × 39 cm).
In Figure 16a the system was tested for relative humidity variations. For this test the prototype box was moved to an external courtyard in a central urban area (North of Italy) position—see Figure 15c. Outdoor conditions were monitored to be 406 ppm of CO2, 0.03 ppm of VOC, 27.2% of RH, and 26.4 °C. The indoor RH level was stressed by boiling a kettle. When the value of relative humidity exceeds the threshold of “good level” for a given amount of time (activation risk time threshold e.g., 30 s), the assisted ventilation system starts working to get back to the “good” level according to the related IAQI index. The test demonstrates that the threshold was reached again within about 150 s, which was 30 s quicker than the expected time.
Then the system was tested under uncomfortable VOC concentration conditions. Very high VOC concentrations were produced by burning a large amount of incense in the prototype box. AS illustrated in Figure 16b, once the ventilation system was activated, the ventilation time to reach the “moderate” IAQI level of VOC was approximately 125 s. Because the fan used was not powerful enough to provide the required level of airflow rate to reach the “good” level under uncomfortable VOC concentration conditions, the system could not bring the level of VOC to a good level within the considered activation time (180 s). Nevertheless, as is illustrated in the Figure, the ‘moderate’ level is reached in the desired time, thus guaranteeing a healthy level of VOC gases.
Both tests showed the correct functioning of the system under typical conditions of high concentration of VOC gases and high relative humidity. The CO2 test was not performed in this phase since CO2 and VOC are treated in a similar manner by the IoT system.
4.3. Prototype Box Continuous Test (Realistic Conditions)
Once the system was completely checked, realistic test cases were performed. During this demonstration phase, different domestic potential conditions were reproduced in the prototype box. To demonstrate the impact of the IoT system, its behavior was shown over a test time of 1 h and during this period several pollutants were placed inside the box to simulate real-life situations, such as a CO2 concentration of about 1000 ppm (a value often found in an occupied room after a period of system deactivation—e.g., a double room with two adults in less than 1 h—adult CO2 production rate of 0.0052 L/s, ASHRAE Standard 62.1 and ASTM D6245 [45]), or a RH% higher than 85% coupled with temperature increase—as may arise in a bathroom after a hot shower. In particular, three pollutants were released in sequence: CO2, VOC, and RH. VOC and RH are produced in the same way as in the tests for high concentration dilution (incense and kettle), while CO2 was generated by burning acetone inside the box. During these tests lower levels of pollution were produced in comparison to high-concentration tests.
Figure 17 shows the results of the monitored indoor conditions expressed in terms of IAQI levels during the entire testing period. Each line indicates the IAQI of a specific pollutant, and each color band represents a different IAQI level based on the classification reported in Table 1. During this test, external measured conditions were almost stable with a CO2 concentration of 400 ppm, a VOC concentration of 0.02 ppm, pressure of 999.73 hPa, a RH% of 24.8%, and a temperature of 31.3 °C. With the exception of temperature, all other outdoor variables reached a good IAQI level.
Firstly, at approximately 4:10 PM (16.15 h), acetone was burned to simulate a potential CO2 concentration of about 1000 ppm. The observed result (Purple Line—IAQI CO2) was an increase in the concentration of CO2 which led to lower IAQI. Once the ventilation system was automatically turned on, the concentration of CO2 decreased drastically. The prototype box was prevented from reaching unhealthy levels of this specific pollutant. The temperature curve (Turquoise Line) showed the impact of the system though this test does not include IAQI temperature control, but rather focuses on on IAQ variables for fan activation.
Secondly, VOCs were produced inside the prototype box (around at 4:25 pm, 16.4 h) to simulate the situation that can be experienced when using some personal hygiene products or simply burning incense. The VOC curve (Blue Line—IAQI VOC) showed that this pollutant concentration did not reach an unhealthy level. However, once the fan was turned on, the VOC level improved quickly from moderate to good. The performance of the system was then satisfactory
Finally, the system was tested by placing a humidifier to simulate the conditions of a bathroom during and after a shower with hot water (see approximately at 4:40 pm, 16.7 h). As is to be expected the IAQI of relative humidity decreases when humidity is produced (Orange Line—IAQI Humidity) thus activating the fan which is controlled by the system to bring this index back again to a good IAQI Level. However, the IAQI of VOC is also reduced. In this specific case, this the increase in VOC is thought to be related to the previous VOC emission the wood in the internal walls of the prototype box may have absorbed a portion of the contaminants previously presented in the air, and, with the increase in water vapor, these are probably released. Nevertheless, in spite of being subject to all different pollutants independently, the system acted in the expected way. The levels of all pollutants were controlled through effective ventilation to provide a healthy indoor environment by correctly setting the fan operation.
Figure 18 shows some pictures taken during this experiment and illustrates both the monitored values on the app and the release of pollution inside the box.
5. Discussion
This paper describes the development of a real-time IoT platform to monitor indoor air quality (CO2, TVOC, Temperature, and Relative Humidity) and optimize it air exchanges. The proposed system is primary conceived to be used in residential spaces and in small offices to guarantee IAQ levels. Even if the proposed control methodology can be adapted to existing mechanical ventilation systems, by defining the minimal amount of required air exchanges for IAQ in accordance with internal monitored values, comfort thresholds, and external monitored conditions, its main application is in those spaces where no mechanical ventilation systems are installed. The low cost of this solution and the ease with which it can be integrated into buildings, e.g., not needing distribution channels, makes the system adaptable to existing and new buildings. Unlike other systems, the proposed one is a fully IoT solution in which each unit (e.g., external monitoring, internal monitoring and fan activation) is connected to the cloud infrastructure.
The modularity of this system is, in fact, very important, since it allows us to include more units and to be open to future improvements, thus providing adaptability and failure tolerance to the system. In addition, the IoT infrastructure can easily be adapted to be used in controlling current commercial detached mechanical ventilation systems. Furthermore, the proposed solution adopts the IAQI to indicate pollutant levels and by developing a mobile application, it raises user awareness of indoor air conditions, supplying a user-friendly and graphic interface, which makes the user a protagonist and guarantees user wellness. Early results from experimental tests show that the system can handle indoor air quality and keep it at good levels, by controlling indoor pollutants.
Future developments of this system are planned, including the possibility to implement machine-learning approaches to make the control strategy more effective and to forecast outdoor air quality evolution to adjust the ventilation schedule and prevent critical environmental conditions. Another important aspect to upgrade this system in future is its potential integration with existing models that define the passive moisture sorption/desorption potential of materials, by assuming, for example, the approaches to moisture buffering effects on IAQ proposed in Ref. [45,46,47]. In addition, the system has already been conceived to define different priorities for each pollutant in order to define personalized activation plans for each connected ventilation unit (e.g., fan). Specific analyses on this topic will be conducted in future. For example, target CO2 values may be differentiated in accordance with indoor activities, such as between an adult’s bedroom and a child’s one. Moreover, the possibility to control each pollutant threshold independently will also be tested in real operational conditions. For example, CO2 may be controlled to reach a good IAQI level, while RH% maintained at a moderate level. This can be done by acting on the settings of the mobile user interface—see Figure 5. It should be noted that, at present, the system has not been implemented to consider the IAQI temperature index when controlling fan activation, while in the future, additional considerations about thermal comfort thresholds and ventilative cooling modes will be included in order to give users more customizable options when setting the system. As regards cooling, the system will be implemented to guarantee a proper fan-driven ventilative cooling action. In this case, the system will be activated when outdoor temperatures are lower than those indoor in free-running buildings, or below the comfort threshold in conditioned spaces, see for example [27]. As regards heating, the system may be implemented in future to define a balance-control algorithm. This algorithm will consider ventilation requirements for acceptable pollutant levels, and heat losses through ventilation. With respect to fixed standardized air ventilation rates, the proposed system allows us to activate the fan in winter only to move the monitored-based airflow by supporting a smart ventilation approach which prevents over-ventilation. Nevertheless, an extended analysis is planned at a further developmental stage, which will relate IAQI index requirements and ventilation energy losses considering internal-external differences to suggest optimal balance points.
Finally, separate sensors included in the indoor/outdoor units should be integrated to a single circuit board to achieve high integration and guarantee the application of the Plug and Play style. The code has already been prepared for this further step, as it is the list of connected devices read by the device connector using the service catalog. In this way, the system is already ready to work on different pollutant sources in each room, e.g., by controlling the IAQI indexes of RH% in a bathroom, or CO2 and TVOC in a living room. The elaborated IoT infrastructure is primed to be able to take into consideration additional pollutants. At present, the solution system has reached a TRL of 3 to 4, while higher levels of TRL are expected to be reached during further developmental stages. In particular, it is planned to test the system in real environments, with special regard to school rooms, including a comparison with a room which is not equipped with the IoT system, both in terms of heat loss due to ventilation and the ability to maintain the room in the best IAQI class. These further tests, in fact, will include validations in cold winter conditions. It must be remembered, however, that, this second developmental phase is subject to devoted funding being available to raise the system from a TRL 3–4 to a TRL 6.
6. Conclusions
The paper presents a new IoT system composed of different units (slaves) which are connected with the cloud and that communicate with a building control unit (master). The system focuses on both monitoring IAQ levels and guaranteeing IAQ comfort levels in building spaces at a low cost. The approach is fully scalable, and is able to connect, for example, different indoor microcontroller units to monitor the IAQI levels and activate independently different connected ventilation units.
The main outcomes are listed here below:
- The definition of a low-cost IoT system to monitor and guarantee optimal IAQ levels in building spaces without the need to install large mechanical ventilation systems;
- The proposed system is able to balance indoor and outdoor IAQ levels to define the proper airflow rate to reach the desired indoor IAQI index value;
- The system in the meantime, is able to process different pollutant sources by monitoring different sensors, and consequently set the minimal air exchange rate to guarantee optimal IAQI levels for all pollutants (Section 4.3). This approach is of course scaled in order to consider a different set of pollutants or to include priority lists, by modifying the desired levels of each pollutant independently as confirmed by early tests on single pollutants (Section 4.1 and Section 4.2);
- The adoption of a full IoT infrastructure connecting each unit to the cloud to allow for different control levels and define a fully-scalable platform which is able to connect and control different independent units;
- The system, being based on monitored levels, is able to adapt to specific emission rates, to different environmental conditions, by adjusting the fan speed (PWM);
- The definition of simple user interface by the development of a mobile app, which is able to inform users and permit setting control. Two user interfaces were developed for non-expert users and for expert ones.
Current TRL is 3 to 4 though further developments are planned to implement the proposed solutions in order to develop it till commercialization.
Author Contributions
Conceptualization, G.C.; Data curation, S.C., M.G., M.I. and S.L.; Supervision, G.C.; Writing—original draft, G.C., S.C., M.G., M.I. and S.L.; Writing—review and editing, G.C.; Funding acquisition, G.C.
Funding
This research was co-funded by the 59_ATEN_RSG16CHG.
Acknowledgments
The proposed approach was tested during the Course IP, Master Degree in ICT for Smart Society, Politecnico di Torino, Italy, A.Y. 2018-19, with the support of the LASTIN laboratory, Microclimate section (GC). F. Dovis is thankfully acknowledge for precious suggestions together with C. Ward for language checking.
Conflicts of Interest
The authors declare no conflict of interest. The funders had no role in the design of the study; in the collection, analyses, or interpretation of data; in the writing of the manuscript, or in the decision to publish the results.
References
- EPA. Introduction to Indoor Air Quality. Available online: https://www.epa.gov/indoor-air-quality-iaq/introduction-indoor-air-quality (accessed on 25 July 2019).
- EPA. Building Air Quality. Action Plan; EPA 402-K-98-001; DHHS (NIOSH) No. 98-123m; EPA-NIOSH: Cincinnati, OH, USA, 1998. Available online: https://www.epa.gov/sites/production/files/2014-08/documents/baqactionplan.pdf (accessed on 25 July 2019).
- Grün, G.; Urlaub, S. Towards an Identification of European Indoor Environments’ Impact on Health and Performance—Homes and Schools; Fraunhofer-Institut für Bauphysik IBP: Stuttgart, Germany, 2014. [Google Scholar]
- WHO Europe. WHO Guidelines for Indoor Air Quality: Dampness and Mould; World Health Organization, Regional Office for Europe: Copenhagen, Denmark, 2009; ISBN 7989289041683. [Google Scholar]
- Prüss-Ustün, A.; Wolf, J.; Corvalán, C.; Bos, R.; Neira, M. Preventing Diseases through Healthy Environments: A Global Assessment of the Burden of Disease from Environmental Risks; World Health Organization: Geneva, Switzerland, 2016; ISBN 978 92 4 156519 6. [Google Scholar]
- Passive House Institute. Available online: https://passivehouse.com/index.html (accessed on 8 July 2019).
- Consoli, A.; Costanzo, V.; Evola, G.; Marletta, L. Refurbishing an existing apartment block in Mediterranean climate: Towards the Passivhaus standard. Energy Procedia 2017, 111, 397–406. [Google Scholar] [CrossRef]
- Gross, A.; Mocho, P.; Plaisance, H.; Cantau, C.; Kinadjian, N.; Yrieix, C.; Desauziers, V. Assessment of VOCs material/air exchanges of building products using the DOSEC®-SPME method. Energy Procedia 2017, 122, 367–372. [Google Scholar] [CrossRef]
- WHO Europe. Air Quality Guidelines. Global Update 2005—Particulate Matter, Ozone, Nitrogen Dioxide and Sulfur Dioxide; World Health Organization, Regional Office for Europe: Copenhagen, Denmark, 2006. [Google Scholar]
- WHO. Indoor Air Quality Guidelines: Household Fuel Combustion; World Health Organization: Geneva, Switzerland, 2014; ISBN 9789241548878. [Google Scholar]
- WHO Europe. WHO Guidelines for Indoor Air Quality: Selected Pollutants; World Health Organization, Regional Office for Europe: Copenhagen, Denmark, 2010; ISBN 9789289002134. [Google Scholar]
- Allen, J.G.; MacNaughton, P.; Satish, U.; Santanam, S.; Vallarino, J.; Spengler, J.D. Associations of Cognitive Function Scores with Carbon Dioxide, Ventilation, and Volatile Organic Compound Exposures in Office Workers: A Controlled Exposure Study of Green and Conventional Office Environments. Environ. Health Perspect. 2016, 124, 805–812. [Google Scholar] [CrossRef] [PubMed] [Green Version]
- Arundel, A.V.; Sterling, E.M.; Biggin, J.H.; Sterling, T.D. Indirect health effects of relative humidity in indoor environments. Environ. Health Perspect. 1986, 65, 351–361. [Google Scholar] [CrossRef] [PubMed]
- Chiesa, G. Data, BigData and smart cities. Considerations and case study on environmental monitoring. Techne 2014, 8, 81–89. [Google Scholar] [CrossRef]
- Chiesa, G. Explicit-digital design practice and possible areas of implication. Techne 2017, 13, 236–242. [Google Scholar] [CrossRef]
- Netatmo Weathermap. Available online: https://weathermap.netatmo.com/ (accessed on 26 July 2019).
- Libelium. Smart Gases Pro: Technical Guide; Waspmote. Document, Version 7.6; Libelium Comunicaciones Distribuidas S.L.: Zaragoza, Spain, 2019; 119p, Available online: http://www.libelium.com/downloads/documentation/gases_sensor_board_pro.pdf (accessed on 17 October 2019).
- Libelium. Smart City Pro: Technical Guide; Waspmote. Document Version 7.6; Libelium Comunicaciones Distribuidas S.L.: Zaragoza, Spain, 2019; 96p, Available online: http://www.libelium.com/downloads/documentation/smart_cities_pro_sensor_board.pdf (accessed on 16 October 2019).
- Mohieddine Benammar, M.; Abdaoui, A.; Sabbir, H.M.; Ahmad, S.H.M.; Touati, F.; Kadri, A. A modular IoT platform for real-time indoor air quality monitoring. Sensors 2018, 18, 581. [Google Scholar] [CrossRef]
- Sun, Z.; Wang, S.; Ma, Z. In-situ implementation and validation of a CO2-based adaptive demand-controlled ventilation strategy in a multi-zone office building. Build. Environ. 2011, 46, 124–133. [Google Scholar] [CrossRef]
- Shin, M.S.; Rhee, K.N.; Lee, E.T.; Jung, G.J. Performance evaluation of CO2-based ventilation control to reduce CO2 concentration and condensation risk in residential buildings. Build. Environ. 2018, 142, 451–463. [Google Scholar] [CrossRef]
- Zucker, G.; Sporr, A.; Garrido-Marijuan, A.; Ferhatbegovic, T.; Hofmann, R. A ventilation system controller based on pressure-drop and CO2 models. Energy Build. 2017, 155, 378–389. [Google Scholar] [CrossRef]
- Carrilho, J.D.; Mateus, M.; Batterman, S.; Gameiro da Silva, M. Air exchange rates from atmospheric CO2 daily cycle. Energy Build 2015, 92, 188–194. [Google Scholar] [CrossRef] [PubMed]
- Costanzo, V.; Yao, R.; Xu, T.; Xiong, J.; Zhang, Q.; Li, B. Natural ventilation potential for residential buildings in a densely built-up and highly polluted environment. A case study. Renew. Energy 2019, 138, 340–353. [Google Scholar] [CrossRef]
- RENSON Mechanical Ventilation. Available online: https://www.renson.eu/gd-gb/products/ventilation/ mechanical-ventilation (accessed on 26 July 2019).
- Holzer, P.; Psomas, T. (Eds.) Ventilative Cooling Sourcebook; IEA EBC Annex 62; Aalborg University: Aalborg, Danmark, 2018; ISBN 87-91606-37-3. [Google Scholar]
- Heiselberg, P. (Ed.) Ventilative Cooling Design Guide; IEA EBC Annex 62; Aalborg University: Aalborg, Danmark, 2018; ISBN 87-91606-38-1. [Google Scholar]
- CherryPy. Available online: https://cherrypy.org/ (accessed on 26 July 2019).
- MQTT. Available online: http://mqtt.org/ (accessed on 26 July 2019).
- Eclipse Mosquitto. An Open Source MQTT Broker. Available online: https://mosquitto.org/ (accessed on 26 July 2019).
- MongoDB. Available online: https://www.mongodb.com/ (accessed on 26 July 2019).
- Bosch. BME680 Datasheet. Available online: https://cdn-shop.adafruit.com/product-files/3660/BME680.pdf (accessed on 16 September 2019).
- U.S. Environmental Protection Agency (USEPA). Guidelines for Reporting of Daily Air Quality- Air Quality Index (AQI); Series EPA-454/B-06-001; U.S. Environmental Protection Agency (USEPA): Research Trangle Park, NC, USA, 2006.
- Saad, S.M.; Shakaff, A.Y.M.; Saad, A.R.M.; Yusof, A.M.; Andrew, A.M.; Zakaria, A.; Adom, H. Development of indoor environmental index: Air quality index and thermal comfort index. AIP Conf. Proc. 2017, 1808, 020043. [Google Scholar] [CrossRef]
- Nigam, S.; Rao, B.P.S.; Kumar, N.; Mhaisalkar, V.A. Air Quality Index—A Comparative Study for Assessing the Status of Air Quality. Res. J. Eng. Technol. 2015, 6, 267–274. [Google Scholar] [CrossRef]
- Applied Sensor. Ventilation Energy Savings While Maintaining Premium Air Quality; Applied Sensor: Reutlingen, Germany, 2013. [Google Scholar]
- Environmental Bureau, Environmental Protection Department. Chapter 4: Government initiatives to improve indoor air quality. In Director of Audit; Report No. 56; Audit Commission: Hong Kong, China, 2011. [Google Scholar]
- Department of Occupational Safety and Health. Industry Code of Practice on Indoor Air Quality 2010; Ministry of Human Resources: Putrajaya, Malaysia, 2010; ISBN 983201471-3. Available online: http://www.dosh.gov.my/index.php/legislation/codes-of-practice/chemical-management (accessed on 25 July 2019).
- ASHRAE. Ref. CO2 requirements in 6.1.3 Ventilation Requirements. In Interpretations for Standard 62-1989; ASHRAE: Atlanta, GA, USA, 1995; Interpretation 62-1989-20. [Google Scholar]
- Department for Education. Guidelines on Ventilation, Thermal Comfort and Indoor Air Quality in Schools; Department for Education: London, UK, 2016. [Google Scholar]
- Nicol, F.; Humphreys, M.; Roaf, S. Adaptive Thermal Comfort: Principles and Practice; Earthscan-Routledge: London, UK, 2012. [Google Scholar] [CrossRef]
- Chiesa, G.; Grosso, M.; Bogni, A.; Garavaglia, G. Passive downdraught evaporative cooling system integration in existing residential building typologies: A case study. Energy Procedia 2017, 111, 599–608. [Google Scholar] [CrossRef]
- Cetiat. Tables de l’Air Humide; CETIAT: Villeurbanne, France, 1976. [Google Scholar]
- Patel, M.A.; Patel, A.R.; Vyas, D.R.; Patel, K.M. Use of PWM techniques for power quality improvement. Int. J. Recent Trends Eng. 2009, 1, 99–102. [Google Scholar]
- Di Giuseppe, E.; D’Orazio, M. Moisture buffering active devices for indoor humidity control: Preliminary experimental evaluations. Energy Procedia 2014, 64, 42–51. [Google Scholar] [CrossRef]
- Balocco, C.; Petrone, G. Heat and moisture transfer investigation of surface building materials. Math. Model. Eng. Probl. 2018, 5, 146–152. [Google Scholar] [CrossRef]
- Salonvaara, M.; Ojanen, T.; Holm, A.; Künzel, H.M.; Karagiozis, A.K. Moisture buffering effects on indoor air quality. Experimental and Simulation Results. In Proceedings of the Buildings IX: Thermal Performance of Exterior Envelopes of Whole Buildings International Conference, ASHRAE, Atlanta, GA, USA, December 2004. [Google Scholar]
Figure 1.
Overview of the developed system, considering the sample test case.

Figure 2.
(a) a view of the master unit used (Raspberry Pi 3B+) (b) one the used slave unit board used (Arduino UNO R3).
Figure 2.
(a) a view of the master unit used (Raspberry Pi 3B+) (b) one the used slave unit board used (Arduino UNO R3).

Figure 3.
(a) Ventilation device used to simulate the controlled ventilation system in the prototyping box used(b) the LCD display screen used for development phases.
Figure 3.
(a) Ventilation device used to simulate the controlled ventilation system in the prototyping box used(b) the LCD display screen used for development phases.

Figure 4.
(a) the BME680 Temperature, Relative Humidity, Barometric pressure, and TVOC (Total Volatile Organic Compounds) gas sensor used; (b) the used Gravity Analog CO2 gas sensor used.
Figure 4.
(a) the BME680 Temperature, Relative Humidity, Barometric pressure, and TVOC (Total Volatile Organic Compounds) gas sensor used; (b) the used Gravity Analog CO2 gas sensor used.

Figure 5.
Mobile app navigation map.

Figure 6.
The relation between pulse width modulation (PWM) and air velocity measured in the prototype box.
Figure 6.
The relation between pulse width modulation (PWM) and air velocity measured in the prototype box.

Figure 7.
The four defined Backend levels.

Figure 8.
(a) Outdoor unit hardware connections; (b) indoor unit hardware connections; (c) raspberry Pi connection (master unit).
Figure 8.
(a) Outdoor unit hardware connections; (b) indoor unit hardware connections; (c) raspberry Pi connection (master unit).

Figure 9.
Embedded software flowcharts (a) Indoor unit processing flowchart; (b) outdoor unit processing flowchart.
Figure 9.
Embedded software flowcharts (a) Indoor unit processing flowchart; (b) outdoor unit processing flowchart.

Figure 10.
Backend overview.

Figure 11.
Resources and Platform database schematic view.

Figure 12.
Measurements data structure.

Figure 13.
Mobile application screenshots: (a) real-time visualization, at the top the not-expert user view, at the bottom the expert user view; (b) Statistics visualization.
Figure 13.
Mobile application screenshots: (a) real-time visualization, at the top the not-expert user view, at the bottom the expert user view; (b) Statistics visualization.

Figure 14.
Flowchart of the analysis algorithm.

Figure 15.
(a) The prototype box (note that to take this picture the inspection-side was removed); (b) box interior view (detail); (c) the prototype box in the testing location with inspection-side removed.
Figure 15.
(a) The prototype box (note that to take this picture the inspection-side was removed); (b) box interior view (detail); (c) the prototype box in the testing location with inspection-side removed.

Figure 16.
Pollution tests: (a) relative humidity evolution over time; (b) Volatile Organic Compounds (VOC) gases concentration over time.
Figure 16.
Pollution tests: (a) relative humidity evolution over time; (b) Volatile Organic Compounds (VOC) gases concentration over time.

Figure 17.
System evolution under different pollutants.

Figure 18.
Test conditions and related monitored level of Indoor Air Quality Index (IAQI) on the developed app at the beginning of fan activation and immediately after it being turned off considering (a) CO2; (b) VOC; and (c) RH. Picture are taken though the inspection not-openable window.
Figure 18.
Test conditions and related monitored level of Indoor Air Quality Index (IAQI) on the developed app at the beginning of fan activation and immediately after it being turned off considering (a) CO2; (b) VOC; and (c) RH. Picture are taken though the inspection not-openable window.


Table 1.
Classification scale adopted for relative humidity, temperature, CO2, and TVOC detected levels. The considered thresholds are based on [34], but are in line with reference standards. Potential variations due to local standards may be included by varying specific variable ranges acting on the user interface setting function.
| CO2 [ppm] | VOC [ppm] | Temperature [°C] | Relative Humidity [%] | IAQI Index | IAQI Status |
|---|---|---|---|---|---|
| 340–600 | 0.000–0.087 | 20.0–26.0 | 40.0–70.0 | 100–76 | Good |
| 601–1000 | 0.088–0.261 | 26.1–29.0 | 70.1–80.0 | 75–51 | Moderate |
| 1001–1500 | 0.262–0.430 | 29.1–39.1 | 80.1–90.0 | 51–26 | Unhealthy |
| 1500–5000 | 0.431–3000 | 39.1–45.0 | 90.1–100.0 | 25–0 | Hazardous |
Table 2.
Test cases for single components’ testing.
| No. | Test Case | Expected Results | Pass/Fail |
|---|---|---|---|
| 1 | Hotspot and bootup scripts | Hotspot and system scripts start automatically | Pass |
| 2 | Automatic restarting in case of hardware failure | The hardware scripts should return if hardware is reconnected | Pass |
| 3 | Storage of sensor data in the database | The sensor readings should appear on the database | Pass |
| 4 | Real time sensor reading on the mobile app | The sensor readings should be received through MQTT on the mobile app and be displayed accordingly | Pass |
| 5 | CO2 sensor reading | Test on different environmental conditions | Pass |
| 6 | VOC sensor reading | Test on different environmental conditions | Pass |
| 7 | Humidity sensor reading | Test on different environmental conditions | Pass |
| 8 | Temperature sensor reading | Test on different environmental conditions | Pass |
| 9 | Fan actuation | Fan should turn on with the correct speed from the actuation function (tested for all pollutants independently) | Pass |
| 10 | External unhealthy conditions stop fan activation | The fan should turn off and prevent pollutants immission | Pass |
© 2019 by the authors. Licensee MDPI, Basel, Switzerland. This article is an open access article distributed under the terms and conditions of the Creative Commons Attribution (CC BY) license (http://creativecommons.org/licenses/by/4.0/).
Share and Cite
MDPI and ACS Style
Chiesa, G.; Cesari, S.; Garcia, M.; Issa, M.; Li, S. Multisensor IoT Platform for Optimising IAQ Levels in Buildings through a Smart Ventilation System. Sustainability 2019, 11, 5777. https://0-doi-org.brum.beds.ac.uk/10.3390/su11205777
AMA Style
Chiesa G, Cesari S, Garcia M, Issa M, Li S. Multisensor IoT Platform for Optimising IAQ Levels in Buildings through a Smart Ventilation System. Sustainability. 2019; 11(20):5777. https://0-doi-org.brum.beds.ac.uk/10.3390/su11205777
Chicago/Turabian StyleChiesa, Giacomo, Silvia Cesari, Miguel Garcia, Mohammad Issa, and Shuyang Li. 2019. "Multisensor IoT Platform for Optimising IAQ Levels in Buildings through a Smart Ventilation System" Sustainability 11, no. 20: 5777. https://0-doi-org.brum.beds.ac.uk/10.3390/su11205777
Note that from the first issue of 2016, this journal uses article numbers instead of page numbers. See further details here.