1. Introduction
In recent decades, urban–rural shrinkage has been occurring worldwide, which is a new phenomenon. There are abundant international research results on urban shrinkage, but little attention has been paid to rural shrinkage [
1]. In fact, since the 1950s, with the rapid development of urbanization and industrialization, there have been different rural development processes and problems in various countries around the world. However, these various countries have all experienced rural shrinkage stages, such as declining agricultural status, a sustained outflow of the young and middle-aged population, rural economic recession, and a widening gap between urban and rural areas [
2]. After the establishment of the WTO and the Doha negotiations, Argentina, Brazil, and other countries joined the global agricultural supply system, which intensified the competition of international agricultural products and agricultural overcapacity. Under the intense, lasting, and comprehensive impact of economic globalization, a new round of global rural shrinkage has been triggered. The attempt to gain access to better-cultivated land may cause excessive deforestation and threaten the natural environment, which may have also been one of the main reasons for the Amazon fire in 2019. Nowadays, the phenomenon of farmers’ differentiation, agricultural weakening, and rural hollowing is very common, and rural shrinkage has become a global focus [
3]. Different countries and regions have dissimilar rural economic structures and development levels and different types of rural shrinkage. The impact of globalization on agricultural production and individuals or groups engaged in agricultural production activities has become an important field of international agricultural geography and rural geography research [
4].
Agriculture has always been regarded as the core of rural development and the most powerful and lasting symbol of rurality, and agriculture has an important influence on rural, social, and cultural organizations. After nearly half a century of experiencing the profound impact of industrialization, urbanization, and globalization, agriculture in developed countries has changed from a core position to a marginal position. For example, by 2000, less than 20% of the rural population depended on agriculture for survival in the United States, Canada, Britain, and France [
5]. The main mode of development in the European countryside has emerged from the leading role of agricultural production to the integration of the functions of agricultural production, cultural function, and social function [
6]. Market liberalization and multifunctional development encourage farmers to master more entrepreneurial skills and foster entrepreneurship [
7,
8]. Agricultural labor is an important economic factor in agricultural production [
9,
10]. There are many classical theories about the transfer of agricultural labor, such as the Lewis model [
11] and Ranis–Fei model [
12] under the classical dual economic theory, which analyzed the transformation process from a traditional agricultural production department to a modern production department and revealed the necessary conditions and transfer effects of the transfer of agricultural labor [
13]. In addition, there are Todaro’s population mobility model [
14,
15] and Jorgenson’s labor mobility model [
16], which revised the hypothesis of the Lewis model and explained the problem of agricultural labor transfer in developing countries to a certain extent. Labor transfer is essentially a profit-seeking process of agricultural surplus labor based on the law of diminishing marginal returns. The impact of labor transfer on agricultural production is reflected in two ways: Agricultural production efficiency and available capital. On the one hand, labor transfer liberates farmers from agricultural production and promotes the concentration of agricultural land, which is an important measure to promote economic growth, transform agricultural production modes, and realize agricultural transformation and upgrading [
17,
18,
19,
20]. Labor transfer also helps farmers to accept more advanced ideas and education, improves the quality of labor, promotes the extension of agricultural technology and increases the farmers’ income, and the multiplier effect will further promote the development of the agricultural economy [
9]. On the other hand, some scholars believe that the loss of labor can be resolved to a certain extent by purchasing chemical fertilizer from non-agricultural income, employing short-term workers or using machinery. After the income risk and financial constraints are effectively improved, families tend to move to a more specialized mode of agricultural production, which is conducive to agricultural development [
21]. In addition, some scholars note that the loss of labor will reduce the available labor resources in rural areas, affect the productivity and mode of production of the left-behind labor, lead to the degradation or extensive use of agricultural land, and make it difficult to adopt innovative agricultural technologies and methods. Thus, agricultural production will fall into a vicious circle trap [
22,
23], which is not conducive to the sustainable development of agricultural production. From the relationship between labor transfer and rural economic growth, according to human capital theory, labor migration from areas with lower wages to areas with higher wages will promote the optimal allocation of social resources, help improve the income situation of migrants and increase the economic growth rate of the whole country [
24]. However, because the labor productivity of migrants is usually relatively high, labor mobility will lead to an absence of the main body of rural development and expand the income gap between developed and undeveloped areas [
13], which is not conducive to the sustainable development of rural areas. From the perspective of the economic mechanism, migration, especially when young people are the main population, can reduce the demand for local services, lead to the reduction of local services facilities and further economic recession, and aggravate the process of rural shrinkage [
25], which is not conducive to the sustainable development of rural areas and agriculture. It is evident that rural shrinkage is not only the inevitable product of industrial structure changes but also the inevitable portrayal of the urban–rural competition between the population and economy in the era of globalization [
26].
Since China’s reform and opening up, with the rapid development of industrialization and urbanization, agricultural labor has been shifting to non-agricultural industries. Especially since the 1990s, the grain yield has maintained a fluctuating upward trend, increasing from 435 million tons in 1991 to 546 million tons in 2010. During the same period, agricultural labor has also changed dramatically, and the agricultural labor population has rapidly decreased from 350 million people to 277 million people, with the proportion of the non-agricultural employment of agricultural labor and the non-agricultural income of farmers rising [
27,
28]. However, while a non-agricultural transfer of agricultural labor has occurred, non-agricultural construction, agricultural restructuring, ecological conversion, and other factors have led to a large reduction in cultivated land area, with a net annual decrease of 826,300 ha from 1996 to 2006 [
29]. As a populous and agricultural country, China’s dramatic reduction in the cultivated land area will threaten the sustainable food security of one-fifth of the world’s population [
30]. From the late 1970s, Chinese scholars began to pay attention to the transfer of agricultural labor, agricultural production, and their relationship. The research contents mainly included the quantity and scale estimation of agricultural labor [
31,
32,
33,
34], the influencing factors [
35,
36], the effect [
18,
37], and the methods [
38,
39] of agricultural labor transfer, etc. On this basis, scholars further revealed the spatiotemporal variation [
40,
41,
42], the comprehensive effect [
31,
43], and the socioeconomic driving force [
44,
45,
46,
47] of agricultural production based on the indicators of grain yield, cultivated land area, and agricultural output value. In recent years, based on the study of rural hollowing, scholars have further explored the relationship between agricultural labor transfer and agricultural production, including the impact of agricultural labor transfer on grain yield, cultivated land area, and agricultural economic development [
48,
49,
50], food security [
51], the transformation of agricultural production modes [
52], and the time-series change characteristics of agricultural land conversion against agricultural labor transfer, etc. [
53]
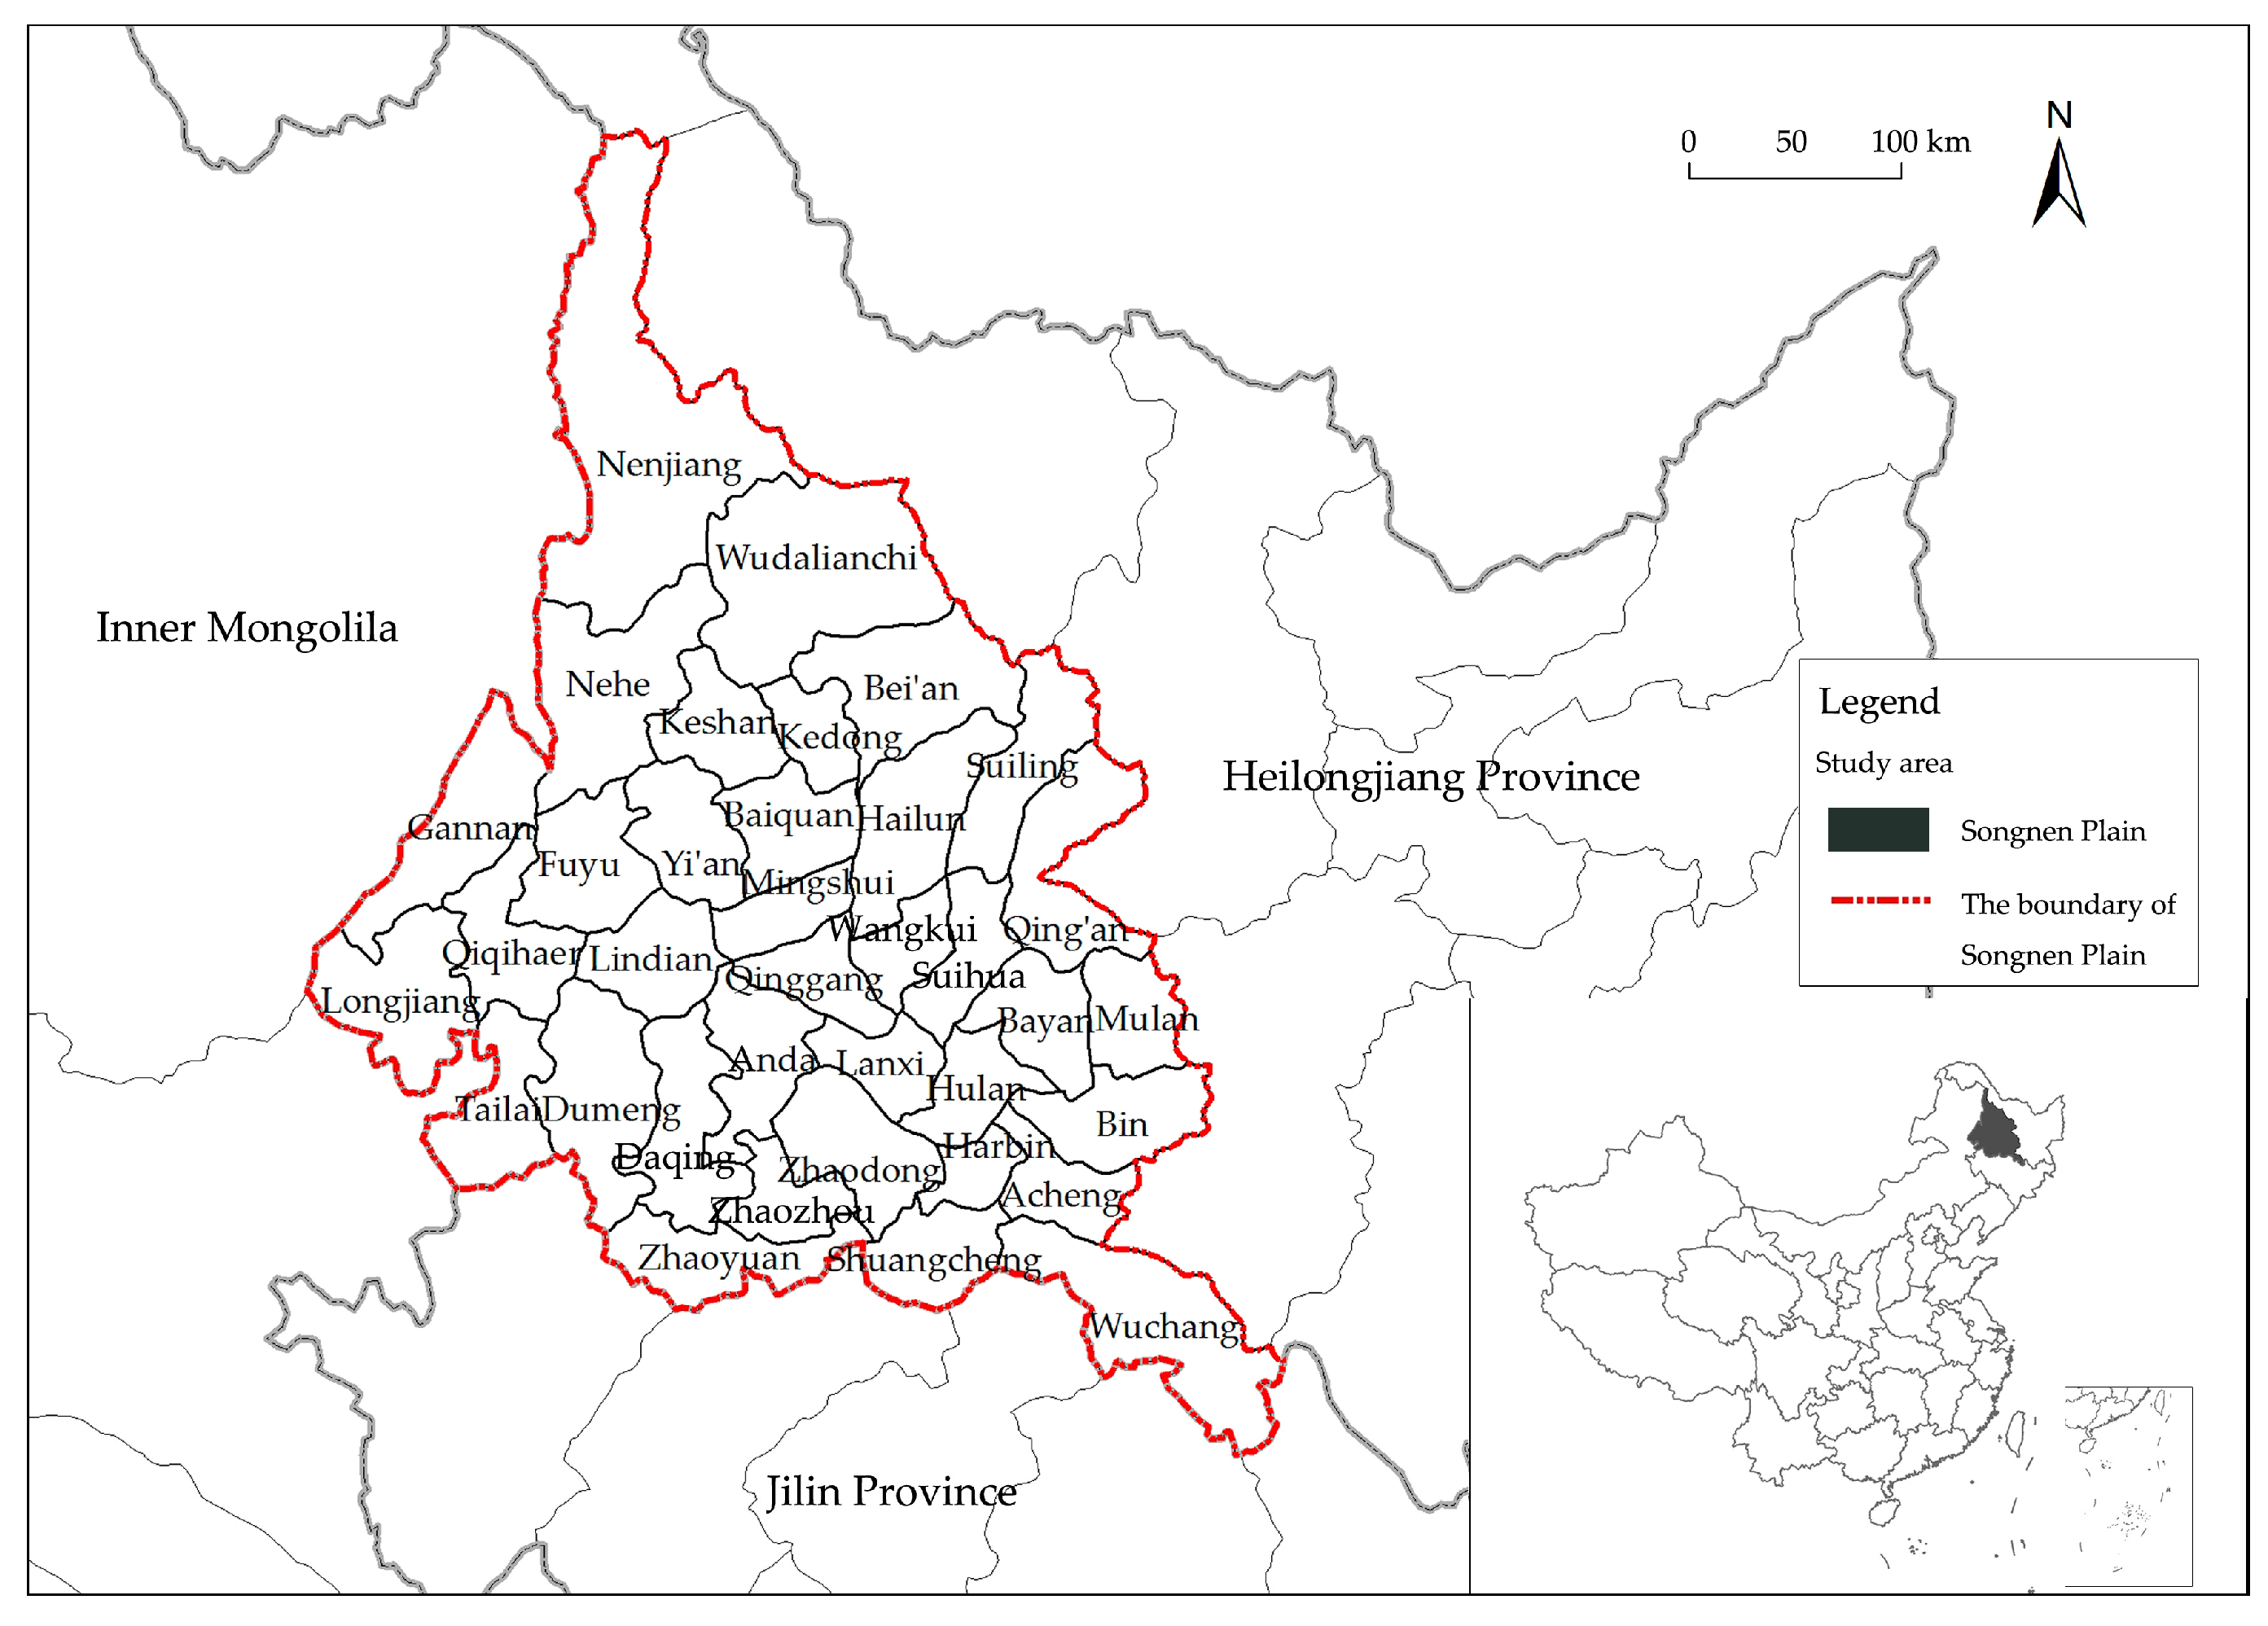
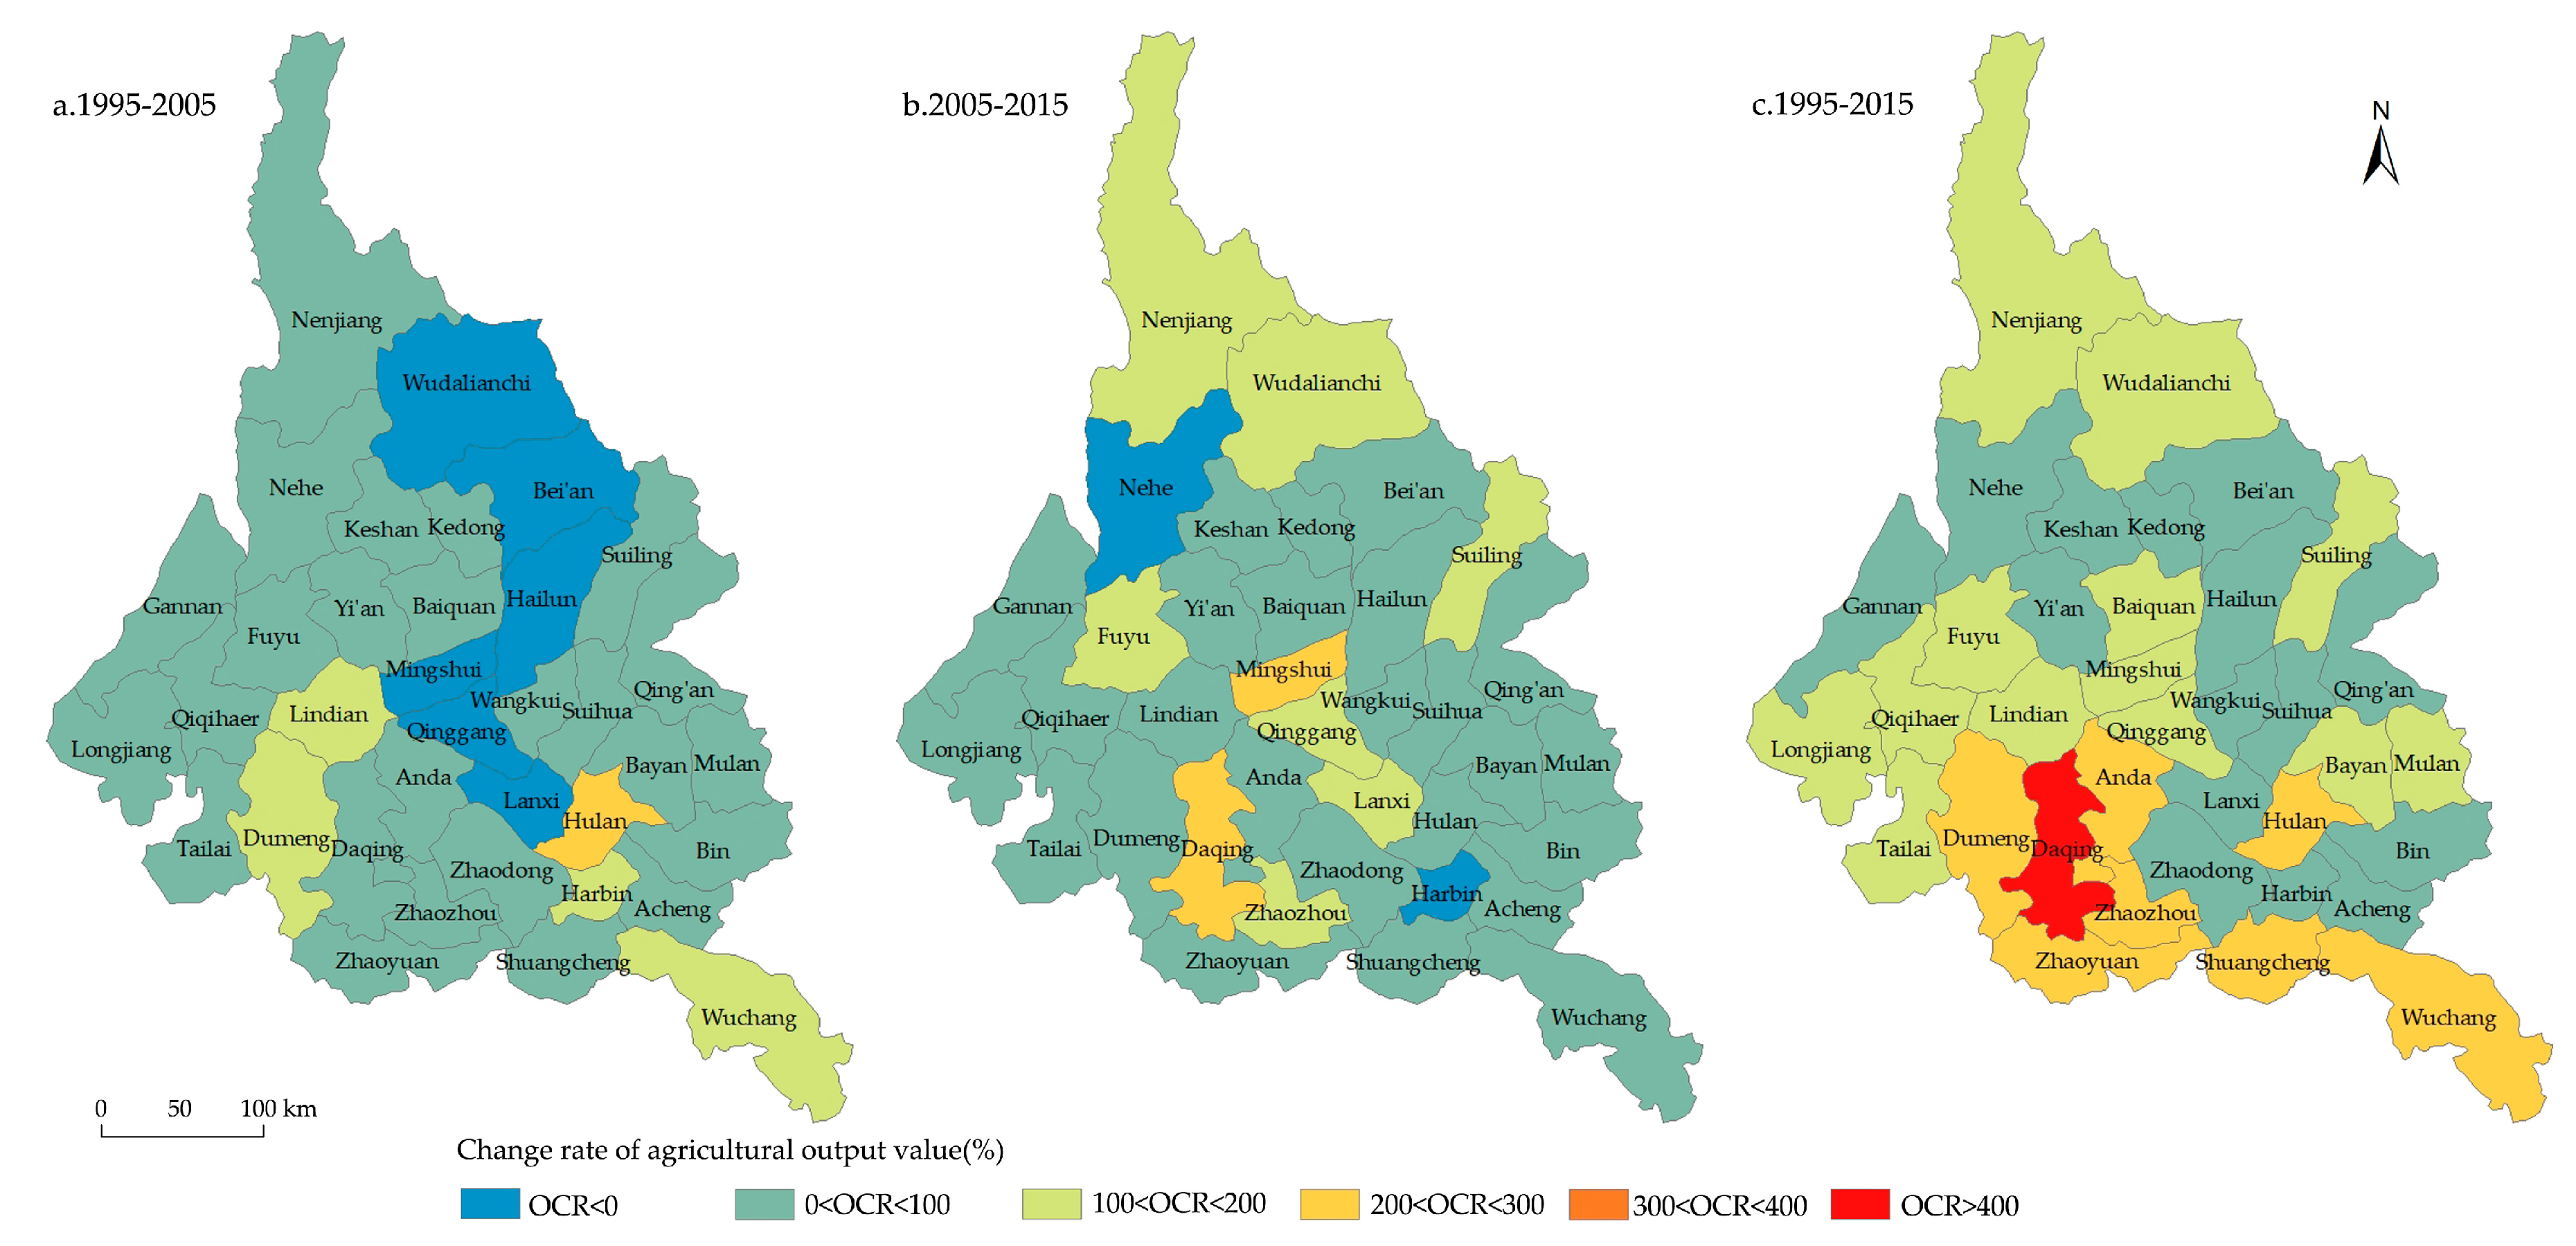
From the existing research regarding the relationship between agricultural labor and agricultural production, few studies reflect the coupling relationship between agricultural labor and agricultural production comprehensively. Most of China’s domestic research is carried out at provincial and municipal levels or in the eastern coastal areas, the Yangtze River Delta and western mountainous areas, while there is less research on the main grain-producing areas in northeastern China. Northeastern China is an important commodity grain base and the “stabilizer” to ensure national food security in China. Northeastern China is also the most obvious area impacted by global agricultural overcapacity and grain import. The rural development of northeastern China is facing many important factors, such as international trade competition, economic globalization, rapid urbanization, industrial restructuring, etc. Songnen Plain in Northeastern China is one of the first national modern agricultural demonstration bases, which plays an important role in ensuring national food security. Based on panel data from 1995, 2005, and 2015 in Songnen Plain in Heilongjiang Province, this paper revealed the spatiotemporal evolution characteristics and coupling relationship between agricultural labor and agricultural production (grain yield, cultivated land area, and agricultural output value) at the county level. This work can be used to enrich the research results of agricultural geography and rural geography in the new period, provide a reference for the differentiated policy formulation of the rural revitalization strategy, and identify a suitable revitalization path.
The remainder of this paper has four parts:
Section 2 introduces materials and methods,
Section 3 includes an analysis of the results,
Section 4 presents a discussion, and
Section 5 states the final conclusions.
5. Conclusions
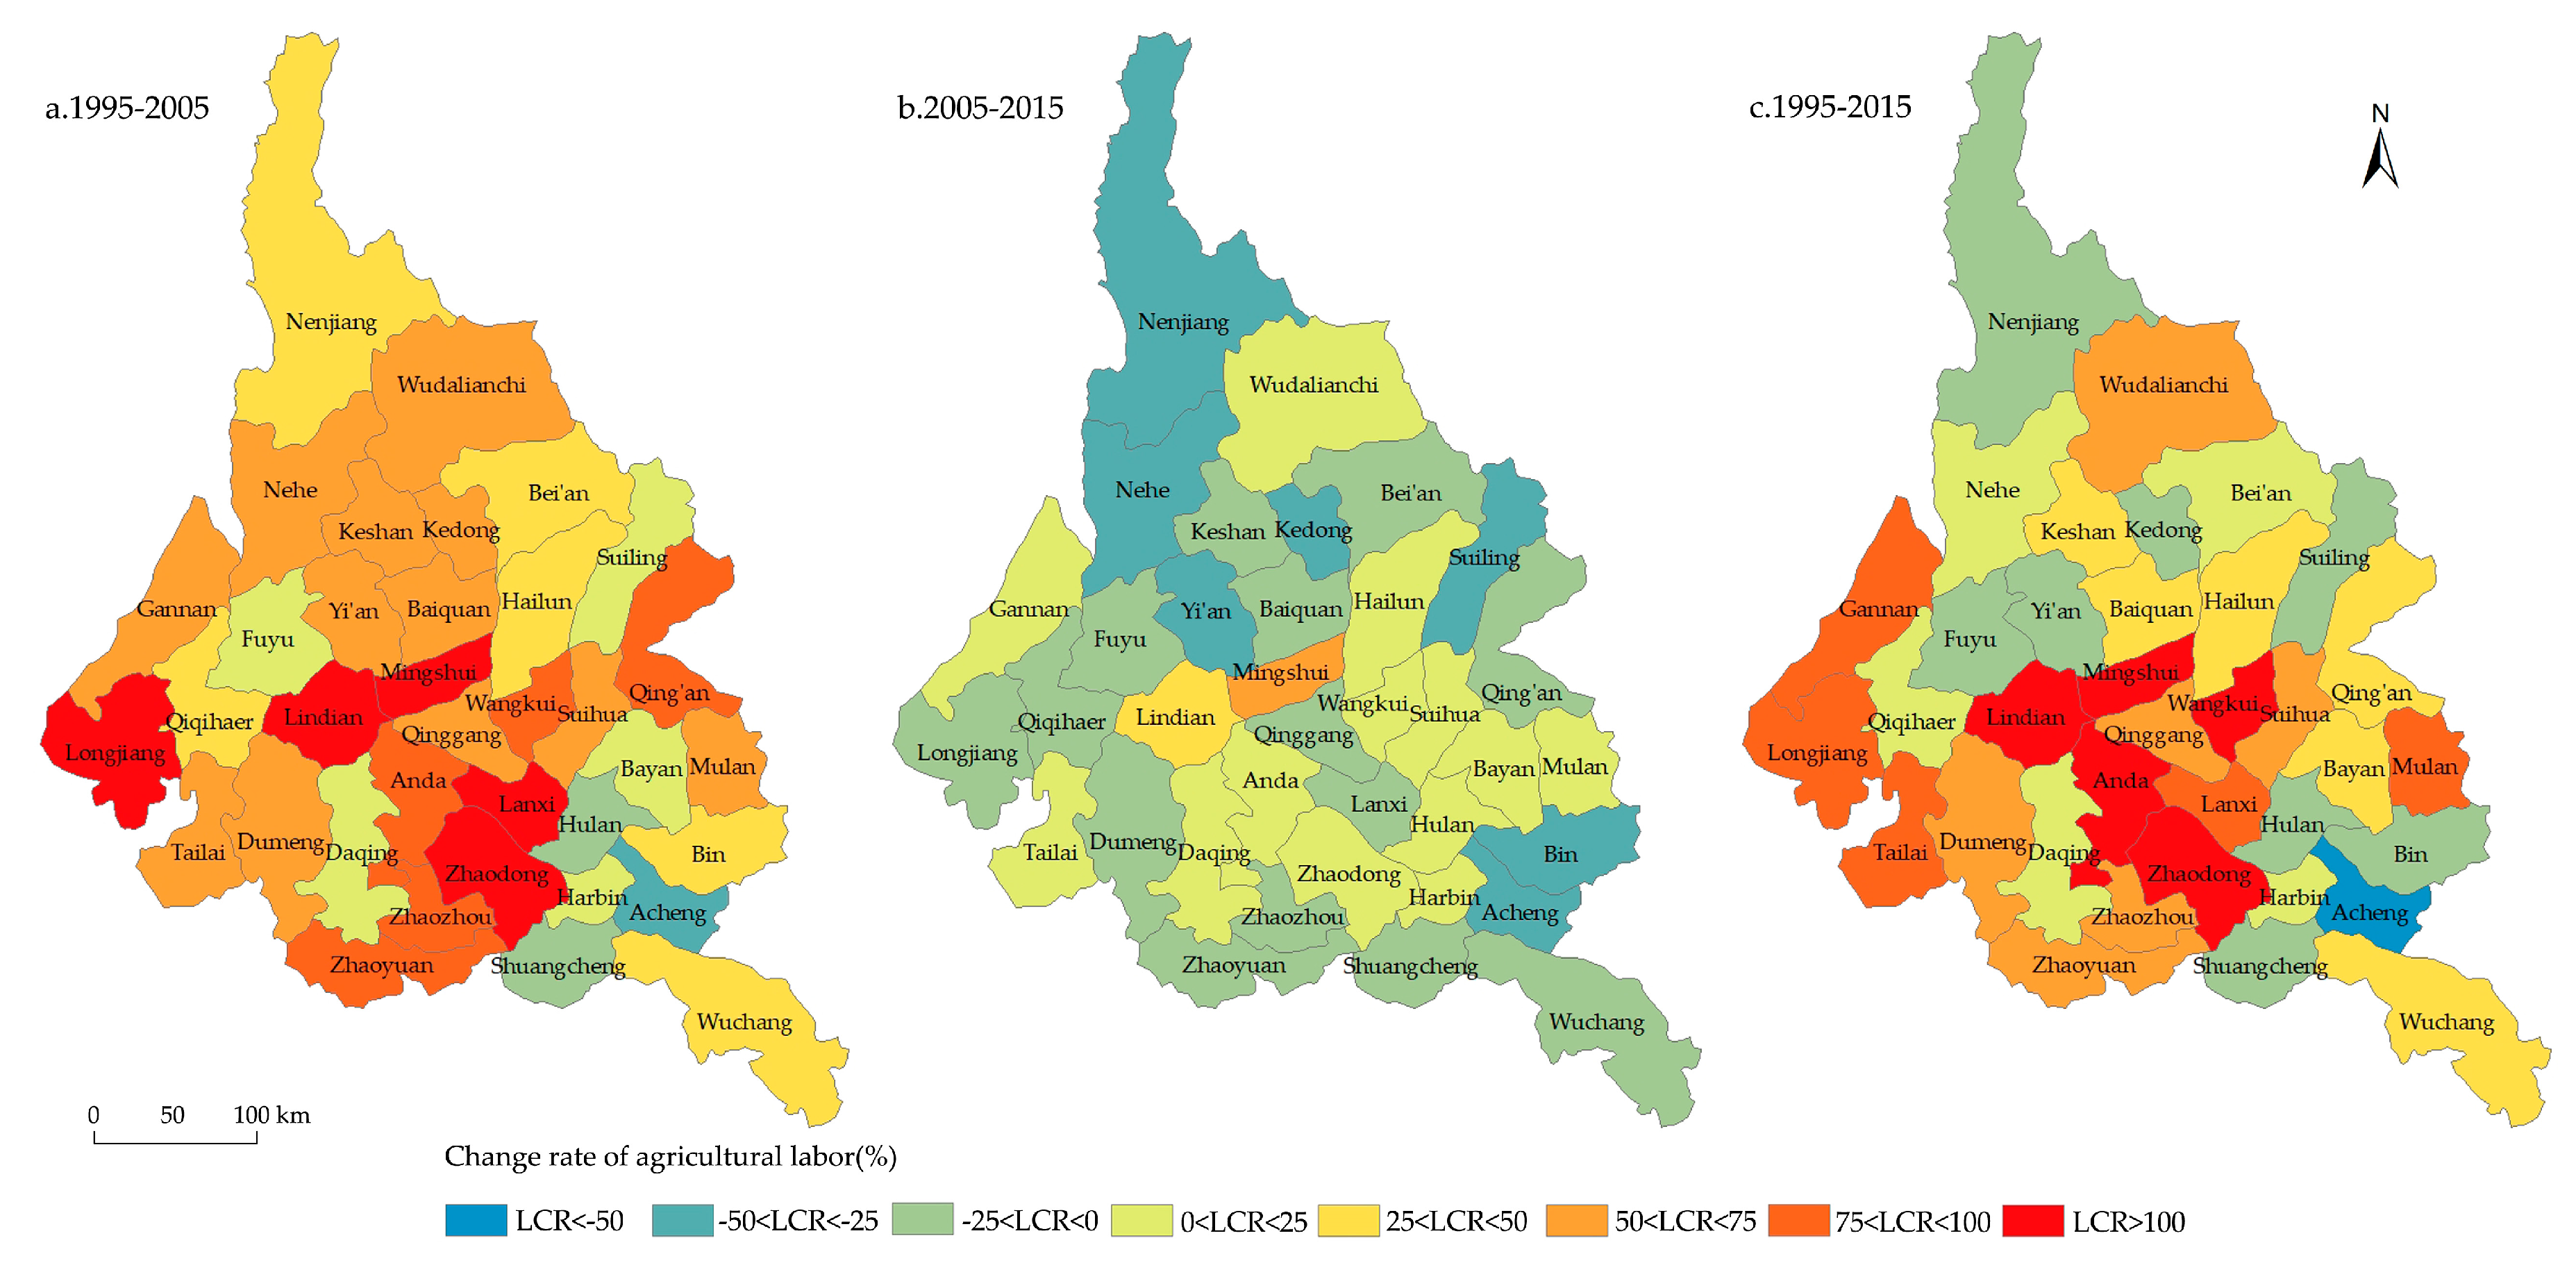
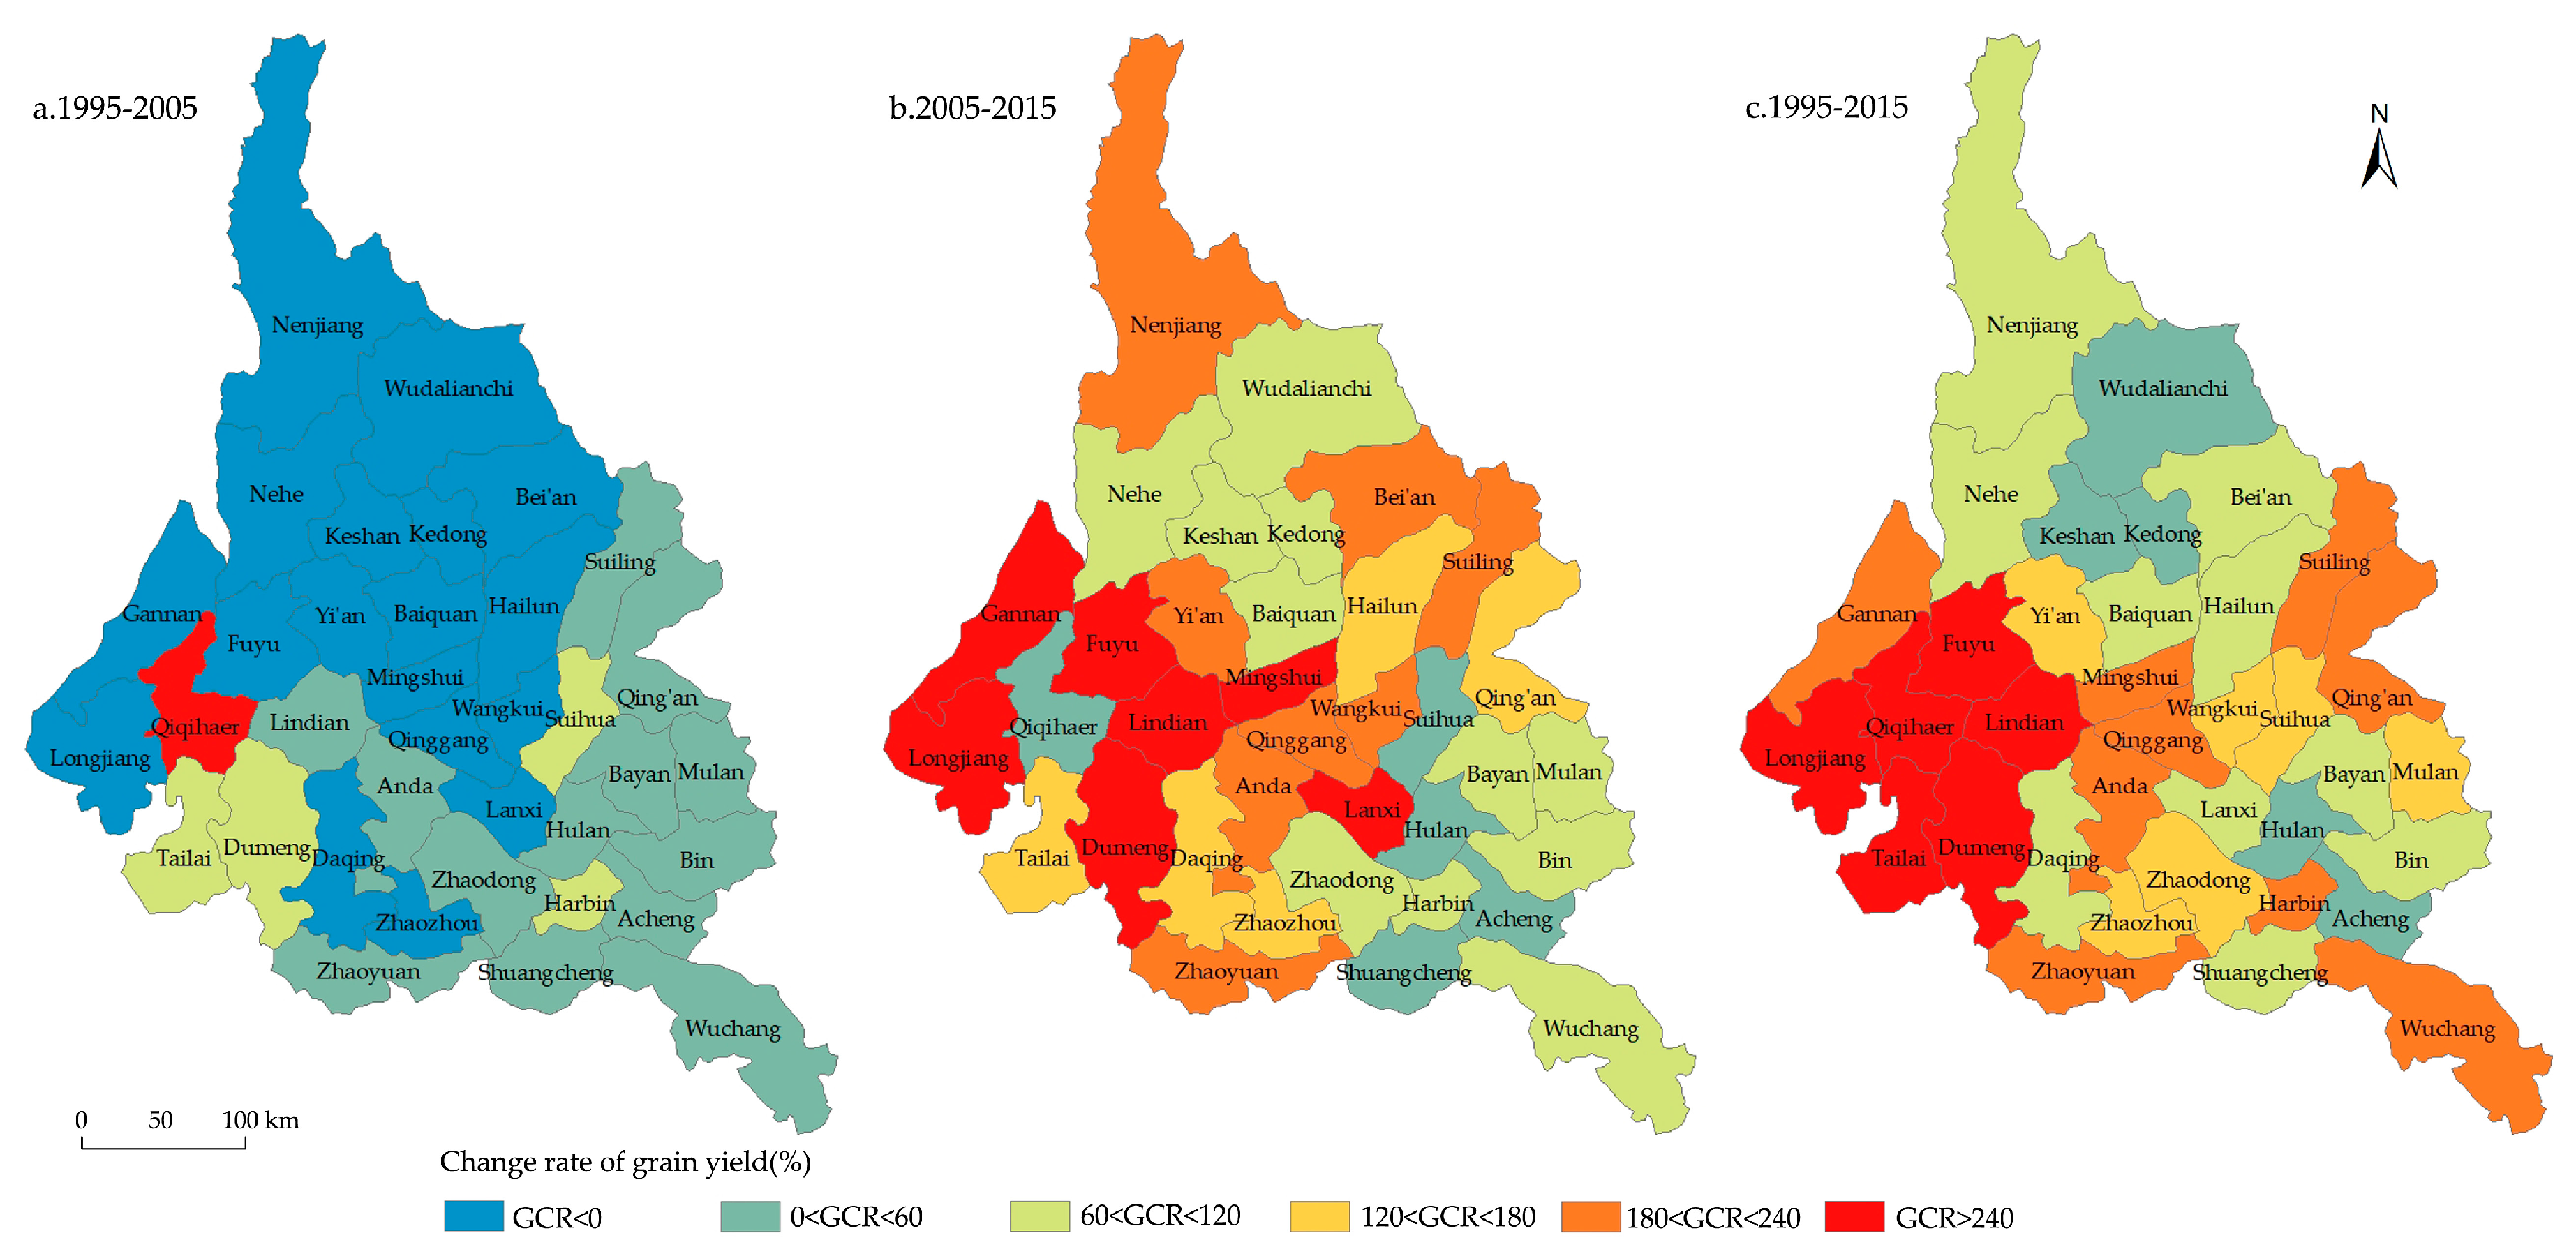
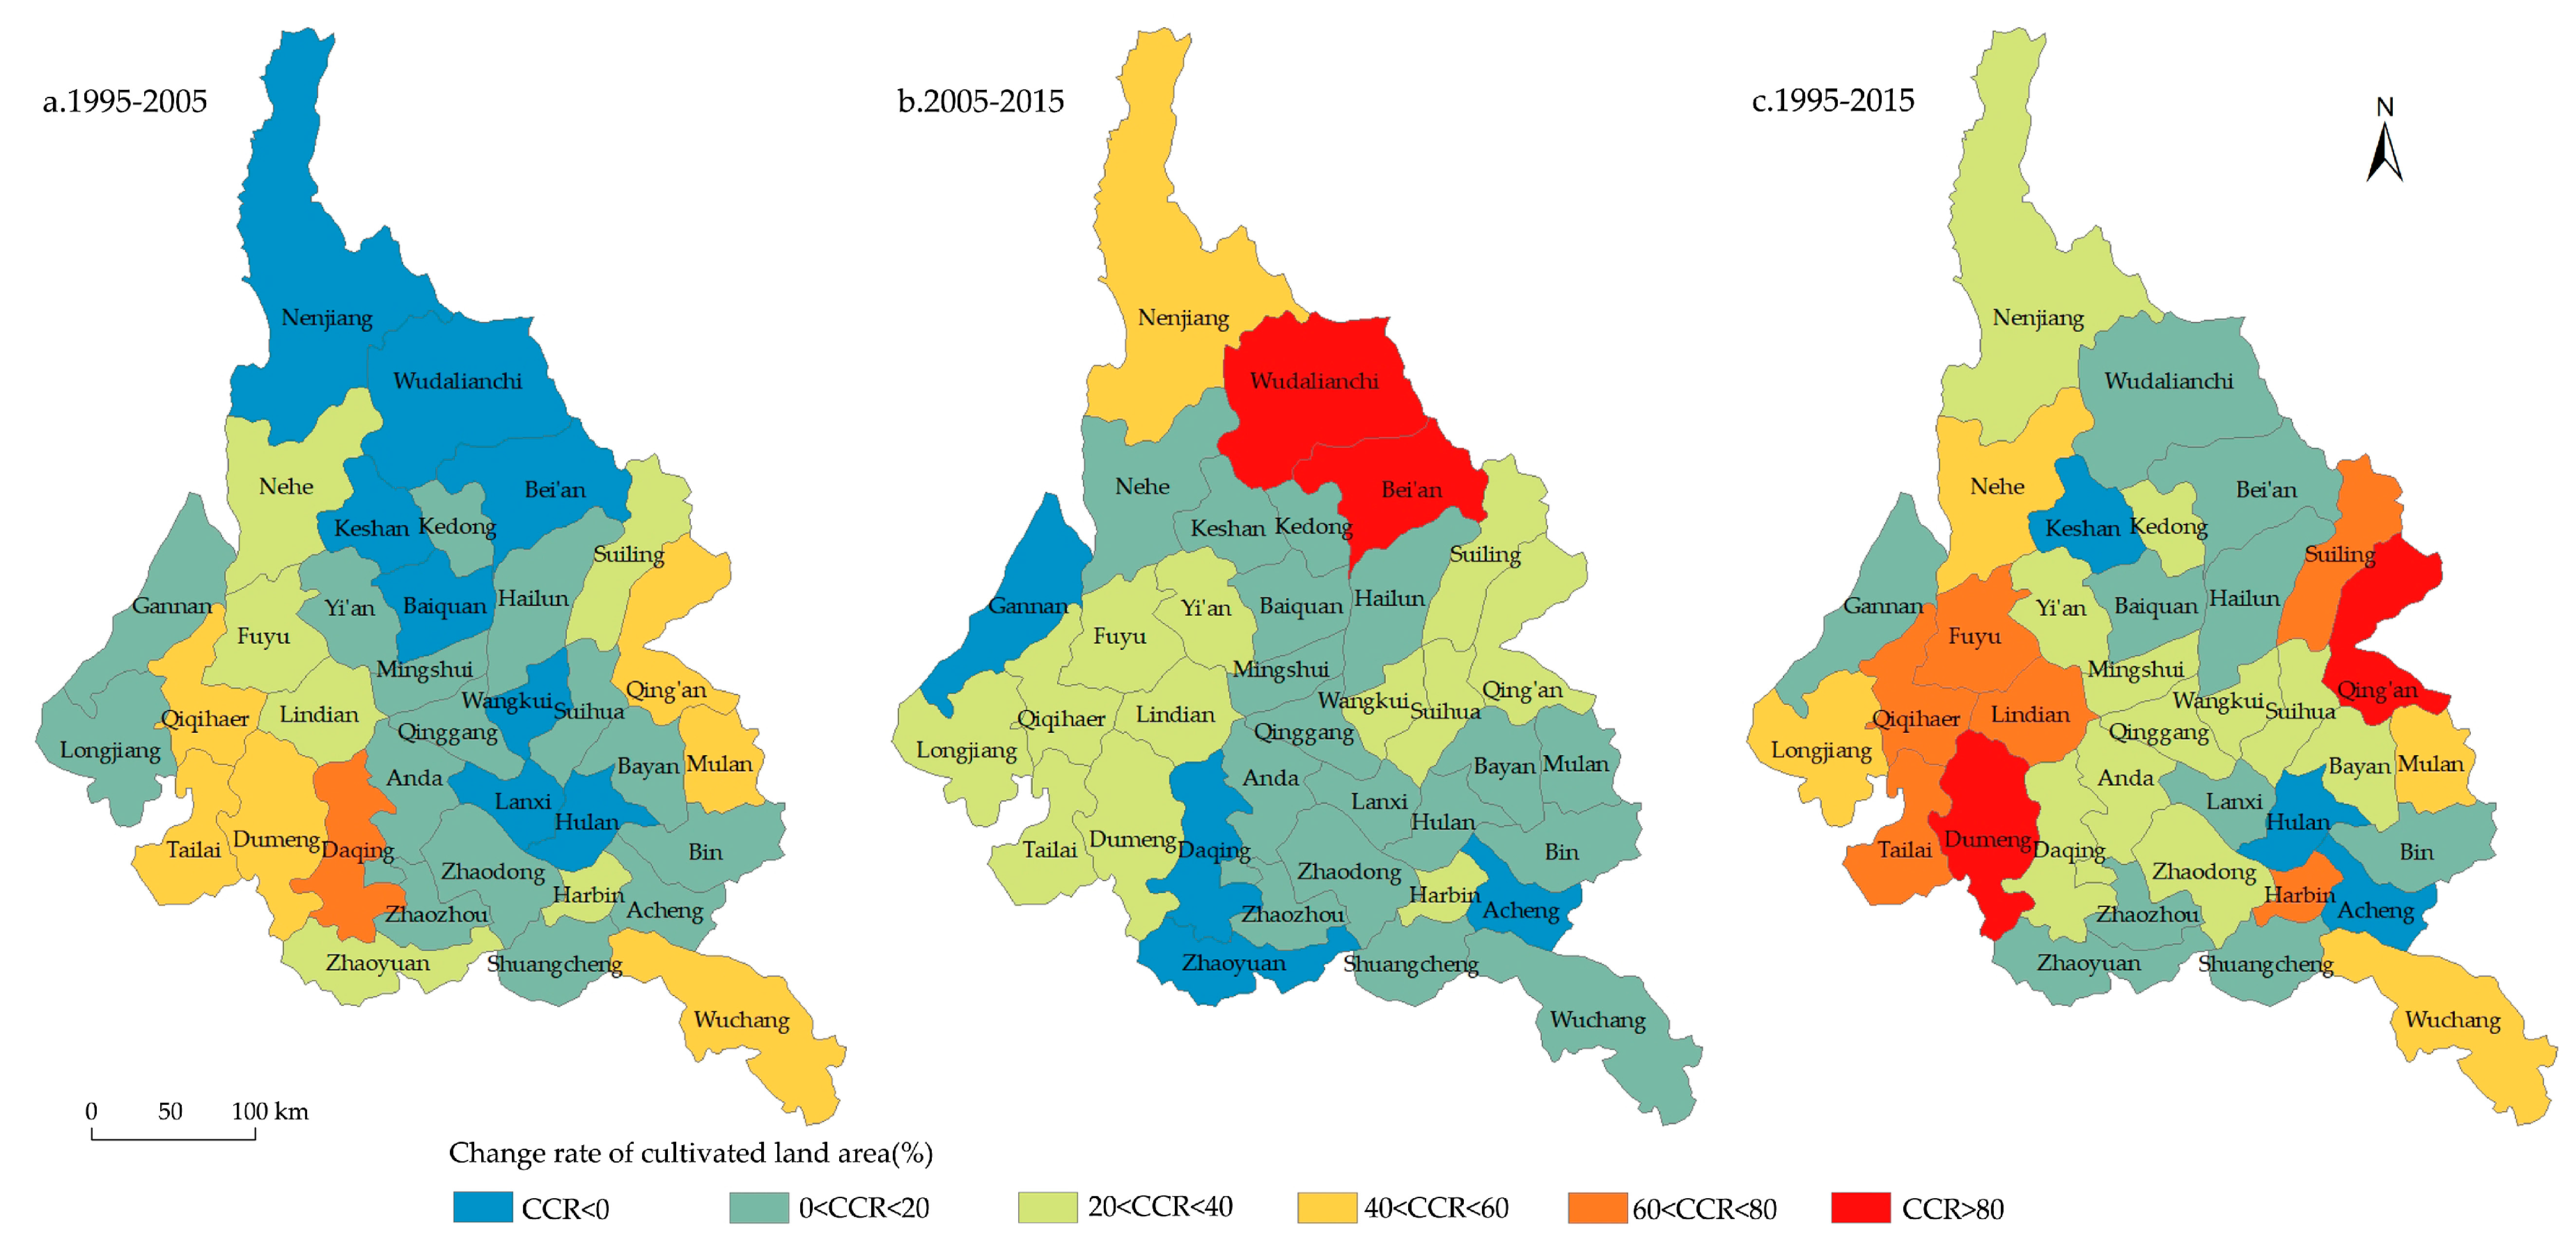
From 1995 to 2015, the agricultural labor population in Songnen Plain increased first and then decreased, and the level of agricultural production of each county was quite different. The transfer of agricultural labor in counties in the northern and eastern areas was clear. Agricultural modernization, industrialization, and urbanization were the main driving forces of the non-agricultural transfer of agricultural labor. The growth trend of agricultural labor in the central and western areas was clear, mainly because of the rapid growth of cultivated land area, satisfactory agriculture income, slow adjustment of industrial structure, and the weak employment capacity of secondary and tertiary industries. The main driving force for regional development was still agriculture. The level of agricultural production in Songnen Plain showed a growth trend, with characteristics from the initial “high in the southwest and low in the northeast” changing to “high in central areas and low around”.
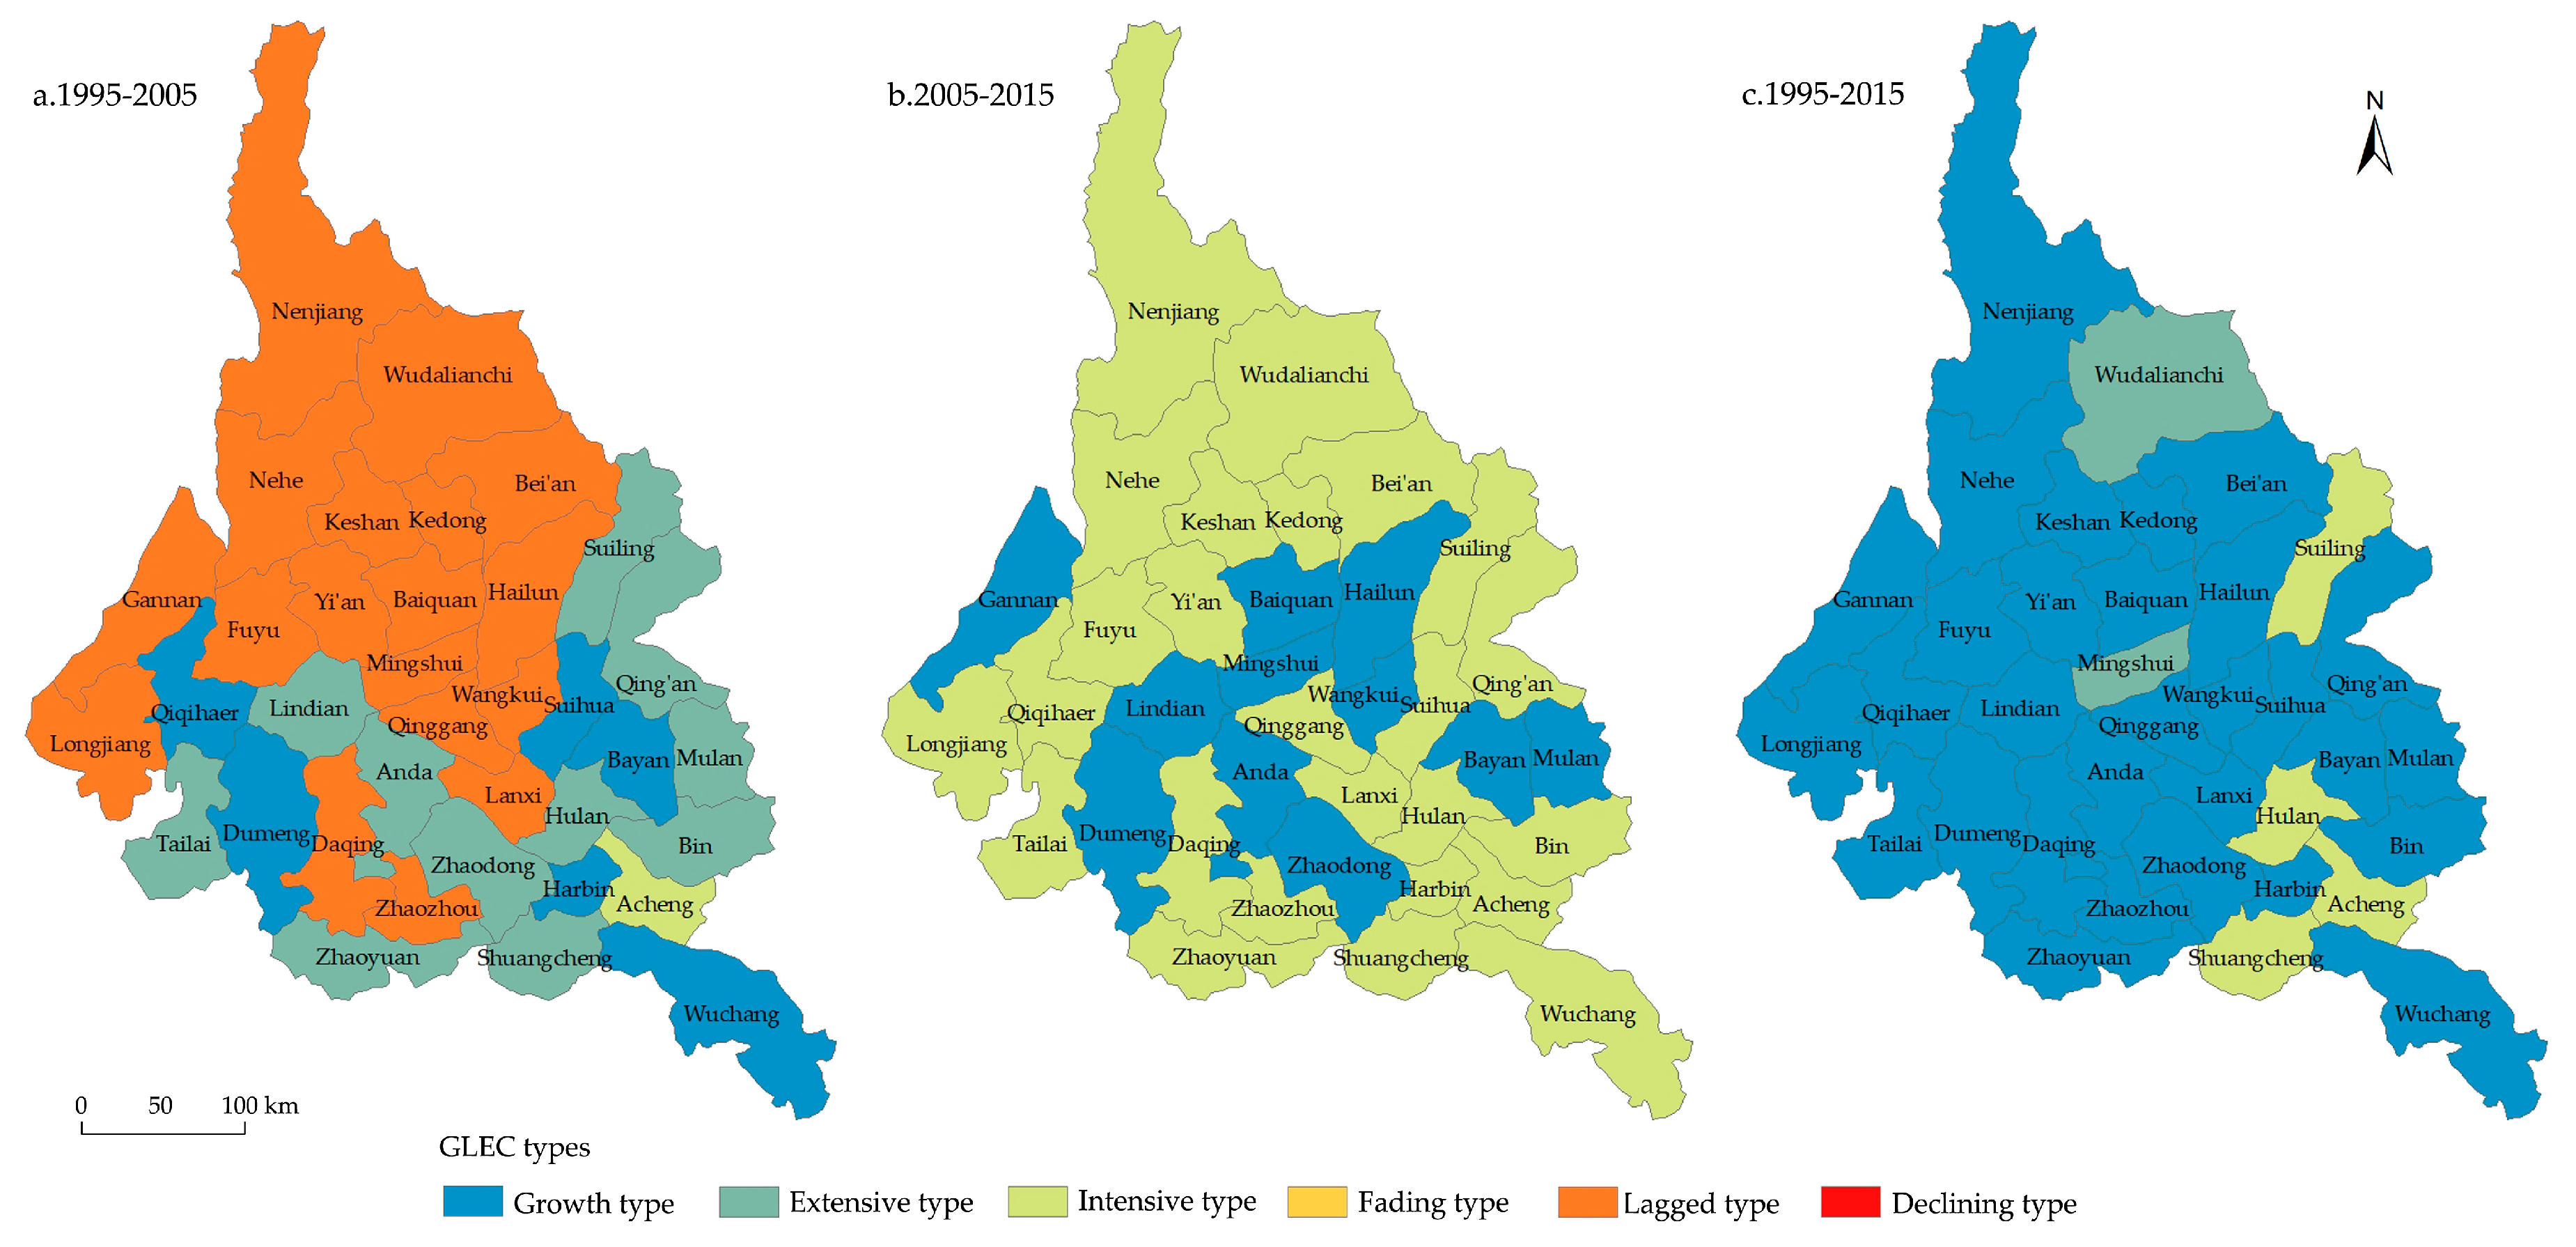
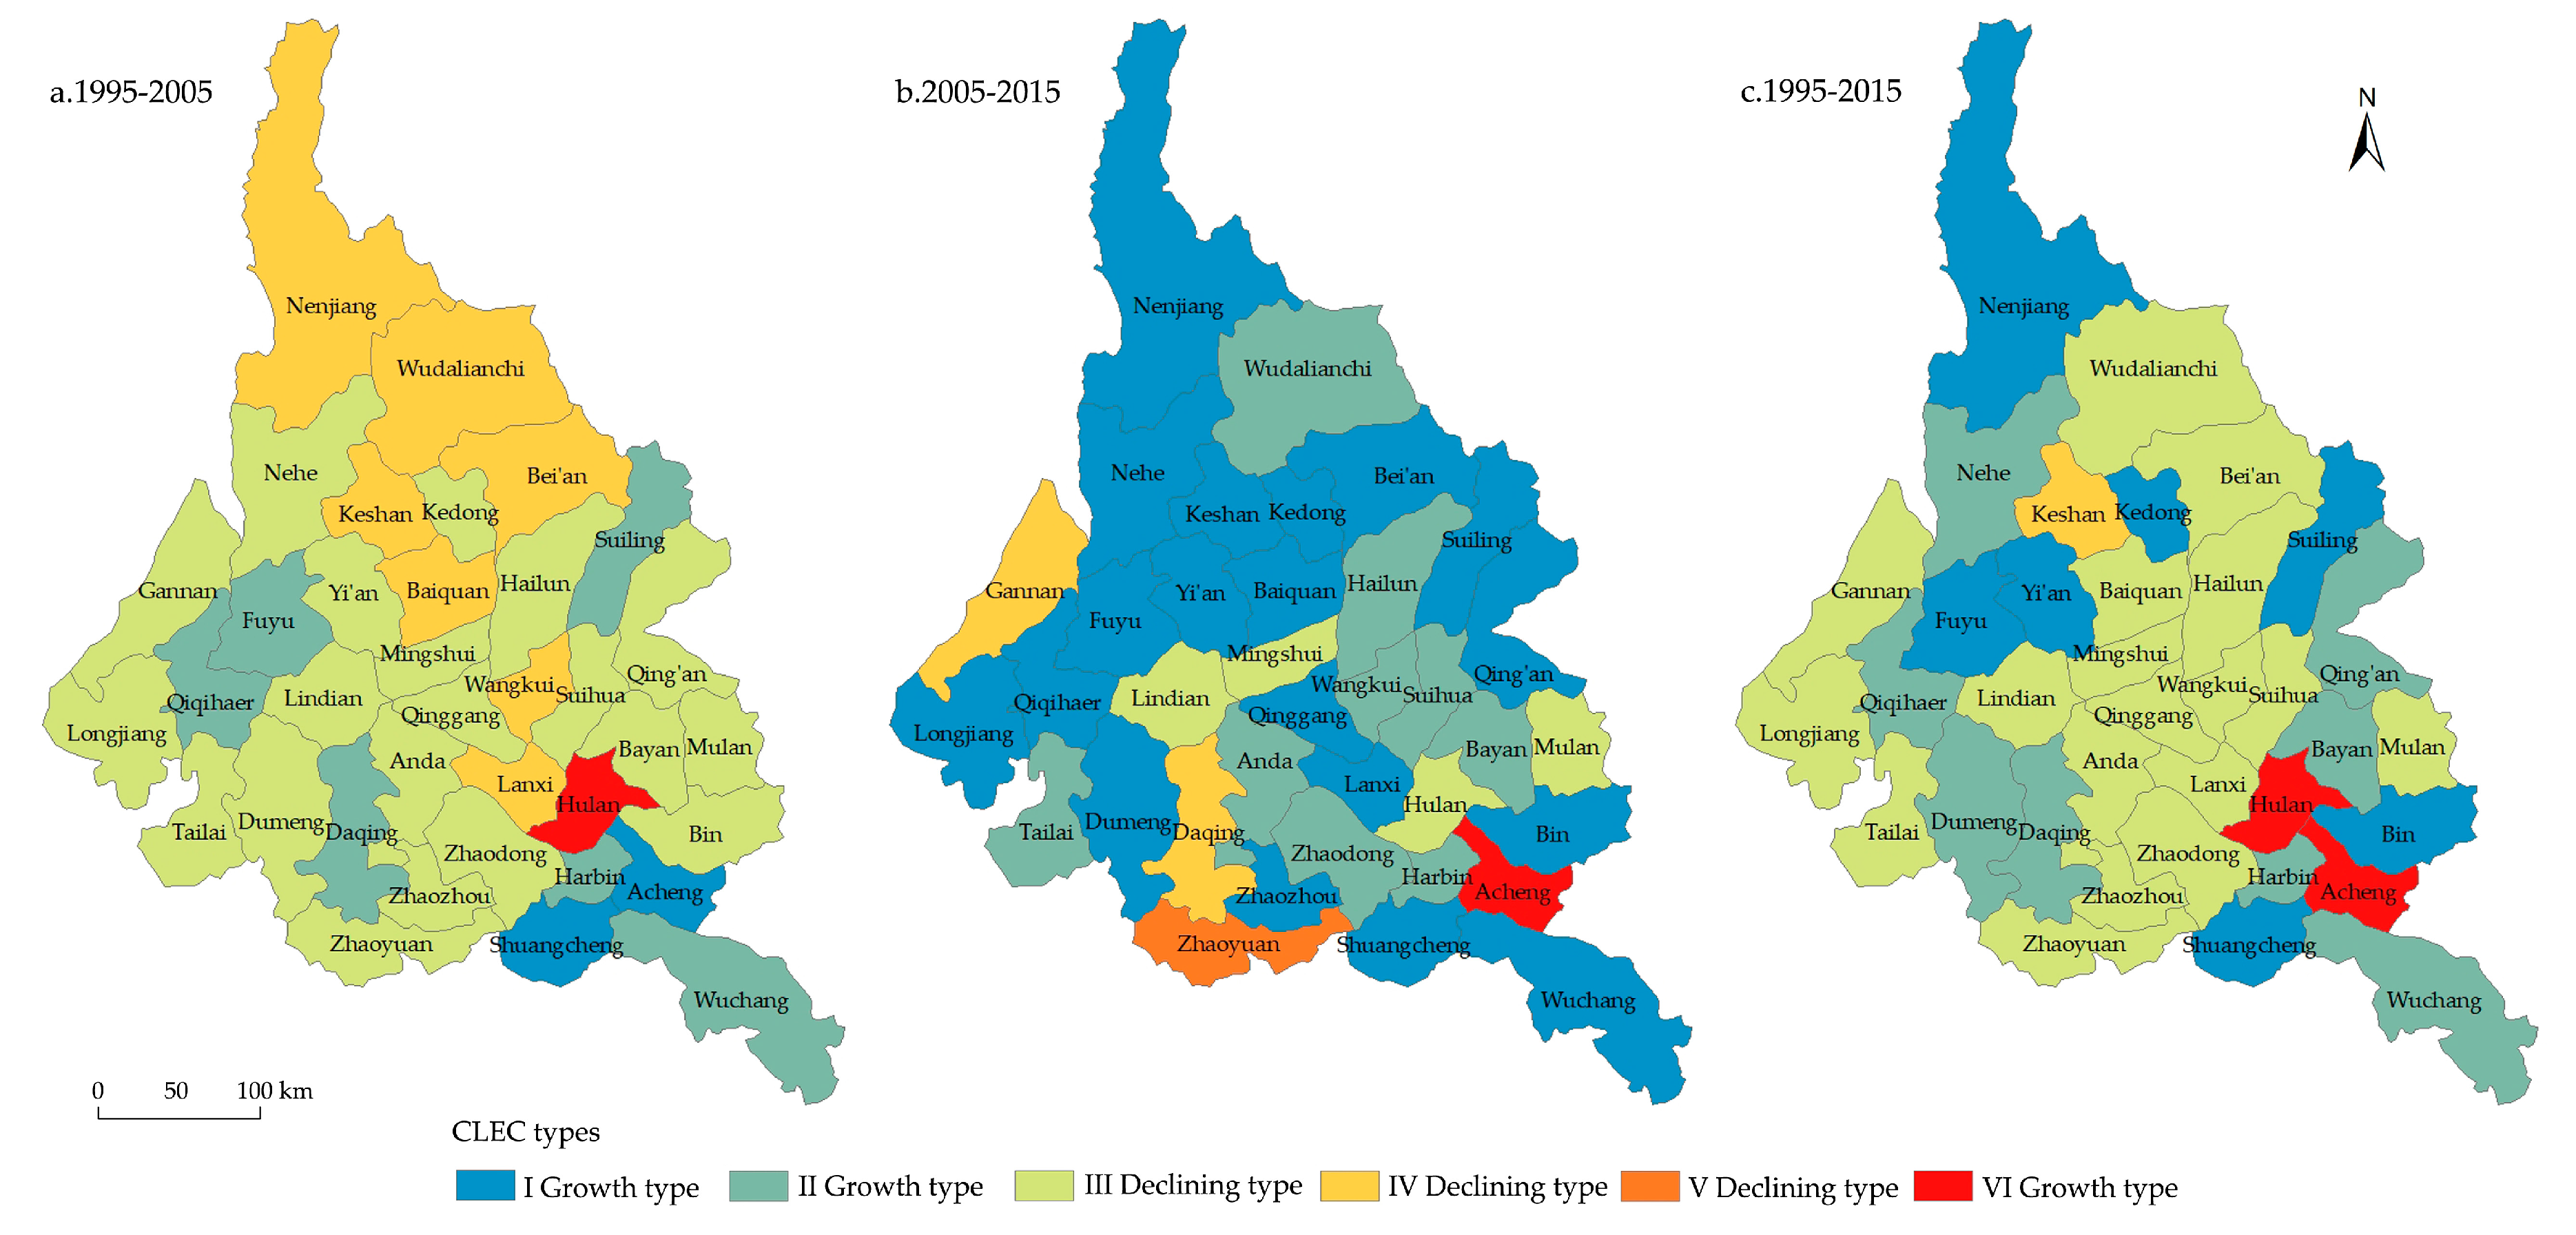
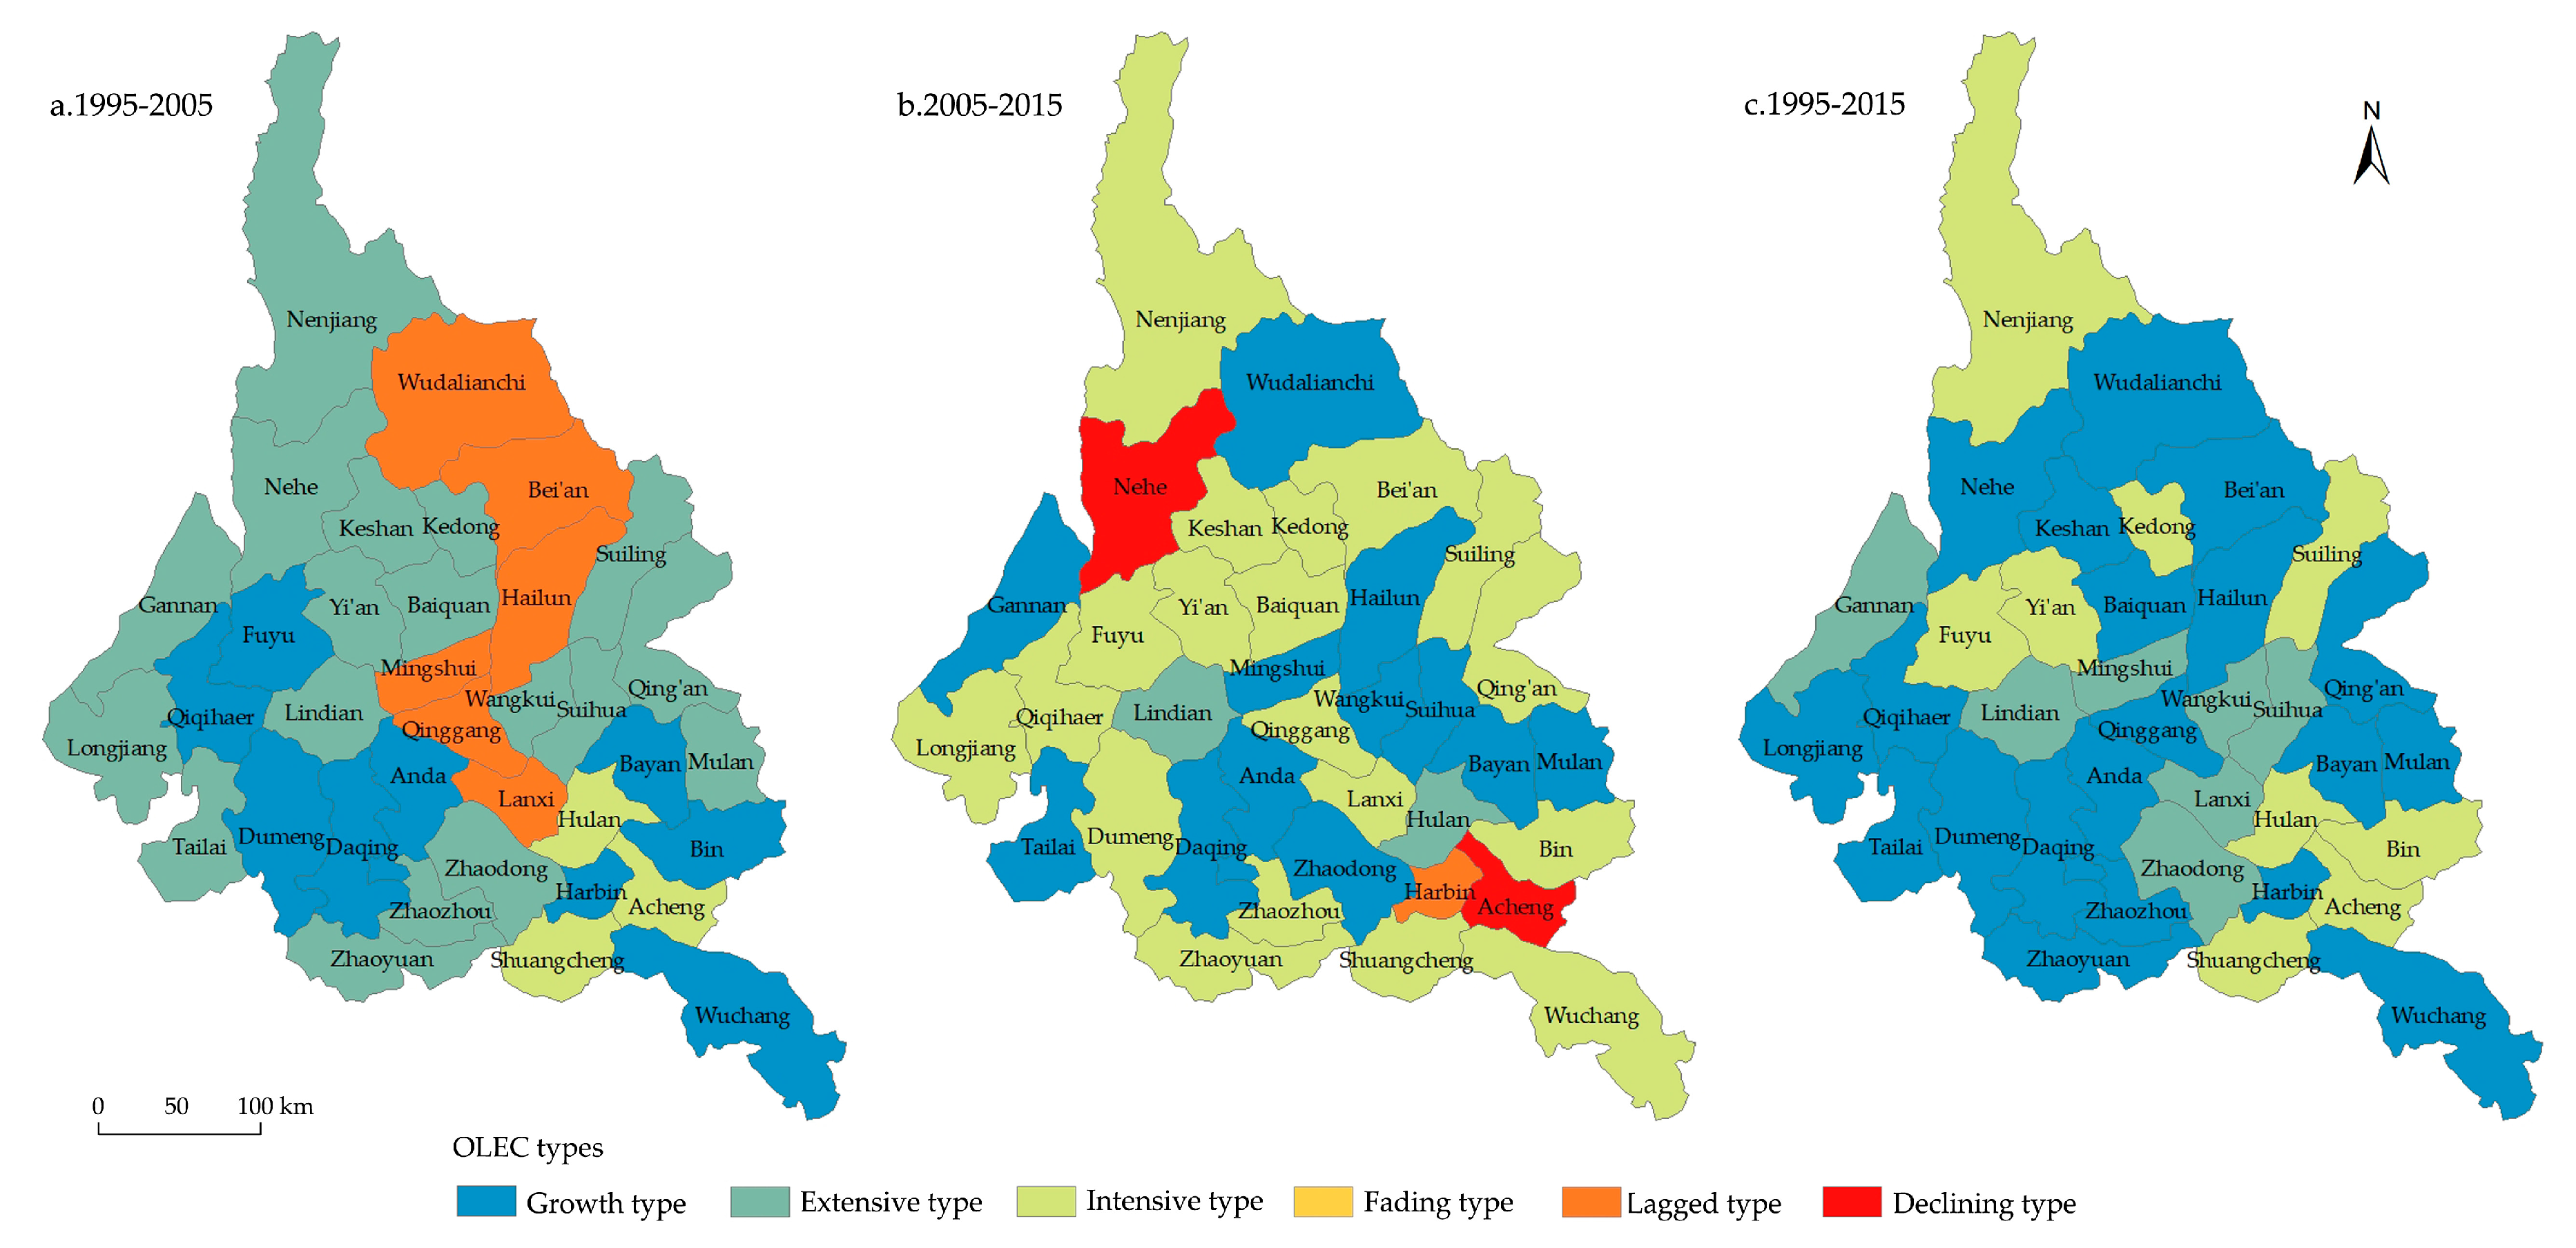
The elasticity coefficient analysis method can effectively analyze the coupling relationship between agricultural labor and agricultural production, reflecting the process of regional agricultural transformation and development. The coupling types of counties in Songnen Plain are varied, and the regional differences are obvious, showing a benign growth trend as a whole. The coupling types of agricultural labor and agricultural production in most counties changed from “lagged type”, “extensive type”, and “declining type” to “growth type” and “intensive type”. The growth and intensive-type counties have the characteristics of agglomeration distribution, which coincide with the regions with good socio-economic development. The transfer of agricultural labor in some areas has brought about an increase in per capita cultivated land and an intensive transformation of production types. However, problems such as hollow villages, the abandonment of cultivated land, and food insecurity should be avoided. Simultaneously, the increase in the agricultural labor population in some areas has promoted the growth of grain yield and agricultural output value, but problems such as the decrease in per capita cultivated land and per capita income should be avoided. Therefore, it is necessary to formulate differentiated rural revitalization strategies according to local conditions.


