Patterns and Causes of Food Waste in the Hospitality and Food Service Sector: Food Waste Prevention Insights from Malaysia

 , , ,
, , ,
Abstract
:1. Introduction
2. Literature Review
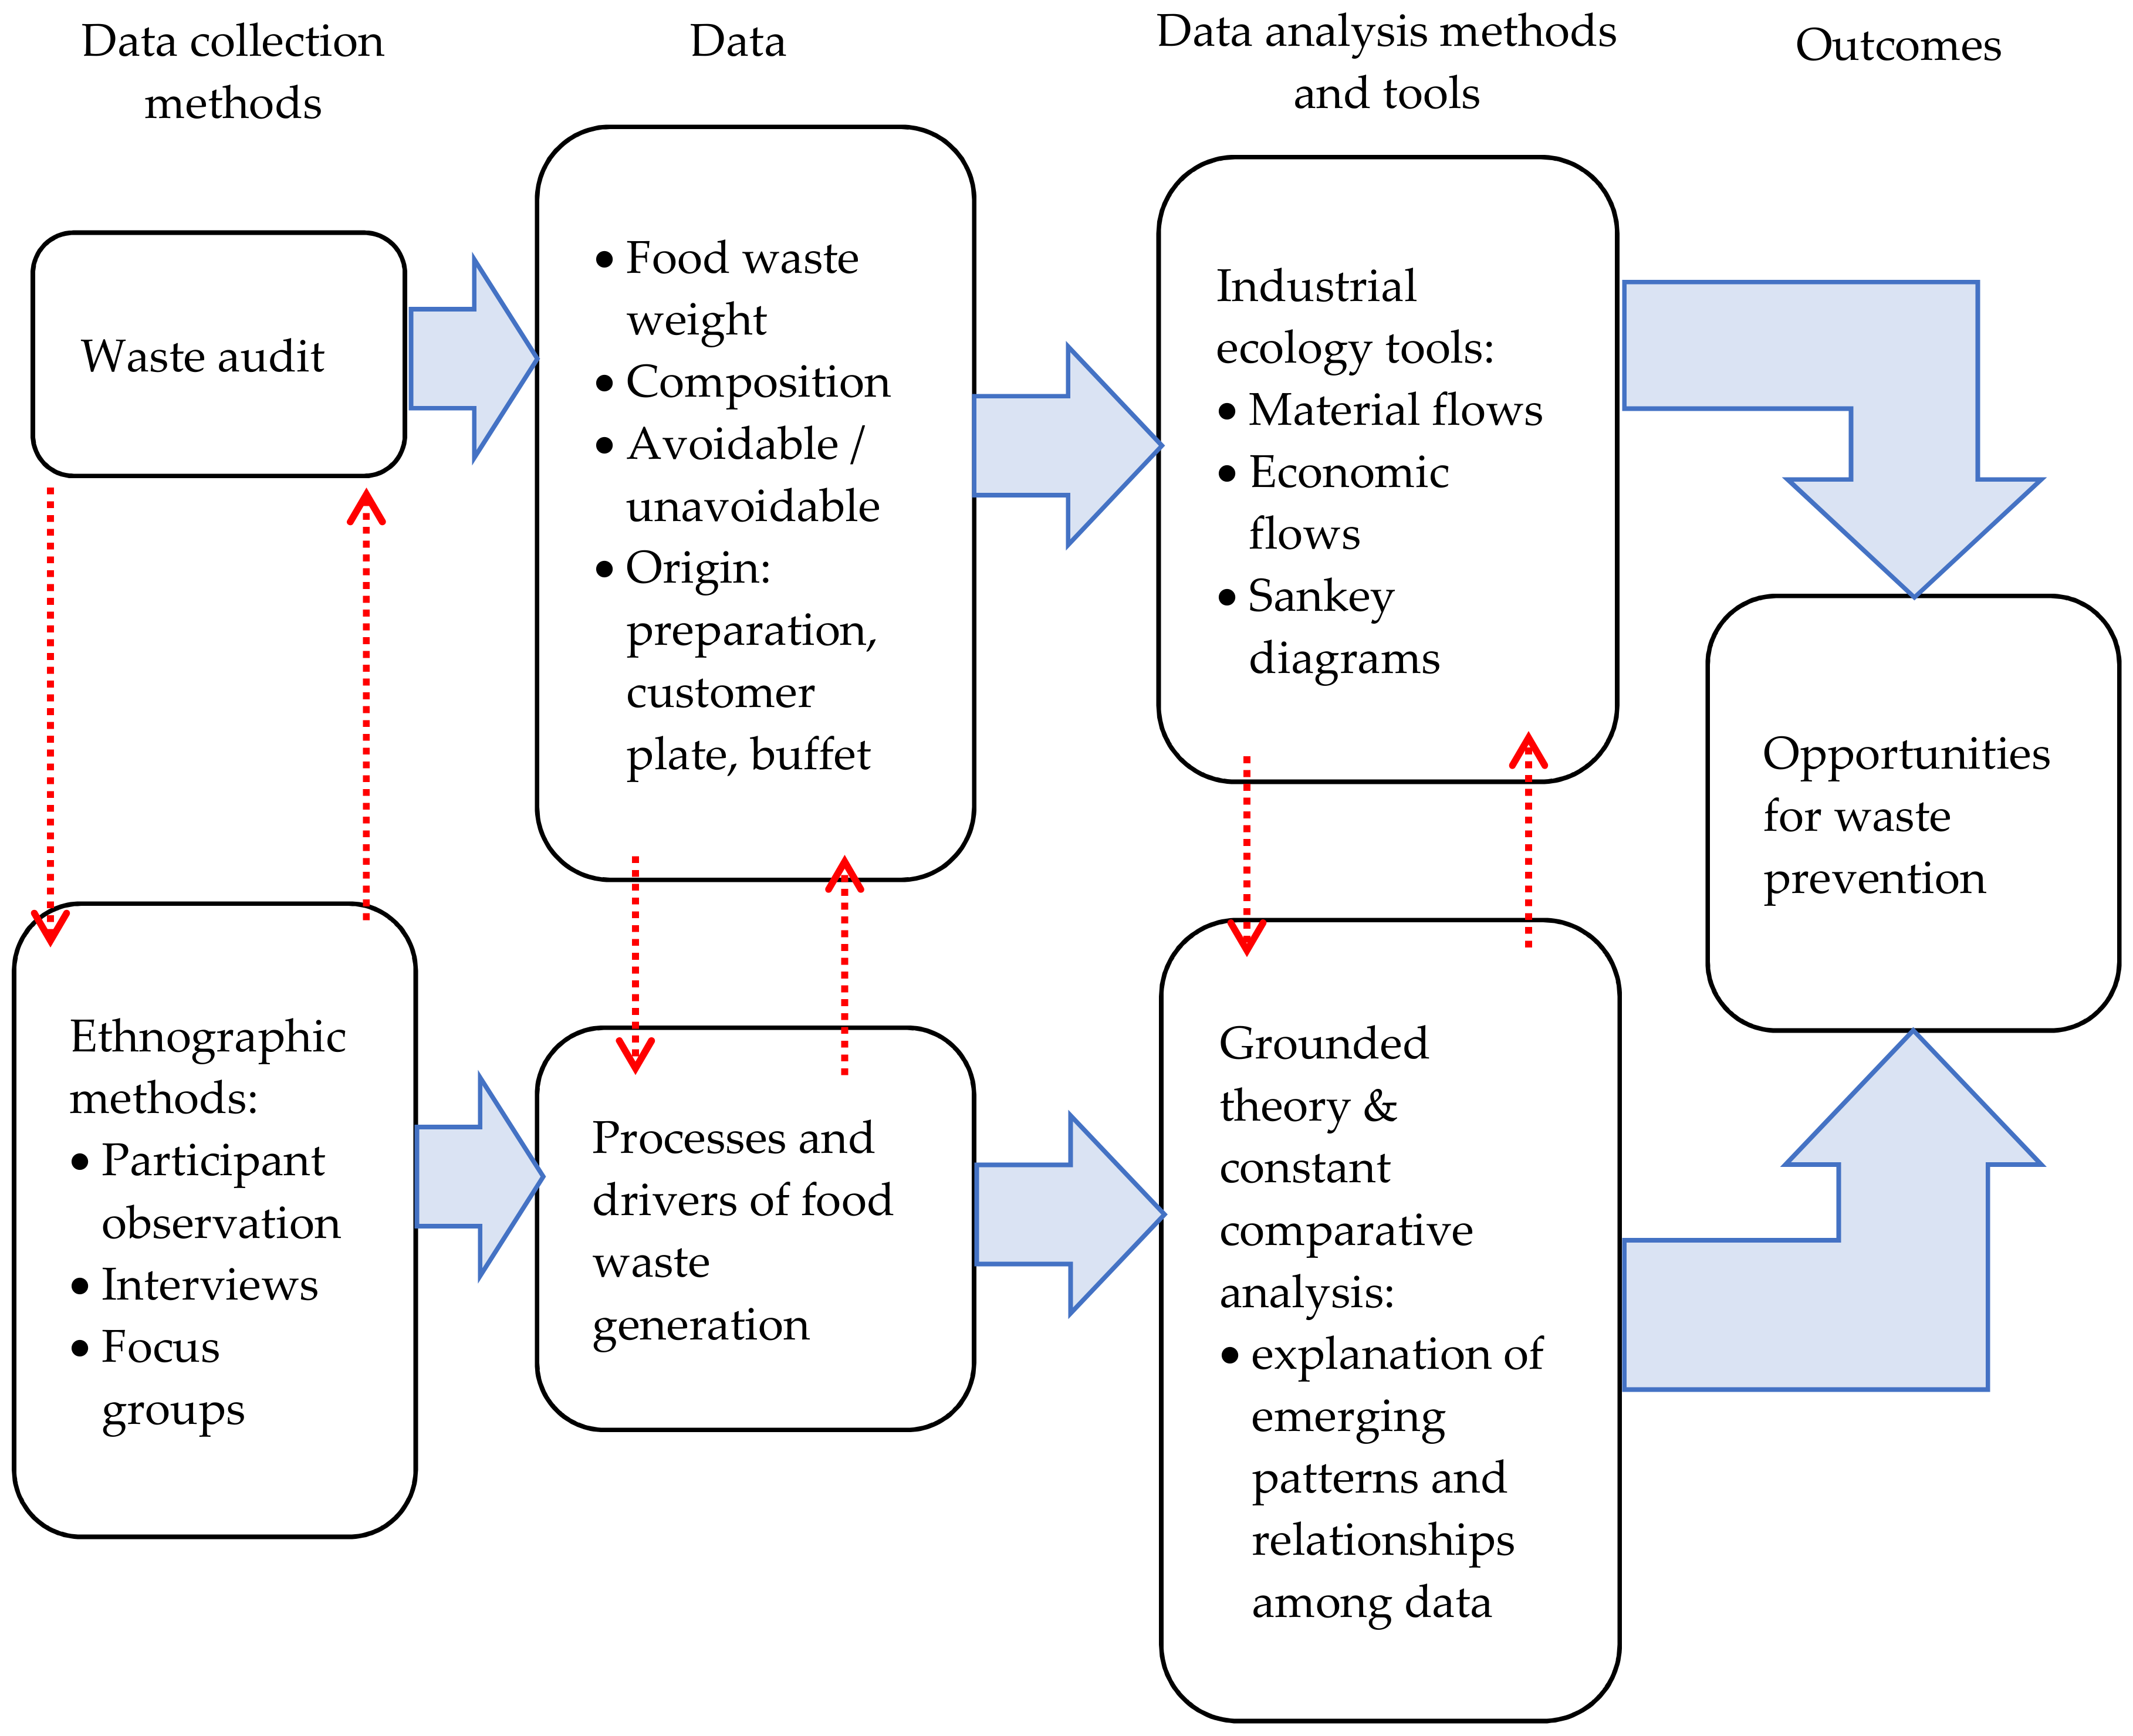
3. Methods
4. Results and Discussion
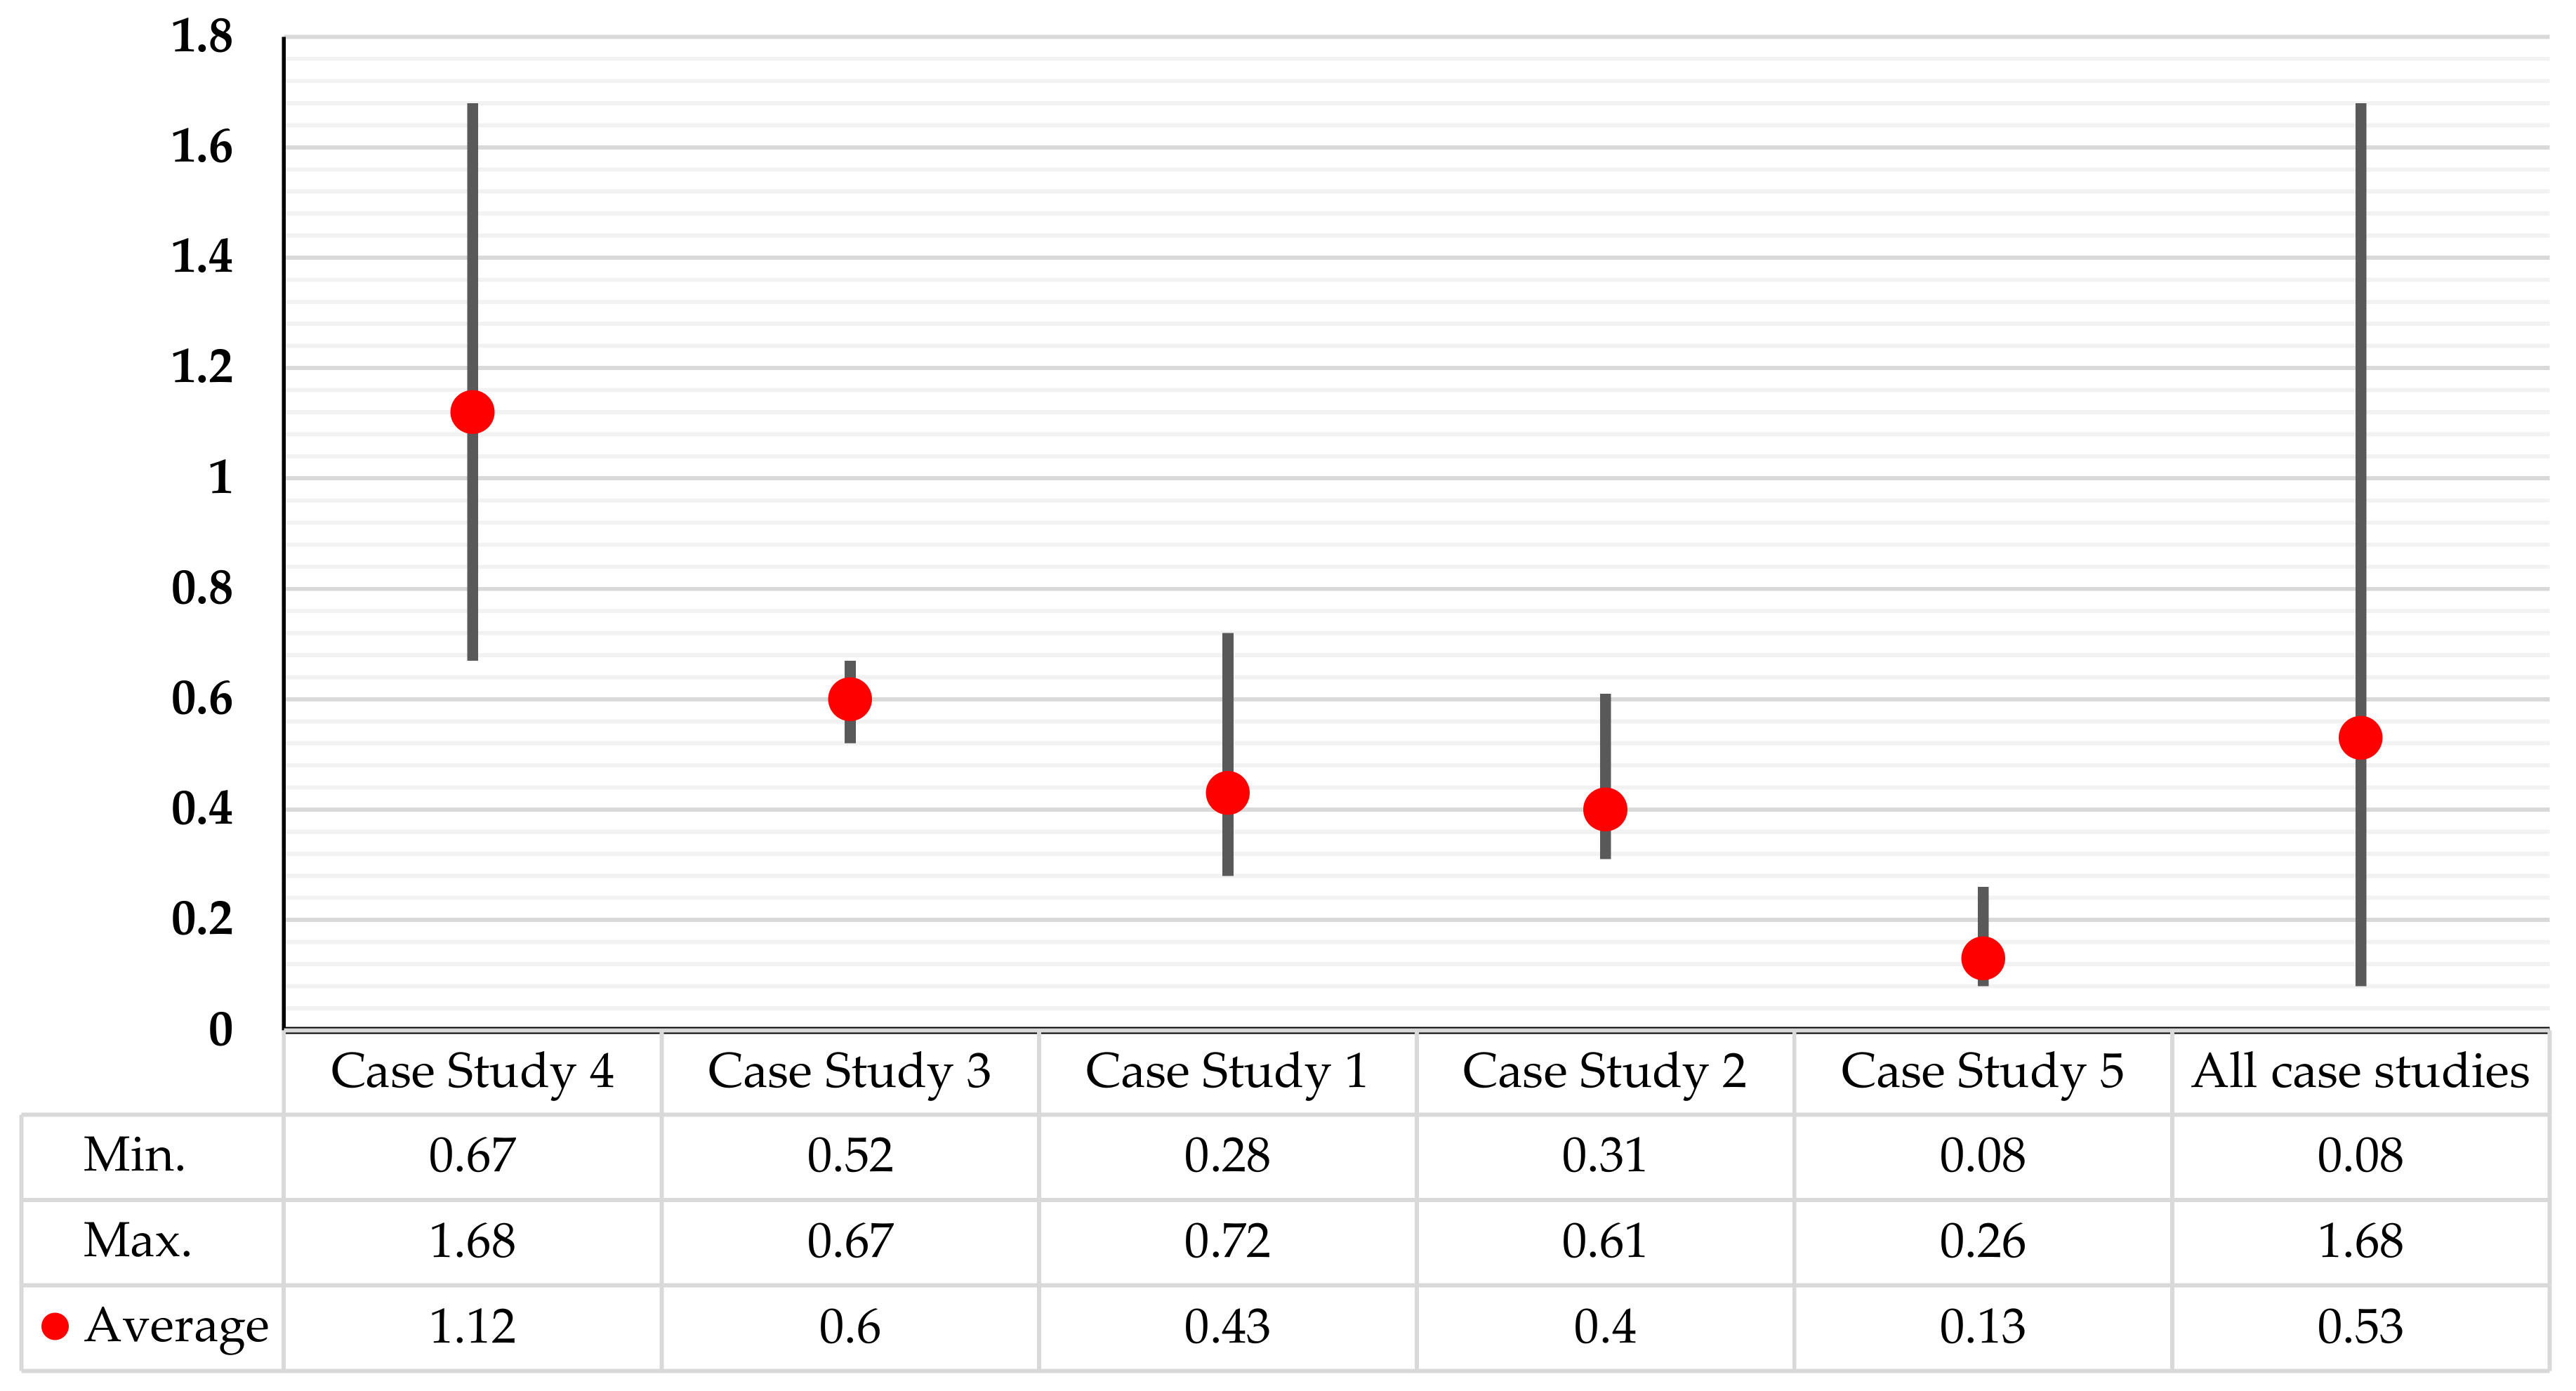
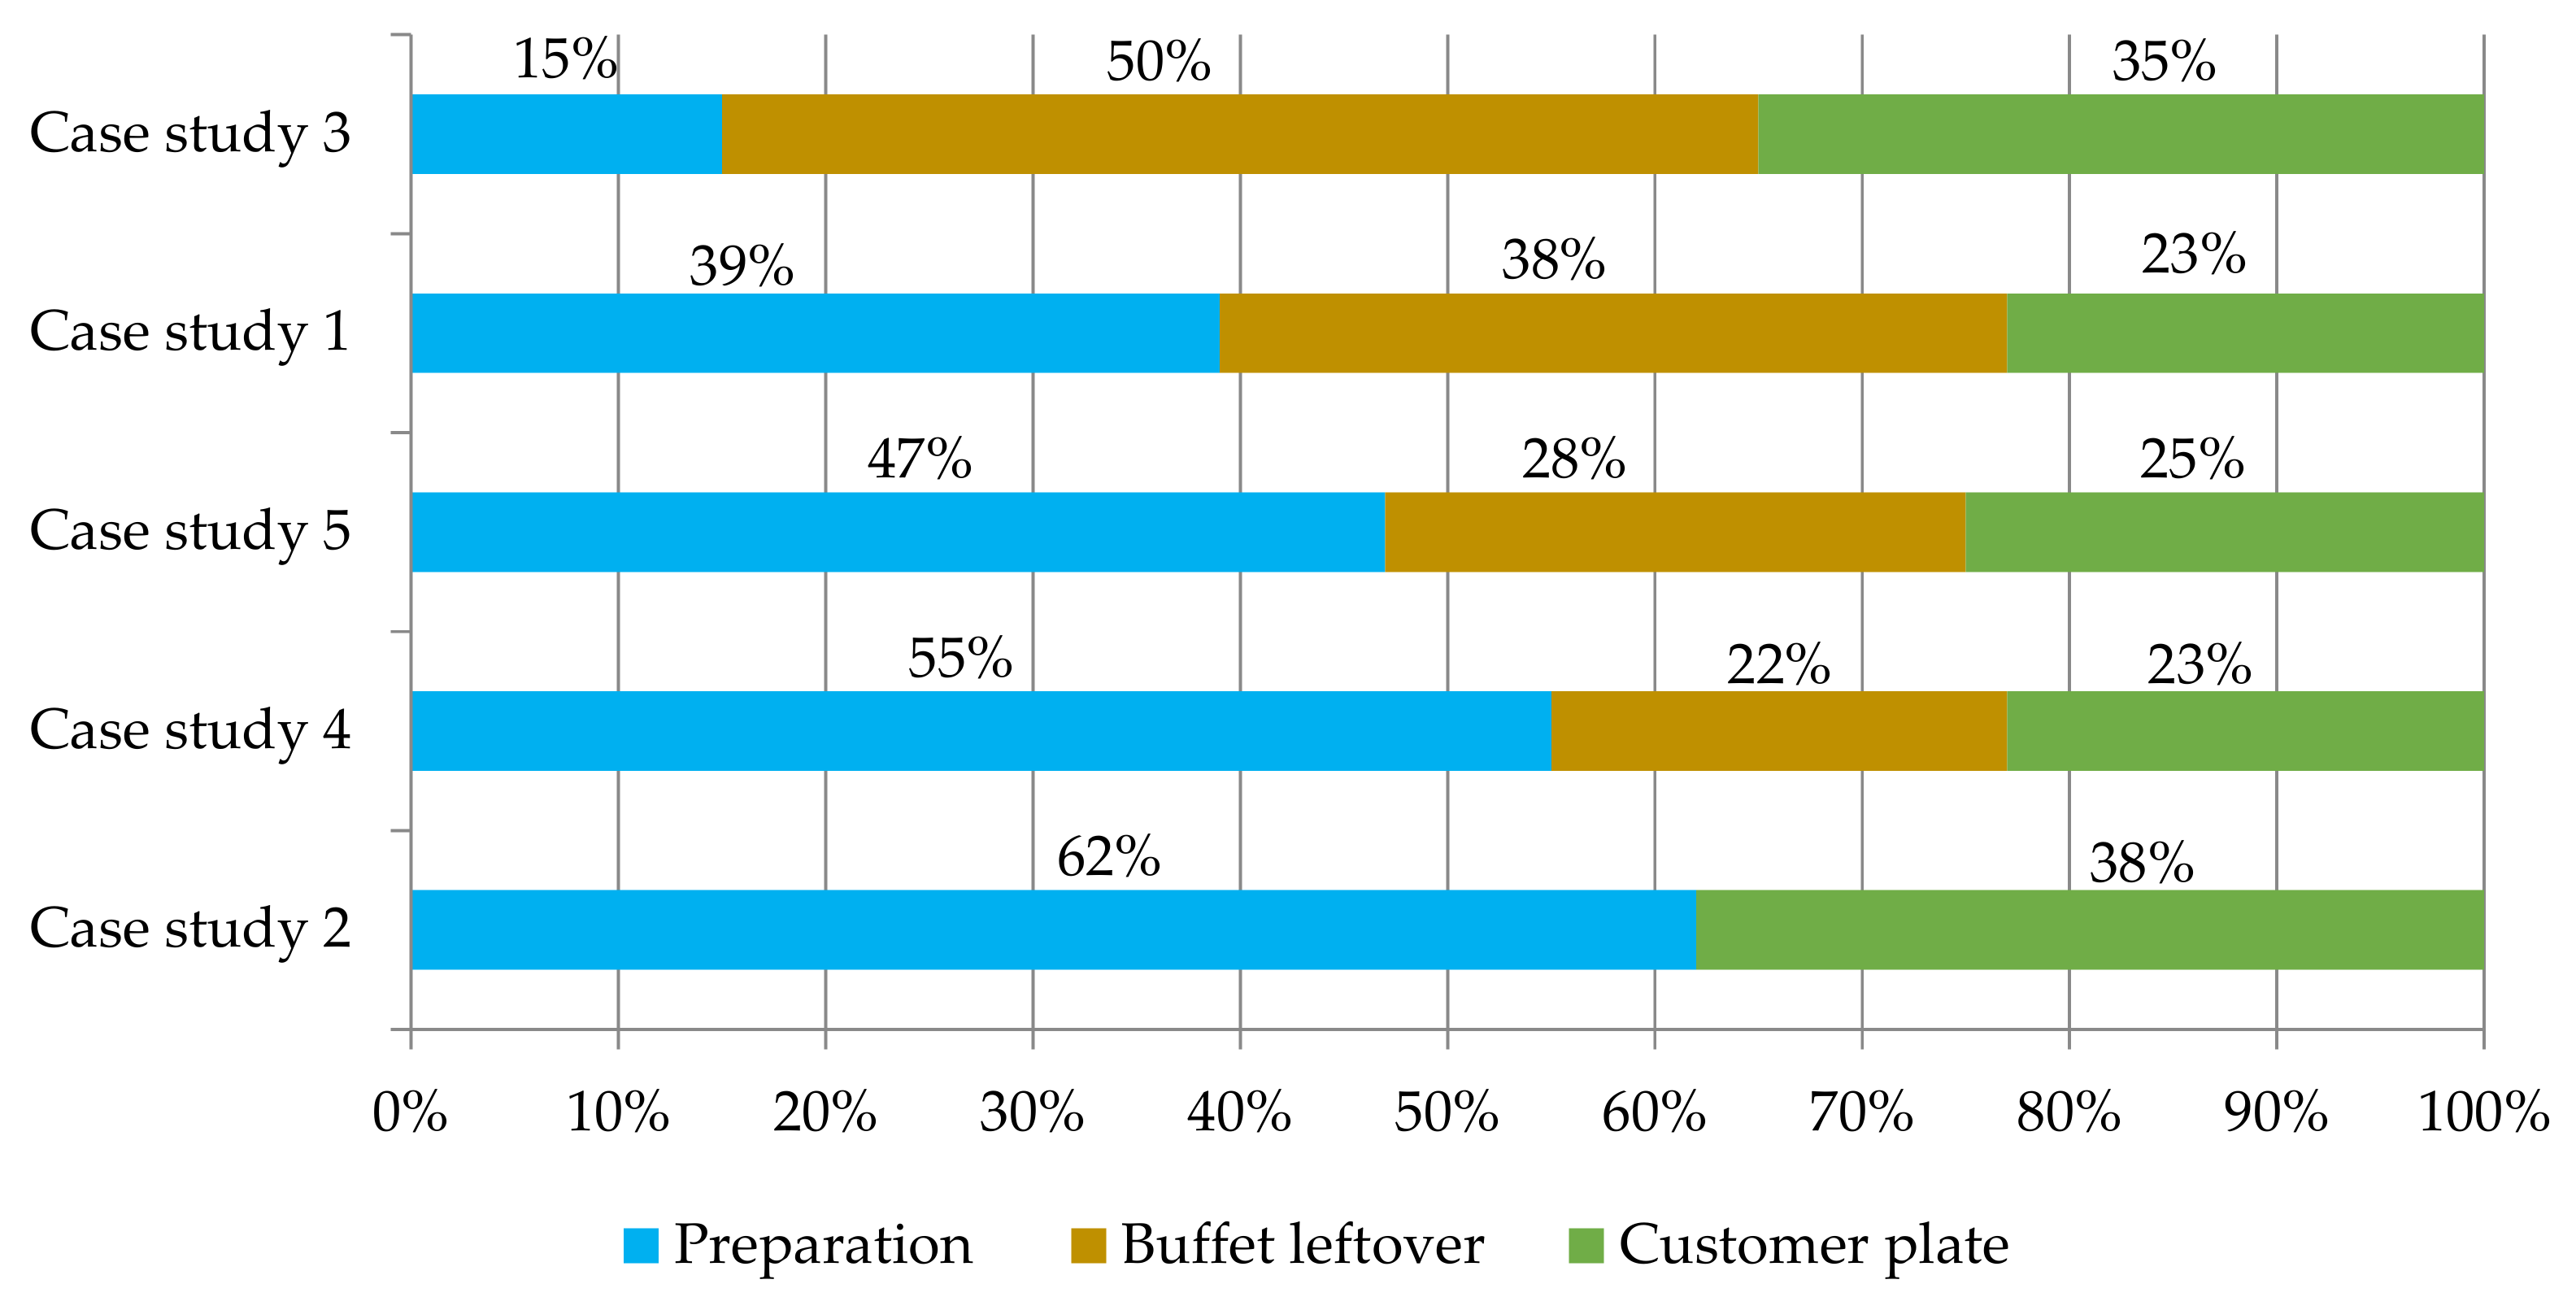
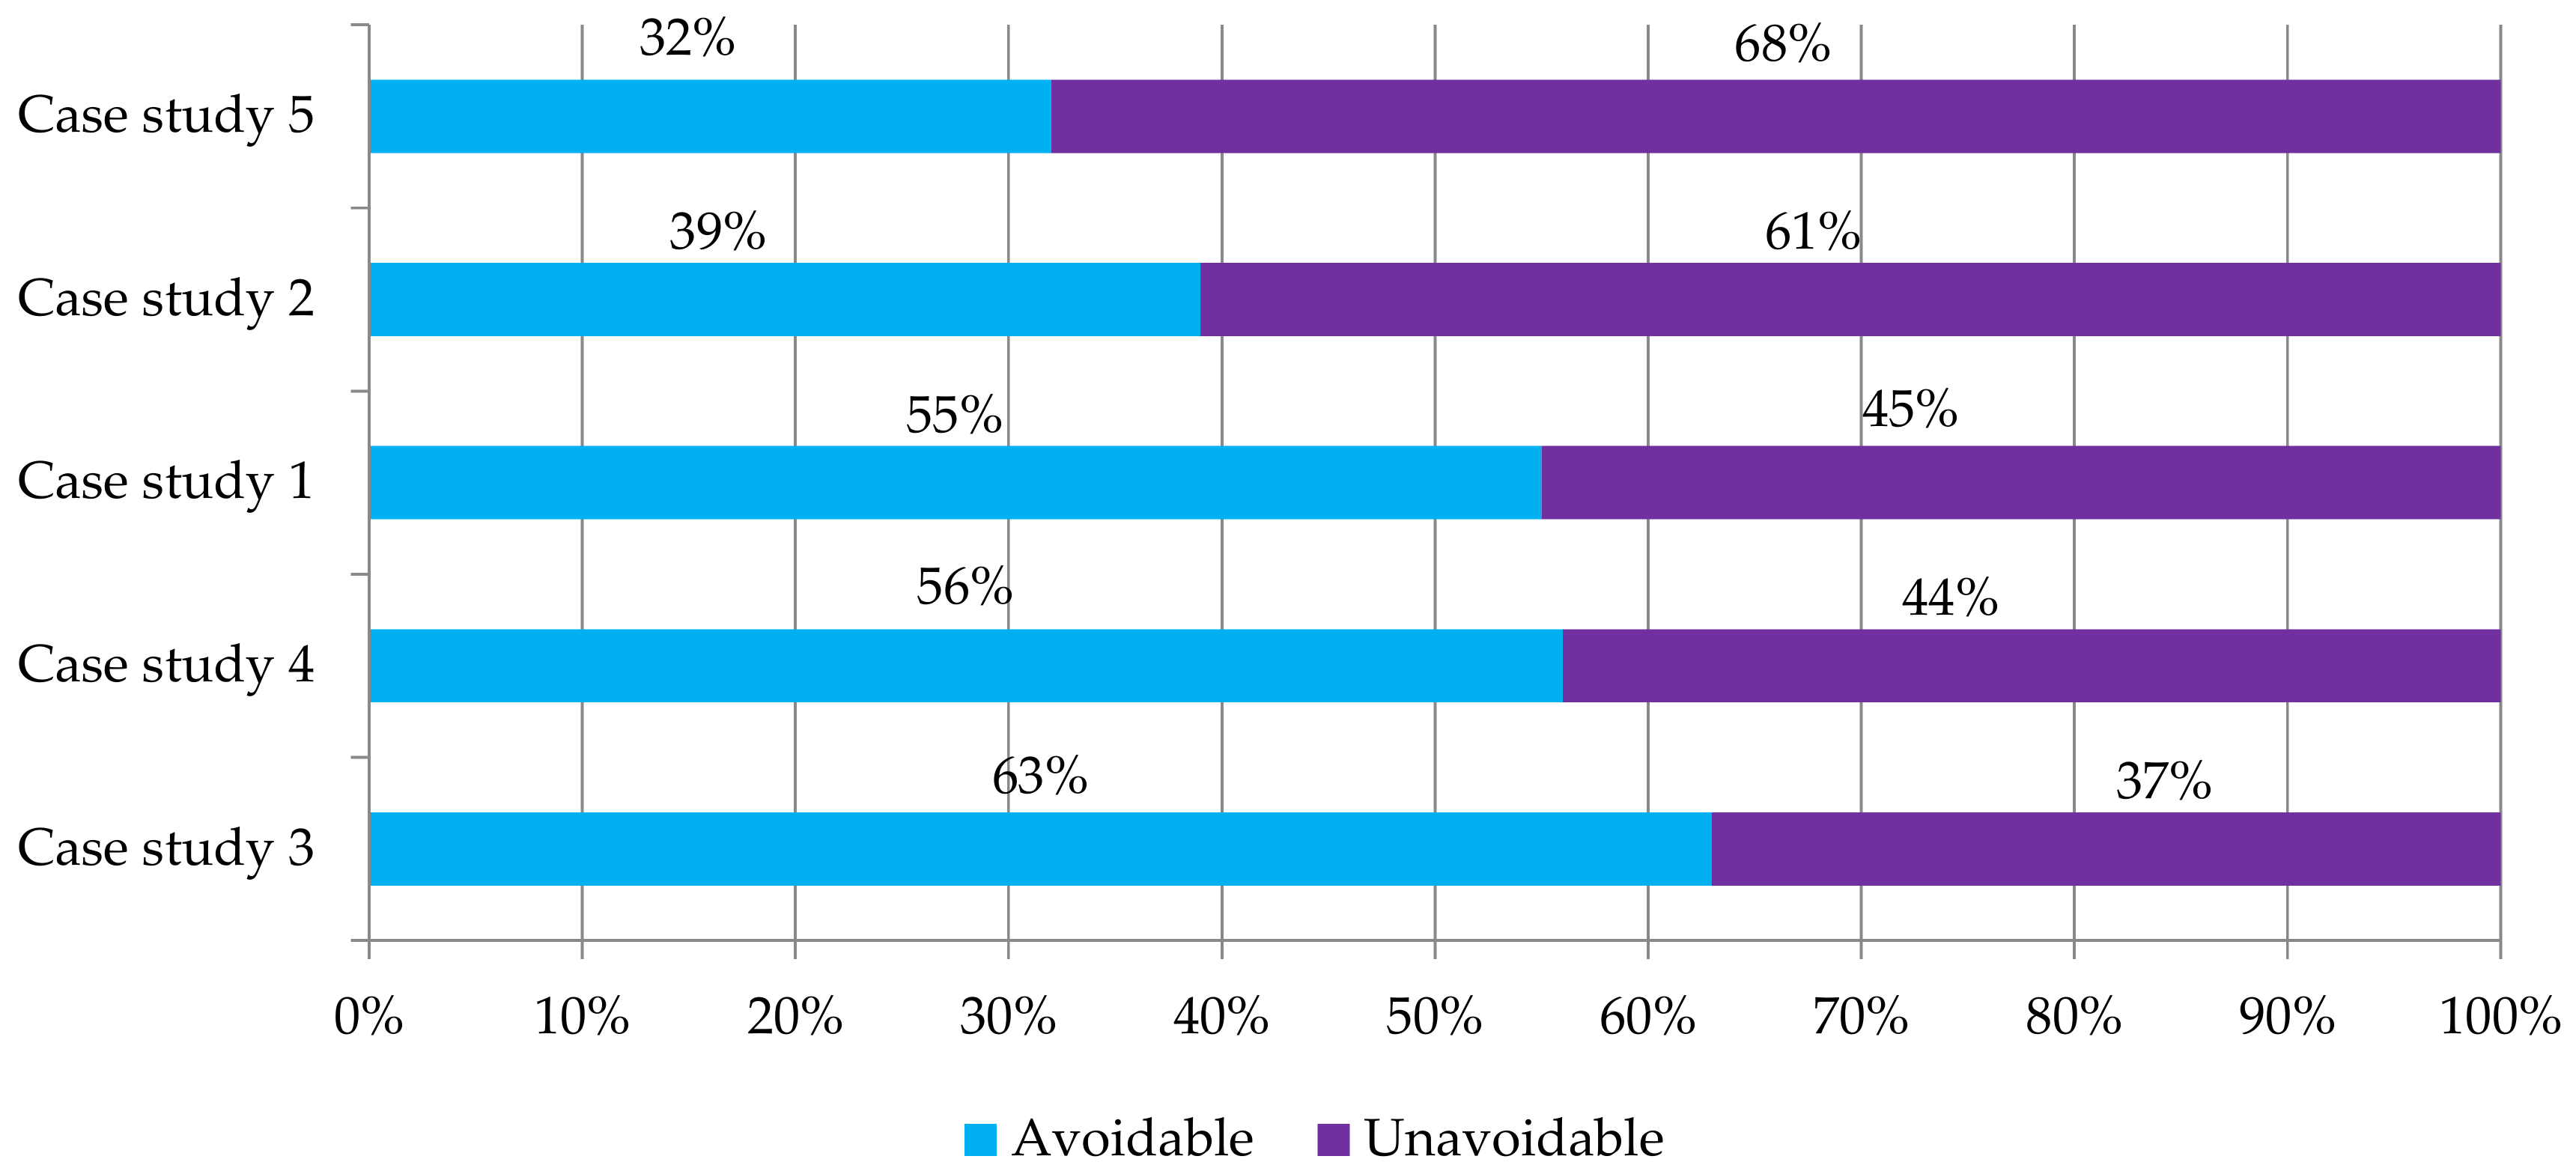
4.1. Patterns and Causes of Food Waste Generation
I see the plates when they come back here to be washed. The stuff that people waste is so much. And good food too. We need to educate them [customers] but it’s hard because they don’t see all the work that goes on back here, just the finished dish. I tell you, this is where the problem is.
Some of the younger cooks don’t know how to and they don’t care. They have no training and they learn on the job, but they rush things to go faster and you see what they do [he points to a discarded watermelon skin with a lot of the ripe, red edible part of the fruit still on the skin]. That’s why I only trust my experienced staff to cut the expensive stuff like meat and fish.
Look at this [pointing at food items on the buffet that have to be thrown away because they need to ’change over’ the buffet]. This is bad, there’s nothing wrong with this food, it could last for another 2 hours. We have to throw it away because they [pointing at the manager’s office] are worried about HQ [headquarters].
They [the customer] make a booking for 200 people and 100 turn up. They don’t care, they have paid for 200 so we have prepared for 200. But it’s such a waste, and we can’t tell them off because you know, they are paying.
The booking department don’t understand, they think we can change the menu and number [of meals prepared] last minute. I can’t, I need at least a week, I need to put my order in purchasing [department] so I have the right ingredients and quantity.
I told them [the customer] this is not the best menu for the type of event he picked, but he didn’t listen. He wanted ’proper’ food you know, not ’finger’ food. But the layout was set up for networking, no chairs, so people couldn’t eat the curry standing up. And he had all these models and actresses coming, celebrities, you know they didn’t eat anything!
At training they always tell us how to explain the menu to customers. They tell us to give advice if they start ordering too much. Tell them things like ’this dish is enough for 2 people’, or ’this is a big portion’. Sometimes they [customers] listen. But sometimes they want to show off, you know, when business people take big clients out.
Each food stall makes one dish so we know what we need. I buy everything I need from the Dato Karamat market [the nearest fresh produce market], in the morning then cook it here. I don’t make much, so I don’t have much ’balance’ [leftover food] when I finish up. When it’s gone, it’s gone. The students know that, so they come early before I ran out. I know when the students go back home so I cook less then, enough only for staff.
Researcher: Are you happy with the buffet?
Customer in Operation 1: Yes, the buffet is good value for money. It has so many items, a lot of choice, and it was full even towards the end. I tried them all.
The customers don’t come here for the rice, they come because of our reputation for the meat and fish, and our speciality dishes on the menu. But the habit is always to order rice and most times they order more than they need. But it’s cheap so they don’t worry about it.
4.2. Food Waste Prevention Recommendations
5. Conclusions
Author Contributions
Funding
Acknowledgments
Conflicts of Interest
References
- Gustavsson, J.; Cederberg, C.; Sonesson, U.; Van Otterdijk, R.; Meybeck, A. Global Food Losses and Food Waste. Extent, Causes and Prevention; FAO: Rome, Italy, 2011. [Google Scholar]
- United Nations. Transforming our world: The 2030 agenda for sustainable development. In Proceedings of the General Assembly 70 Session, New York, NY, USA, 25 September 2015. [Google Scholar]
- FAO. Global Initiative on Food Loss and Food Waste Reduction; FAO: Rome, Italy, 2015. [Google Scholar]
- Parfitt, J.; Barthel, M.; Macnaughton, S. Food waste within food supply chains: Quantification and potential for change to 2050. Philos. Trans. R. Soc. Lond. B. Biol. Sci. 2010, 365, 3065–3081. [Google Scholar] [CrossRef] [PubMed]
- WRAP. Overview of Waste in the UK Hospitality and Food Service Sector; WRAP: Banbury, UK, 2013. [Google Scholar]
- Malefors, C.; Callewaert, P.; Hansson, P.A.; Hartikainen, H.; Pietiläinen, O.; Strid, I.; Strotmann, C.; Eriksson, M. Towards a baseline for food-waste quantification in the hospitality sector-quantities and data processing criteria. Sustainability 2019, 11, 3541. [Google Scholar] [CrossRef]
- Filimonau, V.; de Coteau, D.A. Food waste management in hospitality operations: A critical review. Tour. Manag. 2019, 71, 234–245. [Google Scholar] [CrossRef]
- Heikkilä, L.; Reinikainen, A.; Katajajuuri, J.M.; Silvennoinen, K.; Hartikainen, H. Elements affecting food waste in the food service sector. Waste Manag. 2016, 56, 446–453. [Google Scholar] [CrossRef] [PubMed]
- Silvennoinen, K.; Nisonen, S.; Pietiläinen, O. Food waste case study and monitoring developing in Finnish food services. Waste Manag. 2019, 97, 97–104. [Google Scholar] [CrossRef] [PubMed]
- Sakaguchi, L.; Pak, N.; Potts, M.D. Tackling the issue of food waste in restaurants: Options for measurement method, reduction and behavioral change. J. Clean. Prod. 2018, 180, 430–436. [Google Scholar] [CrossRef] [Green Version]
- Stöckli, S.; Dorn, M.; Liechti, S. Normative prompts reduce consumer food waste in restaurants. Waste Manag. 2018, 77, 532–536. [Google Scholar] [CrossRef]
- Hennchen, B. Knowing the kitchen: Applying practice theory to issues of food waste in the food service sector. J. Clean. Prod. 2019, 225, 675–683. [Google Scholar] [CrossRef]
- Martin-rios, C.; Demen-meier, C.; Gössling, S.; Cornuz, C. Food waste management innovations in the foodservice industry. Waste Manag. 2018, 79, 196–206. [Google Scholar] [CrossRef] [Green Version]
- Betz, A.; Buchli, J.; Göbel, C.; Müller, C. Food waste in the Swiss food service industry—Magnitude and potential for reduction. Waste Manag. 2015, 35, 218–226. [Google Scholar] [CrossRef]
- Okumus, B. How do hotels manage food waste? evidence from hotels in Orlando, Florida. J. Hosp. Mark. Manag. 2019, 13, 1–19. [Google Scholar] [CrossRef]
- Principato, L.; Pratesi, C.A.; Secondi, L. Towards Zero Waste: An Exploratory Study on Restaurant managers. Int. J. Hosp. Manag. 2018, 74, 130–137. [Google Scholar] [CrossRef]
- Bharucha, J. Tackling the challenges of reducing and managing food waste in Mumbai restaurants. Br. Food J. 2018, 120, 639–649. [Google Scholar] [CrossRef]
- Al-Domi, H.; Al-Rawajfeh, H.; Aboyousif, F.; Yaghi, S.; Mashal, R.; Fakhoury, J. Determining and addressing food plate waste in a group of students at the University of Jordan. Pak. J. Nutr. 2011, 10, 871–878. [Google Scholar]
- Wang, L.; Xue, L.; Li, Y.; Liu, X.; Cheng, S.; Liu, G. Horeca food waste and its ecological footprint in Lhasa, Tibet, China. Resour. Conserv. Recycl. 2018, 136, 1–8. [Google Scholar] [CrossRef]
- Garnett, T. Where are the best opportunities for reducing greenhouse gas emissions in the food system (including the food chain)? Food Policy 2011, 36, S23–S32. [Google Scholar] [CrossRef]
- Padfield, R.; Papargyropoulou, E.; Preece, C. A preliminary assessment of greenhouse gas emission trends in the production and consumption of food in Malaysia. Int. J. Technol. 2012, 3, 55–66. [Google Scholar]
- Scherhaufer, S.; Moates, G.; Hartikainen, H.; Waldron, K.; Obersteiner, G. Environmental impacts of food waste in Europe. Waste Manag. 2018, 77, 98–113. [Google Scholar] [CrossRef]
- Brancoli, P.; Rousta, K.; Bolton, K. Life cycle assessment of supermarket food waste. Resour. Conserv. Recycl. 2017, 118, 39–46. [Google Scholar] [CrossRef]
- Nahman, A.; de Lange, W. Costs of food waste along the value chain: Evidence from South Africa. Waste Manag. 2013, 33, 2493–2500. [Google Scholar] [CrossRef]
- Dias-Ferreira, C.; Santos, T.; Oliveira, V. Hospital food waste and environmental and economic indicators—A Portuguese case study. Waste Manag. 2015, 46, 146–154. [Google Scholar] [CrossRef] [PubMed]
- Papargyropoulou, E.; Colenbrander, S.; Sudmant, A.H.; Gouldson, A.; Tin, L.C. The economic case for low carbon waste management in rapidly growing cities in the developing world: The case of Palembang, Indonesia. J. Environ. Manag. 2015, 163, 11–19. [Google Scholar] [CrossRef]
- Buzby, J.C.; Hyman, J. Total and per capita value of food loss in the United States. Food Policy 2012, 37, 561–570. [Google Scholar] [CrossRef]
- Schneider, F. The evolution of food donation with respect to waste prevention. Waste Manag. 2013, 33, 755–763. [Google Scholar] [CrossRef] [PubMed]
- Edwards, F.; Mercer, D. Gleaning from Gluttony: An Australian youth subculture confronts the ethics of waste. Aust. Geogr. 2007, 38, 279–296. [Google Scholar] [CrossRef]
- Evans, D.; Campbell, H.; Murcott, A. Waste Matters: New Perspectives on Food and Society, 1st ed.; The Sociological Review; Wiley-Blackwell: Oxford, UK, 2013. [Google Scholar]
- Song, G.; Li, M.; Semakula, H.M.; Zhang, S. Food consumption and waste and the embedded carbon, water and ecological footprints of households in China. Sci. Total Environ. 2015, 529, 191–197. [Google Scholar] [CrossRef] [PubMed]
- Abeliotis, K.; Lasaridi, K.; Costarelli, V.; Chroni, C. The implications of food waste generation on climate change: The case of Greece. Sustain. Prod. Consum. 2015, 3, 8–14. [Google Scholar] [CrossRef]
- Scholz, K.; Eriksson, M.; Strid, I. Carbon footprint of supermarket food waste. Resour. Conserv. Recycl. 2014, 94, 56–65. [Google Scholar] [CrossRef]
- Kummu, M.; de Moel, H.; Porkka, M.; Siebert, S.; Varis, O.; Ward, P.J. Lost food, wasted resources: Global food supply chain losses and their impacts on freshwater, cropland, and fertiliser use. Sci. Total Environ. 2012, 438, 477–489. [Google Scholar] [CrossRef]
- Garnett, T. Three perspectives on sustainable food security: Efficiency, demand restraint, food system transformation. What role for life cycle assessment? J. Clean. Prod. 2014, 73, 10–18. [Google Scholar] [CrossRef]
- Dou, Z.; Ferguson, J.D.; Galligan, D.T.; Kelly, A.M.; Finn, S.M.; Giegengack, R. Assessing U.S. food wastage and opportunities for reduction. Glob. Food Secur. 2016, 8, 19–26. [Google Scholar] [CrossRef] [Green Version]
- Thi, N.B.D.; Kumar, G.; Lin, C.-Y. An overview of food waste management in developing countries: Current status and future perspective. J. Environ. Manag. 2015, 157, 220–229. [Google Scholar] [CrossRef] [PubMed]
- Xue, L.; Liu, G.; Parfitt, J.; Liu, X.; Van Herpen, E.; Stenmarck, Å.; O’Connor, C.; Östergren, K.; Cheng, S. Missing Food, Missing Data? A Critical Review of Global Food Losses and Food Waste Data. Environ. Sci. Technol. 2017, 51, 6618–6633. [Google Scholar] [CrossRef] [PubMed]
- Chen, H.; Jiang, W.; Yang, Y.; Yang, Y.; Man, X. State of the art on food waste research: A bibliometrics study from 1997 to 2014. J. Clean. Prod. 2016, 140, 840–846. [Google Scholar] [CrossRef]
- Evans, D. Blaming the consumer—Once again: The social and material contexts of everyday food waste practices in some English households. Crit. Public Health 2011, 21, 429–440. [Google Scholar] [CrossRef]
- Parizeau, K.; von Massow, M.; Martin, R. Household-level dynamics of food waste production and related beliefs, attitudes, and behaviours in Guelph, Ontario. Waste Manag. 2015, 35, 207–217. [Google Scholar] [CrossRef]
- Secondi, L.; Principato, L.; Laureti, T. Household food waste behaviour in EU-27 countries: A multilevel analysis. Food Policy 2015, 56, 25–40. [Google Scholar] [CrossRef]
- Mallinson, L.J.; Russell, J.M.; Barker, M.E. Attitudes and behaviour towards convenience food and food waste in the United Kingdom. Appetite 2016, 103, 17–28. [Google Scholar] [CrossRef] [Green Version]
- van Holsteijn, F.; Kemna, R. Minimizing food waste by improving storage conditions in household refrigeration. Resour. Conserv. Recycl. 2018, 128, 25–31. [Google Scholar] [CrossRef]
- Stefan, V.; van Herpen, E.; Tudoran, A.A.; Lähteenmäki, L. Avoiding food waste by Romanian consumers: The importance of planning and shopping routines. Food Qual. Prefer. 2013, 28, 375–381. [Google Scholar] [CrossRef]
- Stancu, V.; Haugaard, P.; Lähteenmäki, L. Determinants of consumer food waste behaviour: Two routes to food waste. Appetite 2016, 96, 7–17. [Google Scholar] [CrossRef] [PubMed]
- Schmidt, K.; Matthies, E. Where to start fighting the food waste problem? Identifying most promising entry points for intervention programs to reduce household food waste and overconsumption of food. Resour. Conserv. Recycl. 2018, 139, 1–14. [Google Scholar] [CrossRef]
- Bernstad, A. Household food waste separation behavior and the importance of convenience. Waste Manag. 2014, 34, 1317–1323. [Google Scholar] [CrossRef] [PubMed]
- Miliute-Plepiene, J.; Plepys, A. Does food sorting prevents and improves sorting of household waste? A case in Sweden. J. Clean. Prod. 2014, 101, 182–192. [Google Scholar] [CrossRef]
- Rispo, A.; Williams, I.D.; Shaw, P.J. Source segregation and food waste prevention activities in high-density households in a deprived urban area. Waste Manag. 2015, 44, 15–27. [Google Scholar] [CrossRef]
- Visschers, V.H.M.; Wickli, N.; Siegrist, M. Sorting out food waste behaviour: A survey on the motivators and barriers of self-reported amounts of food waste in households. J. Environ. Psychol. 2016, 45, 66–78. [Google Scholar] [CrossRef]
- Bolton, L.E.; Alba, J.W. When less is more: Consumer aversion to unused utility. J. Consum. Psychol. 2012, 22, 369–383. [Google Scholar] [CrossRef]
- Russell, S.V.; Young, C.W.; Unsworth, K.L.; Robinson, C. Bringing habits and emotions into food waste behaviour. Resour. Conserv. Recycl. 2017, 125, 107–114. [Google Scholar] [CrossRef]
- Evans, D. Food Waste: Home Consumption, Material Culture and Everyday Life; Bloomsbury Academic: London, UK, 2014. [Google Scholar]
- Leray, L.; Sahakian, M.; Erkman, S. Understanding household food metabolism: Relating micro-level material flow analysis to consumption practices. J. Clean. Prod. 2016, 125, 44–55. [Google Scholar] [CrossRef]
- Narvanen, E.; Mesiranta, N.; Sutinen, U.-M.; Mattila, M. Creativity, aesthetics and ethics of food waste in social media campaigns. J. Clean. Prod. 2018, 195, 102–110. [Google Scholar] [CrossRef]
- Young, W.; Russell, S.V.; Robinson, C.A.; Barkemeyer, R. Can social media be a tool for reducing consumers’ food waste? A behaviour change experiment by a UK retailer. Resour. Conserv. Recycl. 2017, 117, 195–203. [Google Scholar] [CrossRef]
- Beretta, C.; Stoessel, F.; Baier, U.; Hellweg, S. Quantifying food losses and the potential for reduction in Switzerland. Waste Manag. 2013, 33, 764–773. [Google Scholar] [CrossRef] [PubMed]
- Katajajuuri, J.M.; Silvennoinen, K.; Hartikainen, H.; Heikkilä, L.; Reinikainen, A. Food waste in the Finnish food chain. J. Clean. Prod. 2014, 73, 322–329. [Google Scholar] [CrossRef]
- Sonnino, R.; McWilliam, S. Food waste, catering practices and public procurement: A case study of hospital food systems in Wales. Food Policy 2011, 36, 823–829. [Google Scholar] [CrossRef]
- Williams, P.; Walton, K. Plate waste in hospitals and strategies for change. e-SPEN 2011, 6, e235–e241. [Google Scholar] [CrossRef] [Green Version]
- Goonan, S.; Mirosa, M.; Spence, H. Getting a taste for food waste: A mixed methods ethnographic study into hospital food waste before patient consumption conducted at three new zealand foodservice facilities. J. Acad. Nutr. Diet. 2014, 114, 63–71. [Google Scholar] [CrossRef] [PubMed]
- Girotto, F.; Alibardi, L.; Cossu, R. Food waste generation and industrial uses: A review. Waste Manag. 2015, 45, 32–41. [Google Scholar] [CrossRef]
- Richter, B.; Bokelmann, W. Approaches of the German food industry for addressing the issue of food losses. Waste Manag. 2016, 48, 423–429. [Google Scholar] [CrossRef]
- Thiagarajah, K.; Getty, V.M. Impact on Plate Waste of Switching from a Tray to a Trayless Delivery System in a University Dining Hall and Employee Response to the Switch. J. Acad. Nutr. Diet. 2013, 113, 141–145. [Google Scholar] [CrossRef]
- Bisogni, C.A.; Connors, M.; Devine, C.M.; Sobal, J. Who We Are and How We Eat: A Qualitative Study of Identities in Food Coice. J. Nutr. Educ. Behav. 2002, 34, 128–139. [Google Scholar] [CrossRef]
- Lazell, J. Consumer food waste behaviour in universities: Sharing as a means of prevention. J. Consum. Behav. 2016, 15, 430–439. [Google Scholar] [CrossRef]
- Pirani, S.I.; Arafat, H.A. Reduction of Food Waste Generation in the Hospitality Industry. J. Clean. Prod. 2015, 132, 129–145. [Google Scholar] [CrossRef]
- Silvennoinen, K.; Heikkila, L.; Katajajuuri, J.M.; Reinikainen, A. Food waste volume and origin: Case studies in the Finnish food service sector. Waste Manag. 2015, 46, 140–145. [Google Scholar] [CrossRef] [PubMed]
- Kallbekken, S.; Sælen, H. ’Nudging’ hotel guests to reduce food waste as a win-win environmental measure. Econ. Lett. 2013, 119, 325–327. [Google Scholar] [CrossRef]
- Halloran, A.; Clement, J.; Kornum, N.; Bucatariu, C.; Magid, J. Addressing food waste reduction in Denmark. Food Policy 2014, 49, 294–301. [Google Scholar] [CrossRef]
- Thyberg, K.L.; Tonjes, D.J. Drivers of food waste and their implications for sustainable policy development. Resour. Conserv. Recycl. 2016, 106, 110–123. [Google Scholar] [CrossRef]
- Cohen, M.J. Supplementing the Conventional 3r Waste Hierarchy. In Waste Management and Sustainable Consumption: Reflections on Consumer Waste; Karin, M.E., Ed.; Routledge: New York, NY, USA, 2015. [Google Scholar]
- Herszenhorn, E.; Quested, T.; Easteal, S.; Prowse, G.; Lomax, J.; Bucatariu, C. Prevention and Reduction of Food and Drink Waste in Businesses and Households: Guidance for Governments, Local Authorities, Businesses and other Organisations; FAO: Rome, Italy, 2014. [Google Scholar]
- Garrone, P.; Melacini, M.; Perego, A. Opening the black box of food waste reduction. Food Policy 2014, 46, 129–139. [Google Scholar] [CrossRef]
- Alexander, C.; Smaje, C. Surplus retail food redistribution: An analysis of a third sector model. Resour. Conserv. Recycl. 2008, 52, 1290–1298. [Google Scholar] [CrossRef]
- Cicatiello, C.; Franco, S.; Pancino, B.; Blasi, E. The value of food waste: An exploratory study on retailing. J. Retail. Consum. Serv. 2016, 30, 96–104. [Google Scholar] [CrossRef]
- Midgley, J.L. The logics of surplus food redistribution. J. Environ. Plan. Manag. 2013, 57, 1872–1892. [Google Scholar] [CrossRef]
- Warshawsky, D.N. The devolution of urban food waste governance: Case study of food rescue in Los Angeles. Cities 2015, 49, 26–34. [Google Scholar] [CrossRef]
- Collins, P.A.; Power, E.M.; Little, M.H. Municipal-level responses to household food insecurity in Canada: A call for critical, evaluative research. Can. J. Public Health 2014, 105, e138–e141. [Google Scholar] [CrossRef] [PubMed]
- Papargyropoulou, E.; Wright, N.; Lozano, R.; Steinberger, J.; Padfield, R.; Ujang, Z. Conceptual framework for the study of food waste generation and prevention in the hospitality sector. Waste Manag. 2016, 49, 326–336. [Google Scholar] [CrossRef] [PubMed]
- Eriksson, M.; Osowski, C.P.; Björkman, J.; Hansson, E.; Malefors, C.; Eriksson, E.; Ghosh, R. The tree structure—A general framework for food waste quanti fi cation in food services. Resour. Conserv. Recycl. 2018, 130, 140–151. [Google Scholar] [CrossRef]
- World Resources Institute. Food Loss and Waste Accounting and Reporting Standard; World Resources Institute: Washington, DC, USA, 2016. [Google Scholar]
- Sustainable Restaurant Association. Too Good to Waste: Restaurant Food Waste Survey Report; Sustainable Restaurant Association: London, UK, 2010. [Google Scholar]
- Evans, D. Beyond the Throwaway Society: Ordinary Domestic Practice and a Sociological Approach to Household Food Waste. Sociology 2011, 46, 41–56. [Google Scholar] [CrossRef]
- Padfield, R.; Waldron, S.; Drew, S.; Papargyropoulou, E.; Kumaran, S.; Page, S.; Gilvear, D.; Armstrong, A.; Evers, S.; Williams, P.; et al. Research agendas for the sustainable management of tropical peatland in Malaysia. Environ. Conserv. 2015, 42, 73–83. [Google Scholar] [CrossRef]
- Padfield, R.; Tham, M.H.; Costes, S.; Smith, L. Uneven development and the commercialisation of public utilities: A political ecology analysis of water reforms in Malaysia. Util. Policy 2016, 40, 152–161. [Google Scholar] [CrossRef]
- Glaser, B.; Strauss, A. The Discovery of Grounded Theory; Aldine: Chicago, IL, USA, 1967. [Google Scholar]
- Corbin, J.; Strauss, A. Basics of Qualitative Research, 3rd ed.; SAGE Publications Ltd.: London, UK, 2008. [Google Scholar]
- Walsh, I.; Holton, J.A.; Bailyn, L.; Fernandez, W.; Levina, N.; Glaser, B. What Grounded Theory Is. A Critically Reflective Conversation Among Scholars. Organ. Res. Methods 2015, 18, 581–599. [Google Scholar] [CrossRef]
- WRAP. Food Waste in Schools; WRAP: Banbury, UK, 2011. [Google Scholar]
- Maniates, M.F. Individualization: Plant a Tree, Buy a Bike, Save the World? Glob. Environ. Politics 2001, 1, 31–52. [Google Scholar] [CrossRef]
- Shove, E. Beyond the ABC: Climate change policy and theories of social change. Environ. Plan. A 2010, 42, 1273–1285. [Google Scholar] [CrossRef]
- Pouyet, V.; Giboreau, A.; Benatta, L.; Cuveliercde, G. Attractiveness and consumption of finger foods in elderly Alzheimer’s disease patients. Food Qual. Prefer. 2014, 34, 62–69. [Google Scholar] [CrossRef]
- Papargyropoulou, E.; Lozano, R.; Steinberger, J.K.; Wright, N.; Ujang, Z.B. The food waste hierarchy as a framework for the management of food surplus and food waste. J. Clean. Prod. 2014, 76, 106–115. [Google Scholar] [CrossRef]
- Sahakian, M.; Wilhite, H. Making practice theory practicable: Towards more sustainable forms of consumption. J. Consum. Cult. 2014, 14, 25–44. [Google Scholar] [CrossRef]
- Engström, R.; Carlsson-Kanyama, A.; Engströma, R.; Carlsson-Kanyamab, A. Food losses in food service institutions Examples from Sweden. Food Policy 2004, 29, 203–213. [Google Scholar] [CrossRef]
- Stöckli, S.; Niklaus, E.; Dorn, M. Call for testing interventions to prevent consumer food waste. Resour. Conserv. Recycl. 2018, 136, 445–462. [Google Scholar] [CrossRef]
- Lagorio, A.; Pinto, R.; Golini, R. Food waste reduction in school canteens: Evidence from an Italian case. J. Clean. Prod. 2018, 199, 77–84. [Google Scholar] [CrossRef]
- Sustainable Restaurant Association. How to be Good: WasteWatchers; Sustainable Restaurant Association: London, UK, 2017. [Google Scholar]
- WRAP. Where Food Waste Arises within the UK Hospitality and Food Service Sector: Spoilage, Preparation and Plate Waste; WRAP: Banbury, UK, 2013. [Google Scholar]
- Sebbane, M.; Costa, S. Food leftovers in workplace cafeterias: An exploratory analysis of stated behavior and actual behavior. Resour. Conserv. Recycl. 2018, 136, 88–94. [Google Scholar] [CrossRef]
- Sirieix, L.; Lala, J.; Kocmanova, K. Understanding the antecedents of consumers’ attitudes towardsdoggy bags in restaurants: Concern about food waste, culture, norms and emotions. J. Retail. Consum. Serv. 2017, 34, 153–158. [Google Scholar] [CrossRef]


| Description | Size (Av. No. of Meals served Per Day) | Average Meal Price (RM1/USD2) | Type of Service | Type of Customer & Function | |
|---|---|---|---|---|---|
| HaFS Operation 1 | Banquet facility | 560 | RM80–250 (USD22–68) | Buffet (all you can eat) Full table service Lunch, dinner, mid-morning and mid-afternoon coffee breaks | Local families/weddings, professionals on conferences, workshops, annual dinners, promotional events |
| HaFS Operation 2 | Chinese cuisine restaurant | 210 | RM60–150 (USD16–41) | A la carte Lunch, dinner | Local families, professionals in meetings, work colleagues |
| HaFS Operation 3 | Malay cuisine restaurant | 160 | RM40–100 (USD11–28) | Buffet (all you can eat) A la carte Lunch, dinner | Local families, work colleagues, professionals in meetings |
| HaFS Operation 4 | Five-star hotel restaurant | 170 | RM80–130 (USD22–35) | Buffet (all you can eat) A la carte Breakfast, lunch, dinner | Tourists, professionals in meetings, local families |
| HaFS Operation 5 | University food court | 6,440 | RM5–20 (USD1–4) | Canteen buffet (pay what you eat) Breakfast, lunch, dinner | Students and university staff |
| Food Commodity Category | Type of Foods Included in the Category |
|---|---|
| Cereal and grains | Rice, pasta, noodles, bread, flour, pastries, other wheat, barley, maze, oats products |
| Dairy | Milk, cheese, yogurt, ice cream, and other dairy products |
| Eggs | Eggs |
| Fish and seafood | Fresh water fish, demersal fish, pelagic fish, other marine fish, crustaceans, other aquatic animals, and plants |
| Fruits | All fruits |
| Meat | Bovine meat, mutton/goat meat, pig meat, poultry meat, other meat, offal |
| Oils and fats | Olive, palm, vegetable oils, butter other animal and vegetable oils and fats |
| Sauces incl. liquid fraction of dishes | All premade and in-situ prepared sauces, including tin tomatoes, salad dressing, canned soup, and all other liquid fractions within dishes |
| Vegetables, roots, and pulses | All vegetables, potatoes, and pulses |
| Causes of Systematic Food Waste Generation | Food Waste Prevention Recommendations | Type of Food Waste Targeted by Recommendation |
|---|---|---|
| ’All you can eat’ buffets [15] | Opt for a la carte service | Preparation waste Buffet leftover Customer plate waste |
| Opt for a ’pay what you eat’ type of buffet | Customer plate waste | |
| Introduce a charge if food waste is left on customer’s plate or offer a reward such as a discount, if no food waste is left on the plate [98] | Customer plate waste | |
| Food surplus generation: policy of preparing 30% more food than what is needed | Prevent food surplus by preparing only what is necessary by improving the demand forecast [86]. This measure can be achieved by improving the reservation system in order to make accurate predictions of customer numbers (see recommendation below). Have staff on stand-by to prepare extra food if necessary. This measure requires the customers to accept that towards the end of the buffet all dishes might not be available. It also requires that the customer pays according to what they eat, or a type of compensation to the late customers that might not receive the full variety of the buffet, for example, a discount for customers arriving half an hour before the buffet closes. | Preparation waste Buffet leftover |
| Failure of booking system to accurately predict numbers [9] | Improve the booking system by confirming numbers the day before. Request a deposit when reservation is made to limit ’no shows’. Implement an ’only by reservation policy’ where only customers that have made a reservation are accepted. A softer approach to this measure is to encourage customers to make a reservation by offering a discount. Customers that have no reservation can still dine, however they miss out on that discount. | Preparation waste Buffet leftover |
| Food safety policy stipulating that no food should be left on the buffet longer than 4 hours | Instead of having a ’blanket ’policy stipulating a specific number of maximum hours for food to be left on the buffet, develop a strategy that works in stages for assessing food safety. This strategy needs to be in line with the National Food Safety Regulations (Food Regulations 1985) and the Malaysian Food Act 1983. Chefs can assess on a case by case basis which dishes are more likely to become unsafe based on their ingredients, cooking and storage method. This way, dishes of higher risk can be removed from the buffet earlier than food items that can last longer (e.g. whole fruits such as apples, oranges, bananas, or pickled foods, or food items in protective packaging such as crackers). After the closure of the buffet, direct buffet leftover to staff canteen for immediate consumption. Ensure suitable food safety procedures are in place to avoid food poisoning and cross contamination in the staff canteen. Supervise this process closely to avoid staff eagerly removing buffet items earlier than they should in order to enjoy them in the staff canteen. Alternatively, redirect buffet leftover that is safe for human consumption to food charities and soup kitchens for immediate consumption [13]. This measure needs to be accompanied by strict food safety guidelines and a no liabilities agreement between the restaurant and the charity. The agreement needs to remove responsibility for food safety from the restaurant as soon as the food leaves its premises (see successful innovations in this field in [13]). Buffet leftover unfit for human consumption can be diverted to farms to be turned into animal feed. The animal feed needs to comply with food safety laws to prevent infecting animals with viruses such as Foot and Mouth. Diverting the remaining food waste to composting or energy from waste facilities is the next option for treating unavoidable food waste. | Buffet leftover |
| Lack of coordination between departments in restaurant | Improve communication between departments by regular meetings to resolve any conflicts and plan ahead for the daily schedule. In meetings the latest information should be shared amongst the departments, for example on the items and quantities of food supplies received, the cooking and food preparation schedule and menus, the reservations details including cancellations and last minute changes and feedback from customers and observations by the waiting staff for example which food items are always left on the plate, which buffet dishes need more or less frequent replenishment. Assign food waste prevention champions within each department. Align departmental performance criteria to resolve conflicts between the departments and have common targets [99]. Make food waste reduction one of these targets. | Preparation waste Buffet leftover |
| Inappropriate menu for eating occasion and sitting layout | In the cases of banquet facilities, train the reservations team to correctly advise the customer on the most appropriate menu for each sitting layout and type of function. Seek feedback from the waiting staff on the menus that work better with certain layouts and functions, based on their observations and customer feedback. | Preparation waste Buffet leftover Customer plate |
| Aesthetic standards in the buffet and plate presentation | Avoid elaborate buffet and plate decoration designs where possible. Observe which items remain uneaten on the plates and eliminate them from the plate design. For example, garnishes that do not add flavour to the dishes could be eliminated without compromising the integrity of the dish. Reuse the decorative food items in other dishes. For instance, the watermelon cut into the shape of a flower to decorate the buffet, could be made into a smoothie or a juice to include as a special item for the next sitting. | Preparation waste Buffet leftover |
| Avoidable preparation food waste due to poor cutting skills | Train kitchen staff on cutting techniques. Observe and reward the best ’cutters’ each month. Assign food waste prevention champions in the kitchen. | Preparation waste |
| The perceived value of food is linked to the price, for example, rice is cheap so it can be wasted (this is also relevant to food consumption practices - see Table 4) | Appoint food waste champions in the kitchen to highlight the importance of food waste prevention across all food groups, not only the expensive ones. Provide posters in the kitchen demonstrating good examples of food waste prevention and bad practices [100]. Provide training in cutting skills to reduce avoidable food waste especially of fruits and vegetables [101]. Update cooking equipment and improve cooking techniques to avoid instances whether rice is stuck at the bottom of the pan. | Preparation waste |
| Avoid over production of rice, noodles and local fruits (all perceived less valuable due to their comparatively lower price) by reducing how much is prepared per customer in the buffet. | Buffet leftover |
| Causes of Food Waste Generation Related to Food Consumption Practices | Food Waste Prevention Recommendations | Type of Food Waste Targeted by Recommendation |
|---|---|---|
| Ordering too much food | Train waiting staff to correctly advice customers on the size and richness of the dishes. Offer smaller portions with the option to add more at no extra charge. Offer a range of dish sizes, such as small, regular, big and special sizes for children and side dishes [13,102]. Pack any leftovers and offer them as take away, as a standard practice unless customer instructs otherwise [11,103]. This measure should be accompanied by simple food safety instructions to the customer, such as ’consume within X hours and do not reheat’, and a no liabilities clause for the restaurant for food that has left their premises. | Customer plate |
| Customer does not like a dish they ordered | Train waiting staff to explain the menu and ingredients to the customers, as well as give advice on which dishes complement each other. | Customer plate |
| Taking too much on plate in ’all you can eat’ buffet | Reducing plate size has the potential to reduce food waste without compromising customer satisfaction [70]. Have restaurant staff stationed by the buffet to serve the food onto the customers’ plates and explain the dishes and ingredients. Tray fewer systems have been proven to reduce plate waste especially in canteen settings [65]. | Customer plate |
| Trying out all dishes in ’all you can eat’ buffet | Offer the option for customers to taste the dishes as they go around the buffet before deciding whether they like it or not. | Customer plate |
| Customer’s perceived value for money: quantity not quality | Altering the customer’s perceptions of value is outside the control and remit of the restaurant. However, promoting the quality of the food rather than the quantity of the items on the buffet is one way of shifting the emphasis and attention of the customer. This can be done through the restaurant’s marketing material for example by highlighting the culinary skills of the chefs, the uniqueness of the menu and the quality ingredients rather than just the number of the food items on the buffet. Use ’nudging’ techniques to promote food waste reduction, such as displaying signs encouraging customers to come back to the buffet and help themselves more than one time, rather than take a lot of food on their plate all at once [70]. | Preparation waste Buffet leftover Customer plate |
| The perceived value of food is linked to the price, for example, rice is cheap so it can be wasted (This is also relevant to the systematic food waste generation – see Table 3) | Display them in smaller serving dishes rather than in big containers. Reduce portion sizes for rice, noodles and local fruits in the a la carte service, but offer the option to add more at no extra charge. Place rice, noodles, and fruits at the end of the buffet line. | Buffet leftover Customer plate |
© 2019 by the authors. Licensee MDPI, Basel, Switzerland. This article is an open access article distributed under the terms and conditions of the Creative Commons Attribution (CC BY) license (http://creativecommons.org/licenses/by/4.0/).
Share and Cite
Papargyropoulou, E.; Steinberger, J.K.; Wright, N.; Lozano, R.; Padfield, R.; Ujang, Z. Patterns and Causes of Food Waste in the Hospitality and Food Service Sector: Food Waste Prevention Insights from Malaysia. Sustainability 2019, 11, 6016. https://0-doi-org.brum.beds.ac.uk/10.3390/su11216016
Papargyropoulou E, Steinberger JK, Wright N, Lozano R, Padfield R, Ujang Z. Patterns and Causes of Food Waste in the Hospitality and Food Service Sector: Food Waste Prevention Insights from Malaysia. Sustainability. 2019; 11(21):6016. https://0-doi-org.brum.beds.ac.uk/10.3390/su11216016
Chicago/Turabian StylePapargyropoulou, Effie, Julia K. Steinberger, Nigel Wright, Rodrigo Lozano, Rory Padfield, and Zaini Ujang. 2019. "Patterns and Causes of Food Waste in the Hospitality and Food Service Sector: Food Waste Prevention Insights from Malaysia" Sustainability 11, no. 21: 6016. https://0-doi-org.brum.beds.ac.uk/10.3390/su11216016