Rural Livelihoods and Climate Change Adaptation in Laggard Transitional Economies: A Case from Bosnia and Herzegovina


Department of International Environment and Development Studies (Noragric), Faculty of Land and Society, Norwegian University of Life Sciences, N-1432 Ås, Norway
*
Author to whom correspondence should be addressed.
Sustainability 2019, 11(21), 6079; https://0-doi-org.brum.beds.ac.uk/10.3390/su11216079
Submission received: 5 September 2019
/
Revised: 21 October 2019
/
Accepted: 24 October 2019
/
Published: 1 November 2019
(This article belongs to the Collection Sustainable Development of Rural Areas and Agriculture)
Abstract
:This study analyzes farm households’ adaptation in a broad livelihood context, showing how both household internal dynamics and broader external factors, such as agro-ecological, climatic, and institutional economic and political frame conditions, influence both the perception of and adaptation to climate variations and change. Nearly a third of the households in Bosnia and Herzegovina (BH) are engaged in agriculture as one livelihood strategy to cope with the multiple shocks experienced over the past three decades, resulting in economic decline and loss of income opportunities. Based on a household survey, we analyzed the livelihoods of households in three agricultural regions in BH: how they are affected by climate change, their perceptions of climatic change, as well as various household adaptation strategies. The results were discussed in the context of the sustainable livelihoods approach. Our results indicate that rural households are relatively asset poor and highly dependent on agriculture, irrespective of geographical location or wealth. Their access to assets is further constrained by the ongoing changes in economic and political structures and processes. Negative effects of climate change were reported in terms of yield decline and reduced quality of products. On a positive note, the level of adoption of different agricultural practices and technologies indicates signs of an overall intensification strategy of agricultural production in BH, as well as adaptation to the perceived changes in climate and climate variability using the available asset base.
1. Introduction
Some thirty years ago, former communist and socialist countries in Central and Eastern Europe (CEEC) began the process of transitioning from a centrally planned to market economy. The major structural transformations, creation of fundamentally different institutions, and privatization and promotion of private-owned enterprises, which followed after the initial economic collapse in the early phases of transition, have gradually led to an increase in productivity and economic growth [1]. Whilst some of the early adopters became leaders of these systemic transformations and slowly caught up with their developed Western neighbors (CEEC who joined the European Union), the laggards, like Bosnia and Herzegovina (BH) and other Western Balkan countries, still experience sluggish and unstable economic growth [2]. The transition to a market economy in CEEC involved a substantial reallocation of labor and capital across economic sectors in order to increase overall efficiency. This process was heavily disrupted in BH by the armed conflict (1992–1995), which led to massive devastation, large-scale migrations, ethnic segregation, and a general economic and socio-cultural decline. A large proportion of the population in rural areas and towns previously employed as skilled workers in industry became unemployed after the destruction of the existing state-owned industrial capacities, as well as after restructuring and privatization of the remaining capacities in the post-war time. In the absence of other income options, a significant part of that population shifted to agriculture as a main or as an additional source of income. At present, more than 30% of the total households in BH are engaged in agriculture, while only 5% of them are considered commercial farmers [3]. This underscores the significance of the agricultural sector in BH in terms of food security, rural poverty reduction, and further means to mitigate the social burdens of economic reforms and restructuring [4]. At the same time, because agriculture remains one of the main sources of income for most rural households in BH, this also means that the livelihoods of many have become increasingly more vulnerable to current and future climate pressures that directly impact agricultural productivity [5].
More than 60% of the population in BH live in rural areas [6]. Although agriculture as a share of gross domestic product (GDP) is constantly decreasing, it still forms the backbone of the rural economy, employing 20% of the total workforce and constituting 6.4% of the total GDP [7]. The potential for agriculture in BH is substantial. Of the total 2.1 million hectares of agricultural land, 46.5% is arable. However, only 50% of that arable land is currently utilized in agricultural production [8]. Favorable climatic conditions, its geopolitical position, abundant freshwater supplies, and relatively cheap labor costs give the agricultural sector in BH a clear, comparative advantage over many other European countries and potentially gives BH an advantage in terms of labor-intensive productions. Livestock production has the highest economic value in the present agricultural production system in BH, with great potential for further expansion and intensification due to the high availability of grasslands and pastures in areas less favorable for intensive crop production. Agriculture in BH, however, suffers from low investment levels and low overall production and productivity, involving rather extensive farming practices and technologies, low levels of financial capital inputs, and productions carried out on small and fragmented farms. This is a problem partly inherited from the past socio-political system, where agriculture was marginalized as a result of industrial development. This was further exacerbated in the post-war period through poor governance in the ongoing processes of transition [8].
Poverty in BH is mostly a rural phenomenon—close to 80% of the total poor live in rural areas [9]. Non-farm employment opportunities in rural areas are limited. Many of these areas have poorly developed infrastructure and services, all of which are basic preconditions for social and economic development. In addition, frail public and governmental policies and resources do little to support development activities. These conditions preceded the massive changes caused by war and the transition process, but the constraining conditions still remain largely unaddressed. This is especially pronounced in remote areas, where a continuous process of out-migration results in the shutdown and degradation of the existing infrastructure and public services.
From a natural resource point of view, BH is considered highly vulnerable to climate change [10,11]. Extreme weather events, such as increased intensity of droughts, frequency of heat waves, and heavy precipitation resulting in floods and landslides, are increasingly occurring and have already caused significant economic losses and environmental degradation [8,12]. There is a limited adaptive capacity to cope with both climate and other shocks in BH. The situation is actually similar to that found in many developing countries. This inherently low adaptive capacity is the main determinant of vulnerability to climate change in most rural areas of BH, even more so than the degree to which these areas are de facto exposed to significant climatic variations [5].
Adaptation to climate change and other shocks and perturbations is crucial both in order to enhance the resilience of both the agricultural sector at large and for individuals to secure and improve their livelihoods. Adequate responses in terms of adaptation to climate change depend on issues such as adaptive capacity, knowledge and skills, robustness of livelihoods and alternatives, resources, and access to appropriate institutions in order to undertake effective adaptation [13]. While technological development, government programs, and insurance schemes require greater investments from both the public and private sector to be subsequently adopted by farmers [14], the adaptation to climate change at the farm level does include many possible responses. It could encompass changes in crop and livestock management practices, land use and land management, and a variety of both on-farm and off-/non-farm combined or diversified livelihood strategies [15]. While climate change has yet to be mainstreamed into national and regional development policies in BH, individuals and communities are already adapting to the factual changing climatic conditions. Such adaptation strategies are mostly reactive and carried out in response to perceived and experienced adverse impacts of climate change and variability [16]. Perceptions of these issues are key components in on-farm decision-making processes. Observations, and not least experiences over time, shape farmers’ climate change and climate variability perceptions and influence or inform their choices of appropriate adaptation strategies. However, adaptations in agriculture are not carried out with respect to climatic stimuli alone, but one can rather see it as “joint effects of multiple forces” [14] (p. 92). People also adapt to changes in their external frame conditions in different ways and it can be difficult to assess complex changes in institutional arrangements and explore what can be reasonably linked to climate change and what can be attributed to other frame condition changes. These interactions additionally generate complexities in relation to how people adapt in both the short- and long-term.
The objectives of this study were to: i) assess the livelihoods of rural households in BH, their access to assets, and livelihood diversification strategies; ii) investigate how the households are affected by climate change and how they perceive these ongoing changes; and iii) analyze household adaptation strategies and the degree of adoption of certain practices and technologies. The results were analyzed and discussed in the context of three different agricultural regions and three wealth groups in BH according to total income level of the households.
2. Research Framework
Climate change is widely considered as one of the main environmental challenges of the 21st century. According to the Intergovernmental Panel on Climate Change (IPCC) Fifth Assessment Report, the globally averaged combined surface temperature data as calculated by a linear trend showed a warming of 0.85 (± 0.20) Cover the period from 1880 to 2012 [17]. The increase of global mean surface temperature by the end of this century is predicted to be 1.5–4 °C in most scenarios [18]. In addition, it is expected that the incidence and duration of heat waves, droughts, floods, hail, storms, cyclones and wildfires, intensified melting of glaciers and other ice, sea level increases and soil erosion, will all increase over this century. This may pose a significant threat to ecosystems and their various services and the vulnerability of many human systems are likely to increase [18].
Climate change and agriculture are interrelated processes, both occurring at a global scale. Agriculture is extremely vulnerable to climate change. Increased incidence and duration of extreme weather events cause yield reductions or crop failures [19], as well as increases in and the emergence, growth, and frequency of weeds and pests [20]. It may also cause damage to farm infrastructure [21]. While some regions of the world may benefit by the increase in temperatures, the overall impacts of climate change on agriculture will be negative, threatening global food security [20].
Globally, smallholder farmers constitute about 85% of the world’s farmers [22]. Most of these people are located in the low-income countries of South Asia and sub-Saharan Africa, but they are also dominant in rural areas of many upper middle-income countries [23], including CEEC, the Western Balkan countries, and BH. The main characteristics of these regions are large rural populations, widespread poverty, and extensive areas of low agricultural productivity due to steadily degrading resource bases, weak markets, and high climatic risks [24]. Most smallholder farmers rely directly on agriculture for their livelihoods and survival and have limited resources and capacity to cope with the shocks/impact of climate change. Any reductions in agricultural productivity could have significant impacts on their food security, nutrition, income, and well-being [25]. Climate change is expected to further exacerbate the risks and uncertainties that farmers face. It affects food production directly through changes in agro-ecological conditions and indirectly by affecting growth and distribution of incomes, and thus demand for agricultural produce [26].
Changes in climatic conditions will require different adaptation strategies, in terms of both overall livelihood strategies and adjustments in agricultural production itself in order to alleviate the severity of climate change impacts. The empirical research on adaptation across disciplines has identified resource, institutional, informational, and financial constraints as the most significant determinants of adaptation [27,28]. Furthermore, adaptations can be either planned (public) or autonomous (private) with the latter being carried out depending on how the perceptions of climate change are translated into agricultural decision-making processes [29,30]. However, the extent of autonomous adaptations will likely not be enough to cope with the negative effects of climate change and may even lead to maladaptation due to clashing cultural contexts and social goals [31]. Thus, the “mainstreaming” of climate change adaptation into policies would be necessary in order to enable and facilitate effective planning and capacity building for adaptation to climate change [32]. Adaptation to climate change in agriculture can be achieved through a broad range of management practices and adoption of new technologies [14]. However, there is no “one-size-fits-all” framework for adaptation and adoption of new practices and technologies. Successful adaptation should be based on adequate, local, and scientific knowledge and be continuously updated based on new research findings.
Adaptation, whether analyzed for purposes of assessment or practice, is closely associated with vulnerability, since the extent of sustainable adaptation depends on the magnitude of climate change and its variability, as well as the capacity to adapt to these changes [33]. The limited access to livelihood assets and capabilities often shapes poverty and consequently the lack of adaptive capacity [34]. However, people´s adaptive capacity may be underestimated by only looking at access to material resources and one should also involve socio-cognitive variables in order to develop more realistic scenarios for adaptation and important policy implications [35].
Livelihood as a concept is widely used in the literature, linked to vulnerability, poverty, and rural development. According to one of the earliest definitions of livelihood by Chambers and Conway [36], “a livelihood comprises the capabilities, assets (stores, resources, claims and access) and activities required for a means of living. A livelihood is sustainable when it can cope with and recover from stress and shocks, maintain or enhance its capabilities and assets, and provide sustainable livelihood opportunities for the next generation; and which contributes net benefits to other livelihoods at the local and global levels and in the short and long term” (p. 6). In this definition, capabilities are the options one possesses to pursue different activities to generate income required for survival and to realize its potential as a human being. Capabilities are determined based on the portfolio of assets one possesses, based upon which one makes decisions to produce outcomes necessary for sustenance and well-being.
We applied the sustainable livelihoods approach (SLA) as a conceptual framework [36,37,38,39] to assess the households’ access to livelihood assets, their activities and reported outcomes, and the contextual factors that influence them. This approach is based on mapping people’s access to assets and the way people use and access these assets. Five main categories of capital contribute to livelihood assets: natural, physical, human, financial, and social capital [38,39]. Furthermore, access to livelihood assets is mediated by institutions, social relations, and policies (transforming structures and processes), as well as shocks, trends, and seasonality [37]. Under such circumstances, poor people undertake a range of activities and choices (livelihood strategies) in order to achieve different livelihood outcomes [39]. In terms of livelihood strategies under the lens of the SLA, this means that rural households with access to agricultural means of production can choose between agriculture and non-agricultural economic activities through diversification processes. Different adaptation strategies within agriculture can also be considered, such as extensification vs. intensification, as well as adaptation as leaving agriculture through “exit options” such as off- and non-farm activities, migration, and remittance strategies.
As much as climate change is one of several drivers for particular courses of action, other frame conditions such as agricultural policies, market conditions, alternative economic options and other factors, situate households with different asset access in different positions, which also influence and complicate their livelihood choices. There is no single most profitable or desired option for all households or individuals; but diversification patterns in terms of adaptation must be understood as a broad specter of opportunities for actors with different initial asset access and for the same households over their lifespan or demographic cycle. It is also useful to see these decision processes as combinations of free choice vs. necessity [39] and also see decisions in a structure-agency dichotomy. Choices are made, but under such strong preconditions or bearings that the choice is often “given” or placed within. Furthermore, BH is a country with a pronounced heterogeneity in terms of geographical, agro-ecological, and climatic conditions, as well as unique and rather asymmetric constitutional, political, and institutional arrangements and governance structures. This means that households under different socio-economic and agro-ecological conditions have different realities to relate to, as well as different perceptions of climate change and perceived adaptive capacity for agricultural and other income generating potential [35].
3. Study Area
BH has, as mentioned, a complex economic, political, and historical background, with substantial differences in agro-ecological and climatic conditions and also varying demographic, ethnic, cultural, and religious compositions (Figures S1 and S2). The recent war in BH (1992–1995) resulted in devastation, and the death of at least 100,000 people [40]. There was massive emigration of more than two million people and massive internal displacements and migration, with significant and lasting consequences on the demographics and economy of its local communities. The psychological effects of war are still visible and reflected in political instability caused by the instrumentalization of ethno-nationalism [41]. Each political decision is carefully reviewed for its potential impacts on the existing three ethnic groups, as well as the balance of power and resources between the state, its two entities, regional and local governments. In order to avoid the potential biases and “politicization” of livelihood assets, activities and outcomes found in the different state entities and ethnic groups which may arise from this study, we opted to interpret the results based on the location (in terms of agro-climatic conditions, instead of administrative units) and household income (total household income of surveyed households). The main features and general distinction between agricultural regions, as well as different challenges faced in them are explained in more detail in Supplementary Note 1.
BH is a south-east European country located in the Western Balkan region, with a total surface area of 51,209.2 km2. The landscape is mainly hilly to mountainous, with an average altitude of 500 m a.s.l (meters above sea level). Of the total land area, 5% is lowlands, 24% hills, 42% mountains, and 29% karst region. The general atmospheric circulation, the dynamic topography, the orientation of mountain ranges, the hydrographical network, and the vicinity of the Adriatic Sea have created conditions for a wide spectrum of climate types and subtypes in BH [42]. In brief, these include a humid continental climate, represented mostly in the northern and lowland central parts of the territory; a sub-alpine and alpine climate in the mountainous region of central, east, and western BH, and a Mediterranean climate dominant in the coastal area and lowlands of Herzegovina (southern BH). Areas above 800 m a.s.l. are mostly unsuitable for intensive agricultural production due to biophysical constraints.
The country is divided into six agricultural regions based on dominant climate conditions, elevation, share of different types of crops and livestock and the degree of economic development. These can further be roughly grouped in three main agricultural regions: the lowlands, the hilly-mountainous, and the Mediterranean region [43]. The study sites are situated in these three regions (Figure 1), referred to as the northern (lowland), central (hilly-mountainous), and southern region (Mediterranean).
4. Methods
4.1. Data Collection
Primary data was collected using a household questionnaire carried out in January and February 2015. In total, we surveyed 104 rural households engaged in agriculture in three different agricultural regions in BH. Agricultural regions were selected as the main study units based on findings from previous studies, which clearly indicate the differences in the degree of exposure to negative effects of climate change between the regions [5,44]. The main objective of the household questionnaire was to determine the access to livelihood assets and the main factors and processes that influence rural livelihoods and livelihood strategies, as well as perceptions of climate change and the responses carried out through various adaptation options. The choice of households tended to be as randomized as possible. The only condition was that agriculture should be one of the income sources of the household. The questionnaire was mainly, but not exclusively, directed to the heads of the households, which were mostly men and usually the main decision makers at the household level. In some cases, the questionnaire was conducted with multiple household members jointly, in case they showed interest to participate.
The questionnaire contained mainly closed-ended questions, but some of the questions were open ended and allowed the respondent to elaborate some key issues in more detail. Therefore, a semi-structured interview was selected as the data collection method [45]. Closed-ended questions included dichotomous, multiple choice, Likert scale, and fill-in-the-blank questions depending on the suitability and expected output [46]. The first section of the questionnaire mapped assets of the surveyed households, structured as natural, physical, human, financial, and social capital. The second section was divided in two parts—the first part contained questions related to perceptions and personal observations of climate change and its nature and extent, as well as questions about the damage caused by the selected extreme weather events in the past. The second part of this section focused on the awareness and implementation of the selected adaptation strategies. The third section encompassed questions related to various determinants of livelihood diversification and adaptation strategies, activities and perceived challenges, and obstacles for survival and livelihoods. The full version of the questionnaire translated from the local language can be found as an appendix in the Supplementary File 1.
The studied household sample was split in three wealth categories during the analyses, using equal intervals based on their total income. Total incomes were defined as the household sum of gross cash and subsistence incomes as reported by respondents. Income diversification of annual household income sources were also based on the estimations of the respondents. Clearly, there is uncertainty in the reliability of such results partly due to the possibility of respondents to underestimate or exaggerate their incomes, either intentionally or unintentionally. In order to avoid larger inconsistencies, the results were inspected individually, using the reported salaries (if employed), quantities and market prices of the products sold.
4.2. Statistical Analysis
The analysis of survey data was carried out using descriptive and analytical statistical methods. All statistical analyses were carried out using SPSS ver. 24 (IBM Corp, Armonk, NY, USA, 2016). The sample size in our study was somewhat lower compared to some similar studies, but still adequate for the chosen statistical analyses [47,48]. One-way analysis of variance (ANOVA) was used to determine statistically significant differences between our sample groups based on location and wealth. We used Tukey’s test as a post-hoc analysis to determine the differences within the sample groups. In addition, we used the Welch test in cases when the homogeneity of variances was violated according to Levene’s test.
Due to the dichotomous outcome of the variables regarding the adoption of various agricultural practices (adopted or not), we used the binary logit model to statistically analyze the determinants of adoption. This approach was used in previous studies dealing with livelihoods and adaptation (e.g., [15,49]). The model in its simple form can be presented as:
where Yi is the dichotomous dependent variable for individual agricultural practices (1 = adopted; 0 = not adopted), is the Y-intercept, βi are a set of regression coefficients, Xi denotes the set of explanatory independent variables (assets), and εi is an error term.
5. Results and Discussion
5.1. Livelihood Assets
The overall asset structure in this study indicates that the surveyed households are relatively asset poor (Table 1). This is most notable in their limited access to natural and financial capital. The average farm size (excluding leased land) in our survey was 5 ha, which is small but still larger than the estimated farm size in general for BH (according to World Bank [50], the majority of farms in the country control some 2–3 ha of landholdings). However, the farm structure in our sample corresponds well with the estimated overall farm structure in official reports, where it is stated that 80% of the farms are smaller than 5 ha and 50% of the farms are smaller than 2 ha [51]. The number of livestock units per farm is quite low (LSU = 3.8). The average annual income per capita was 7576.8 Bosnia and Herzegovina Convertible Mark (BAM) (= 4448.26 United States Dollar (USD)), meaning that the average person lives on 12.2 USD a day. Overall, the access to basic infrastructure is satisfactory and most of the households had access to electricity, drinking water, and decent road access. The average household holds 4–5 members, the household head is 56-years-old on average and has 11 years of education. The average household is mostly in possession or control of their farm and land, which is around 5 ha in size, and they lease another 3.6 ha of land on average. The dependency ratio of the sample was relatively high (34.2%) due to the fact that the majority of surveyed households typically had a three-generation family household structure. Most of the households had basic access to information and physical access to public and financial services, but the level of their services was low, constraining their wider use (e.g., underdeveloped agricultural extension services, unfavorable credit lines for rural population). In the next subsections, we present and discuss the asset structure, activities, and outcomes for the sample and the differences by location and by wealth group of households.
5.1.1. Asset Differences by Location
The access to natural capital in terms of arable land is higher in the northern region of BH than in the two other regions (Table 1). Rural households in the northern region have higher and easier access to land, as indicated by the significantly larger areas of land under lease and areas used to cultivate crops. Furthermore, arable land in the central and southern regions is to some degree more limited by biophysical constraints. Most of the people in these two regions live in fertile plains and valleys which represent only a fraction of the total land area, creating pressures on limited agricultural land resources, while the remaining areas are generally less suitable and accessible due to unfavorable climatic conditions, rugged terrain, slopes, and karst. In the northern region we found that there is a significantly larger area of leased land. Leased land is mainly private and rented out by former residents who emigrated to another region/country at some stage, either during the recent conflict or after it, or those who lack labor/interest in farming. Some of the areas under lease in the northern region used to belong to former state farms. This land is still owned by the state who leases it to farmers through various concessional agreements. Unlike in the north, private land constitutes most of the leased areas in the other two regions.
The number of crops and crop types produced on farms varies by location. Farmers from the northern region had the lowest average number of crops grown. The typical crops found in the northern region were wheat, maize, and tobacco. Potato, raspberries, and apple were the most common crops found in the central region, while potato, onion, and tomato were most frequently found in the southern region. It should be noted that there is a certain bias in our sample in terms of crops grown with vegetables, industrial crops (such as tobacco) and intensive crop and fruit plantations represented a higher level compared to the actual official statistics [52]. The dominant type of farming in the northern and the central region was a mixed crop and livestock production system, where livestock feed and fodder is produced on grassland areas in addition to maize, wheat, and barley. The main reasons reported on why some parts of the land were left fallow are frequent flooding, lack of labor, low fertility, and remoteness of certain plots.
Certain differences were found in terms of access to physical capital in the researched regions. While they are less emphasized or varying in terms of general infrastructure, the differences are primarily reflected in the possession and utilization of on-farm physical capital such as technologies, including mechanization, irrigation systems, and greenhouses. Most farmers in the north and south possess their own agricultural machinery. However, the age and quality of tractors and other machinery is worrying, especially in the southern region. The agricultural mechanization and other fixed assets in BH are used beyond their useful life and there is a general tendency for such assets to become obsolete [53]. The percentage of households that own some type of irrigation system in this study is surprisingly high. It is stated in the literature and national reports that less than 1% of agricultural areas in BH are irrigated [54], while our sample indicates that nearly 75% of surveyed households have access to irrigation of some kind and more than 42% of their land is reported as irrigated. The possible explanation for this is a certain bias in our sample regarding the crops produced on the farms, with more intensive crop production and plantations found in our sample compared to the official statistical reports.
The regions do not significantly differ much in terms of human capital. The only significant difference was in the education level of the most educated household member. Unlike in the northern region, where most households are traditional farmers, many household members in the central region and to some degree in the south were not primarily engaged in agriculture during the pre-war time, and mainly worked as skilled workers in the different state-owned enterprises and industries. These were typically in the metal, leather or textile industries, or some other kind of formal employment. After the war, most of these people lost their jobs due to devastation, migration, privatization, bankruptcy, and restructuring of enterprises they worked in, and they started engaging in agriculture as the key source of income in the absence of other opportunities.
Significant differences in financial capital access were also found, primarily in the household income, which was much higher in the southern region. This difference is discussed in more detail in the next section. The northern and central regions have somewhat higher financial capital stored in livestock. Nearly a third of the surveyed households (28%) had incomes below the last officially estimated relative poverty line in BH [55], most of them in the northern and central region.
Indicators of social capital differ significantly between regions. All surveyed households owned and reported TV and/or radio as sources of information. The number of households who have access to internet and use it as a source of information is also high, but somewhat lower in the central region. Farmers from the southern region are more often members of agricultural associations, usually cooperatives, but are also linked to non-governmental organizations (NGOs). Farmers in the northern region had better access to extension. However, a reason for this is that the company purchasing most of the produced tobacco in this region offers extension services to its producers. The public extension provides most of the knowledge and technology transfer services in BH but is severely underdeveloped and poorly funded [8]. There are few extension workers who mostly perform administrative work and allocate very little time to field related work because they lack resources, both human and financial.
5.1.2. Asset Differences by Wealth Group
The general impression is that less poor people have somewhat more of most assets than average households (Table 2). The most notable differences between wealth groups were found in access to natural capital, where the wealthiest group of households in this study had significantly bigger farms, areas under crops and higher diversity of crops produced on the farm. Wealthier households also had a bigger household size and therefore more access to family labor, and more agricultural machinery. The poorest households had significantly lower access to social capital, with significant differences found in membership in associations and access to credit. Clearly, higher access to natural capital and farm labor enables increased on-farm production. Increased participation in farming associations of households with higher incomes indicates the importance of these associations in improving livelihood opportunities and security. They also allow farmers, especially smallholders, improved access to markets in terms of both inputs and outputs, and access to information and technologies through a wide range of services [56].
Another interesting finding was that the poorest wealth group was mainly composed of households from the northern (45.7%) and central region (40%), while the wealthiest (less poor) wealth group in this study was mainly composed of households from the southern region (51.4%). Given the difference in access to assets between wealth groups, this indicates that rural households who are able to specialize in agriculture irrespective of their location seem to have higher income levels. We will return to this under the discussion of livelihood activities and outcomes.
5.2. Livelihood Activities and Outcomes
5.2.1. General Diversification and Patterns of Income
There is a very high dependence on agricultural incomes, constituting as much as 72.8% of the total average income in the sample (Table 3). Incomes still emanate from a variety of strategies and reflect different diversification combinations of crops and livestock production, choices influenced by the trade-off balance between subsistence and market-oriented production, and the prevailing agro-ecological and economic conditions and other opportunities in the different regions. Non-farm incomes are the second most important contributor to total household incomes (18.5%). The reported non-farm incomes come from a variety of formal and informal employment. Off-farm, non-agricultural incomes do not constitute a significant percentage of overall total incomes in our case, but still represent a significant source of income for some individual households. The most common off-farm non-agricultural incomes are services, which some household members offer with their on-farm tools, such as mechanical workshops, carpentry, welding, tractors, transport trucks, bulldozers, logging, and alcohol distilleries. Remittances (2.7%) are mainly received from family members and relatives living in urban areas or abroad. Although the average incomes received from pensions and other social transfers are quite low in BH, households may have overlooked their importance in the total household income. While income from pensions and other social transfers accounted for only 4.4% of the total household income in this study, they are shown to be higher in some previous studies (e.g., [9,57]). Here we analyze and discuss the differences in income sources by location and wealth group, as well as diversification in agricultural production and on-farm products.
5.2.2. Diversification and Patterns of Income by Location
There was a significant difference between the share of agricultural income in the central region, (55.9%), compared to the northern (78.1%) and southern regions (83.2%). Interestingly, the total income from agriculture in the south is more than twice that of the other regions, as well as being a significantly higher relative contributor to total household income. This is not explained by the regional differences in land asset access since higher agricultural income in the south is achieved with access to the same, or even lower levels of natural capital compared to the other regions. The main difference rather derives from the structure of the agricultural production unit and the on-farm products sold, which are determined by how the assets are used in agricultural production, as well as agricultural potential in the researched regions in terms of climatic conditions. We return to this in Section 5.2.4.
5.2.3. Diversification and Patterns of Income by Wealth Groups
From Table 4, we see that the total income is more than four times higher for the less poor than for the poorest household group. The less poor own more land, livestock, laboor, and have significantly higher general capital access. Regarding the diversification of income sources, a significant difference was found in the case of total agricultural and non-farm incomes between the poor and the less poor group. Interestingly, there were no statistically significant differences in the relative contribution of different income sources to the total household income. Households in the three wealth groups thus have a similar structure of income sources in terms of their relative incomes, but they differ substantially in their absolute values. The poorest group of households had lower total incomes from every source, except remittances. Less poor households had much higher total agricultural income. This is in line with the higher access to natural (most notably land), physical (agricultural machinery), and human capital (more family labor) that these households have, as discussed earlier. Another interesting finding is that the less poor households in this study tend to be either those who acquired their farms in the last 15 years (50% of the households in the group) or those that have a long tradition of farming, spanning three or more generations (46% of the households).
Comparing wealth groups by location, we found that most of the poorest households (46%) are found in the north, while only 14% of the poorest are situated in the south (Table 1). There is a statistically significant difference between where people live (north and central vs. south) and how much money they are able to earn (Table 3). The differences are mainly explained by different income levels in agriculture, partly reflecting agro-climatic conditions but also a generally higher level of investment in agriculture and consequentially higher production.
5.2.4. Diversification within Agriculture and Subsistence vs. Commercial Farming
Agricultural diversification through mixed crop–livestock systems was the dominant type of production, adopted by more than half of the studied households (59%). The production systems are to a large part, but not only, shaped by agro-ecological conditions. These conditions strongly influence the agricultural potential in the researched regions and domination of certain production types over others. The structure of agricultural production by location (Table 5) first of all shows that the regional differences seem to be much more important for choice of agricultural diversification portfolios than the differences found by total income groups.
There is a certain pattern in choice of crops and livestock between regions, which may also explain some of the significant differences in income by location. The dominant crops on farms in the northern region are staple foods, such as cereals (wheat and maize) and soybean. A more detailed inspection of our dataset (Tables S1 and S2) shows that a significant percentage of cereals and soybean produced are consumed on the farm as livestock feed. Tobacco was the main cash crop in the northern region and together with livestock-derived products account for the majority of household income from agriculture. Given the high percentage of animal-derived products on the farm being used for subsistence (30%) and low incomes in this group, this indicates that agriculture in the north is also an important strategy to cope with poverty and achieve food security.
By comparison, none of the surveyed households in the southern region produced cereals or soybean on their farms. Two thirds of the total households in the south produced different types of vegetables (mostly potato, onion, and cabbage), while nearly half of them also produced vegetables in greenhouses (mainly tomato, peppers, and lettuce). Fruit production, both soft (mostly strawberry) and top fruit (peach, nectarine, cherry, vineyards), was also a significant source of income for about a third of the households in the south. The favorable climatic conditions in this region provide an advantage in terms of the range of crops that can be produced, as well as the timing of production to exploit the opportunities in local and regional markets for agricultural products. A milder climate enables earlier planting and ripening of crops, as well as cultivation of some early or late-season fruits and vegetables that are in demand by consumers and producers, which in turn enables on-farm specialization, the choice of more lucrative crops, and timing of production in accordance with the periods with the best prices on the market. Consequently, agricultural production is more commercialized and only a minor fraction of on-farm products (less than 5%) is used for subsistence. They also invest more in technologies (e.g., irrigation, greenhouses) and are more often part of agricultural associations, as was established previously (Table 1).
Households in the central region were more livestock-focused, with a significantly higher percentage of dairy and beef farmers. The main cash crops in this region were different types of fruit (both soft and top fruit) and vegetables (potato). Raspberry plantations and greenhouse vegetable production were dominant types of production on smaller farms, achieving the highest economic returns per unit area. The total household income in this region is closer to that in the northern region. However, the share of agriculture in relation to total household income (both in relative and absolute terms) is lower, which suggests lower dependence on agriculture compared to the other two regions. Notwithstanding, that share is still substantial in our sample and indicates the important role agriculture plays in income diversification in this region.
Another interesting find was a notable difference by location regarding how crops were sold (Tables S1 and S2). While the households in the northern region prefer to sell most of their crops at local or regional markets, those in the central and southern region sell a significant percentage of their crops directly to consumers. Market sales are roughly the same in percentage values depending on the wealth group, while the percentage of direct sales increases with the increase in total income. Market outlets vary and include direct sales to consumers via marketplaces, orders and delivery, on-farm sales, sales by the road-sides, or direct sales to large consumers. Milk and chicken meat were two commodities mostly sold in the market, while eggs, honey, and other types of meat are mostly sold directly to consumers. Most of the farm products are sold as fresh, while a small number of households use added-value processing as a strategy to increase the net profitability of their products. The common value-added products found in this study were apple and pear juice, jam, cheese, and other dairy products.
Unlike the regional comparison, the structure of agricultural production and income shares compared by wealth groups did not yield a notable number of statistically significant differences. In terms of crops, vegetable production was more common in less poor households compared to the poorest group. The only difference in livestock production was the total number of poultry, which was highest for the poorest wealth group. However, these are mostly small flocks, with usually less than 30 units and a rather marginal egg production used for subsistence, with the direct sale of surpluses.
5.3. Institutional Constraints to Improved Livelihoods
The differences in livelihood outcomes cannot be attributed to asset structure, agro-climatic conditions, or activities alone. Rural households are situated within institutional and organizational conditions partly beyond their direct control. These institutional processes and organizational structures influence both access to livelihood assets and the composition of livelihood portfolios and therefore have an impact on peoples’ ability to secure livelihood outcomes [39].
In the context of rural households in BH, main constraints found to hinder improved livelihoods result from the shocks brought about by war devastation and the post-conflict transition from the centrally-planned economy to a more market-oriented economy, which also resulted in the creation of fundamentally different governmental institutions. These reforms affected rural BH in many ways, such as increased unemployment and the informal economy, increased inflation, higher rates of migration, and other longer-term constraints on development which are often found in transitional economies [58]. High dependence on agriculture in rural areas is not necessarily a sign of development and progress but can often be driven by a lack of alternative income sources. Dependence on agriculture for both subsistence and cash income can be seen as an effective strategy to cope with risks and uncertainty. However, simple or outdated technology, lack of entrepreneurship, and absence of specialization and capital farm investments keep agricultural land and labor productivity low. Below we discuss some key constraints also identified through conversations and interviews with the rural households in our study.
The decentralized political and administrative structure of BH is both very complex and quite unique. A tripartite government structure, established to ensure that the interests of the three major ethnic groups are represented, resulted in an asymmetrical and complex governance and power structure. This has led to different policies at different levels, legislative overlaps, limited capacities and communication channels, as well as lack of a clear vision and failure to implement necessary reforms. Consequently, this affects every aspect of development, implementation, and enforcement of policies and results in an unsustainable level of government spending, a staggering amount of corruption, economic stagnation, and economic inefficiency. The difficult and complicated political situation is one of the main obstacles for foreign investments, without which there will be no significant economic progress [59]. According to the most recent official survey in 2017, the unemployment rate in BH was 20.5% [60], which is among the highest in the world [61]. This creates a pessimistic environment and leads to both migration to urban areas and abroad, leaving an ever-aging population in rural areas.
The main feature of the agricultural policy in BH is the low budget allocation for agriculture. Public spending for agriculture accounted for about 3% of the total public spending in 2015 [62]. The largest amount of support (90%) was classified as direct payments to farmers, which refers to payments based on output and the payment per unit of area/head of livestock. This means that the composition of subsidies in BH is heavily oriented toward direct production rather than investments, thus having more of a social safety net function than providing productive support to the agricultural sector which may also encourage unsustainable agricultural practices [63]. Of the total number of surveyed households, 65.4% were subsidized for different types of production. Not only are the budget allocations low, but payments are usually not paid within the allocated budget year. Some of the surveyed households reported not having been paid the agreed subsidies since 2013. In the absence of investments, the farm function is on the level of simple reproduction, using outdated and obsolete fixed assets under the lack of financial resources to invest in expanded production [64].
Domestic agricultural production suffers from low competitiveness caused by poor governance and a lack of public investments. The problem partly lies in an insufficiently developed food industry, discrepancy with quality standards and legislation, low levels of market-oriented production to create the critical mass needed for export, as well as problems of inconsistent product quality and increased transportation costs due to the fragmentation of smallholders and supply chains [65]. In addition, the disconnected smallholders and the lack of association in cooperatives with the aim of improving production and joint appearances on the market has, to date, deprived smallholder farmers of better negotiating opportunities and favorable purchases of both their products and necessary inputs. The lack of competitiveness in the agricultural sector makes it difficult to enter export markets and to compete with imported products in the domestic market. A general unsustainably high negative trade balance in BH and low domestic competitiveness is significantly affected by the import of agricultural products. The most recent ratio of import coverage by export for agricultural products was only 31.7% [66].
Although there is a large number of banks and credit organizations in BH, which enables sufficient physical access to loans, the present conditions posed to obtain credit for agricultural producers are highly demanding and discouraging for farmers, especially smallholders. An unstable political situation in the country and a dysfunctional market further creates a large degree of uncertainty and discourages investments in agriculture, which is then consequently stagnating [67].
Another important obstacle to development of the agricultural sector in BH is inefficient land markets and large fragmentation of agricultural land. Consequently, those who are interested in investing in expansion or consolidation of their farms are often faced with an incomplete land registry and rigid land transaction processes, making land registration and land transactions costly and time consuming [50]. Unlike in many former socialist and communist countries with a dominant state-led agriculture, private smallholder agriculture was less restricted in former Yugoslavia and much of these former agricultural structures have been preserved [68]. However, regulated maximum private farm sizes in a former state (10 ha), coupled with the still existing inheritance law, demanding the subdivision of farm holdings into equal parts among all heirs, resulted in severe fragmentation of private holdings and farms over time. A staggering 88.5% of households in our total sample had farms formed from small parcels, often dislocated from each other, which makes agricultural production less efficient and hinders investment in technologies.
5.4. Impact of Climate Change on Livelihoods and Adaptation Strategies
5.4.1. Reported Damage from Adverse Weather Effects
The reported damages from our survey in terms of adverse weather effects were almost exclusively related to agricultural production and the associated damages to crops in terms of yield declines and the reduced quality of products (Figure 2). Negative effects of drought were seen as the most serious and the most frequent cause leading to production declines and the effects were more frequently reported in the northern and central region. In the same regions, occasional waterlogging was associated with reduced crop growth and consequently lower yields, as well as delays in agricultural field operations. More significant damages to crops and infrastructure due to floods were reported only in the northern region. Damage to crops caused by hail was reported in all regions, but more frequent in the north. Similarly, damage caused by frost is found in all regions. Negative effects of spring frost are similar in all regions, while the increased presence of late crops (most notably fruits) in the central and southern region is the main reason for damage caused by autumn frosts.
The reported negative impacts of adverse weather conditions correspond well with the prevalent climatic conditions in the studied regions, as well as with previous scientific findings. The southern region is situated within the Mediterranean climate zone, while the different subtypes of continental climate prevail in the other two regions. The agricultural systems in the Mediterranean south are traditionally and inherently more drought resilient in design and function, shaped over centuries of living in harsh environmental conditions. The role of traditional knowledge in shaping resilience to environmental extremes in Mediterranean conditions is explained in more detail by Gómez-Baggethun et al. [69]. Thus, drought in the south is perceived as something which occurs regularly, unlike in the other two regions that have been more recently exposed to the increasing frequency of droughts [70]. The mostly plain or undulating landscape and the dominant heavy soils with limited infiltration capacity makes the northern region more vulnerable to the negative effects caused by heavy precipitation events, such as waterlogging and floods [5]. Increased incidences of hail have also been recorded [71]. Frosts occur regularly in the studied climate zones, further modified by topography of the studied regions and therefore cannot be attributed to climate change alone. However, it is not known if the ongoing climate trends have any influence on the occurrence of frosts in the region.
5.4.2. Perceptions of Climate Change
Rural households do, as stated, report awareness of recent trends in climate change. The overwhelming majority of respondents in our study perceived an increase in average temperature (92%). This in line with the actual climate data for the period from 1961 to 2015, where increases in temperatures were recorded in all regions (Figure 3a). Average annual temperature has increased by 1.6 °C in all regions for the observed 55-year period. The increase is even higher if only the months of the cropping season are observed (March–September) and it ranges from 1.7 °C, 1.8 °C, and 2.1 °C in the northern, central, and southern regions, respectively. The average temperature in BH has increased by 0.8 °C in the last 100 years, while the last two decades were the warmest ever recorded [71].
The perception of long-term precipitation changes varied by location in this study. While most of the respondents in the northern region perceived a decrease in the total amount of precipitation, most of the respondents in the southern and central region reported different distribution of the precipitation over the year. However, there has been a slight factual increasing trend in the total annual precipitation in the northern and central region, while a notable decrease has been observed only in the south, where the total annual precipitation has decreased 120 mm over the last 55 years (Figure 3b). Minimum changes in precipitation were recorded within the cropping season (March–September) in all regions, with a very low increase in precipitation trends in the observed period.
One reason why some respondents perceive a decreased amount of precipitation, even though it is not in line with the actual long-term climate observations, may be based on a measured decrease in water availability under the prolonged and severe droughts and higher temperatures experienced in recent years, as previously reported by Bryan et al. [15]. While the level of annual precipitation did not significantly change, a decrease in the number of days with precipitation and an increase in the number of days with more intense precipitation resulted in the increased frequency of droughts [71].
We found little differences between perceptions of climate changes by wealth groups. The only notable difference was that part of the respondents (18%) from the wealthiest group did not attribute the increased incidence of extreme weather events to climate change.
5.4.3. Adaptation Strategies
Overall, the surveyed households reported different adaptation strategies, in terms of both non-agricultural activities and the adoption of agricultural practices and technologies (Table 6). The differences in adopted agricultural practices demonstrate that location plays an important role in climate (and climate change) adaptation in BH, both in the numbers and types of adopted practices. Surprisingly, there was no difference in adoption of agricultural practices based on the wealth groups, despite the significant differences in total income and asset access among them, as established earlier.
Off-farm employment was the most common among the non-agricultural strategies and 57.7% of the total surveyed households had one or more family members employed off the farm. The central region had the highest level of off-farm activities, most likely due to higher economic indicators. Other non-agricultural activities were adopted to a lesser extent, and with some variation by location and by wealth group. Some households in the north decided to lease out parts of their land, mainly because they lacked labor access and interest in farming, or due to the remoteness of some parcels relative to their farm. Household members in the central region, especially the younger and educated ones, tend to migrate more to urban areas. Migration to urban areas was also significantly more expressed in the poorest group of households. While migration is an important form of adaptation strategy, the most vulnerable parts of the population may lack the capacity to migrate away from worsening conditions and decide to persist in their locations. Such populations are defined as ‘‘trapped’’ and exposed to double vulnerability [72].
Fifteen different agronomic practices related to intensification and climate change adaptation were reported in this study. Households adopted 5.3 on average. The results varied much by the three researched regions, while no statistical differences were found in terms of wealth groups. Households in the northern region adopted 6.4 agronomic practices on their farm, compared to 4.9 and 4.5 in the southern and central regions, respectively. A large majority of respondents reported both agronomic and economic benefits as reasons for adopting the reported practices. The main reported constraints for altered adaptation were in the following order: lack of financial capital, lack of knowledge, and lack of labor.
There are indications in our material for an overall intensification strategy for agricultural production in BH, in some regions more than others, as well as adaptation to the perceived changes in climatic conditions. Most notable is the application of both organic and mineral fertilizers, adopted by 94.9% of the households in this study. While we did not measure the total amounts applied, increased fertilization is likely one of the main reasons for an overall increase in yields of the main crops in BH in the past few decades [73]. However, the yields of most crops are still significantly lower compared to the more developed parts of Europe [8]. While subsistence needs are still an important determinant in the selection of crops and livestock, an increasing number of cash crops on farms and more market-oriented production are noticeable. A significant number of households reported changing their crops according to market demands (68.7%) or reported using more productive crop varieties (78%) in order to achieve higher yields. Some households, most notably in the central region, adopted crops that are more drought-tolerant.
We also found a high degree of irrigation adoption, where 82.7% of the surveyed households reported investing in some type of irrigation system, irrigating an average of 55.7% of their utilized arable land. Drip irrigation is mainly used for cash crops and greenhouses, although the irrigation of cereals and other crops using self-hauled gun sprinklers (“typhons”) was also found in the northern region. Public investments in irrigation and related agricultural and water management projects in the post-war period in BH have been low, thus the adoption of irrigation is carried out mostly privately by individual households. Therefore, the adoption of irrigation can be seen as a reactive adaptation to intensify production and as a response to the perceived increased incidences of droughts. Most of the irrigation systems are simple, not requiring significant investments. They are usually supplied by water from private wells or adjacent watercourses, mostly manually operated and without much regard to water consumption. Most of those who irrigate generally avoid paying water usage fees due to the lack of farm registers or other means of water monitoring. This makes irrigation less costly and more cost-effective from the individual farmer’s point of view, but less so from a social profitability point of view.
Other agricultural adaptation strategies include those requiring low implementation investments. The most notable adopted agricultural practices are changes in sowing/planting dates (53.5%) and the incorporation of crop residues (52%). The degree of adoption of certain agricultural practices varied significantly by location, while no significant differences were observed in terms of different wealth groups. Some adaptations are more suited for particular regions, such as adoption of drainage (northern region) or erosion prevention (central region). Conservation agriculture practices were found to be less common, such as use of cover crops (13.3%), reduced tillage (10.1%) and no-till (3.0%). Only a small part of the respondents was familiar with the existence and implementation of such measures, most notably no-till (23.2%), and reduced tillage (35.4%). There is a general lack of knowledge in the Western Balkan region regarding the effects of conservation tillage practices. However, recent short-term results show that reduced tillage is potentially more climate resilient in central BH [54]. The reported 17.3% of households who insured their crops might lead to the conclusion that a significant number of households opted for crop insurance as a strategy to protect themselves against the risk of crop failure. However, crop insurance is an isolated phenomenon related to tobacco producers in the northern region, who are offered crop insurance under favorable terms by the company which is purchasing the majority of produced tobacco in the region. Although some insurance companies in BH offer crop insurance services, the wider application of these services has not been reported to date.
Given the limited access to assets and substantial institutional constraints, as established earlier, our results indicate that adaptation responses to climate change in BH have been mainly autonomous and reactive, based on perceptions on a local or household level. These mainly local innovation-based adaptation actions have an important role in the increase of community adaptive capacity but are constrained by local access to assets [74]. There is a difference in being able to assess the probability of a threat (risk appraisal) and being able to take effective adaptive actions or responses using the resources one possesses in order to protect oneself or others from being harmed by the threat (adaptation appraisal) [35]. It is recommended, however, that government and policymakers learn from these context-specific and local adaptation practices, in order to provide the right incentives and enable an environment for rural households to take effective and meaningful adaptive actions and reduce the risk of maladaptation [75].
5.4.4. Determinants of Agricultural Practices and Technology Adoption
In the absence of previous results on livelihood assets of surveyed households to use as a baseline to assess the utilization of these assets in livelihood adaptation strategies, we used binary logistics regression to assess the important determinants of the various adopted agricultural practices and technologies in terms of access to different types of assets. In total, 10 out of 15 agricultural practices were found to have an adequate sample size for the analysis. Based on the overall results (Table 7), it is evident that the factors influencing the decision to adopt a particular agricultural practice vary and it is difficult to draw generalized conclusions. However, it is notable that increased access to different types of assets in most cases influences the likelihood of adoption. Factors influencing adoption in our study correspond well to empirical research findings in relation to farmers’ general adaptation to climate change.
Social capital was found to be one the most significant determinants of adoption. Membership in agricultural associations, internet access, access, and frequency of extension visits increase the likelihood for adoption of most practices. Participation in different social groups provides exposure to knowledge, innovations, and technologies that can be used to adapt to changes in climatic conditions [15,76].
Access to physical capital, which includes farm machinery, buildings, other facilities, and equipment, is a primary factor of production in agriculture. We could not draw conclusions related to infrastructure because most of the households in this study owned their farms and nearly all of them had access to basic infrastructure, such as electricity and water. However, possession of tractors and their highly positive influence on adoption in our study shows the importance of access to technologies in terms of different management options and the labor they provide [77]. Investment in physical capital can be also seen as a more long-term adaptation strategy, like investments in greenhouses or irrigation systems.
Human capital also had a mainly positive impact on adoption. While an increase in household size can be seen as an increase in total labor available, which increases the likelihood to adopt certain agricultural practices, education can also influence adaptation through increased awareness and knowledge, better access to social networks, off-farm work, and a general increased adaptive capacity [78,79]. Younger farmers are also more innovative and less risk-averse compared to their older counterparts [80].
Natural capital, viewed through farm size, had a mixed effect on long term adaptation in our study. While an increase in farm size was shown to increase the likelihood of adoption of some agricultural practices (e.g., incorporation of crop residues, crop insurance, drainage), the opposite effect was found in the case of larger on-farm investments, such as irrigation or greenhouses. This may be due to the fact that farmers on larger farms prefer to maintain their production or to adapt by diversifying their crops, grasslands, and pastures (if they have livestock), rather than invest in infrastructure or technologies.
Increase in financial capital had a mixed effect on adoption. Interestingly, however, is that both total income and non-agricultural income was mostly negatively associated with adoption. This could be explained by household motives for diversification of their income generating activities, described as “push” and “pull” factors [81]. Households may be pushed into agriculture by necessity and may be pulled by non-agricultural opportunities. Such households would be less likely to invest in agriculture.
6. Conclusions
The studied rural households in BH are exposed to multiple stressors that constrain their livelihood options. Many stressors are typical for economies in transition, and include factors such as inefficient institutions and policies, inadequate infrastructure and services, imperfect markets, and lack of market access. Under such conditions, continued high dependence on agriculture in rural areas is driven more by a lack of alternative income sources than its inherent profitability.
The results indicate a very high relative dependence on agriculture, especially in the north and south, and irrespective of wealth group. Higher income from agriculture is the key driver for the wealthiest group in our study, and most of them are from the southern region. Low agricultural income and a significant degree of subsistence, coupled with low income from off-farm activities, constrain the livelihoods and income from the poorest group, most of which are from the northern region. The situation in the central region resembles that found in the north, with one difference—low incomes from agriculture are partly complemented by income from non-farm and off-farm activities. Higher agricultural incomes in the southern region can be mainly attributed to more favorable climatic conditions in this region, which enables farmers to time their production in order to exploit market opportunities and also produce more lucrative crops. In addition, households in the southern region invest more in technologies (e.g., irrigation, greenhouses) and are more often part of agricultural associations. Wealthier households show a higher degree of entrepreneurship, reflected in more variable market outlet choices.
The studied households expressed their awareness of the recent climate trends. Most respondents in our study perceive an increase in average temperature in line with the actual climate data. The way changes in precipitation are perceived, both in terms of amount and distribution, varied by region. We attribute this inconsistency between perceived and actual precipitation to a decrease in water availability under the increased frequency and intensity of droughts and higher temperatures.
While it is hard to differentiate whether it is climate change, agricultural intensification, or some other factor that is the main motive behind certain adaptation patterns within agriculture, the number of adopted measures shows that there are signs of an overall intensification strategy of agricultural production in BH, as well as marked adaptations to (perceived) climate changes. Most notable was the application of both organic and mineral fertilizers, changes in crops and crop varieties, and irrigation. Other common agricultural practices were those that require no or little investment. The main reported constraints for further adoption and long-term adaptation within agriculture were lack of funds, knowledge, and labor. Certain agricultural practices adopted were in some cases more region-specific, but overall were similar in relation to wealth group. The results also indicate that increased access to different types of assets in most cases influence the likelihood of adaptation in agriculture. Higher access to social capital was found to have a positive influence on the adoption of a significant number of agricultural practices, along with higher access to technologies (tractors) and human capital. Investment in physical capital, like greenhouses or irrigation systems, can also be seen as a more long-term adaptation strategy. Higher access to natural capital (land) and financial capital had a mixed effect, increasing the likelihood of adoption of some practices, but the opposite effect was found mainly in the case of larger on-farm investments.
Climate change in BH enters a landscape of economic recession and constrained income generating possibilities, especially outside agriculture. In this situation, the main resources at hand for the rural dwellers in the sample are land, skilled labor, and agricultural options, for both cash and subsistence incomes. Climate change does not change the heavy dependence on agriculture but has created additional challenges and hardships for most households. The increased incidences of adverse weather events lead to lower and less predictable incomes from agriculture due to production declines and variations, and as the alternative employment options are limited, climate change may lead to increased poverty and vulnerability for those who lack the capacity to adapt.
Our results indicate that agriculture may be or become the main driver of rural development in BH both in its own right and more passively as the only more or less short-term available vehicle of growth and development. The context-specific and local agricultural adaptation practices identified in this study should be taken into account, assessed further, and integrated in rural development policies and climate change adaptation strategies. A more integrative and participative approach to rural development will likely improve the identification and selection of meaningful adaptation options, which should in turn improve rural livelihood outcomes. Potential increased incomes from agriculture can also lead to investments in other sectors in rural areas and support the ability of households to make strategic long-term decisions and improve their adaptive capacity. However, there are constraints for such developments in terms of production, markets, and institutions. Therefore, future research and rural development policies should be focused on rural infrastructure, availability and accessibility to technologies, communicating climate-related information (as well as case-specific adaptation options), improved irrigation technology and improved access to other inputs, easier land transactions and land consolidation measures, access to markets, farming cooperatives, better agricultural extension, and accessible and more favorable credits, including pilots on crop insurance.
Supplementary Materials
The following are available online at https://0-www-mdpi-com.brum.beds.ac.uk/2071-1050/11/21/6079/s1, Supplementary note: Study area, Figure S1: Administrative map of Bosnia and Herzegovina, Figure S2: Digital elevation model (DEM) of Bosnia and Herzegovina, Table S1: Crops and plant-derived products produced on farms, the degree of their subsistence, and sales via different market outlets, Table S2: Livestock and livestock-derived products produced on farms, the degree of their subsistence, and sales via different market outlets, Appendix: Household questionnaire.
Author Contributions
Conceptualization, O.Ž. and P.O.V.; methodology, O.Ž. and P.O.V.; validation, O.Ž.; formal analysis, O.Ž.; investigation, O.Ž.; writing—original draft preparation, O.Ž. and P.O.V.; writing—review and editing, O.Ž. and P.O.V.; visualization, O.Ž.; supervision, P.O.V.; project administration, O.Ž.
Funding
This study was supported by the project “Agricultural Adaptation to Climate Change—Networking, Education, Research, and Extension in the West Balkans”, funded by HERD, the Programme for Higher Education, Research and Development 2010–2014.
Acknowledgments
The authors are very grateful to Merima Makaš, Ibrahim Hećimović, Zerina Zaklan, and Admir Hodžić for their help during household surveys. We also thank Bishal Sitaula and Hamid Čustović for project funding of survey activities and the three anonymous reviewers for their insightful and constructive comments, which greatly improved the quality of this manuscript. The open access publishing costs were covered by the publishing fund of the Norwegian University of Life Sciences (NMBU).
Conflicts of Interest
The authors declare no conflict of interest. The funders had no role in the design of the study; in the collection, analyses, or interpretation of data; in the writing of the manuscript, or in the decision to publish the results.
References
- Svejnar, J. Transition economies: Performance and challenges. J. Econ. Perspect. 2002, 16, 3–28. [Google Scholar] [CrossRef]
- Uvalic, M. Transition in Southeast Europe: Understanding economic development and institutional change. In Economies in Transition. Studies in Development Economics and Policy; Roland, G., Ed.; Palgrave Macmillan: London, UK, 2012; pp. 364–399. [Google Scholar]
- Agency for Statistics of Bosnia and Herzegovina (BHAS). Results of the 2013 Census. Available online: http://popis2013.ba/ (accessed on 3 July 2016).
- Bojnec, S. Agriculture in post-war Bosnia and Herzegovina: Social buffer vs. development. In Proceedings of the XI European Association of Agricultural Economists Congress, Copenhagen, Denmark, 23–27 August 2005; pp. 24–27. [Google Scholar]
- Žurovec, O.; Čadro, S.; Sitaula, B.K. Quantitative Assessment of Vulnerability to Climate Change in Rural Municipalities of Bosnia and Herzegovina. Sustainability 2017, 9, 1208. [Google Scholar] [CrossRef]
- Ministry of Foreign Trade and Economic Relations (MOFTER). Agriculture Report for Bosnia and Herzegovina for 2012. Available online: http://www.mvteo.gov.ba/attachments/bs_izvjestaj-iz-oblasti-poljoprivrede-za-bosnu-i-hercegovinu-za-2012-godinu.pdf (accessed on 5 September 2017). (In Bosnian)
- Bajramović, S.; Nikolić, A.; Butković, J. Agriculture and agricultural policy in Bosnia and Herzegovina. In Agricultural Policy and European Integration in Southeastern Europe; Volk, T., Erjavec, E., Mortensen, K., Eds.; Food and Agriculture Organization of the United Nations: Budapest, Hungary, 2014; pp. 73–94. [Google Scholar]
- Žurovec, O.; Vedeld, P.O.; Sitaula, B.K. Agricultural sector of Bosnia and Herzegovina and climate change—Challenges and opportunities. Agriculture 2015, 5, 245–266. [Google Scholar] [CrossRef]
- United Nations Development Programme (UNDP). Rural Development in Bosnia and Herzegovina: Myth and Reality. National Human Development Report. 2013. Available online: http://hdr.undp.org/en/content/rural-development-bosnia-and-herzegovina-myth-and-reality (accessed on 10 April 2017).
- Brooks, N.; Adger, W.N.; Kelly, P.M. The determinants of vulnerability and adaptive capacity at the national level and the implications for adaptation. Glob. Environ. Chang. 2005, 15, 151–163. [Google Scholar] [CrossRef]
- Kreft, S.; Eckstein, D. Global Climate Risk Index 2014; Germanwatch: Bonn, Germany, 2013. [Google Scholar]
- Intergovernmental Panel on Climate Change (IPCC). Managing the Risks of Extreme Events and Disasters to Advance Climate Change Adaptation. A Special Report of Working Groups I and II of the Intergovernmental Panel on Climate Change; Cambridge University Press: Cambridge, UK; New York, NY, USA, 2012. [Google Scholar]
- Intergovernmental Panel on Climate Change (IPCC). Climate Change 2007: Synthesis Report. Contribution of Working Groups I, II and III to the Fourth Assessment Report of the Intergovernmental Panel on Climate Change; Intergovernmental Panel on Climate Change (IPCC): Geneva, Switzerland, 2007; p. 104. [Google Scholar]
- Smit, B.; Skinner, M.W. Adaptation options in agriculture to climate change: A typology. Mitig. Adapt. Strateg. Glob. Chang. 2002, 7, 85–114. [Google Scholar] [CrossRef]
- Bryan, E.; Ringler, C.; Okoba, B.; Roncoli, C.; Silvestri, S.; Herrero, M. Adapting agriculture to climate change in Kenya: Household strategies and determinants. J. Environ. Manag. 2013, 114, 26–35. [Google Scholar] [CrossRef]
- Smit, B.; Burton, I.; Klein, R.J.T.; Wandel, J. An Anatomy of Adaptation to Climate Change and Variability. Clim. Chang. 2000, 45, 223–251. [Google Scholar] [CrossRef]
- Stocker, T.F.; Qin, D.; Plattner, G.-K.; Tignor, M.; Allen, S.K.; Boschung, J.; Nauels, A.; Xia, Y.; Bex, V.; Midgley, P.M. Climate Change 2013: The Physical Science Basis: Working Group I Contribution to the Fifth Assessment Report of the Intergovernmental Panel on Climate Change; Cambridge University Press: Cambridge, UK, 2014. [Google Scholar]
- Pachauri, R.K.; Allen, M.R.; Barros, V.R.; Broome, J.; Cramer, W.; Christ, R.; Church, J.A.; Clarke, L.; Dahe, Q.; Dasgupta, P. Climate Change 2014: Synthesis Report. Contribution of Working Groups I, II and III to the Fifth Assessment Report of the Intergovernmental Panel on Climate Change; IPCC: Geneva, Switzerland, 2014. [Google Scholar]
- Fischer, G.; Tubiello, F.N.; van Velthuizen, H.; Wiberg, D.A. Climate change impacts on irrigation water requirements: Effects of mitigation, 1990–2080. Technol. Forecast. Soc. Chang. 2007, 74, 1083–1107. [Google Scholar] [CrossRef]
- Rosenzweig, C.; Iglesias, A.; Yang, X.B.; Epstein, P.R.; Chivian, E. Climate Change and Extreme Weather Events; Implications for Food Production, Plant Diseases, and Pests. Glob. Chang. Hum. Health 2001, 2, 90–104. [Google Scholar] [CrossRef]
- Rosenzweig, C.; Tubiello, F.N.; Goldberg, R.; Mills, E.; Bloomfield, J. Increased crop damage in the US from excess precipitation under climate change. Glob. Environ. Chang. 2002, 12, 197–202. [Google Scholar] [CrossRef] [Green Version]
- Harvey, C.A.; Rakotobe, Z.L.; Rao, N.S.; Dave, R.; Razafimahatratra, H.; Rabarijohn, R.H.; Rajaofara, H.; MacKinnon, J.L. Extreme vulnerability of smallholder farmers to agricultural risks and climate change in Madagascar. Philos. Trans. Royal Soc. B Biol. Sci. 2014, 369, 20130089. [Google Scholar] [CrossRef] [PubMed] [Green Version]
- Lowder, S.K.; Skoet, J.; Raney, T. The number, size, and distribution of farms, smallholder farms, and family farms worldwide. World Devel. 2016, 87, 16–29. [Google Scholar] [CrossRef]
- Vermeulen, S.J.; Aggarwal, P.K.; Ainslie, A.; Angelone, C.; Campbell, B.M.; Challinor, A.J.; Hansen, J.W.; Ingram, J.S.I.; Jarvis, A.; Kristjanson, P.; et al. Options for support to agriculture and food security under climate change. Environ. Sci. Policy 2012, 15, 136–144. [Google Scholar] [CrossRef]
- Hertel, T.W.; Rosch, S.D. Climate change, agriculture, and poverty. Appl. Econ. Perspect. Policy 2010, 32, 355–385. [Google Scholar] [CrossRef]
- Schmidhuber, J.; Tubiello, F.N. Global food security under climate change. Proc. Natl. Acad. Sci. USA 2007, 104, 19703–19708. [Google Scholar] [CrossRef] [Green Version]
- Adger, W.N. Social Aspects of Adaptive Capacity. In Climate Change, Adaptive Capacity and Development; Smith, J.B., Klein, R.J., Huq, S., Eds.; Imperial Collegge Press: London, UK, 2003; pp. 29–49. [Google Scholar]
- Adger, W.N.; Agrawala, S.; Mirza, M.M.Q.; Conde, C.; Pulhin, J.; Pulwarty, R.; Smit, B.; Takahashi, K. Assessment of adaptation practices, options, constraints and capacity. In Climate Change 2007: Impacts, Adaptation and Vulnerability. Contribution of Working Group II to the Fourth Assessment Report of the Intergovernmental Panel on Climate Change; Parry, M.L., Canziani, O.F., Palutikof, J.P., Hanson, C.E., van der Linden, P.J., Eds.; Cambridge University Press: Cambridge, UK, 2007; pp. 717–774. [Google Scholar]
- Smithers, J.; Smit, B. Human adaptation to climatic variability and change. Glob. Environ. Chang. 1997, 7, 129–146. [Google Scholar] [CrossRef]
- Klein, R.J. Adaptation to climate variability and change: What is optimal and appropriate. In Climate Change in the Mediterranean: Socio-Economic Perspectives of Impacts, Vulnerability and Adaptation; Giupponi, C., Schechter, M., Eds.; Edward Elgar: Cheltenham, UK, 2003; pp. 32–50. [Google Scholar]
- Engle, N.L. Adaptive capacity and its assessment. Glob. Environ. Chang. 2011, 21, 647–656. [Google Scholar] [CrossRef]
- Mimura, N.; Pulwarty, R.S.; Duc, D.M.; Elshinnawy, I.; Redsteer, M.H.; Huang, H.Q.; Nkem, J.N.; Sanchez Rodriguez, R.A. Adaptation planning and implementation. In Climate Change 2014: Impacts, Adaptation, and Vulnerability. Part A: Global and Sectoral Aspects. Contribution of Working Group II to the Fifth Assessment Report of the Intergovernmental Panel on Climate Change; Field, C.B., Barros, V.R., Dokken, D.J., Mach, K.J., Mastrandrea, M.D., Bilir, T.E., Chatterjee, M., Ebi, K.L., Estrada, Y.O., Genova, R.C., et al., Eds.; Cambridge University Press: Cambridge, UK; New York, NY, USA, 2014; pp. 869–898. [Google Scholar]
- Smit, B.; Wandel, J. Adaptation, adaptive capacity and vulnerability. Glob. Environ. Chang. 2006, 16, 282–292. [Google Scholar] [CrossRef]
- Olsson, L.; Opondo, M.; Tschakert, P.; Agrawal, A.; Eriksen, S.E. Livelihoods and poverty. In Climate Change 2014: Impacts, Adaptation, and Vulnerability. Part A: Global and Sectoral Aspects. Contribution of Working Group II to the Fifth Assessment Report of the Intergovernmental Panel on Climate Change; Field, C.B., Barros, V.R., Dokken, D.J., Mach, K.J., Mastrandrea, M.D., Bilir, T.E., Chatterjee, M., Ebi, K.L., Estrada, Y.O., Genova, R.C., Eds.; Cambridge University Press: Cambridge, UK; New York, NY, USA, 2014; pp. 793–832. [Google Scholar]
- Grothmann, T.; Patt, A. Adaptive capacity and human cognition: The process of individual adaptation to climate change. Glob. Environ. Chang. 2005, 15, 199–213. [Google Scholar] [CrossRef]
- Chambers, R.; Conway, G. Sustainable rural livelihoods: Practical concepts for the 21st century. IDS Discuss. Paper 1992, 296, 1–29. [Google Scholar]
- Department for International Development (DFID). Sustainable Livelihoods Guidance Sheets; DFID: London, UK, 1999. [Google Scholar]
- Scoones, I. Sustainable Rural Livelihoods: A Framework for Analysis; IDS Working Paper 72; Institute of Development Studies: Brighton, UK, 1998. [Google Scholar]
- Ellis, F. Rural Livelihoods and Diversity in Developing Countries; Oxford University Press: New York, NY, USA, 2000. [Google Scholar]
- Zwierzchowski, J.; Tabeau, E. The 1992–95 War in Bosnia and Herzegovina: Census-based multiple system estimation of casualties’ undercount. In Proceedings of the International Research Workshop on ‘The Global Costs of Conflict’ The Households in Conflict Network (HiCN) and The German Institute for Economic Research (DIW Berlin), Berlin, Germany, 1–2 February 2010. [Google Scholar]
- Džihić, V. Failing Promises of Democracy: Structural Preconditions, Political Crisis and Socioeconomic Instability in Bosnia and Herzegovina. Southeast. Eur. 2012, 36, 328–348. [Google Scholar] [CrossRef]
- Bajić, D.; Trbić, G. Climate Atlas of Bosnia and Herzegovina; Faculty of Science: Banja Luka, Bosnia and Herzegovina, 2016. [Google Scholar]
- Federal Ministry of Agriculture, Water Management and Forestry. Orchard zoning of Federation of Bosnia and Herzegovina. Available online: http://fmpvs.gov.ba/upload_files/1440616881-361_1201_1813_b.pdf (accessed on 8 November 2017).
- Čadro, S.; Uzunović, M.; Žurovec, J.; Žurovec, O. Validation and calibration of various reference evapotranspiration alternative methods under the climate conditions of Bosnia and Herzegovina. Int. Soil Water Conserv. Res. 2017, 5, 309–324. [Google Scholar] [CrossRef]
- Jamshed, S. Qualitative research method-interviewing and observation. J. Basic Clin. Pharm. 2014, 5, 87–88. [Google Scholar] [CrossRef] [PubMed] [Green Version]
- Burgess, T.F. Guide to the Design of Questionnaires. A General Introduction to the Design of Questionnaires for Survey Research; University of Leeds: Leeds, UK, 2001; pp. 1–27. [Google Scholar]
- Greenwood, J.A.; Sandomire, M.M. Sample size required for estimating the standard deviation as a per cent of its true value. J. Am. Statist. Assoc. 1950, 45, 257–260. [Google Scholar] [CrossRef]
- Ross, A.; Willson, V.L. One-Way Anova. In Basic and Advanced Statistical Tests: Writing Results Sections and Creating Tables and Figures; Ross, A., Willson, V.L., Eds.; Sense Publishers: Rotterdam, The Netherlands, 2017; pp. 21–24. [Google Scholar]
- Paudel Khatiwada, S.; Deng, W.; Paudel, B.; Khatiwada, J.; Zhang, J.; Su, Y. Household livelihood strategies and implication for poverty reduction in rural areas of central Nepal. Sustainability 2017, 9, 612. [Google Scholar] [CrossRef]
- The World Bank (WB). Agricultural Sector Policy Note for Bosnia and Herzegovina—Trade and Integration Policy Notes; The World Bank (WB): Washington, DC, USA, 2010. [Google Scholar]
- Ministry of Foreign Trade and Economic Relations (MOFTER). Strategic Plan for Rural Development of Bosnia and Herzegovina (2018–2021)—Framework Document. Available online: http://www.mvteo.gov.ba/data/Home/Dokumenti/Poljoprivreda/Strategic_Plan_for_Rural_Development_of_BiH___Eng.pdf (accessed on 8 February 2019).
- Agency for Statistics of Bosnia and Herzegovina (BHAS). Areas Sown and Plantations at the End of Spring Sowing 2015. Available online: http://www.bhas.ba/saopstenja/2015/AGR_2015_002_01-bos.pdf (accessed on 5 September 2017).
- Federal Ministry of Agriculture, Water Management and Forestry. Medium-Term Strategy of Agricultural Sector Development in Federation of Bosnia and Herzegovina for the Period 2015–2019. Available online: http://www.parlamentfbih.gov.ba/dom_naroda/bos/parlament/propisi/usvojeni_p_14_18/Prijedlog%20Srednjorocne%20strategije%20razvoja%20poljoprivrednog%20sektora.pdf (accessed on 6 May 2017). (In Bosnian)
- Čadro, S.; Žurovec, J.; Husić, S. Chart for real time potato irrigation based on actual weather conditions in Herzegovina. Works Fac. Agric. Food Sci. Univ. Sarajevo 2017, 67, 101–111. [Google Scholar]
- Agency for Statistics of Bosnia and Herzegovina (BHAS). Household Budget Survey 2015. Available online: http://www.bhas.ba/ankete/HBS_saopstenje_juli_BS_www.pdf (accessed on 8 November 2017).
- Stockbridge, M.; Dorward, A.; Kydd, J. Farmer Organizations for Market Access: A Briefing Paper; Wye Campus, Imperial College London: London, UK, 2003. [Google Scholar]
- Berjan, S.; Jovanović, M.; Mrdalj, V.; Paspalj, M.; Matović, F.; Driouech, N.; El Bilali, H.; Abouabdillah, A. Rural Livelihood Diversification in South-Eastern Bosnia: Influence of Household Financial Management. Int. J. Environ. Rural Devel. 2014, 5, 17–22. [Google Scholar]
- Davis, J. Rural Non-farm Livelihoods in Transition Economies: Emerging Issues and Policies. eJADE Electron. J. Agric. Devel. Econ. 2006, 3, 180–224. [Google Scholar]
- Borensztein, E.; De Gregorio, J.; Lee, J.W. How does foreign direct investment affect economic growth? J. Int. Econ. 1998, 45, 115–135. [Google Scholar] [CrossRef] [Green Version]
- Agency for Statistics of Bosnia and Herzegovina (BHAS). Labour Force Survey 2017—Preliminary Data. Available online: http://www.bhas.ba/saopstenja/2017/ARS_2017G12_001_01_bos.pdf (accessed on 5 September 2017).
- The World Bank (WB). Unemployment, Total (% of total labor force). International Labour Organization, ILOSTAT Database. Available online: https://data.worldbank.org/indicator/SL.UEM.TOTL.ZS (accessed on 5 September 2017).
- Ministry of Foreign Trade and Economic Relations (MOFTER). The Annual Report from Agricultural, Food and Rural Developments Sectors in Bosnia and Herzegovina in 2015. Available online: http://www.mvteo.gov.ba/izvjestaji_publikacije/izvjestaji/default.aspx?id=8246&langTag=bs-BA (accessed on 5 September 2017). (In Bosnian)
- Clay, J. World Agriculture and the Environment: A Commodity-By-Commodity Guide to Impacts and Practices; Island Press: Washington, DC, USA, 2013. [Google Scholar]
- Bernstein, H. Class Dynamics of Agrarian Change; Fernwood Publishing: Halifax, UK, 2010. [Google Scholar]
- Bajramović, S.; Ognjenović, D.; Nikolić, A. Challenges Faced by the Agro-food sector in Bosnia and Herzegovina as Regards to its Integration with the EU. In Proceedings of the 4th DAES Conference—Agriculture in Western Balkans and EU Integration, Moravske Toplice, Slovenia, 8–9 November 2007; pp. 9–32. [Google Scholar]
- Ministry of Foreign Trade and Economic Relations (MOFTER). Analysis of Foreign Trade of Bosnia and Herzegovina 2016. Available online: http://www.mvteo.gov.ba/izvjestaji_publikacije/izvjestaji/default.aspx?id=8622&langTag=bs-BA (accessed on 5 September 2017). (In Bosnian)
- Berjan, S.; El Bilali, H.; Sorajić, B.; Le, T.M.C.; Driouech, N.; Milutinović, H. Rural finance and credit access in south-eastern Bosnia and Herzegovina. Agric. For. 2014, 60, 119. [Google Scholar]
- Thomas, J. Property rights, land fragmentation and the emerging structure of agriculture in Central and Eastern European countries. eJADE Electron. J. Agric. Devel. Econ. 2006, 3, 225–275. [Google Scholar]
- Gómez-Baggethun, E.; Reyes-García, V.; Olsson, P.; Montes, C. Traditional ecological knowledge and community resilience to environmental extremes: A case study in Doñana, SW Spain. Glob. Environ. Chang. 2012, 22, 640–650. [Google Scholar] [CrossRef]
- Čadro, S.; Žurovec, J.; Cherni-Čadro, S. Severity, magnitude and duration of droughts in Bosnia and Herzegovina using standardized precipitation evapotranspiration index (SPEI). Agric. For. 2017, 63, 199–206. [Google Scholar]
- United Nations Framework Convention on Climate Change (UNFCCC). Second National Communication of Bosnia and Herzegovina Under the United Nation Framework Convention on Climate Change (SNCBiH); Ministry for Spatial Planning, Construction and Ecology of Republic of Srpska: Banja Luka, Bosnia and Herzegovina, 2013. [Google Scholar]
- Adams, H. Why populations persist: Mobility, place attachment and climate change. Popul. Environ. 2016, 37, 429–448. [Google Scholar] [CrossRef]
- Vaško, Ž.; Mirjanić, S. Key indicators of agricultural development in Bosnia and Herzegovina—Retrospective from 1950 to 2010. Agroznanje 2013, 14, 575–589. [Google Scholar]
- Rahman, H.M.T.; Hickey, G.M. What Does Autonomous Adaptation to Climate Change Have to Teach Public Policy and Planning About Avoiding the Risks of Maladaptation in Bangladesh? Front. Environ. Sci. 2019, 7, 2. [Google Scholar] [CrossRef]
- Malik, A.; Qin, X.; Smith, S.C. Autonomous Adaptation to Climate Change: A Literature Review; Institute for International Economic Policy Working Paper Series: Washington, DC, USA, 2010; pp. 1–25. [Google Scholar]
- Deressa, T.T.; Hassan, R.M.; Ringler, C.; Alemu, T.; Yesuf, M. Determinants of farmers’ choice of adaptation methods to climate change in the Nile Basin of Ethiopia. Glob. Environ. Chang. 2009, 19, 248–255. [Google Scholar] [CrossRef]
- Nhemachena, C.; Hassan, R.; Chakwizira, J. Analysis of determinants of farm-level adaptation measures to climate change in Southern Africa. J. Devel. Agric. Econ. 2014, 6, 232–241. [Google Scholar]
- Yohe, G.; Tol, R.S.J. Indicators for social and economic coping capacity—moving toward a working definition of adaptive capacity. Glob. Environ. Chang. 2002, 12, 25–40. [Google Scholar] [CrossRef]
- Wamsler, C. Climate Change, Adaptation and Formal Education: The Role of Schooling for Increasing Societies’ Adaptive Capacities. Ecol. Soc. 2011, 17. [Google Scholar]
- Ali, A.; Erenstein, O. Assessing farmer use of climate change adaptation practices and impacts on food security and poverty in Pakistan. Clim. Risk Manag. 2017, 16, 183–194. [Google Scholar] [CrossRef]
- Haggblade, S.; Hazell, P.B.; Reardon, T. Transforming the Rural Nonfarm Economy: Opportunities and Threats in the Developing World; The Johns Hopkins University Press: Baltimore, MD, USA, 2007. [Google Scholar]
Figure 1.
Agricultural regions of Bosnia and Herzegovina (BH) and the location of surveyed households.
Figure 1.
Agricultural regions of Bosnia and Herzegovina (BH) and the location of surveyed households.

Figure 2.
Reported frequency of damages caused by adverse weather conditions, BH 2015.

Figure 3.
(a) Temperature trends and (b) precipitation trends from weather stations in the studied regions (1961–2015).
Figure 3.
(a) Temperature trends and (b) precipitation trends from weather stations in the studied regions (1961–2015).


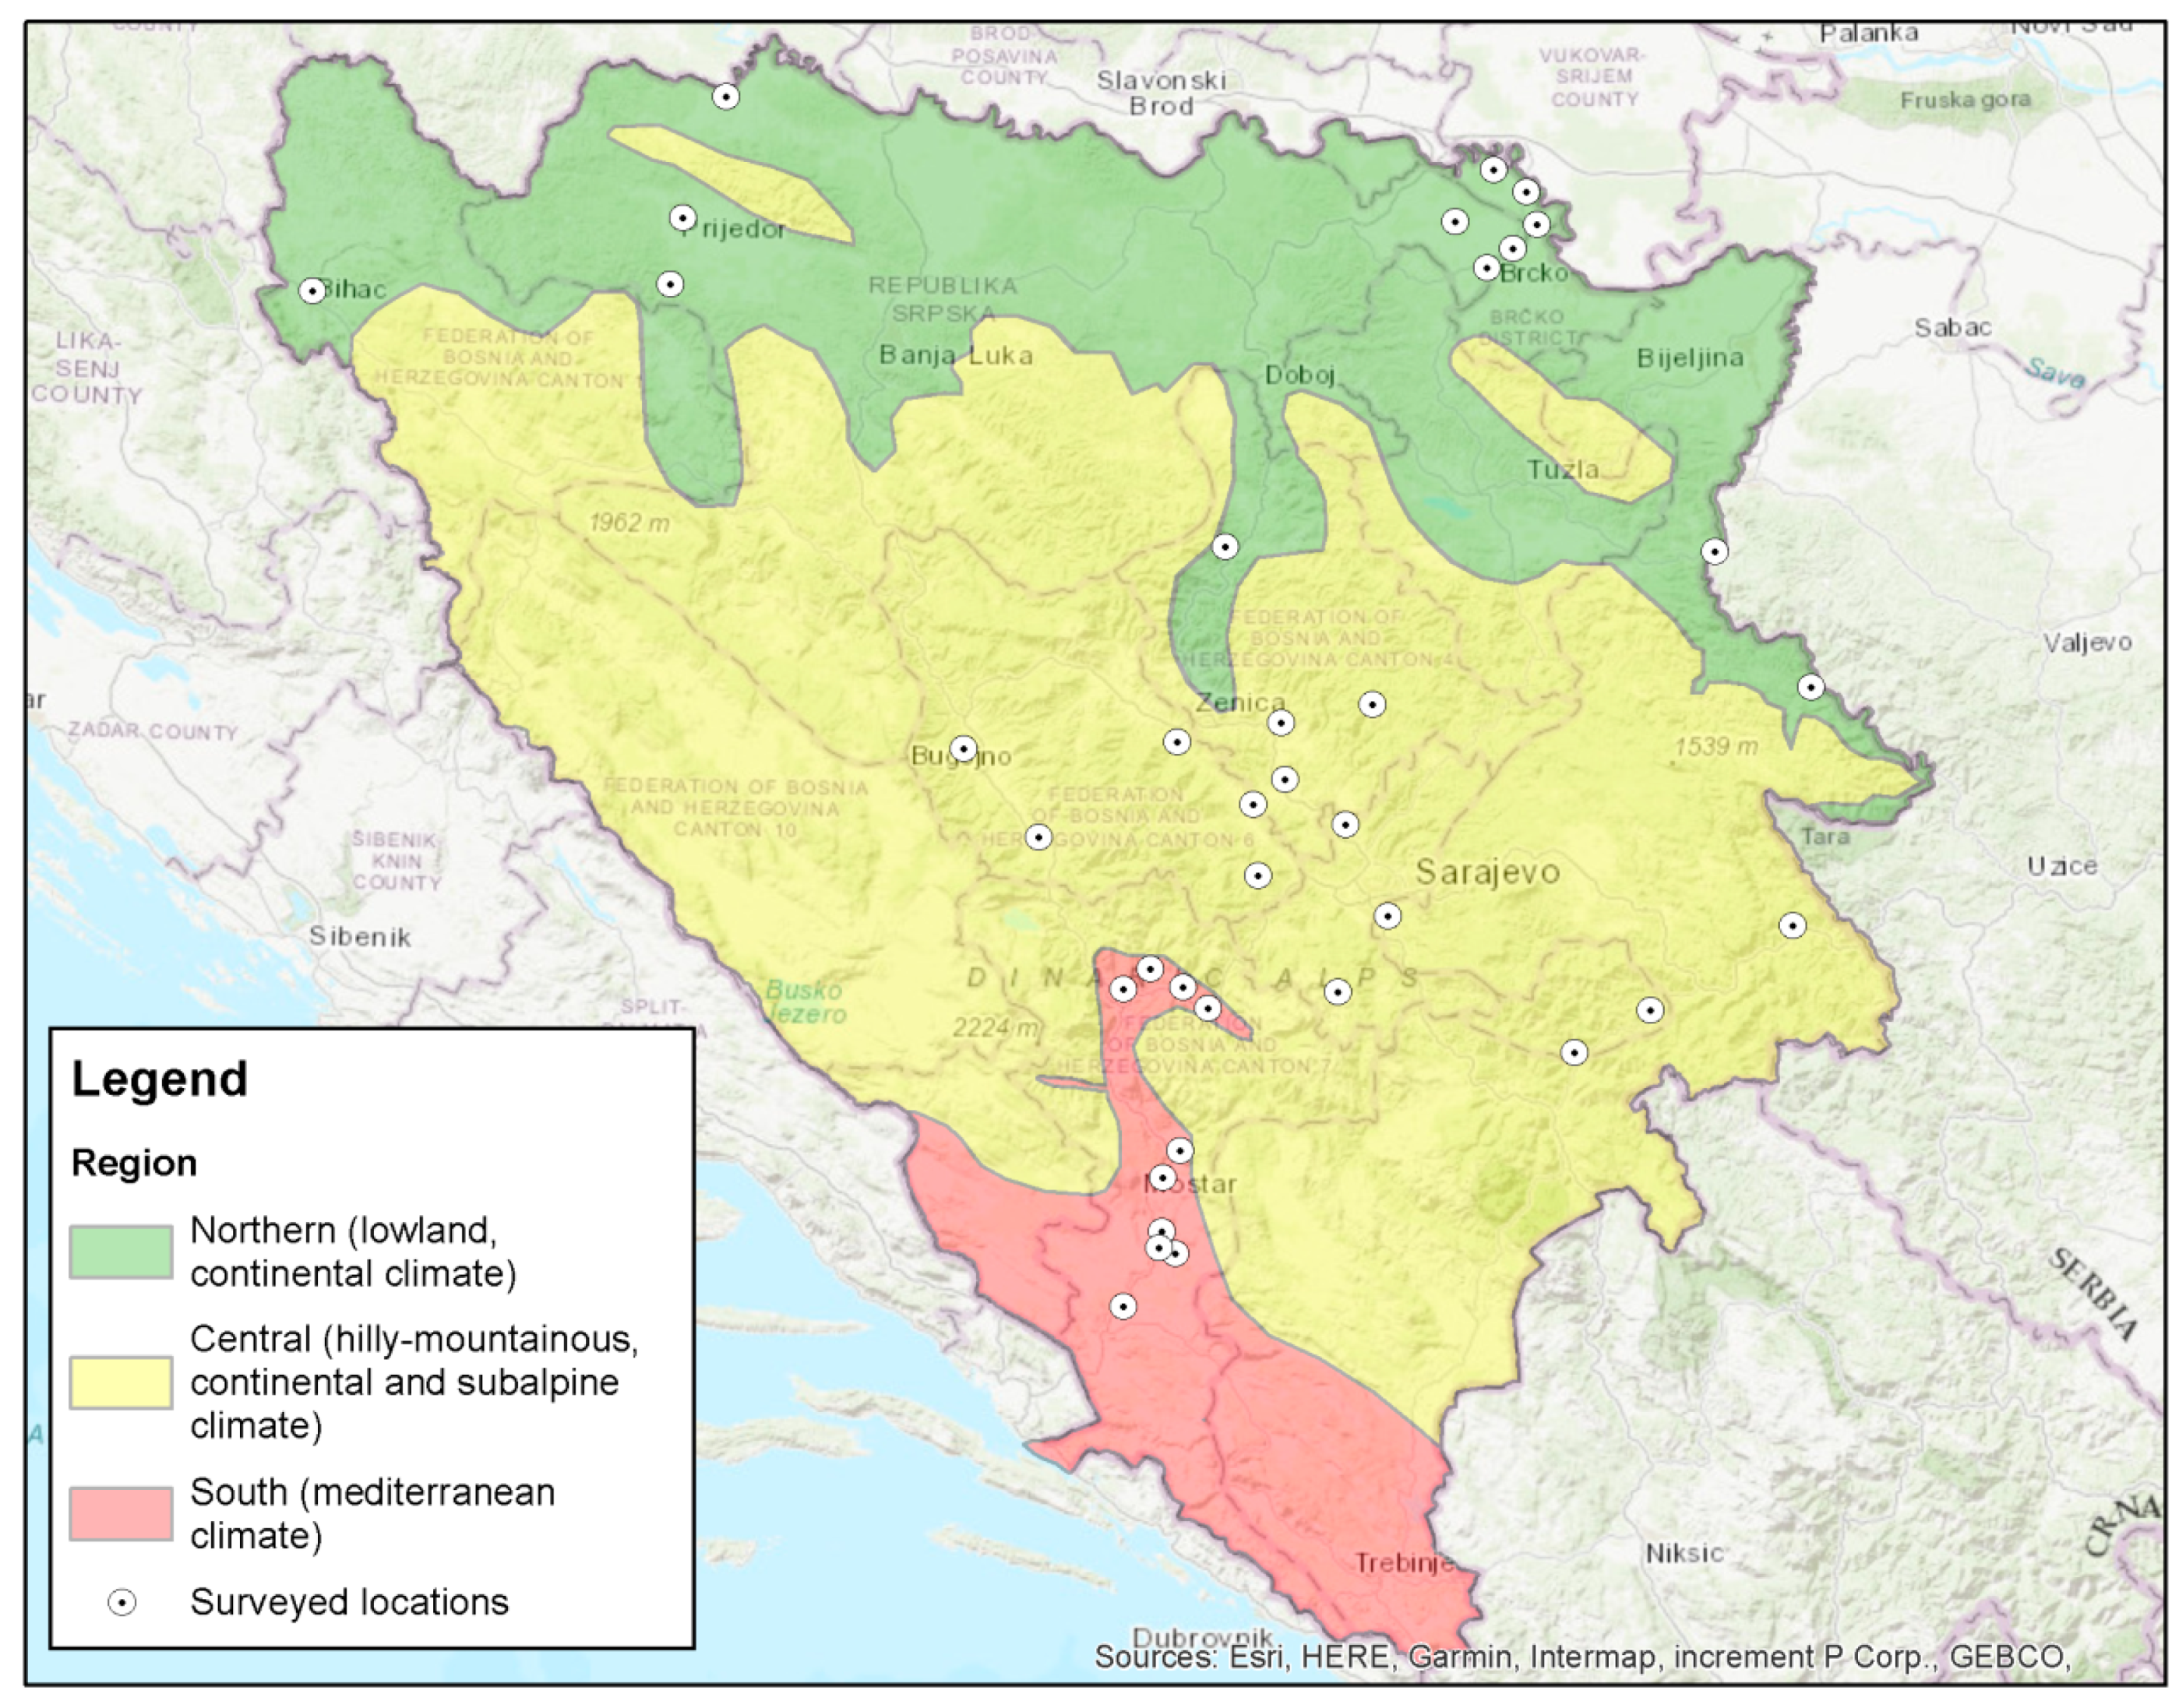
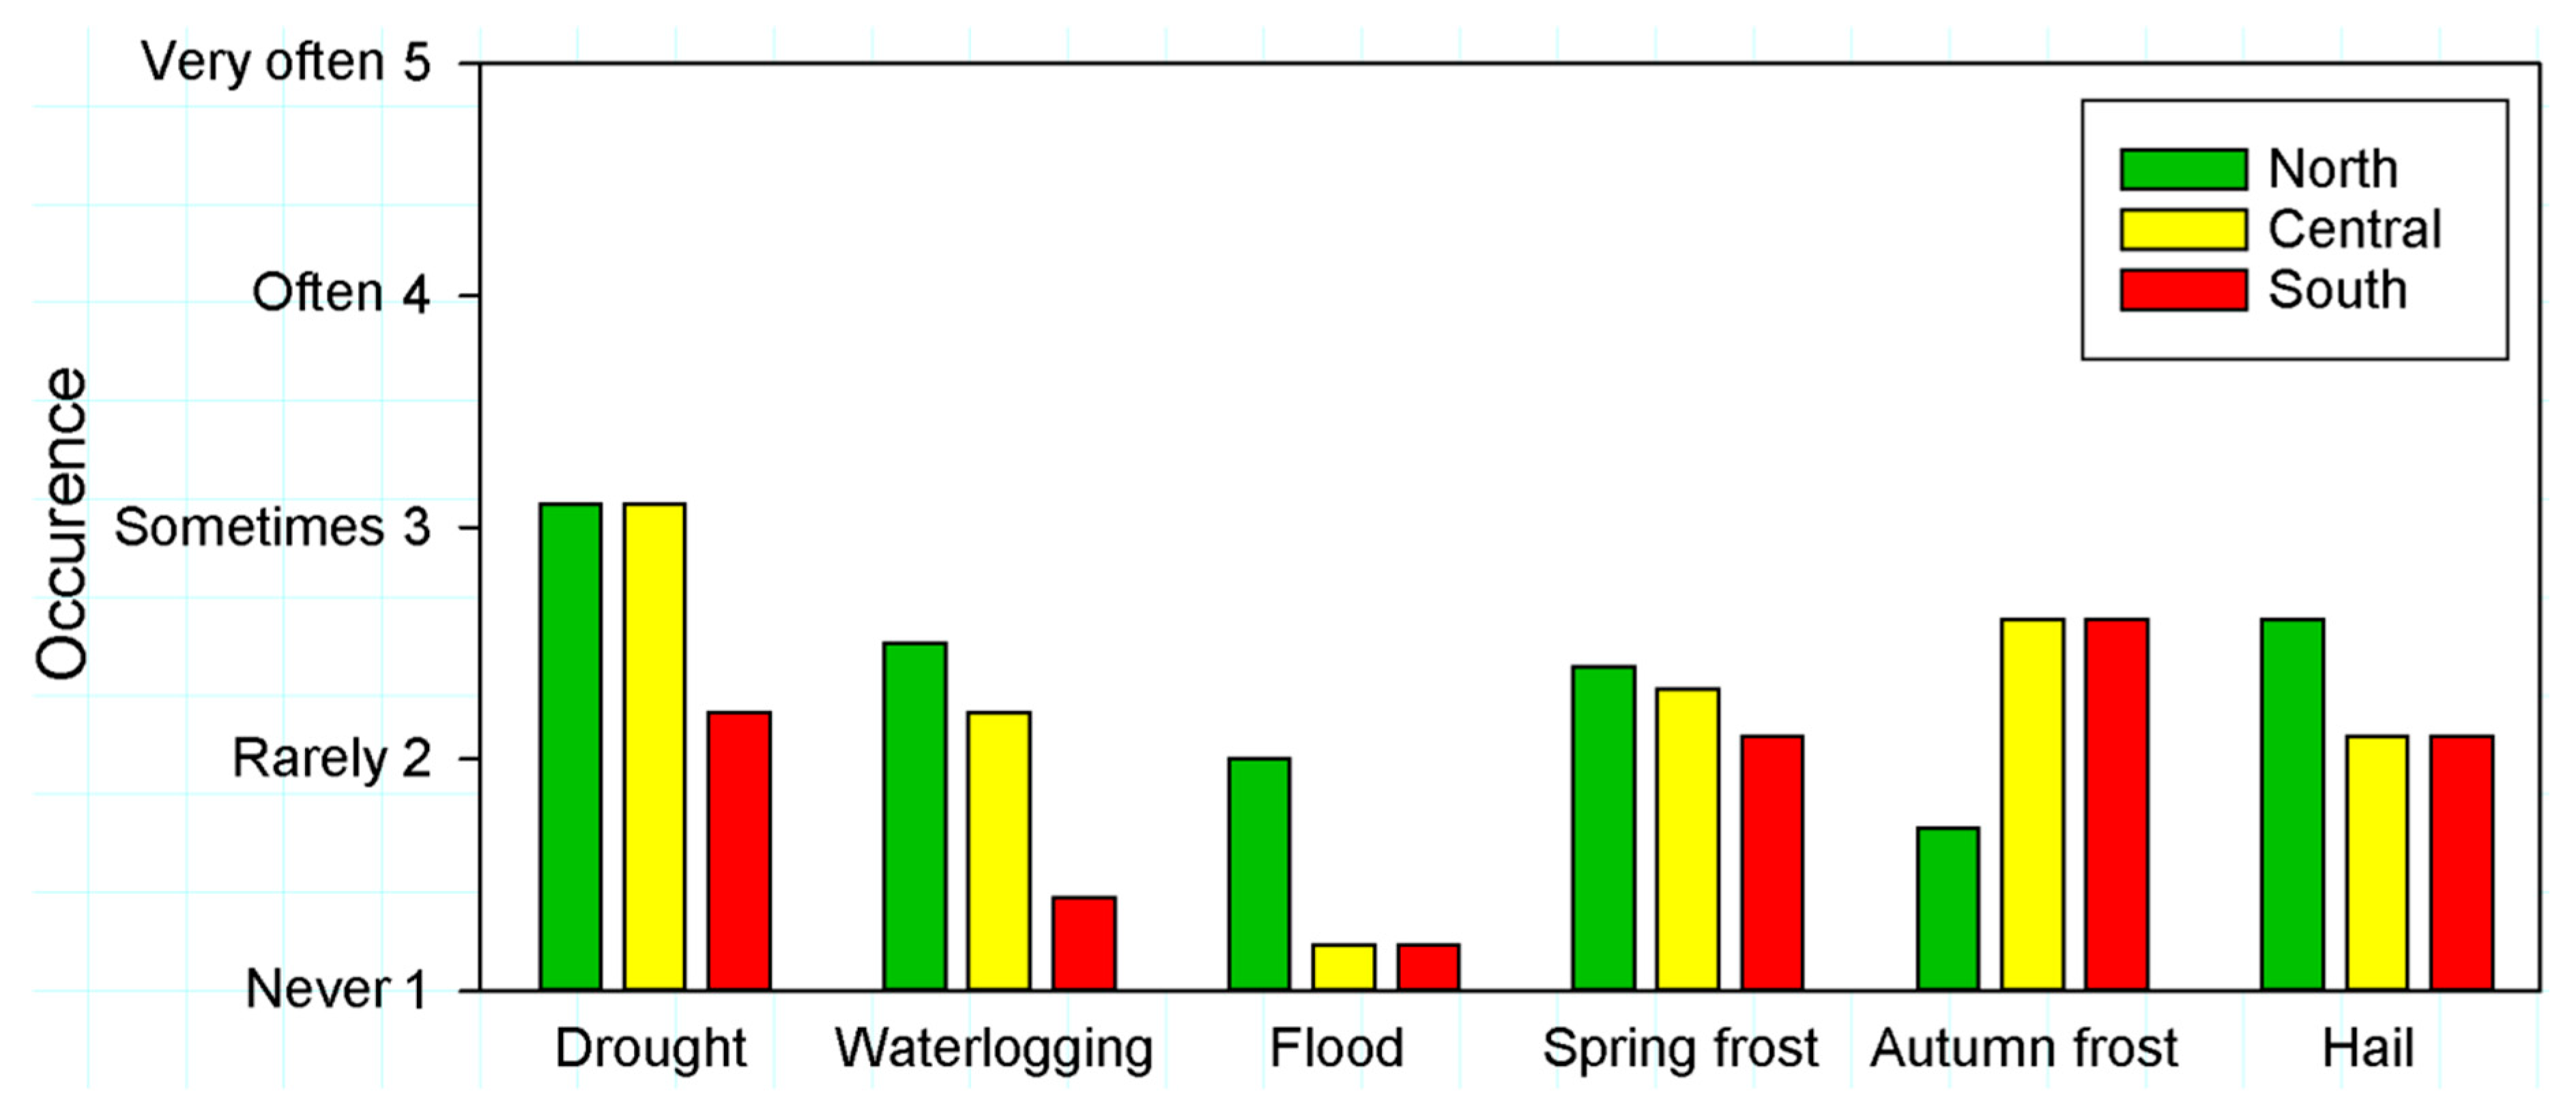
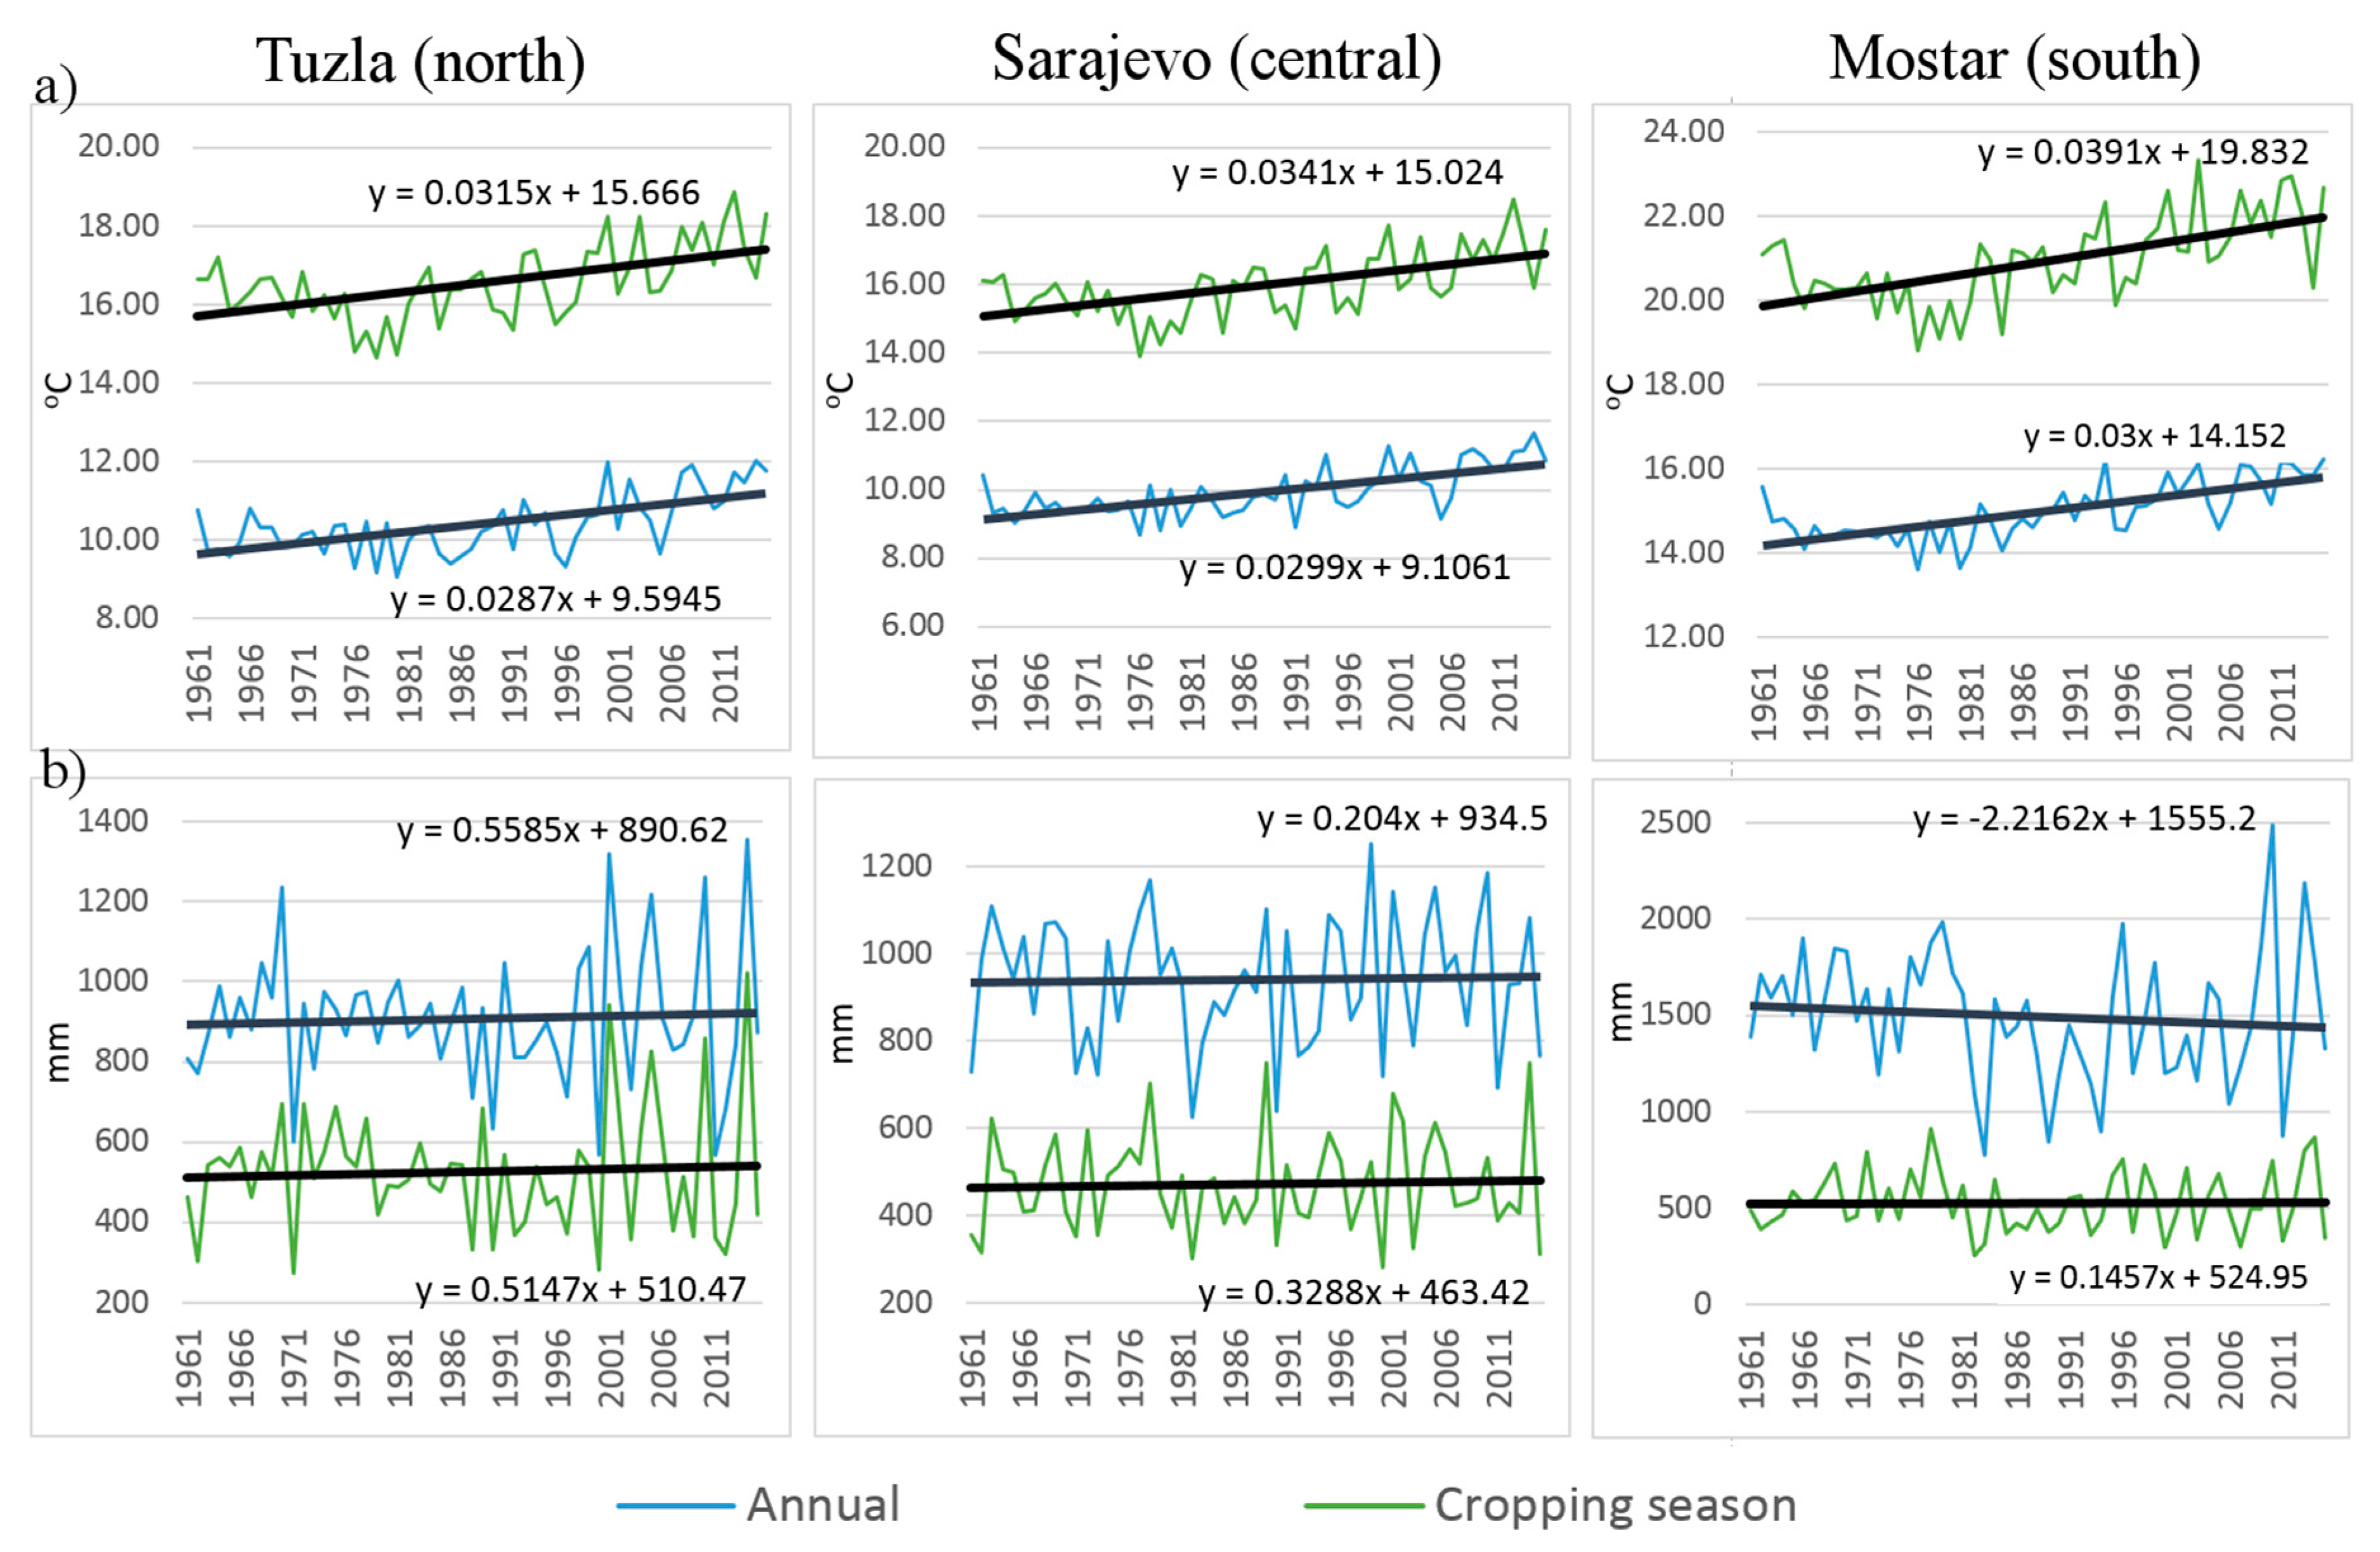
Table 1.
Asset structure by location of households, BH 2015.
| Variables | North (n = 35) | Central (n = 33) | South (n = 36) | Overall (n = 104) |
|---|---|---|---|---|
| Natural Capital | ||||
| Farm size (ha) | 5.6 | 5.1 | 4.4 | 5.0 |
| Land under lease (ha) ** | 9.3 a | 0.8 b | 0.8 b | 3.6 |
| Area under crops (ha) ** | 13.9 a | 2.1 b | 2.8 b | 6.3 |
| Grasslands (ha) ** | 0.3 a | 2.0 b | 1.0 | 1.1 |
| Other land (forest, lake, unproductive; ha) | 0.6 | 0.9 | 1.3 | 0.9 |
| Fallow size (ha) | 0.2 | 0.5 | 0.1 | 0.3 |
| Crop diversity per farm ** | 3.5 a | 2.8 b | 3.6 a | 3.3 |
| Physical Capital | ||||
| Access to drinking water (%) ** | 100 a | 100 a | 80.6 b | 93.5 |
| Access to electricity (%) | 100 | 100 | 100 | 100.0 |
| Road quality (from 1 = bad to 5 = excellent) | 3.3 | 3.6 | 3.4 | 3.4 |
| Farm ownership (%) | 97.9 | 97.0 | 86.1 | 93.7 |
| Agricultural mechanization (%) ** | 91.4 a | 60.6 b | 97.2 a | 83.1 |
| Age of mechanization (years) ** | 10.0 a | 15.3 | 18.0 b | 14.4 |
| Irrigation system (%) * | 74.3 | 60.6 a | 88.9 b | 74.6 |
| Irrigated land (%) * | 44.0 | 29.5 a | 52.5 b | 42.0 |
| Greenhouse (%) | 11.4a | 18.2a | 47.2b | 26.0 |
| Human Capital | ||||
| Household size | 4.2 | 4.5 | 5.0 | 4.6 |
| Age of the head of household | 54.3 | 53.8 | 59.5 | 55.9 |
| Education—head of household (years) | 10.1 | 12.3 | 11.2 | 11.2 |
| Education—highest in household (years) ** | 12.3 a | 14.0 b | 12.9 a | 13.1 |
| Dependency ratio (%) | 32.4 | 23.1 | 47.2 | 34.2 |
| Financial Capital | ||||
| Livestock units (LSU) ** | 5.1 a | 5.9 a | 0.8 b | 3.8 |
| Household annual income (BAM 1) ** | 22,302.9 a | 27,381.8 a | 48,233.3 b | 32,639.3 |
| Annual income per household member (BAM 1) ** | 5,554.3 a | 5,949.7 a | 11,226.3 b | 7,576.8 |
| Social Capital | ||||
| Access to information (Radio, TV) | 100.0 | 100.0 | 100.0 | 100.0 |
| Internet access (%) ** | 94.3 a | 66.6 b | 94.4 a | 85.1 |
| Membership in associations (%) ** | 37.1 a | 45.4 a | 88.9 b | 57.1 |
| Access to extension (%) ** | 88.6 a | 57.6 b | 58.3 b | 68.2 |
| Access to credit (%) ** | 100 a | 81.8 b | 97.2 a | 93.0 |
| Percentage of Households in the Group Based on Wealth | ||||
| Poorest (%) | 45.7 | 42.4 | 13.9 | 33.7 |
| Poor (%) | 31.4 | 30.3 | 36.1 | 32.7 |
| Less poor (%) | 22.9 | 27.3 | 50.0 | 33.7 |
*,** ANOVA: significant difference between location groups. * p < 0.05, ** p < 0.01; a,b Post-hoc tests: groups with different letters are significantly different from each other (p < 0.05); 1 Bosnia and Herzegovina Convertible Mark (BAM). 1 BAM = 0.51 EUR = 0.60 USD.
Table 2.
Asset structure by wealth group, BH 2015.
| Variables | Poorest (n = 35) | Poor (n = 34) | Less Poor (n = 35) | Overall (n = 104) |
|---|---|---|---|---|
| Natural Capital | ||||
| Farm size (ha) ** | 2.4 a | 4.0 a | 8.8 b | 5.0 |
| Land under lease (ha) | 1.3 | 5.1 | 4.7 | 3.6 |
| Area under crops (ha) * | 2.8 a | 7.2 | 9.1 b | 6.3 |
| Grasslands (ha) | 0.5 | 1.3 | 1.5 | 1.1 |
| Other land (forest, lake, unproductive; ha) * | 0.3 a | 0.6 | 1.8 b | 0.9 |
| Fallow size (ha) | 0.1 | 0.2 | 0.5 | 0.3 |
| Crop diversity per farm * | 2.6 a | 3.4 | 3.4 b | 3.3 |
| Physical Capital | ||||
| Access to drinking water (%) | 100.0 | 91.2 | 88.6 | 93.5 |
| Access to electricity (%) | 100.0 | 100.0 | 100.0 | 100.0 |
| Road quality (from 1 = bad to 5 = excellent) | 3.6 | 3.2 | 3.5 | 3.4 |
| Farm ownership (%) | 97.1 | 91.2 | 94.3 | 93.7 |
| Agricultural mechanization (%) ** | 65.7 a | 94.1 b | 91.4 b | 83.1 |
| Age of mechanization (years) | 13.1 | 14.5 | 15.3 | 14.4 |
| Irrigation system (%) | 68.6 | 70.6 | 85.7 | 74.6 |
| Irrigated land (%) | 40.4 | 38.7 | 47.8 | 42.0 |
| Greenhouse (%) | 17.1 | 29.4 | 31.4 | 26.0 |
| Human Capital | ||||
| Household size ** | 3.8 a | 4.5 | 5.4 b | 4.6 |
| Age of the head of household | 55.3 | 54.3 | 58.1 | 55.9 |
| Education – head of household (years) | 11.1 | 11.0 | 12.1 | 11.2 |
| Education – highest in household (years) | 12.9 | 12.9 | 13.3 | 13.1 |
| Dependency ratio (%) | 30.1 | 33.9 | 38.0 | 34.2 |
| Financial Capital | ||||
| Livestock units (LSU) | 3.6 | 2.5 | 5.3 | 3.8 |
| Household annual income (BAM 1) ** | 13,405.7 a | 25,535.3 a | 59,520.0 b | 32,639.3 |
| Annual income per household member (BAM 1) ** | 3957.2 a | 6203.4 a | 12,727.7 b | 7,576.8 |
| Social Capital | ||||
| Access to information (radio, TV) | 100.0 | 100.0 | 100.0 | 100.0 |
| Internet access (%) | 80.0 | 85.3 | 91.4 | 85.1 |
| Membership in associations (%) ** | 31.4 a | 67.6 b | 74.3 b | 57.1 |
| Access to extension (%) | 71.4 | 70.6 | 62.9 | 68.2 |
| Access to credit (%) ** | 82.9 a | 97.1 b | 100.0 b | 93.0 |
| Percentage of Households in the Group Based on Location | ||||
| North (%) | 45.7 | 32.4 | 22.9 | 33.7 |
| Central (%) | 40.0 | 29.4 | 25.7 | 31.7 |
| South (%) | 14.3 | 38.2 | 51.4 | 34.6 |
*,** ANOVA: significant difference between wealth groups: * p < 0.05, ** p < 0.01; a,b Post-hoc tests: groups with different letters are significantly different from each other (p < 0.05); 1 Bosnia and Herzegovina Convertible Mark (BAM). 1 BAM = 0.51 EUR = 0.60 USD.
Table 3.
Diversification of income sources by location, BH 2015.
| Income Source | North (n = 35) | Central (n = 33) | South (n = 36) | Total (n = 104) | ||||
|---|---|---|---|---|---|---|---|---|
| Income (BAM) | % | Income (BAM) | % | Income (BAM) | % | Income (BAM) | % | |
| Agriculture **++ | 17,877 a | 78.1 b | 16,356 a | 55.9 a | 41,198 b | 83.2 b | 25,467 | 72.8 |
| Off-farm agricultural *+ | 309 a | 1.1 | 1590 b | 3.9 a | 150 a | 0.1 b | 660 | 1.7 |
| Non-farm+ | 3,158 | 15.9 | 7068 | 28.2 a | 5,298 | 12.1 b | 5140 | 18.5 |
| Remittances | 549 | 3.7 | 927 | 4.4 | 13 | 0.1 | 483 | 2.7 |
| Pension, other social transfers *+ | 411 | 1.1 a | 1,440 | 7.6 b | 1,573 | 4.6 | 1,140 | 4.4 |
| Total ** | 22,303 a | 100.0 | 27,382 a | 100.0 | 48,233 b | 100.0 | 32,891 | 100.0 |
*,** ANOVA: significant difference between the absolute income categories (BAM): * p < 0.05; ** p < 0.01. +,++ ANOVA: significant difference between the relative income categories (%): + p < 0.05; ++ p < 0.01. a,b Post-hoc tests: groups with different letters are significantly different from each other (p < 0.05).
Table 4.
Diversification of income sources by wealth group (in BAM), BH 2015.
| Income Source | Poorest (n = 35) | Poor (n = 34) | Less Poor (n = 35) | Total (n = 104) | ||||
|---|---|---|---|---|---|---|---|---|
| Income | % | Income | % | Income | % | Income | % | |
| Agriculture ** | 9266 a | 68.4 | 18,203 a | 71.9 | 48,725 b | 78.1 | 25,467 | 72.8 |
| Off-farm non-agricultural | 124 | 0.7 | 706 | 2.5 | 1152 | 1.8 | 660 | 1.7 |
| Non-farm * | 2452 a | 18.9 | 5144 | 20.1 | 7822 b | 16.4 | 5140 | 18.5 |
| Remittances | 648 | 5.4 | 473 | 1.7 | 329 | 0.9 | 483 | 2.7 |
| Pension, other social transfers | 915 | 6.6 | 1009 | 3.8 | 1491 | 2.8 | 1140 | 4.4 |
| Total ** | 13,405 a | 100 | 25,535 b | 100 | 59,519 c | 100 | 32,891 | 100 |
*,** ANOVA: significant difference between the absolute wealth categories (BAM): * p < 0.05; ** p < 0.01. +,++ ANOVA: significant difference between the relative wealth categories (%): + p < 0.05; ++ p < 0.01. a,b Post-hoc tests: groups with different letters are significantly different from each other (p < 0.05)
Table 5.
Percentage of households engaged in main types of production by location and wealth group, BH 2015.
Table 5.
Percentage of households engaged in main types of production by location and wealth group, BH 2015.
| Production | Percentage of Households | ||||||
|---|---|---|---|---|---|---|---|
| North (n = 35) | Central (n = 33) | South (n = 36) | Poorest (n = 35) | Poor (n = 34) | Less Poor (n = 35) | Average (n = 104) | |
| Crops | |||||||
| Cereals ** | 97.1 a | 27.3 b | 0.0 c | 42.9 | 47.1 | 34.3 | 41.3 |
| Soybean ** | 54.3 a | 0.0 b | 0.0 b | 22.9 | 14.7 | 17.1 | 18.3 |
| Tobacco ** | 77.1 a | 0.0 b | 0.0 b | 31.4 | 29.4 | 17.1 | 26.9 |
| Vegetables **++ | 0.0 a | 39.4 b | 66.7 c | 17.1 a | 41.2 | 48.6 b | 35.6 |
| Vegetables (greenhouse) ** | 11.4 a | 18.2 a | 47.2 b | 17.1 | 29.4 | 31.4 | 26.0 |
| Top fruit ** | 0.0 a | 33.3 b | 30.6 b | 14.3 | 23.5 | 25.7 | 21.2 |
| Soft fruit ** | 8.6 a | 33.3 b | 38.9 b | 31.4 | 20.6 | 28.6 | 26.9 |
| Livestock | |||||||
| Cattle ** | 37.1 | 57.6 a | 27.8 b | 40.0 | 38.2 | 42.9 | 40.4 |
| Small ruminants and pigs ** | 68.6 a | 51.5 | 8.3 b | 48.6 | 44.1 | 34.3 | 42.3 |
| Poultry **+ | 74.3 a | 39.4 b | 8.3 c | 51.4 a | 41.2 | 28.6 b | 40.4 |
| Total livestock units ** | 5.1 a | 5.9 a | 0.8 b | 3.6 | 2.5 | 5.3 | 3.8 |
*,** ANOVA: significant difference between the location categories. * p < 0.05; ** p < 0.01. +,++ significant difference between the wealth categories: + p < 0.05; ++ p < 0.01. a,b Post-hoc tests: different letters indicate significant differences within a category (p < 0.05).
Table 6.
Reported adaptation strategies by location and wealth group, BH 2015.
| Adaptation Strategies | Percentage of Households | ||||||
|---|---|---|---|---|---|---|---|
| North (n = 35) | Central (n = 33) | South (n = 36) | Poorest (n = 35) | Poor (n = 34) | Less Poor (n = 35) | Average (n = 104) | |
| Non-agricultural | |||||||
| Lease out land ** | 17.1 a | 3.1 b | 0.0 b | 11.4 | 6.0 | 2.9 | 6.9 |
| Work on another farm | 17.1 | 3.1 | 19.4 | 20.0 | 14.7 | 5.6 | 13.6 |
| Off-farm employment * | 62.9 | 72.7 a | 38.9 b | 60.0 | 55.9 | 54.1 | 57.7 |
| Moving to urban area *+ | 14.3 | 21.2 a | 0.0 b | 22.9 a | 5.9 | 5.4 b | 11.5 |
| Moving abroad | 5.7 | 6.1 | 5.6 | 8.6 | 2.9 | 5.4 | 5.8 |
| Agricultural | |||||||
| Change of crop ** | 88.6 a | 43.3 b | 70.6 a | 61.8 | 84.4 | 58.8 | 68.7 |
| Change of crop variety ** | 91.4 a | 54.8 b | 85.3 a | 70.6 | 81.3 | 85.7 | 78.0 |
| Drought resistant crops * | 2.9 a | 26.7 b | 14.7 | 5.9 | 21.9 | 14.7 | 14.1 |
| Reduced tillage | 5.7 | 16.1 | 8.8 | 5.9 | 12.5 | 11.4 | 10.0 |
| No-till | 0.0 | 3.2 | 5.9 | 2.9 | 3.1 | 2.9 | 3.0 |
| Change in sowing/planting dates | 54.3 | 46.7 | 58.8 | 52.9 | 53.1 | 58.8 | 53.5 |
| Fertilization (synthetic + manures) | 94.3 | 90.0 | 100.0 | 88.2 | 100.0 | 100.0 | 94.9 |
| Incorporation of crop residues ** | 88.6 a | 50.0 b | 15.2 c | 47.1 | 61.3 | 47.1 | 52.0 |
| Use of cover crops * | 5.7 a | 26.7 b | 8.8 | 14.7 | 15.6 | 8.8 | 13.1 |
| Irrigation ** | 85.7 a | 60.0 b | 97.1 a | 82.4 | 75.0 | 91.2 | 81.8 |
| Drainage ** | 54.3 a | 20.0 b | 0.0 b | 26.5 | 28.1 | 20.6 | 25.3 |
| Erosion prevention ** | 2.9 a | 23.3 b | 0.0 a | 8.8 | 6.3 | 8.8 | 8.1 |
| Anti-hail nets | 0.0 | 10.0 | 5.9 | 5.9 | 6.3 | 2.9 | 5.1 |
| Greenhouse ** | 11.4 a | 18.2 a | 47.2 b | 17.1 | 29.4 | 31.4 | 26.0 |
| Crop insurance ** | 51.4 a | 0.0 b | 0.0 b | 14.3 | 18.2 | 19.4 | 17.3 |
| Total Agricultural (average per household) | 6.4 a | 4.5 b | 4.9 | 4.9 | 5.6 | 5.3 | 5.3 |
*,** ANOVA: significant difference between some of the location categories. * p < 0.05; ** p < 0.01. +,++ significant difference between some of the wealth categories: + p < 0.05; ++ p < 0.01. a,b Post-hoc tests: groups with different letters are significantly different from each other (p < 0.05).
Table 7.
Determinants of agricultural adaptation, binary logistics regression, BH 2015.
| Capital Assets | Change of Crop | Change of Crop Variety | Drought Resistant Crops | Change in Sowing/Planting Dates | Incorporation of Crop Residues | Cover Crops | Irrigation | Drainage | Greenhouse | Crop Insurance |
|---|---|---|---|---|---|---|---|---|---|---|
| Regression Coefficient (B) | ||||||||||
| Farm size (including leased land) a | 0.026 | 0.045 | 0.014 | 0.004 | 0.236 ** | −0.010 | −0.086 * | 0.145 *** | −0.064 * | 0.199 *** |
| Possession of tractor | 1.222 * | 1.583 * | 20.553 | 1.128 | 1.361 * | −2.647 | 1.550 * | −0.146 | 2.015 * | 16.242 |
| Age (head of HH)b | −0.034 | −0.074 *** | −0.007 | 0.011 | −0.023 | −0.050 | −0.007 | -0.030 | −0.023 | 0.006 |
| Education (head of HH) | 0.058 * | −0.145 | 0.481 * | 0.121 | 0.057 | −0.162 | −0.012 | -0.051 | −0.088 | −0.190 |
| Education (highest in HH) | −0.475 | 0.265 | −0.020 | −0.076 | 0.096 | 0.147 | 0.210 | 0.337 | −0.213 | −0.017 |
| Household size | −0.191 | −0.064 | −0.099 | 0.301* | −0.017 | 0.118 | −0.056 | −0.510 | 0.311 * | −0.436 |
| Association membership | 0.446 | 1.003 | 1.734 * | −0.050 | −0.961 | 2.015 * | −1.144 | −1.193 | 0.943 * | −0.316 |
| Extension visitsc | 0.496 | −0.387 | 2.422 *** | −0.677 | 1.436 ** | 0.356 | 2.638 ** | 2.123 | 0.071 | 18.455 |
| Internet access | 0.659 | 0.566 | −0.772 | 0.731 | -0.593 | 0.017 | 2.678 ** | 0.842 | −1.039 | 17.676 |
| Total income (in 000 BAM)d,e | −0.009 | 0.004 | −0.018 | −0.015 | −0.032 ** | 0.005 | 0.040 * | −0.050 * | 0.005 | −0.017 |
| Non-farm income (in 000 BAM) | 0.032 | −0.070* | 0.062 | −0.025 | 0.016 | 0.044 | −0.022 | 0.117 | −0.006 | 0.017 |
*** Significant predictors in the regression equation model: * p < 0.1; ** p < 0.05; *** p < 0.01. a-e Variable excluded due to significant strong correlation with this explanatory variable in order to avoid multicollinearity in the model: a Farm size; b farming experience; c frequency of extension visits; d income per capita; e agricultural income. HH: head of household.
© 2019 by the authors. Licensee MDPI, Basel, Switzerland. This article is an open access article distributed under the terms and conditions of the Creative Commons Attribution (CC BY) license (http://creativecommons.org/licenses/by/4.0/).
Share and Cite
MDPI and ACS Style
Žurovec, O.; Vedeld, P.O. Rural Livelihoods and Climate Change Adaptation in Laggard Transitional Economies: A Case from Bosnia and Herzegovina. Sustainability 2019, 11, 6079. https://0-doi-org.brum.beds.ac.uk/10.3390/su11216079
AMA Style
Žurovec O, Vedeld PO. Rural Livelihoods and Climate Change Adaptation in Laggard Transitional Economies: A Case from Bosnia and Herzegovina. Sustainability. 2019; 11(21):6079. https://0-doi-org.brum.beds.ac.uk/10.3390/su11216079
Chicago/Turabian StyleŽurovec, Ognjen, and Pål Olav Vedeld. 2019. "Rural Livelihoods and Climate Change Adaptation in Laggard Transitional Economies: A Case from Bosnia and Herzegovina" Sustainability 11, no. 21: 6079. https://0-doi-org.brum.beds.ac.uk/10.3390/su11216079
Note that from the first issue of 2016, this journal uses article numbers instead of page numbers. See further details here.