Article

Identification of Enablers and Barriers for Public Bike Share System Adoption using Social Media and Statistical Models

1
Computer Science and Artificial Intelligence Department, University of the Basque Country UPV/EHU, 20018 Donostia-San Sebastián, Spain
2
Transport Department, School of Civil Engineering, Universitat Politècnica de Valencia, Camino de Vera s/n, 46022, Valencia, Spain
3
IDEKO, ICT and Automation Research Group, Arriaga 2, 20870 Elgoibar, Spain
*
Authors to whom correspondence should be addressed.
Sustainability 2019, 11(22), 6259; https://0-doi-org.brum.beds.ac.uk/10.3390/su11226259
Submission received: 29 August 2019 / Revised: 17 October 2019 / Accepted: 5 November 2019 / Published: 7 November 2019
(This article belongs to the Special Issue Sustainable Mobility: Interdisciplinary Approaches)

Abstract

:
Public bike share (PBS) systems are meant to be a sustainable urban mobility solution in areas where different travel options and the practice of active transport modes can diminish the need on the vehicle and decrease greenhouse gas emission. Although PBS systems have been included in transportation plans in the last decades experiencing an important development and growth, it is crucial to know the main enablers and barriers that PBS systems are facing to reach their goals. In this paper, first, sentiment analysis techniques are applied to user generated content (UGC) in social media comments (Facebook, Twitter and TripAdvisor) to identify these enablers and barriers. This analysis provides a set of explanatory variables that are combined with data from official statistics and the PBS observatory in Spain. As a result, a statistical model that assesses the connection between PBS use and certain characteristics of the PBS systems, utilizing sociodemographic, climate, and positive and negative opinion data extracted from social media is developed. The outcomes of the research work show that the identification of the main enablers and barriers of PBS systems can be effectively achieved following the research method and tools presented in the paper. The findings of the research can contribute to transportation planners to uncover the main factors related to the adoption and use of PBS systems, by taking advantage of publicly available data sources.

1. Introduction

Urban mobility is a major problem for EU citizens, as evidenced by a Eurobarometer study conducted in July 2007 [1], as 90% of Europeans thought that the traffic situation should be improved in their zone. The bicycle, as a sustainable transport mode, may play a key role to address this problem. According to the EU Transport Council in 2001, “a sustainable transport system is one that allows individuals and societies to meet their needs for access to areas of activity with total safely, in a manner consistent with human and ecosystem health, and that is also balanced equally between different generations” [2].
In this context, bicycles help to reduce pollution, as up to 70% of pollution is caused, in large cities, by traffic and private vehicles [3]. This gives an idea of the possibilities of bicycle transport to greatly favor a sustainable transport system.
In the last decade, public bicycle programs or public bike share (PBS) systems have undergone thundering growth, due to the development of better bicycle tracking methods with technological advances [4]. PBS systems have become increasingly popular in transport plans as a strategy for increasing travel decisions, promoting active modes of transport, reducing car needs and, in particular, decreasing greenhouse gas emissions [5]. Conforming to [6], a recent report from the Global Carbon Project indicated that greenhouse gas emissions increased by 2.7% in 2018.
Furthermore, opinions and experiences are essential for most human actions and impact on our behaviour [7]. User generated content (UGC), and especially social media comments, have permitted essential transformations in the dynamics of different sectors. Hence, the evaluation of this sort of PBS system data can be very significant in the assessment of transport to improve and stimulate PBS systems utilization. In addition, the sentiment analysis of social media content provides the chance to enhance traditional methods based on surveys to gather travel behaviour data, while reducing information bias, decreasing the burden on respondents, and improving information quality.
The purpose of this research is the identification of the main enablers and barriers of PBS systems as a reference of sustainable transport. The research is carried out using sentiment analysis to obtain information from social media to be used as explicative variables in travel behaviour models. For this purpose, the analysis of social media sources together with statistical data that provide variables such as demographics and climate data (population, temperature, precipitation, number of docking stations, etc.) is used. Thus, an appropriate statistical model can be established to assess the connection between PBS use and certain characteristics of the PBS systems, including socio-demographic and weather information, and positive and negative opinion data extracted from social media.
Accordingly, two different types of data sources are used. First, UGC is utilized to identify positive and negative factors associated to PBS systems in Spain, using user comments from social media. Second, official statistics and PBS data are collected, that provide characteristics of the PBS systems, utilizing sociodemographic and climate data, to define a set of potential explicative factors of the use of each public bike system. Positive and negative opinions defined from the analysis of social media data are statistically significant in a model to explain and predict PBS system use.
Moreover, this study presents a methodology and a software tool that has been customized to know the perception that users have about the PBS based on online comments.
The paper is organized as follows. Section 2 lays out the literature review of urban transport studies on the PBS systems and related social media analysis, as well as the paper’s contributions. Later, Section 3 describes the research methodology that is composed of two steps: sentiment analysis based on social media and a statistical panel model. Additionally, a software platform that implements the whole process is described. The platform provides a visual interface (dashboard) to manage and interpret the results easily. Afterwards, Section 4 details the main sentiment analysis results and the obtained model. Finally, the paper presents the conclusions and future lines of research.

2. Literature Review

Research into public bicycle systems has attracted the attention of researchers who reported their findings in the literature from different perspectives and viewpoints in the past years.
Shaheen et al. [8] studied the PBS systems as a sustainable transportation alternative, showing the evolution of three generations of PBS systems in Europe, America, and Asia from 1965 to 2010. The figures reported in the paper (100 bike sharing systems operating in 125 cities with more than 139,300 bicycles) have had an important growth in the following years. At the end of 2016, the amount of public use bicycles worldwide was 2,294,600, almost twice as much as the previous year (1,270,000) and the number of bike sharing systems grew up to 1188 [9]. In 2019, the total number of PBS systems is 2785, of which 143 have been implemented in Spain [10] (see Table A1, in Appendix A).
In the research community there exists also a growing interest to understand how public bicycle systems have been implemented and what difficulties influence travel behaviour. Conforming to Fishman et al., [11] the increase of public bicycle share systems world-wide has driven the growth of related academic literature. In consequence, a number of features related to the utilization of PBS systems have been identified.
The system’s infrastructure and operating characteristics are positively related to the use of bike sharing, such as accessible sign-up procedures, opening hours of 24/7, or incentives for sign up. Buck and Buehler [12] and El-Assi et al. [13] concluded that the existence of bicycle lanes is evidently a significant characteristic. Nevertheless, a critical impact on PBS users is the location of docking stations [14]. Positive aspects are related to the closeness of docking stations to residential housing [15,16], to retail outlets, transit stations [13,17,18], and to other share stations [13,19]. On the other hand, stations located away from the center of the PBS system [17] or near major roads [20] tend to reduce ridership. Bhuyan et al., [21] on the other hand, introduces a new equity-based planning methodology that minimizes segregation and marginalization for planning practices. The geographical methodology proposed includes a modified bike equity density population index and a traffic stress index level to prioritize bicycle-sharing infrastructure.
Socio-demographic features have been considered by researchers, and population and employment density, mixed-uses, retail density, and the education level of riders are associated to higher public bicycle use [13,19,22,23]. As a result, economic savings have been established to stimulate those on a low income. Regarding gender, men use bike share more than women do, however the disproportion is not as exaggerated as personal cycling [16]. In addition, regarding gender and use in terms of origin destination stations of their trips, Nickkar et al. [24] concluded that females tended to have more recreational trips and start and end their trips from and to the same station, when compared to male riders.
Weather conditions have been also studied, showing that rain, high humidity levels, and cold temperatures negatively affect bike share use [25]. Moreover, lower amounts of ground snow, lower humidity levels, and higher temperatures were positively correlated with bike ridership [13].
The optimization of the service in order to boost the usage has raised a clear interest of the scientific community. In this context, a number of spatiotemporal bike mobility models based on historical PBS data have been developed to predict station-level hourly demand in a large-scale bike-sharing network [26,27,28]. Moreover, Hu and Ji et al. [29] devise a trip advisor that recommends bike check-in and check-out stations with joint consideration of service quality and bicycle utilization. Nickkar et al. [23] conclude that there are distinctly different patterns in bike share use on weekends and weekdays.
The digital footprint of the users has been an important data source to fill the gap between bike sharing demand and supply. In this context, some studies make use of bike share systems smart cards [30,31] to study the demand modelling travel time and trip chain by gender and day of the week. Bordagaray et al. [31] contribute to the knowledge about the behaviour of cycling in PBS systems and, in addition, provide a key instrument that is beneficial both for decision makers and for operators, that supports demand analysis for redesigning the service and optimizing it. Social media provides a publicly accessible mean of digital footprints, and current researches include the evaluation of urban transport through the analysis of social media content. Das et al. [32] examine Twitter channels to extract patterns for understanding factors that influences people towards biking. Serna, Gerrikagoitia, Bernabe, and Ruiz [33] have analyzed the bike-sharing systems in Spain through natural language processing (NLP) techniques of social media. Collins et al. [34] also have used sentiment analysis of Twitter data to evaluate transit riders’ satisfaction in the city of Chicago (USA). Rahim Taleqani, Ali, et al. [35] have examined Twitter posts to evaluate public opinion on dockless PBS systems. They use sentiment analysis to decide the polarity (positive or negative) of tweets, the tweets’ underlying issues, and their extent of commitment and influence in decision-making.
Dockless bicycle sharing systems are a current trend, and there are recently available studies that asses the promotion of bicycle use to change travel modes in metropolitan areas, and the critical factors that further that aim [36,37,38,39].
The impact of online social media together with statistical data that provide variables such as demographics and climate data (population, temperature, precipitation, number of docking stations, etc.) on the use of PBS systems has been ignored so far in the literature. This study tries to fill this gap, and contributes to a new stream of research on complementing traditional data with information extracted from online social media to explain travel behaviour and develop predictive models of travel modes’ use.

3. Research Methodology and Processes

The proposed methodology approach comprises nine main steps, in two different phases, shown in Figure 1.
First, phase 1 deals with sentiment analysis based on social media (TripAdvisor, Facebook, Twitter) and the result is the identification of the main concepts commented by users and the polarity of them. After, phase 2 creates a panel model that combines statistical data (PBS websites, Spanish bike observatory and official statistics) and sentiment analysis data provided in phase 1.

3.1. Study Area

The study area embraces public bike share systems in Spain. Data from social media, the Spanish bike share observatory, PBS websites, and Spanish official statistical have been used. Regarding social media data, the main data sources are related Twitter and Facebook pages. In addition, data from TripAdvisor has also been analyzed due to the relevant presence of related UGC. In total 12,316 comments from the three aforementioned social media networks written in different languages (English, Spanish, and Catalan) have been analyzed. The UGC data sample includes data from 2013 and 2014. The 2013–2014 timeframe has been selected because the last published PBS statistics are from that period.
In addition, Spanish bike share observatory, PBS websites, and Spanish official statistical data from 2013 to 2014 have been used to obtain the statistical model on PBS use. Regarding these data, 32 PBS systems with available data in the 2013–2014 period have been included in our investigation.

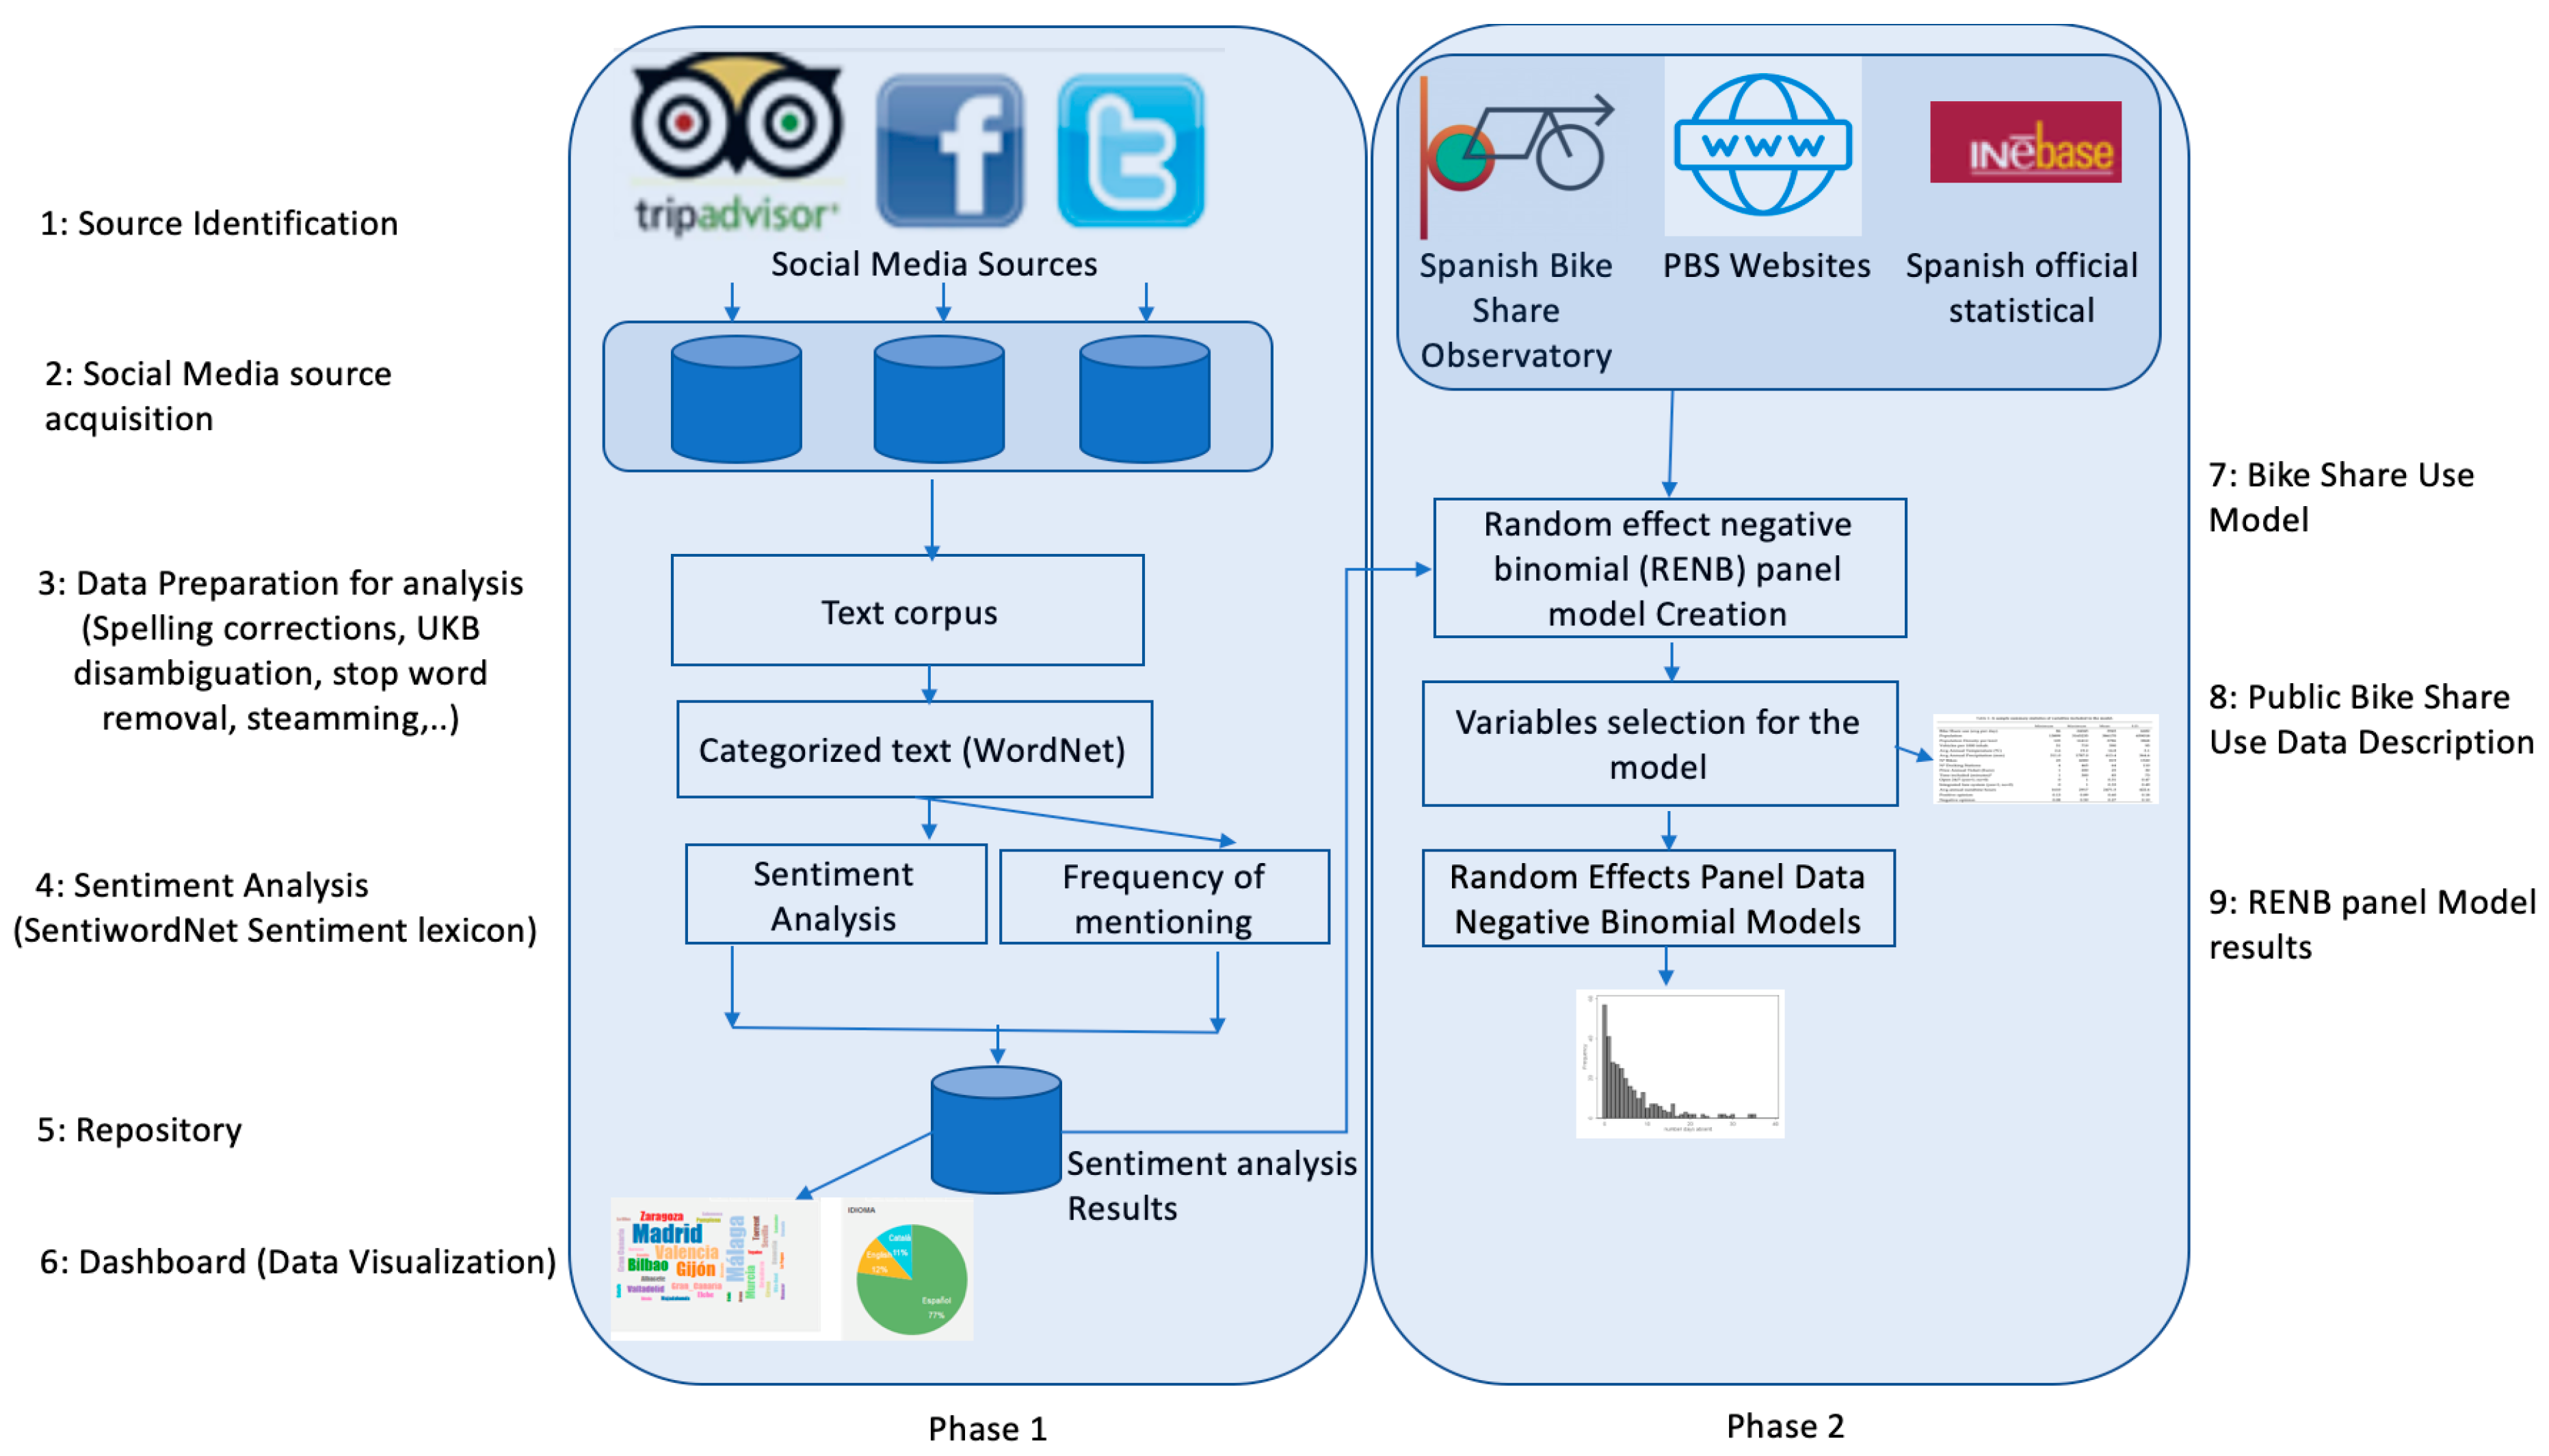
3.2. Social Media Data Analysis Methodology

Social Media analysis is done following a quantitative and qualitative approach [40]. For the reason that the aim of the use of sentiment analysis techniques is to obtain an overall impression of sensed feeling, great quantities of data were examined [41,42]. The methodology comprises six main steps.

3.3. Social Media Sentiment Analysis Process

3.3.1. Step 1: Source Identification

To achieve this phase, a semantic discovery program on the internet has been implemented to discover sources of significant data to be examined. This program is a meaning-based search engine. In this way, it can provide search outcomes based on meaning matches, rather than search terms popularity. This program has uncovered a diversity of sources of interest such as Facebook and Twitter channels, the Spanish bike share observatory, and the “Bike Sharing World map” [10], aside from specified segments of TripAdvisor with reference to the “Transportation” classification.
Considering that each online social network usually has a specific user profile, we decided to collect social media data from three different sources: Twitter, Facebook and TripAdvisor.
The characteristics of the user profile of the TripAdvisor are very different to Twitter and Facebook. TripAdvisor contains traveller experiences and it may be used for distinct motives: leisure, work, etc. Twitter and Facebook contain mainly daily user experiences and opinions about bike agencies. In this way, the probability of having biased information is lower.
Twitter: For 32 PBS systems in Spain there is a Twitter user (@) and/or a hashtag (#). For example: @albabici_es, @bicielx, @labiciofi, @AsturiesConBici, @bicing, #bicibur, #girocleta, #bicicoruna, #ambici, #getxobizi, etc. providing a way to monitor posts related to the PBS. These posts have been written in Spanish, English and Catalan.
Facebook: For 32 PBS systems in Spain, there is a Facebook page. Spanish, English, and Catalan posts of these pages have been monitored.
TripAdvisor: The compilation of information was carried out with comments that contain information about mobility in “Transport” and “Outdoor activities” sections (Spanish and English).

3.3.2. Step 2: Social Media Source Acquisition

This procedure consists in the treatment of the unstructured data, such as data collection, normalization, and cleaning. A scraper program has been developed to capture data from TripAdvisor. Data collecting from Twitter has been done by selecting bike-sharing channels using the twitter4j Java API (application programming interface). The data extraction from bike sharing in Facebook has been implemented using RestFB API, a simple and flexible Facebook Graph API client.

3.3.3. Step 3: Data Preparation for the Analysis

It consists of two distinct parts: morph syntactic and modelling analysis. The initial phase consists in loading one by one the comments to detect the language using a Shuyo language detector [43]. After that, Freeling, an Open-Source Suite of Language Analyzers [44] with the corresponding WordNet lexicons [45], and Aspell spell checker [46] are configured for these languages. In the case of Aspell, localisms and abbreviations are added. Then, the spell checker is applied to correct the texts. The normalization of the comments is a critical process, that includes the treatment of the abbreviations and as well as of emoticons. Next, ad-hoc software and the Freeling Analyzer (WordNet embedding) are applied and as a result of this process, each word is morphed syntactically noted within a transport category.

3.3.4. Step 4: Sentiment Analysis

In this step, bicycle and bike nouns are identified with their adjectives and common nouns that are classified by number of occurrences to get detailed information about them. Moreover, sentiment analysis is done using a spectrum from −1 to 1.
The polarity is calculated with the SentiWordNet [47,48] polarity lexicon. Nevertheless, in SentiWordNet the meaning of ‘synset’ is used to define a term with a particular significance and part-of-speech tagging. Subsequently, a word can have several ‘synsets’, ergo distinct meanings depending on the context, and therefore, the scores can be totally different, both positive and negative, as well as neutral. In order to select the correct ‘synset’, UKB Word Sense Disambiguation program [49], has been used. Then, a random manual analysis of 10% of the total of the comments classified as positive or negative is performed, in order to obtain a greater accuracy adapting to the domain. With these two classifications, the algorithm is trained with a supervised learning method using the previously analyzed data model.

3.3.5. Step 5: Repository

This procedure is essential for the scalable storage and management of the data. The downloaded comments are homogenized to a common structure (XML) and saved in Apache Solr search engine [50].

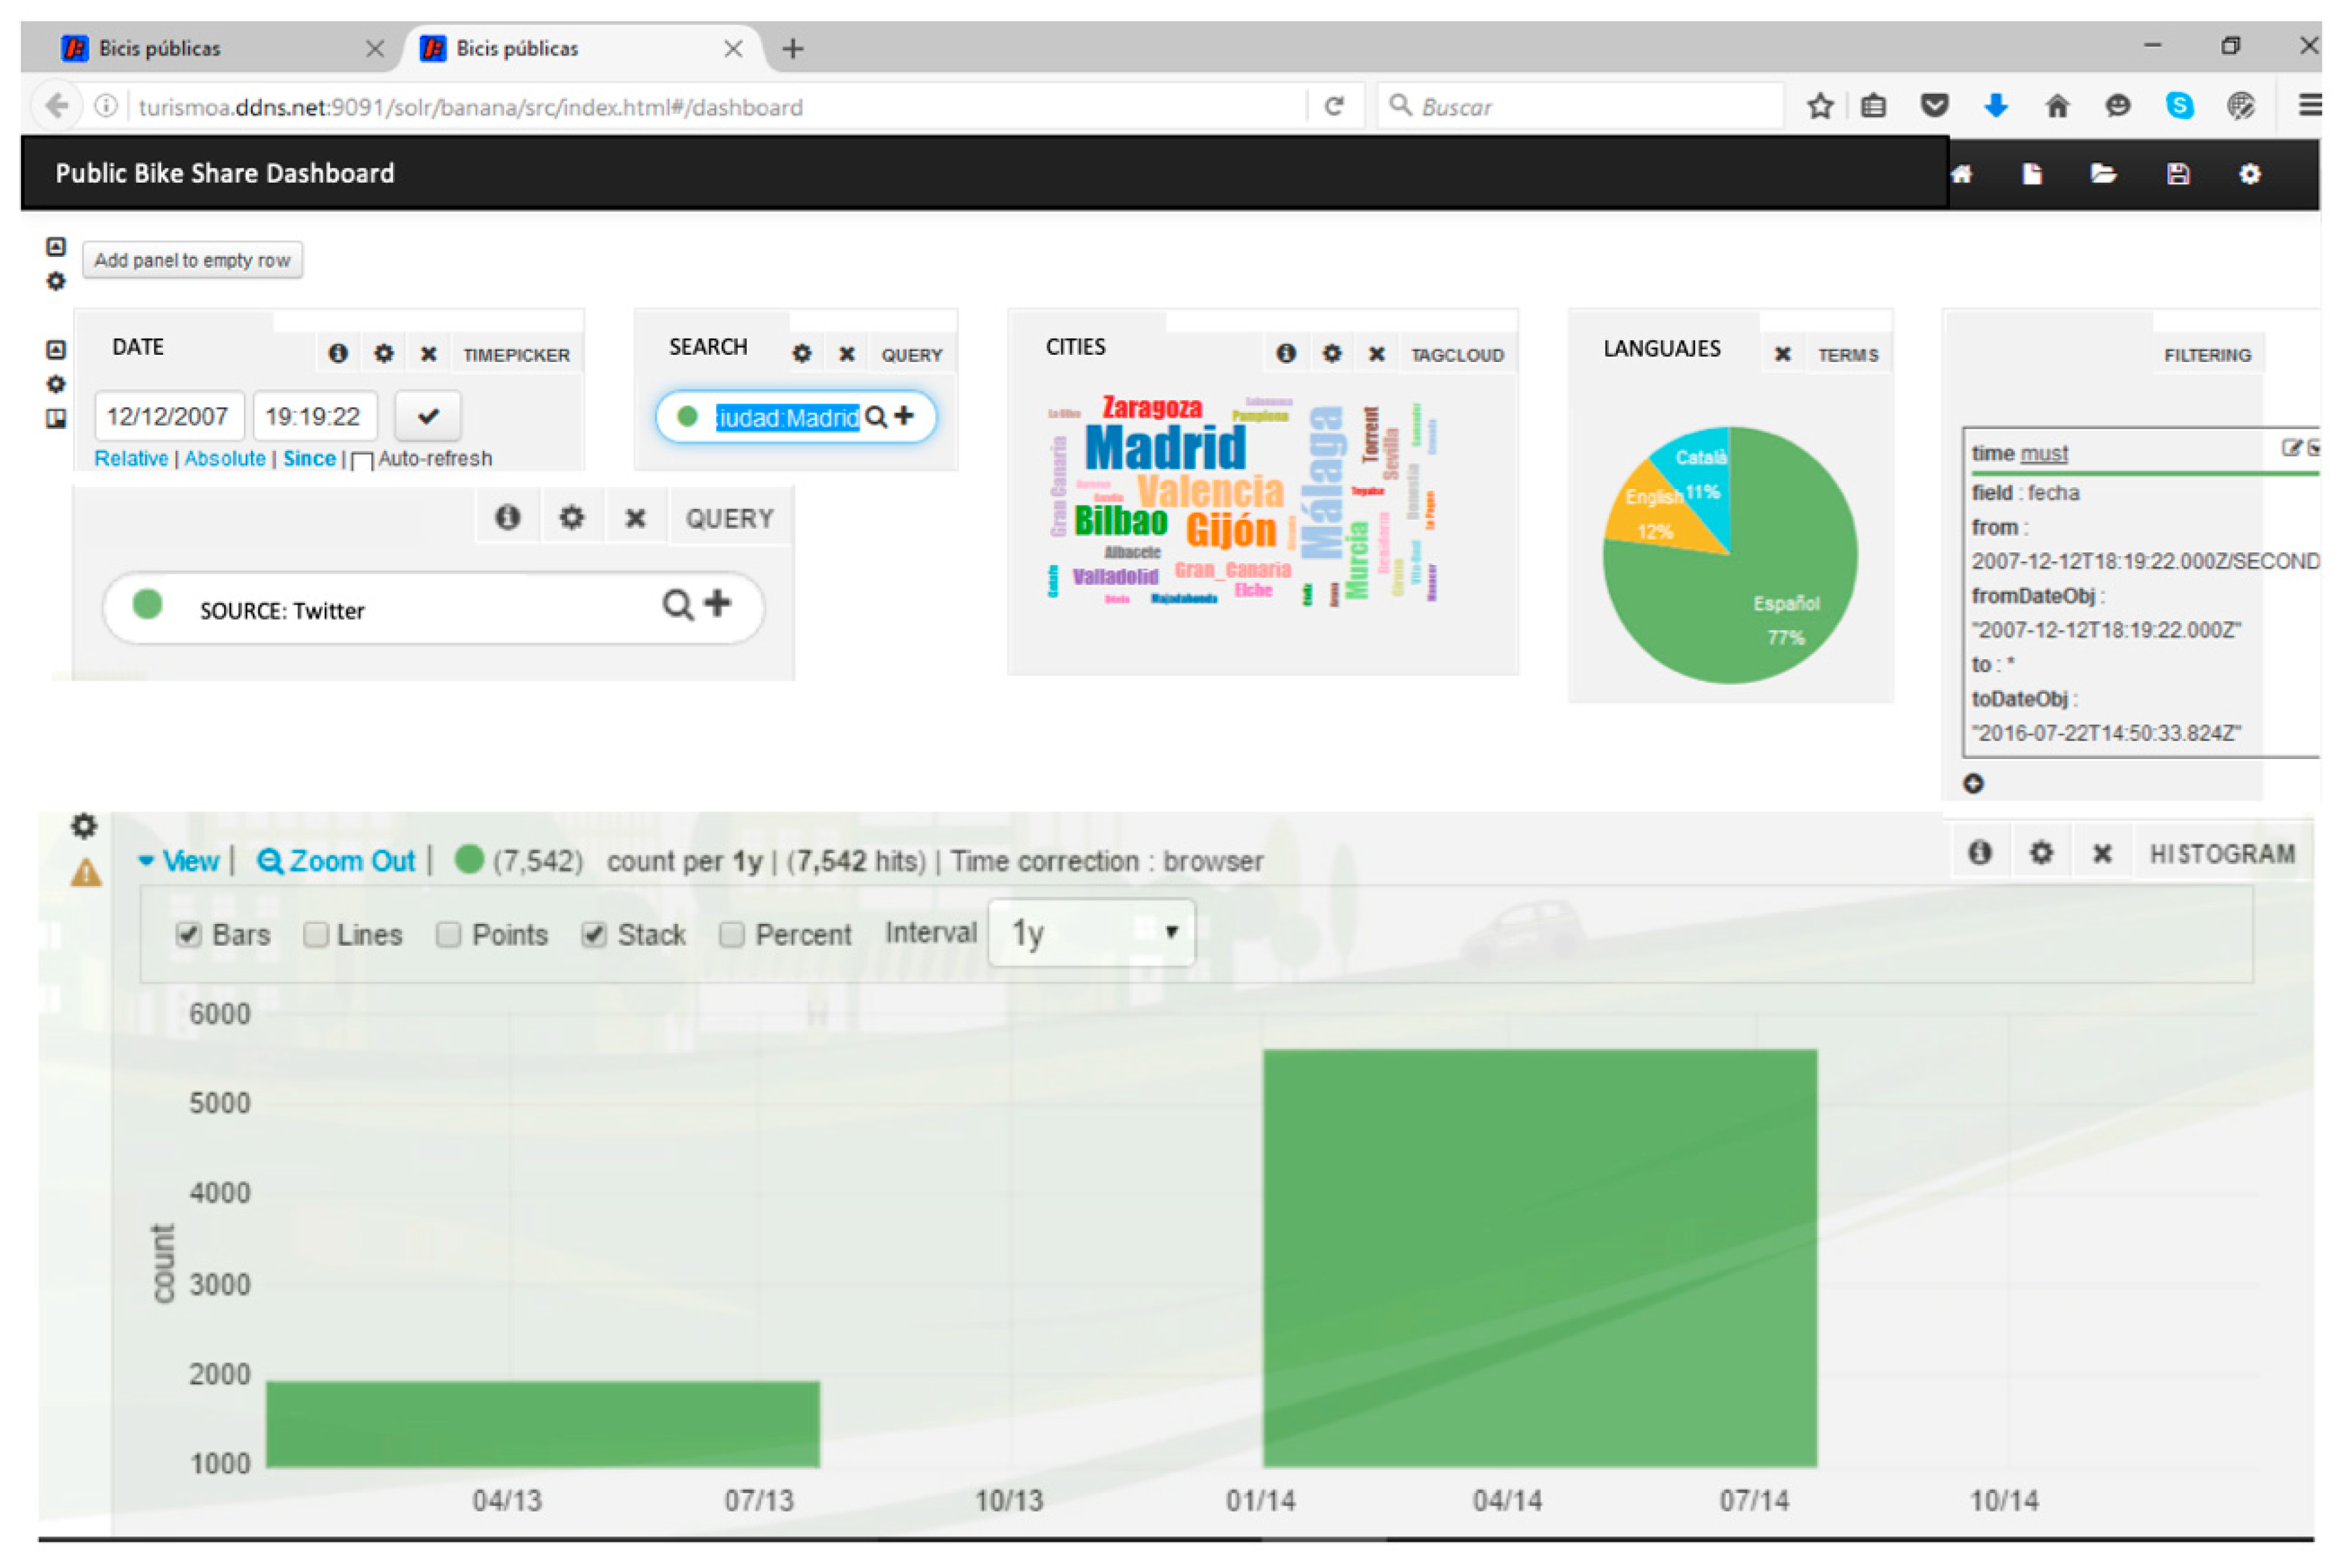
3.3.6. Step 6: Dashboard

A software platform implements the processes described in the previous steps. This platform has a visual interface (dashboard) to manage and interpret easily the results. The dashboard (shown in Figure 2) is based on Solr Apache Foundation (open source) and it has been created with a rich and flexible user interface, customizable pie charts, time series, etc. Analyzed data has been indexed to provide a high velocity query answer.

3.4. Spanish Official Statistics Data

This section utilizes the results of the sentiment analysis presented above to carry out an investigation of the features influencing bike share use. The objective is to assess the usefulness of sentiment analysis to extract information from social media data to be used as explicative variables in travel behaviour models.

3.4.1. Step 7: Bike Share Use Model

In the process of PBS use of data that are discrete and nonnegative, our approach is to model such count data supposing that the total of uses is derived from a distribution of Poisson. For a discrete random variable, Y, observed frequencies of bike share use yi, i = 1… n, where yi is a nonnegative integer count, and regressors xi (Equation (1)),
P r o b   ( Y = y i ) = e λ i ( λ i ) λ i λ i ! ,   y i = 0 ,   1 ,   ; l o g λ i = β x i
This model has a common limitation, which is that the distribution of Poisson restricts mean and variance of yi to be equal (λi). We want to prevent this restriction from being imposed a priori, so that we utilize the NB (negative binomial), which nests the Poisson distribution as a special case, and accommodate better over dispersed data. The NB model arises as a modification of the Poisson model, in which the mean is μi (Equation (2)),
log ( μ i ) = l o g λ i + ε i = β x i + ε i
where exp (εi) has a gamma distribution with mean 1.0 and variance α.
To make the most of the PBS use data available from two years, we use a RENB panel model (random effect negative binomial) [51], and the formulas are shown in Equation (3) and Equation (4):
log ( λ i t ) = α i + β x i t ,   i = 1 ,   ,   N ,   t = 1 ,   ,   T i
α i = α + ε i ,                       ε i ~ N [ 0 ,   σ 2 ]
where N represent the PBS systems, Ti are the observations in the ith bike share system (1 or 2, not for every system are data available for two years). As noted, we use the normal distribution for the random effect instead of the gamma, which is a simpler alternative.

3.4.2. Step 8: Public Bike Share Use Data Description

To develop an appropriate statistical model to examine the connection between the use of PBS and characteristics of the systems, utilizing sociodemographic and climate (see Table A2 in Appendix A) and positive and negative opinion data extracted from online social media information from 32 bike share systems in Spain were used. Daily average PBS use data from year 2013 and 2014 are available, although not for every system. Therefore, the total use data available pooling the two years are 51 cases.
For each observation, 15 possible explanatory variables were considered. PBS use data was provided by the Spanish bike share observatory. The characteristics of the systems were collected from their public websites. Demographics and climate date were collected from official statistics. Positive and negative opinion variables are the average of all factors measured by the sentiment analysis from Twitter, Facebook and TripAdvisor data in 2013 and 2014. This aggregation is needed because there are not data for all opinion variables and cities. Table 1 provides a sample summary statistics of the variables.

4. Research Results and Discussions

The outcomes of the sentiment analysis reveal that the price of the service, bike, bike stations, dockings, service, experience, maintenance and schedule are the most mentioned topics.
For each topic the good (positive) and bad (negative) attributes (P column −1 to 1) and for 32 cities, the total of mentions (# column) was estimated (see Table 2).
Sentiment analysis uncovers that the worst rated features are related to availability of stations, docks and bikes; maintenance, condition and schedule. Maintenance problems have five times as many references as the other features. Negative opinion has also been detected in relation to the service management like incidents that are not managed properly or the computer system to manage the service. The demand for overnight services is also rising.
The worst are the conservation, the quantity and disrepair of the stations and bike docks, the amount and appearance of the bicycles and the schedule.
The inadequate schedule is revealed aside from one of the principal obstacles to utilize PBS systems by certain persons. PBS managers should take this reality into account to meet the requirements of potential customers. With 8.5%, the bike station’s density is a problem for advancement. Often the impulse to extend into the area causes some installations to expand the room among stations and therefore consumers may have to abandon the bicycle excessively distant from the start location or while searching for further locations, if the bike station is complete or vacant. It is a technical problem and can consequently allow the user to become less aware of the problem. Sentiment analysis demonstrates that the amount of stations and the range of metropolitan areas are problematic.
Among positive aspects, price and biking experience are the most valued elements. There are only 14 negative experiences of a total of 845 comments. Systems that provide electric bikes such as Urbanbike and Elecmove (Bilbao, Seville respectively) have remarkable positive results.
The perspective of end users and organizations or companies can be differentiated in Facebook and Twitter and a separate analysis has been performed. Price is positively rated for both groups and it has been qualified as competitive, super promotional, interesting, incredible, very good bargain or very special for companies. For users, price is qualified as: very good price, appropriate, very good value, cheap, very good, good price, inexpensive, very permissible value, unbeatable quality/price is ideal, right, unbeatable value for money, very reasonable, recommended, reasonable, great value, perfect, great, super affordable, cheap, super, quality correct price.
The comfort of the bicycle (4.4%) and price (2.2%) seem to be a less critical issue to use the service more often. Depending on the sentiment analysis, the best-evaluated attributes include the price and cycling experience. These results confirm that cost is one of the beneficial variables leveraging PBS use.
Comments from TripAdvisor are positive mostly because the experience is generally dependent on the type of client, i.e., tourists or daily clients. Tourists comment mainly that leisure experiences are usually well organized, aided by a tourist guide and other amenities to help the customer appreciate the place. In TripAdvisor, the service’s observations are very favourable, such as: on top of the excellent service (20), professional (22), fantastic (23), perfect (27), nice (40), helpful (48), amazing service (89), excellent (112), friendly (138), good (184), great (195 mentions), and not just good on Facebook or Twitter.
In order to develop PBS systems as a popular type of transport for a broader ratio of inhabitants, the electric bike and bike paths play a key role. It is noteworthy that the electric bike experience is well rated by users, and combined with proper paths the usage of the bike will be increased as physical condition and cycling skills lose importance.

4.1. Step 9: RENB Panel Model Results

The RENB panel model was computed using the Butler and Moffitt method, with Gauss–Hermite integration. Limdep v10 [52] was used to this end.
To avoid problems of multicollinearity between variables that may bias the standard error of the coefficients and hence result in wrong signs or implausible magnitudes in the coefficients, only the most significant variables are included in the model. Table 3 shows that log-likelihood ratios increase as more explicative variables are included in the model. Similarly, information criterion AIC and AIC/N (Akaike information criterion) also decrease, which are an indicator that the model is not over fitted. The dispersion parameter alpha parameter is nearly equal to zero, although with a low significance in the final model.
In the RENB panel model, all variables considered are very meaningful. An analysis of Table 3 demonstrates that three variables have a favourable effect, while two variables have an adverse effect on bike share use. As expected, high average precipitation is associated with lower use of bike share systems. This is in line with findings by [24]. On the other hand, high average temperatures are positively related to bike share use, as also found [13]. It would also be worth emphasizing that some important explanatory variables are not an inherent feature of PBS systems (e.g. average annual, temperature) and the providers of bike share services do not have an impact on them.
The number of docking stations is also associated to a high bike share use, supporting the hypothesis that it is important to increase accessibility to the system [20]. The number of docking stations is statistically significant in the current model, which prevent any scaling problem related to the different size of the cities.
The most important finding of the model results is the significance of the variables representing positive and negative opinions of the PBS system in social media. As expected, positive opinions are related to high PBS use, and negative opinions are associated to low PBS use. The significance of the positive opinion variable is especially high (z = 22.79), which is an indicator of the importance of this variable in explaining the use of PBS systems. This reasonable result supports the hypothesis that social media can complement travel data collection and act as a reliable source of data of adequate quality for transport planners, operators and policy makers to satisfy their requirements.

5. Conclusions

This paper presents a non-traditional methodological approach that has been applied to uncover the main enablers and barriers for the adoption of PBS systems taking advantage of publicly available data sources. It has been demonstrated that sentiment analysis is a useful technique to extract information on the perceptions and attitudes of people from social media comments toward PBS systems. Moreover, the results of the sentiment analysis are complemented with demographics, climate information and the features of the PBS to elaborate a statistical model that explains PBS use. The presented data, methodology, and results are very much gaining an understanding on how the use of PBS can be optimized becoming an efficient and competitive mean of transportation.
The findings of the sentiment analysis show that the success of PBS depends on a good balance of the following five key components: station density (having more bike docks than bicycles is vital to guarantee that parking space is available for a bicycle in several places, the distance among bike stations, etc.); bicycles per person (bicycles to population radio should be large enough to satisfy demand, and take into account bicycles accessible throughout heavy demand periods); coverage area (area to easily and conveniently cycle and park); quality of bikes (conservation and appearance); simple procedures of stations (simple method to checking out, friendly payment user interface, responsive design web site, etc.).
A random effects negative binomial panel model has been used to study PBS demand in Spain. Despite of the limited sample size, it was possible to obtain a model specification in which all explicative variables are significant, and their estimated coefficients have an acceptable significance. Weather, system features, and two variables related to the outcomes of the sentiment analysis (average positive and negative valuations of each system) are statistically significant. This result emphasizes the importance of considering social media data to complement traditional data for transportation planning applications.
The research findings may be helpful for decision-making on sustainable mobility in urban transport. This research concludes that social media sentiment analysis can be applied to improve the traditional techniques, by studying travel behaviour and obtaining an overall and enhanced view of urban transport planning. Continuous information from the social media enables updating prediction models of demand and controlling the quality of PBS services. In that way, investments in PBS services might be more effective. Moreover, it is important to remark that the methodology can be applied to several travel modes beyond PBS in Spain, overcoming the shortcomings of information collection using surveys. Additionally, in real time and over long periods, information is accessible to enable dynamic analysis to be carried out.
Next, some general conclusions of the PBS systems in Spain are presented as results of analysing general parameters of this mode of transport such as evolution, number of stations, age and distribution.
Regarding the evolution, there have been 143 PBS systems from 2007 to 2019 and 79 of them are currently in operation (55%). In relation to the age of the active systems and the duration of those that closed, it has been observed that at the end of 2014 most of the PBS systems in operation were between three and eight years old (5.7 on average). The effects of the economic crisis together with the end of public programs could be the cause for the lower number of inaugurations in recent years, resulting in a shortage of “young” systems (less than three years old). In 2018, 52% of active PBS systems are eight years old or older. 49% of closed PBS systems were two years old or less. This may show a certain lack of planning or of real long-term support for the public bicycle, as it is well-known that the public bicycle is not cheap because it requires long terms for depreciation, and as every mode of transport needs time to create a stable modal change.
Since 2010 the total number of stations of all public bicycle systems has increased. Regarding the size of the systems, they have grown almost permanently, from about 5,000 bicycles and 800 stations in 2008 to about 25,000 bicycles and 2,000 stations in 2014. Although many systems closed, the survivors increased their size considerably and the new ones were much larger than those that closed. The closed systems had an average of six stations, while the still active systems have 32. Therefore, it can be said that in Spain a public bicycle overpopulated by small systems has evolved to another one represented by medium-sized ones. In 2018, a large part of the PBS systems that have been implemented had a rather small size (63% had less than 10 stations). However, only 16% of systems with less than five stations and 19% of those with five to 10 have survived. In contrast, all systems with more than 30 stations were still running.
Concerning distribution, it can be concluded that a higher percentage of PBS systems has been closed in municipalities with a smaller population than in those with a large population. Probably, the European crisis together with a lower budget of these municipalities have made the project economically unfeasible in many cases. The municipalities with between 20,000 and 50,000 inhabitants have hosted the largest number of PBS systems in Spain. However, the smaller the municipality, the lower the probability of its survival. In municipalities of less than 20,000 inhabitants about three quarters of the systems have closed. On the contrary, all the systems that have been installed in cities with more than 500,000 inhabitants still remain active. Currently, there are barely any PBS systems left in small municipalities. Possibly, it has also been influenced by the fact that public subsidies are targeting municipalities between 50,000 and 300,000 inhabitants (for example, the savings and energy efficiency subsidies of the Generalitat of Catalonia of 2010). In 2018, only 8% of the systems implemented in municipalities with between 20,000 and 50,000 inhabitants have survived, while that percentage rises to 100% in municipalities with more than 500,000 inhabitants.
Regarding limitations, the available statistical data from the public bike observatory correspond to the 2013–2014 period, so the more recent social media data has not been used to obtain the statistical model on PBS use. Nevertheless, when the limited sample provides statistically significant results, authors are positive about the extending the use cases to other PBS systems from different countries combining social media with PBS statistics.
For future work, Global map, that is a new data source that comes from the EUNOIA (Evolutive User-centric Networks for Intraurban Accessibility) project [53] will be complete the research. EUNOIA is committed to taking advantage of smart city technologies and complex system science to develop new models and tools for the design of sustainability policies for city governments and their citizens. In 2019, this data source provides online information about bike sharing in 468 cities around the world, 15 of them in Spain: Albacete, Barcelona, Bilbao, Castellón, Gandía, Gibraltar, Girona, Leon, Palma, Santander, Zaragoza, Seville, Tres Cantos, Valencia, and Valladolid. There are data about bike use by bike station and hour for the last 24 hours. This level of granularity provides data for predictive analytics and enhanced demand models.

Author Contributions

Conceptualization, A.S. and T.R.; methodology, A.S.; J.K.G, and T.R.; software, A.S.; validation, J.K.G., A.S., and T.R.; formal analysis, A.S., and T.R.; investigation, A.S, J.K.G, T.R., and R.A.; resources, T.R. and A.S.; data curation, A.S. and R.A.; writing—original draft preparation, J.K.G., A.S., T.R.; writing—review and editing, J.K.G. and A.S.; visualization, A.S.; supervision, J.K.G.

Acknowledgments

Public bicycle observatory in Spain by given support.

Conflicts of Interest

The authors declare no conflict of interest.

Appendix A

Table A1. Current State of Spain PBS Systems 2019.
Current StateCity (/[province]/), country – PBS system
In OperationA Coruña, Spain—Bicicoruña
In Planning or Under ConstructionAlbacete, Spain—Albabici
No Longer Operating—August 2019Albacete, Spain—Onroll
In OperationAlboraya, [Valencia], Spain—XufaBike
No Longer Operating—August 2019Alcala de Guadaira, Spain—Tubici
No Longer Operating—August 2019Alcázar de San Juan, Spain—Alcazar Bici
No Longer Operating—August 2019Algeciras-Cádiz, Spain—Tubici
No Longer Operating—August 2019Alhama de Murcia, Spain—Onroll
No Longer Operating—August 2019Alicante, Spain—ALABICI
No Longer Operating—August 2019Aljaraque [Huelva], Spain – Enbici
No Longer Operating—August 2019Almansa (Albacete), Spain—BiciAlmansa
No Longer Operating—August 2019Almendralejo (Badajoz), Spain—Almendralejo en Bici
No Longer Operating—August 2019Almeria (Universidad), Spain—Tubici
In OperationAltea, Spain—biciAltea
No Longer Operating—August 2019Amorebieta (Vizcaya), Spain—Amorebiziz
No Longer Operating—August 2019Antequera, Spain -ENbici
In OperationAranda de Duero, Spain—Aranbici
In OperationAranjuez, Spain – Aranbike
No Longer Operating—August 2019Armilla, Spain – Tubici
In OperationAvilés y Castrillón, Spain—enbici
No Longer Operating—August 2019Azuqueca de Henares (Guadalajara), Spain—Biciudad
In OperationBadajoz, Spain—BiBi Bicicletas Públicas de Badajoz
No Longer Operating—August 2019Baeza, Spain—ENbici
No Longer Operating—August 2019Barcelona, Catalonia, Spain—Vodafone-Bicing- 1
In OperationBarcelona, Catalonia, Spain—Bicing-2
In OperationBarcelona, (Scoot) Catalonia, Spain—Scoot
In OperationBarcelona, Catalonia, Spain—Donkey Republic
In OperationBenidorm, Finestrat, La Nucia, Villajoyosa and Alfas del Pi, Spain—Bicidorm
No Longer Operating—August 2019Bilboa, Spain—Bilbon Bizi
In OperationBilboa, Spain—Bilboabizi
In OperationBurgos, Spain—BiciBur
In OperationBurjassot [Valencia], Spain—Burjabike
No Longer Operating—August 2019Cáceres, Spain—Bicci
No Longer Operating—August 2019Cádiz (Universidad), Spain—Tubici
No Longer Operating—August 2019Cartagena, Spain—Bicity
In OperationCastellón, Spain—bici-CAS
In OperationCatarroja, Spain—Cataroda
No Longer Operating—August 2019Ceutí, Spain
In OperationChipiona (Cádiz), Spain—Enbici
No Longer Operating—August 2019Ciudad Real, Spain
In OperationCórdoba, Spain—Eco-bici Ciclocity
In OperationCórdoba (Universidad), Spain—Enbici
No Longer Operating—August 2019Cuenca, Spain—Tubici Cuenca
In OperationCullera, (Bee) Spain—Bee
In OperationCulleredo (La Coruña), Spain—Culleredo en Bici
No Longer Operating—August 2019Denia, Spain—DeniBici
No Longer Operating—August 2019Don Benito—Villanueva la Serena, Spain—Biciudad
No Longer Operating—August 2019Dos Hermanas, Spain—TUBICI Dos Hermanas
No Longer Operating—August 2019El Campello, Spain—Onroll
In OperationElche, Spain—bicielx
In OperationFerrol, Spain
In OperationGandia, Spain—Saforbici
In OperationGetafe, Spain—Gbici
In OperationGetxo, Spain—Aparka
In OperationGijón, Spain—Gijón-Bike
In OperationGirona, Spain—Girocleta
In OperationGodella, Spain—Gobici
In OperationGranada (obike) Spain—obike
In OperationGranada (ofo) Spain—ofo
No Longer Operating—August 2019Granollers, Spain—Ambicia’t
No Longer Operating—August 2019Guadalajara, Spain—Aquilar de Bicicletas
In OperationHospitalet de Llobregat, Catalonia, Spain—e-BiciBox
In OperationHospitalet de Llobregat, (Mobike) Catalonia, Spain—Mobike
No Longer Operating—August 2019Huelva (Universidad), Spain—Tubici
No Longer Operating—August 2019Jerez de la Frontera, Spain
In OperationL’Horta Sud—Alaquàs, Xirivella, Quart de Poblet y Aldaia [Valencia], Spain—Hortasudenbici
In OperationLalín, Spain—Bicidadáns
No Longer Operating—August 2019Las Palmas de Gran Canaria, Spain—ByBikeLPA
In OperationLas Palmas de Gran Canaria, Spain—Sitycleta
In OperationLeganés, Spain enBici
In OperationLeioa, Spain—BiziLeioaBiziz
In OperationLeón, Spain—Bicileon
In OperationLogroño, Spain- LogoBici
In OperationLos Alcázares, Spain
In OperationMadrid, Spain—BiciMAD
In OperationMadrid (Mobike) Spain—Mobike
In OperationMajadahonda, Spain—Majadahonda En Bici
No Longer Operating—August 2019Málaga, (ofo) Spain—ofo
No Longer Operating—August 2019Málaga, Spain—SmartBike
No Longer Operating—August 2019Málaga (Universidad), Spain—Tubici
In OperationMálaga, Spain—málagabici
In OperationMálaga (PTA), Spain—Enbici
No Longer Operating—August 2019Maracena (Granada), Spain—Enbici -
In OperationMarbella (ofo) Spain—ofo
No Longer Operating—August 2019Mérida (Badajoz), Spain—Bicimerida
No Longer Operating—August 2019Miranda de Ebro, Spain—Biciudad
In OperationMislata, [Valencia], Spain—bici M
No Longer Operating—August 2019Moncada, Spain—Moncabici
No Longer Operating—August 2019Montilla, Spain—ENbici
No Longer Operating—August 2019Mula, Spain—Mula Public Bicycle Service
In OperationMurcia, Spain—MUyBICI
In OperationNarón, Spain—Naronroda
No Longer Operating—August 2019Novelda, Spain—Bicicletas Novelda
In OperationO Barco de Valdeorras, Spain—Bici Barco
In OperationOurense, Spain - Rodalimpo
In OperationPaiporta, Spain—bikeporta
No Longer Operating—August 2019Palencia, Spain—OnRoll Palencia
In OperationPalma, Spain—BiciPalma
No Longer Operating—August 2019Palma del Río -Córdoba-, Spain—Enbici
In OperationPamplona, Spain—nbici
In OperationPaterna [Valencia], Spain—Bicipaterna
No Longer Operating—August 2019Pinto, Spain—Bicipinto
No Longer Operating—August 2019Plasencia, Spain- Biciplas
In OperationPonferrada, Spain—Ponfe MOBI Labici
No Longer Operating—August 2019Pontevedra, Spain—PontenBici
No Longer Operating—August 2019Puertollano, Spain—OnRoll Puertollano
No Longer Operating—August 2019Redondela, Spain
In OperationRivas-Vaciamadrid, Spain—Bicinrivas
In OperationRonda -Málaga-, Spain—Enbici
In OperationSalamanca, Spain—Salenbici
No Longer Operating—August 2019San Andrés del Rabanedo, Spain—Te presta la Bici
No Longer Operating—August 2019San Javier, Spain -
No Longer Operating—August 2019San Pedro del Pinatar, Spain—BiCity
In OperationSan Sebastián, Spain—dBizi
In Planning or Under ConstructionSanta Cruz de Tenerife, Spain -
In OperationSantander, Spain—TusBic
No Longer Operating—August 2019Sant Andreu de la Barca, Spain—BiciSAB
No Longer Operating—August 2019Sant Joan d’Alcant, Spain—Visc amb Bici
In OperationSan Vicente del Raspeig, Spain—BiciSanVi
In OperationSegovia, Spain—Onroll Segovia
In OperationSevilla, Spain—Sevici
No Longer Operating—August 2019Soria, Spain, Bici
No Longer Operating—August 2019Talavera de la Reina, Spain—Talavera en Bici
No Longer Operating—August 2019Torrelavega, Spain
In OperationTorrent [Valencia], Spain—Torrentbici
No Longer Operating—August 2019Totana, Spain—Bicito
In OperationTres Cantos, Spain—3cbike
No Longer Operating—August 2019Valdepeñas -Ciudad Real-, Spain—Valdebici
In OperationValencia, Spain—Valenbisi
In OperationValladolid, Spain—Vallabici
No Longer Operating—August 2019Vélez- Málaga (Málaga), Spain—Enbici
In OperationVilagarcía de Arousa, Spain—Vaibike
In OperationVillaquilambre -León-, Spain—Biciquilambre
In OperationVillaquilambre, Spain—OnRoll Villaquilambre
In OperationVillareal, Spain—Onroll
In OperationVillareal, Castellón, Spain—Bicivilat
In OperationVinaròs, Spain—Ambicia’t Vinaròs
No Longer Operating—August 2019Vitoria-Gasteiz, Spain—Servicio Municipal de Préstamo de Bicicletas
In OperationVitoria-Gasteiz, Spain—Bizileku
In OperationZamora, Spain
In OperationZaragoza, Spain- Bizi
In OperationZaragoza, (Mobike) Spain—Mobike
No Longer Operating—August 2019Zumaia, Spain- Mugi
Table A2. PBS Systems Characteristics, Demographic and population, Weather Data 2014.
CityRotation (loans/bike per day)Intensity (loans/station per day)Impact (loans/1,000 inhabitants per day)N° BikesN° Docking StationsPrice Annual Ticket (€)Time included (minutes)Open 24/7 (yes=1/no=00)PopulationPopulation density (inhab./km2)Vehicles per 1000 inhab.Avg. annual temperature (°C)Avg. annual Precipitation (mm)Avg. Annual Sunshine hours
Albacete1922.2311,917.8113981242135300172,487153.20614.9714.33532787
………….….….….
Barcelona6095.43NANA600046547.163001,602,38616,315.91573.7216.15882506
Bilbao4023.4232,187.382278-9992520600346,5748389.59515.3814.711341610
Donostia-S. Sebastián2774.0921,672.6018691251645200186,1263056.76607.6013.515071816
Elche/Elx3029.4526,374.0538853003436.3300228,647701.22629.6618.33112851
Madrid*3383.4342,911.771613202816525113,165,2355225.14597.98154212838
Málaga3349.3263,796.4823574002325300566,9131434.75639.3018.55342905
Ourense72.281489.0413739105.33000106,9051264.40651.9114.98112054
….….
Salamanca389.654174.82568-9992926600148,0423763.14532.2812.23722667
Santander503.965928.935552001729.2601175,7365055.70626.9714.511291649
Segovia74.351812.20260501520-999053,260325.57652.6512.44792601
Tres Cantos584.535427.789236573630042,5461121.70605.23154212917
Valencia6324.8863,248.8221,493275027629.21301786,4245753.76616.1118.34752838
Valladolid2133.8817,897.0417582603025300306,8301554.59558.3712.74332696
Vila-Real97.451705.3626636810120150,755920.81650.6617.54672624
Zaragoza6042.9760,429.6711,636-99913036.93300666,058683.99509.4315.5322275

References

  1. Flash Eurobarometer. Attitudes on Issues Related to EU Transport Policy. 2007. Available online: http://ec.europa.eu/public_opinion/flash/fl_206b_en.pdf. (accessed on 3 January 2019).
  2. European Commission—Mobility and Transport. Available online: https://ec.europa.eu/transport/themes/sustainable_en (accessed on 12 September 2019).
  3. Red de Ciudades Por la Bicicleta. Available online: https://thedailyprosper.com/banca-sociedad/transporte-sostenible-las-bicicletas-son-para-el-verano/ (accessed on 12 September 2019).
  4. DeMaio, P. Bike-sharing: History, impacts, models of provision, and future. J. Public Transp. 2009, 12, 3. [Google Scholar] [CrossRef]
  5. Contardo, C.; Morency, C.; Rousseau, L.M. Balancing a Dynamic Public Bike-Sharing System; Cirrelt: Montreal, QC, Canada, 2012. [Google Scholar]
  6. Le Quéré, C.; Andrew, R.M.; Friedlingstein, P.; Sitch, S.; Hauck, J.; Pongratz, J.; Pickers, P.A.; Korsbakken, J.I.; Peters, G.P.; Canadell, J.G.; et al. Global Carbon Budget 2018. Earth Syst. Sci. Data 2018, 10, 2141–2194. [Google Scholar] [CrossRef] [Green Version]
  7. Liu, B. Sentiment analysis and opinion mining. Synth. Lect. Hum. Lang. Technol. 2012, 5, 1–167. [Google Scholar] [CrossRef]
  8. Shaheen, S.A.; Guzman, S.; Zhang, H. Bikesharing in Europe, the Americas, and Asia: Past, present, and future. Transp. Res. Rec. 2010, 2143, 159–167. [Google Scholar] [CrossRef]
  9. The Bike-Sharing Blog. Available online: http://bike-sharing.blogspot.com/2017/01/the-bike-sharing-world-at-end-of-2016.html. (accessed on 3 January 2019).
  10. The Bike-Sharing World Map. Available online: http://www.bikesharemap.com. (accessed on 3 January 2019).
  11. Fishman, E.; Washington, S.; Haworth, N. Barriers and facilitators to public bicycle scheme use: A qualitative approach. Tansp. Res. Part F 2012, 15, 686–698. [Google Scholar] [CrossRef] [Green Version]
  12. Buck, D.; Buehler, R.; Happ, P.; Rawls, B.; Chung, P.; Borecki, N. Are bikeshare users different from regular cyclists? A first look at short-term users, annual members, and area cyclists in the Washington, DC, region. Transp. Res. Rec. 2013, 2387, 112–119. [Google Scholar] [CrossRef]
  13. El-Assi, W.; Mahmoud, M.S.; Habib, K.N. Effects of built environment and weather on bike sharing demand: A station level analysis of commercial bike sharing in Toronto. Transportation 2017, 44, 589–613. [Google Scholar] [CrossRef]
  14. Te Pai, J.; Pai, S.Y. User behaviour analysis of the public bike system in Taipei. Int. Rev. Spat. Plan. Sustain. Dev. 2015, 3, 39–52. [Google Scholar] [CrossRef]
  15. Bachand-Marleau, J.; Lee, B.H.; El-Geneidy, A.M. Better understanding of factors influencing likelihood of using shared bicycle systems and frequency of use. Transp. Res. Rec. 2012, 2314, 66–71. [Google Scholar] [CrossRef]
  16. Fishman, E. Bikeshare: A review of recent literature. Transp. Rev. 2016, 36, 92–113. [Google Scholar] [CrossRef]
  17. Daddio, D.W.; Mcdonald, N. Maximizing Bicycle Sharing: An Empirical Analysis of Capital Bikeshare Usage; University of North Carolina at Chapel Hill: Chapel Hill, NC, USA, 2012; Volume 8. [Google Scholar]
  18. Nair, R.; Miller-Hooks, E.; Hampshire, R.C.; Bušić, A. Large-scale vehicle sharing systems: Analysis of Vélib’. Int. J. Sustain. Transp. 2013, 7, 85–106. [Google Scholar] [CrossRef]
  19. Rixey, R.A. Station-level forecasting of bikesharing ridership: Station network effects in three US systems. Transp. Res. Rec. 2013, 2387, 46–55. [Google Scholar] [CrossRef]
  20. Faghih-Imani, A.; Eluru, N.; El-Geneidy, A.M.; Rabbat, M.; Haq, U. How land-use and urban form impact bicycle flows: Evidence from the bicycle-sharing system (BIXI) in Montreal. J. Transp. Geogr. 2014, 41, 306–314. [Google Scholar] [CrossRef]
  21. Bhuyan, I.A.; Chavis, C.; Nickkar, A.; Barnes, P. GIS-Based Equity Gap Analysis: Case Study of Baltimore Bike Share Program. Urban Sci. 2019, 3, 42. [Google Scholar] [CrossRef]
  22. Buck, D.; Buehler, R. Bike lanes and other determinants of capital bikeshare trips. In Proceedings of the 91st Transportation Research Board Annual Meeting, Washington, DC, USA, 22–26 January 2012. [Google Scholar]
  23. Hampshire, R.C.; Marla, L. An analysis of bike sharing usage: Explaining trip generation and attraction from observed demand. In Proceedings of the 91st Annual Meeting of the Transportation Research Board, Washington, DC, USA, 22–26 January 2012. [Google Scholar]
  24. Nickkar, A.; Banerjee, S.; Chavis, C.; Bhuyan, I.A.; Barnes, P. A spatial-temporal gender and land use analysis of bikeshare ridership: The case study of Baltimore City. City Cult. Soc. 2019, 18, 100291. [Google Scholar] [CrossRef]
  25. Gebhart, K.; Noland, R.B. The impact of weather conditions on capital bikeshare trips. Transportation 2014, 41, 1205–1225. [Google Scholar] [CrossRef]
  26. Yang, Z.; Hu, J.; Shu, Y.; Cheng, P.; Chen, J.; Moscibroda, T. Mobility modeling and prediction in bike-sharing systems. In Proceedings of the 14th Annual International Conference on Mobile Systems, Applications, and Services, Singapore, 26–30 June 2016; pp. 165–178. [Google Scholar]
  27. Lin, L.; He, Z.; Peeta, S. Predicting station-level hourly demand in a large-scale bike-sharing network: A graph convolutional neural network approach. Int. J. Transp. Res. Part C 2018, 97, 258–276. [Google Scholar] [CrossRef] [Green Version]
  28. Li, Y.; Zheng, Y.; Yang, Q. Dynamic bike reposition: A spatio-temporal reinforcement learning approach. In Proceedings of the 24th ACM SIGKDD International Conference on Knowledge Discovery & Data Mining, London, UK, 19–23 August 2018; pp. 1724–1733. [Google Scholar]
  29. Hu, J.; Yang, Z.; Shu, Y.; Cheng, P.; Chen, J. Data-Driven utilization-aware trip advisor for bike-sharing systems. In Proceedings of the 2017 IEEE International Conference on Data Mining (ICDM), New Orleans, LA, USA, 18–21 November 2017; pp. 167–176. [Google Scholar]
  30. Zhao, J.; Wang, J.; Deng, W. Exploring bikesharing travel time and trip chain by gender and day of the week. Int. J. Transp. Res. Part C 2015, 58, 251–264. [Google Scholar] [CrossRef]
  31. Bordagaray, M.; dell’Olio, L.; Fonzone, A.; Ibeas, Á. Capturing the conditions that introduce systematic variation in bike-sharing travel behavior using data mining techniques. Int. J. Transp. Res. Part C 2016, 71, 231–248. [Google Scholar] [CrossRef]
  32. Das, S.; Dutta, A.; Medina, G.; Minjares-Kyle, L.; Elgart, Z. Extracting patterns from Twitter to promote biking. IATSS Res. 2019, 43, 51–59. [Google Scholar] [CrossRef]
  33. Serna, A.; Gerrikagoitia, J.K.; Bernabe, U.; Ruiz, T. A method to assess sustainable mobility for sustainable tourism: The case of the public bike systems. In Information and Communication Technologies in Tourism 2017; Springer: Cham, Switzerland, 2017; pp. 727–739. [Google Scholar]
  34. Collins, C.; Hasan, S.; Ukkusuri, S.V. A novel transit rider satisfaction metric: Rider sentiments measured from online Social Media data. Int. J. Public Transp. 2013, 16, 2. [Google Scholar] [CrossRef]
  35. Rahim Taleqani, A.; Hough, J.; Nygard, K.E. Public Opinion on Dockless Bike Sharing: A Machine Learning Approach. Transp. Res. Rec. 2019, 2673, 195–204. [Google Scholar] [CrossRef]
  36. Jia, Y.; Ding, D.; Gebel, K.; Chen, L.; Zhang, S.; Ma, Z.; Fu, H. Effects of new dock-less bicycle-sharing programs on cycling: A retrospective study in Shanghai. BMJ Open 2019, 9, e024280. [Google Scholar] [CrossRef]
  37. Shi, J.G.; Si, H.; Wu, G.; Su, Y.; Lan, J. Critical factors to achieve dockless bike-sharing sustainability in China: A stakeholder-oriented network perspective. Sustainability 2018, 10, 2090. [Google Scholar] [CrossRef]
  38. Pan, L.; Cai, Q.; Fang, Z.; Tang, P.; Huang, L. A Deep Reinforcement Learning Framework for Rebalancing Dockless Bike Sharing Systems. In Proceedings of the AAAI Conference on Artificial Intelligence, Honolulu, HI, USA, 27 January–1 February 2019; pp. 1393–1400. [Google Scholar]
  39. Liu, Z.; Shen, Y.; Zhu, Y. Inferring dockless shared bike distribution in new cities. In Proceedings of the Eleventh ACM International Conference on Web Search and Data Mining, ACM, Los Angeles, CA, USA, 5–9 February 2018; pp. 378–386. [Google Scholar]
  40. Walle, A.H. Quantitative versus qualitative tourism research. Ann. Tour. Res. 1997, 24, 524–536. [Google Scholar] [CrossRef]
  41. Serna, A.; Marchiori, E.; Gerrikagoitia, J.K.; Alzua-Sorzabal, A.; Cantoni, L. An Auto-coding Process for Testing the Cognitive-affective and Conative Model of Destination Image. In Information and Communication Technologies in Tourism; Tussyadiah, I., Inversin, A., Eds.; Springer: Cham, Switzerland, 2015; pp. 111–123. [Google Scholar]
  42. Serna, A.; Gerrikagoitia, J.K.; Alzua, A. Towards a Better Understanding of the Cognitive Destination Image of Euskadi-basque Country Based on the Analysis of UGC. In Information and Communication Technologies in Tourism; Xiang, Z., Tussyadiah, I., Eds.; Springer: Cham, Switzerland, 2014; pp. 395–407. [Google Scholar]
  43. Shuyo, N. Language Detection Library for Java. 2010. Available online: https://github.com/shuyo/language-detection/ (accessed on 7 January 2019).
  44. Padró, L.; Stanilovsky, E. Freeling 3.0: Towards Wider Multilinguality. In Proceedings of the Eight International Conference on Language Resources and Evaluation (LREC’12), Istanbul, Turkey, 21–27 May 2012. [Google Scholar]
  45. Miller, G.A. WordNet: A Lexical Database for English. Commun. ACM 1995, 38, 39–41. [Google Scholar] [CrossRef]
  46. Atkinson, K. GNU Aspell. 2003. Available online: http://aspell.sourceforge.net/ (accessed on 7 January 2019).
  47. Baccianella, S.; Esuli, A.; Sebastiani, F. SentiWordNet 3.0: An enhanced lexical resource for sentiment analysis and opinion mining. LREC 2010, 10, 2200–2204. [Google Scholar]
  48. Esuli, A.; Sebastiani, F. Sentiwordnet: A publicly available lexical resource for opinion mining. LREC 2006, 6, 417–422. [Google Scholar]
  49. Agirre, E.; Soroa, A. Personalizing pagerank for word sense disambiguation. In Proceedings of the 12th Conference of the European Chapter of the Association for Computational Linguistics, Athens, Greece, 30 March–3 April 2009; pp. 33–41. [Google Scholar]
  50. Smiley, D.; Pugh, D.E. Apache Solr 3 Enterprise Search Server; Packt Publishing Ltd.: Birmingham, UK, 2011. [Google Scholar]
  51. Greene, W.H. Econometric Analysis; Pearson: New York, NY, USA, 2012. [Google Scholar]
  52. Greene, W.H. Limdep Version 10. Econometric Modeling Guide; Econometric Software, Inc.: New York, NY, USA, 2015. [Google Scholar]
  53. Eunoia Evolutive User-Centric Networks for Intraurban Accessibility. Available online: http://eunoia-project.eu. (accessed on 16 March 2019).
Figure 1. Research methodology and general process.
Sustainability 11 06259 g001
Figure 2. Public bike share dashboard.
Sustainability 11 06259 g002
Table 1. A sample summary statistics of variables included in the model.
VariableMinimumMaximumMeanS.D.
Bike share use (avg. per day)862404539456682
Population 138993165235386170659018
Population density per km21051641237863868
Vehicles per 1000 inhab.5171959095
Average annual temperature (°C)2.619.214.83.1
Average annual precipitation (mm)311.01787.0613.4364.6
N° bikes2560008191520
N° docking Stations446564110
Price annual ticket (Euro)12002530
Time included (minutes) *13008573
Open 24/7 (yes=1; no=0)010.310.47
Integrated fare system (yes=1; no=0)010.330.49
Average annual sunshine hours161029172471.5422.6
Positive opinion0.130.890.600.18
Negative opinion0.080.500.270.10
*: The time that bikes can be used free of charge.
Table 2. Sentiment Analysis results in 2014.
No.CityPriceExperienceIncidenceMaintenanceStationsBikesSchedule
P#P#P#P#P#P#P#
1AlbaceteNANANANA−0.4512−0.67−0.231−0.2758−0.3310
2Benidorm0.72800.66155NANANANA−0.35−0.29800−0.13
3Bilbao040.329NANANANANANA−0.4691NANA
4Castejón de Sos0.61280.7107−0.396110.3839−0.20444−0.3114
5Dénia0.9680.7115411NANA−0.26−0.20615−0.205
6Donostia110.94−0.328−0.67−0.22411−0.339
7Elche0.8180.7469NANA−0.845NANA−0.36118−0.15
8La Oliva0.3140.6694NANA11NANA−0.39311−0.35
9Madrid0.72410.75176NANANANANANA−0.32958−0.15
10Majadahonda0.6720.961−0.16−0.6340.474−0.481801
11Málaga0.6870.167−0.87NANANANA−0.48327NANA
12MéridaNANA0.832NANANANANANA−0.511NANA
13Murcia0.6940.6612NANANANANANA−0.5135NANA
14Navarrete0.71910.7594−0.2631−0.781−0.5232−0.54806−0.204
15Ourense0.86140.72204NANANANA−0.358−0.56316NANA
16Pte. San Miguel0.8550.84108NANANANANANA−0.67189NANA
30Valencia0.9270.879NANANANANANA−0.2830NANA
31ValladolidNANA0.610−0.5227−0.884NANA−0.27111−0.254
32Zaragoza0.65820.8260−0.48129−0.878−0.2711−0.161256−0.4622
Table 3. Random effect negative binomial (RENB) panel data models.
Model #1Model #2Model #3
VariableMean S.D.zMean S.D.zMean S.D.z
Average rainfall −0.001360.00013−10.89−0.000730.00014−5.21
Average temperature 0.005370.0001927.810.393740.0068157.83
N° docking stations0.463610.00173268.470.399450.0069557.480.006140.0001251.74
Positive opinion 2.61750.2391110.953.254840.1428222.79
Negative opinion −2.745610.47799−5.74
Alpha0.014810.004663.180.004620.00182.570.004730.003011.57
Sigma1.505990.0312848.150.905920.033427.130.855950.0266332.14
N =51 51 51
Log likelihood =−320.7648 −216.9671 −202.9071
Inf.Cr.AIC =647.5 445.9 419.8
AIC/N = 12.697 8.744 8.232

