Article

Bridging the Gap in the Technology Commercialization Process: Using a Three-Stage Technology–Product–Market Model

Department of Management of Technology, School of Business, Konkuk University, 05029 Seoul, Korea
*
Author to whom correspondence should be addressed.
Sustainability 2019, 11(22), 6267; https://doi.org/10.3390/su11226267
Submission received: 25 September 2019 / Revised: 5 November 2019 / Accepted: 6 November 2019 / Published: 8 November 2019
(This article belongs to the Special Issue Sustainability in 2nd IT Revolution with Dynamic Open Innovation)

Abstract

:
This study proposes a new “three-stage technology–product–market” model to analyze the technology commercialization process. This model revises the technology acceptance model to more accurately consider the market potential of new technologies from a consumer perspective. This approach can be used to supplement developers’ own evaluations of technology. To test the model empirically, an online survey of 350 end users was conducted regarding their intention to purchase the “Wireless USB,” which uses “Zing” technology and was developed by the Electronics and Telecommunications Research Institute. The data was used to test the model using a structural equations approach. We indirectly confirmed the existence of gaps in the technology commercialization process by verifying the mediating effects of the productization stage. Results suggest that end users may not purchase a product, even if they perceive the technology to be innovative; the product purchase intention is significantly influenced by its perceived value. Therefore, developers must understand the concept of technology value for productization in order to refine a technology according to market demand.

1. Introduction

Rapid changes in the business environment, such as the diversification of information and knowledge sources and technology convergence, have highlighted the limitations of the existing closed innovation paradigm. In order to secure and sustain business competitiveness, there is a need to shift to an open innovation paradigm. Open innovation is a paradigm that enables partnerships for sharing ideas, technologies, and resources that thereby generates capabilities that the firm could not develop internally. The partnerships are likely to be forged with suppliers, consumers, universities, experts in a specific field, research institutions, and even with competitors. Technology innovation based on cooperation with partners such as these is emerging as a key factor in promoting a virtuous cycle of national economic growth, as well as in creating firm growth and positive economic performance [1,2]. Therefore, the most technologically advanced countries are accelerating investment in research and development (R&D) by supporting technology innovation activities of this nature.
Broadly speaking, R&D activities include the basic research and applied research to commercialize a new technology, such as a patent, research paper, etc. While technology innovation through R&D is a key factor in economic growth, in order to actually create value, inventions must be successfully transferred to the market [3].
However, technology commercialization is a difficult process that must include the technology’s market valuation. According to Lee et al. [4], the Korean government’s R&D investment has generated a 96% success rate for technology development, but has succeeded in the commercialization for only 47.2% of the technologies that were developed. As suggested by these statistics, the critical problem of technology commercialization is that newly developed technology does not necessarily create economic performance since not every technology developed through R&D actually achieves market success or generates profits [3,5,6].
Previous literature on technology commercialization has highlighted a phenomenon called the “valley of death.” In this context, the valley of death refers to the disconnection between the R&D and commercialization stages of the technology commercialization process. It is caused by a lack of financial resources or by R&D being excessively technology-oriented rather than market-oriented. Financial problems might originate from the fact that investors in the R&D stage are primarily focused on funding the creation of new technology and not on supporting later product development stages [7]. More specifically, since technology-oriented R&D creates the potential for technology development to be misaligned away from market needs, even if the developed technology successfully penetrates the market, it will likely fall into the valley of death. Many technology developers focus on developing basic research and raw technology, rather than empathizing with customers’ needs, and they are often not deeply concerned with product-market penetration [8]. Furthermore, researchers are often not required to consider the elements of uncertainties regarding technology maturity, market entry timing, lack of market readiness, etc. As design thinking emphasizes, the first step in solving this problem is to empathize with the needs of the customer.
Previous studies have emphasized that since technology commercialization involves diverse market variables and has a high level of risk, it is necessary to understand the market at the R&D stage in order to reduce market failure and overcome the valley of death [4,7,9,10,11,12,13,14,15,16,17,18,19,20,21,22,23]. In other words, maintaining the link between R&D and commercialization is an integral part of value creation.
Past research has attempted to explain this phenomenon by defining it as the “gap” [15,24,25]. This concept of the gap is more complex, micro-level, and diverse than the idea of the valley of death. The gap is not simply considered to be a disconnection between the technology development stage and the commercialization stage. It occurs at each gate between stages in the commercialization process like a stage-gate process; it is a multi-dimensional mismatch of understanding between the stakeholders in each stage. This results from the fact that the various stakeholders participating in commercialization have an asymmetric understanding of technology caused by a lack of information exchange among them. From a knowledge perspective, technology commercialization requires collaborative efforts by several stakeholders to accomplish complicated and challenging tasks. It involves implementing the whole process of imaging, incubating, representing, marketing, and sustaining a technology [15]. A lack of bidirectional information transmission throughout the commercialization process causes discord in the various stakeholders’ understandings of the value of technology, as well as creating financing difficulties, thus resulting in market failure [24,25]. Therefore, addressing the asymmetry between developers and customers in terms of the perceived value of a technology is a key factor in overcoming the gap [15,24]. This is especially important for high-tech developments. Since the market for new technology is uncertain and the risk of failure is high, it is necessary to validate the needs of the market at every stage of the commercialization process and to send information to all stakeholders participating in each stage to reduce uncertainty and risk.
To resolve this problem, practical and academic methodologies for innovation management and innovation process models have been proposed. In the past, these methodologies were debated in terms of the relative merits of “market pull” versus “technology push” or a coupled innovation process to explain the success of new technological products and services. However, scholars have begun to emphasize that in order to reduce uncertainties, the technology and the market should be integrated to test, verify, and adjust throughout the commercialization process.
If the validation of the technology or the market is deflected to one side, the following problems can arise: First, some technology developers try to validate a technology’s superiority and marketability by predicting market success. However, evaluation and prediction from the point of view of a developer are affected by a self-reporting bias, as well as memory and retrospection bias, which make objective judgment difficult [26,27]. Therefore, it is necessary to verify the superiority and marketability of technology, not from the developer’s perspective, but from the market user’s perspective. Second, academic research has used the technology acceptance model (TAM) to predict market success by identifying the marketability of technology from the user’s perspective [28]. However, these studies include technology and technology products in the same construct. Moreover, these studies verified product acceptance intention by identifying the characteristics of the technology, not by classifying the characteristics of the product itself. Technology is an intangible asset, and technology itself cannot be released in the market. The value of technology depends on the value of the product and is determined by the final product. Parker and Mainelli [29] identify five major mistakes in technology commercialization projects: assuming features will be benefits, using top-down market analysis, ducking the chicken gun test, failing to put someone in charge, and not valuing new technology fully. The greatest mistake is that developers assume that an advanced technology created through their efforts will be valuable to customers. However, the advance itself is not important to customers; rather, they value the new capabilities it brings. The authors used transistors and personal computers as examples: “the transistor was valuable because its size enabled the invention of the portable radio, not because semiconductors were a new and exciting technology. The personal computer is useful because it helps us to write articles like this, e.g., manipulate the text, add diagrams, perform relevant calculations, and send the results around the world, not because it has a 1 GHz chip and 500 Mb of RAM” [29](p. 385). In the same vein, during technology commercialization, if researchers develop an advanced technology, they will evaluate it as outstanding by assessing it based only on the performance improvement itself, which does not necessarily translate into marketability. However, new technology by itself is useless unless it generates new benefits for its users [29].
Many researchers are still focused on technology, not on the customer or the marketplace. They are not concerned about who buys their technological product and, more importantly, they are not concerned about why consumers buy the goods. Furthermore, consumers do not always want new or innovative technologies since they require a lot of changes in existing behaviors and habits. According to the theory of technology resistance, most consumers are resistant to innovation because they do not have an a priori desire for change [30,31]. Consequentially, the best technology is not necessarily successful in the marketplace. The value perceived from customers is created primarily when the products that utilize the new technology outperform existing products or when the technology enables the development of completely new products that meet consumers’ requirements [32]. This means commercialization success is mainly dependent on how the consumers or business customers value the technology [33]. A customer-centric strategy demands that researchers think about customers’ unmet needs, and about products and services they may not even realize that they need yet [34]. Therefore, it is necessary to identify why a potential customer might look for an alternative to existing products. It may be because of the lower costs of products, superior performance, greater reliability, or simple fashion [35](p. 438). Accordingly, it is important to recognize that technology development and productization are different concepts, and developers must understand the concept of technology value for productization in order to modify and refine a technology according to market demand [18]. The productization should be considered from the perspective of innovation management.
This study proposes a new model that revises and complements the TAM and allows for the validation of a new technology’s market potential from a consumer perspective. The “three-stage technology–product–market model” (three-stage TPM model) is applied in the technology commercialization process to reduce the separation between the technology and product development stages. Two research questions are developed to validate this model. The results of this study have important implications for predicting the probability of commercialization success by more closely exploring the technology market. The model can be applied to accelerate convergence between the stages of commercialization in the future.

2. Literature Review

2.1. Technology Commercialization Process and Open Innovation

Technology commercialization is the process of transferring a technology-based innovation from the developer of the technology to an organization utilizing and applying the technology for marketable products [3]. Based on the academic perspective of innovation management, technology commercialization can be seen as the “stage-gate process,” which accelerates ideas coming to market. Cooper [36] proposed the stage-gate process as a project management technique to help decision-makers improve efficiency and effectiveness in new-product development. This model consists of five gates and five stages, from the idea proposal to market launch. The product development activities are broken down and assigned to each stage and the decision criteria for each stage are determined and assigned to each gateway. Each stage contains a number of parallel and coordinated activities designed to refine the definitions of customer needs, develop technology solutions, and enhance capacity for efficient manufacturing [35]. The stage-gate assessment is conducted according to the decision criteria assigned to the gateway and one of the following options is decided: continue, redirect, hold, or kill. Cooper’s [36] model shows that the success rate of technology commercialization can be improved by killing low impact projects at a stage-gate.
The success of technology commercialization usually means “the developed technology is used for various commercial purposes to reach a stage where economic benefits are generated” [37]. Many companies struggle to invest in technology development, which requires bearing costs and committing time. Chesbrough [38] emphasized the need for the introduction of open innovation in business models as a means of solving this problem. Following this method, companies can leverage external R&D resources to save time and money in the innovation process using inbound open innovation. Furthermore, using outbound open innovation, measures such as technology transfer and spin-off can make the commercialization process easier. External collaboration can help to achieve a proof-of-concept, thereby improving the usability of ideas, enabling faster development and market launch of new products or services, and decreasing costs by sharing R&D infrastructure and equipment. In particular, small and medium enterprises (SMEs), which generally do not have sufficient internal capabilities and resources for innovation, can obtain external knowledge and experience that are essential for technology innovation through open innovation [39,40]. Hau [41] investigated the relationship between open innovation and the technology commercialization capability of SMEs. According to this research, SMEs’ external technology collaboration network and external information network diversities have positive effects on their technology commercialization capability.
While in the existing closed innovation paradigm, knowledge production by R&D is kept secret and self-contained in in-house processes [42]. Furthermore, intellectual property (IP) is controlled to ensure that competitors cannot use ideas for profit. However, recent research has identified the advantages of external knowledge and the negative perception of knowledge leakage between the company and the environment are disappearing [39,40]. Accordingly, a shift from closed innovation to open innovation is occurring.

2.2. The Gap in the Technology Commercialization Process

Since R&D is inherently risky, and only a small percentage of new ideas ultimately find commercial use, the various potential failures during the process of commercialization need to be understood. Prior studies on commercialization of technology have generally suggested that there are three major failures between the stages in the process of commercialization. First, failure may occur due to a lack of technical skills between the initial idea development and technology development stages. Second, commercialization failures may occur due to a lack of funds between the technology development and commercialization stages. This is caused by the fact that funding commitments for projects are initially low and typically focus on uncertain technical elements. Evidence of the technical and economic potential for technology is necessary in successive project stages to enable judgments about the project and decisions to commit funding in the long-term to be made. Therefore, if investors do not sufficiently understand the technical and economic potential of a technology in an early stage of commercialization, lack of funding is encountered, and this issue increases during the innovation process. Third, after the commercialization stage, products experience market failure due to a lack of market-oriented marketing, commercialization strategy, or expertise. Since the market for technology is uncertain and the risk of failure is high, it is necessary to validate the needs of customers before launching a new product.
As noted above, the failure resulting from a disconnection in the flow between the stages of innovation is commonly referred to as the “valley of death.” However, some studies also refer to the concept of the “gap” [15,24,25]. The gap in the technology commercialization process is not simply a disconnection between the technology and commercialization stages; it is a multi-dimensional mismatch between the stakeholders involved in each stage. The fundamental cause of the gap is a mismatch in understanding due to an information gap between the respective stakeholders in the technology and product development stages [15,24,25]. As open innovation becomes more prevalently applied in the process of technology commercialization, the gap between stakeholders is likely to widen.
According to the “five sub-process, four bridge” theory proposed by Jolly [15], the gap appears between each innovation stage, but the greater the value demonstrated in one stage of the commercialization process is, the easier it is to build a bridge to the next one. Technology commercialization means carrying out a series of activities, divided into stages, which increase the market value of a new technology. Each stage plays an independent role in value creation. The uncertainty inherent in technology commercialization is distributed throughout all stages, so success at one stage does not guarantee success at a later stage. In order to demonstrate value, stakeholders involved in taking a technology to market via a process of open innovation must understand the benefits of the new technology clearly.
Concretely, first, there is an “interest gap” between the “imaging stage,” which evaluates potentially valuable ideas, and the “incubating stage,” which increases the possibility of the commercialization of ideas selected in the “imaging stage.” This means that a group of stakeholders supplying resources tends to judge the commercial value of ideas subjectively and develop preferences for specific ideas. In addition, if the potential to commercialize a new technology is uncertain or an estimation of economic performance is difficult due to incomplete identification of technical principles, it may be difficult for stakeholders to judge the probability of commercialization [11]. Second, different stakeholders will often have different perceptions about the market value of a product as it progresses to the process of demonstrating a product or service; this is called the “technology transfer gap.” Rather than merely demonstrating technological superiority, innovators must make sure that the product meets a market need. Third, the “market transfer gap,” which is detrimental to market acceptance, appears between the “demonstrating stage” and “promoting stage.” When potential customers are accustomed to existing products, they tend to be reluctant to select a product that uses a new technology because this leads to opportunity and conversion costs. This is due to a lack of sufficient understanding of the superiority of the product, such as the competitiveness of the target technology and the potential of the complementary technology in the market. Therefore, the role of gatekeepers, who can promote the benefit of a technology, is important at this stage. Finally, the “diffusion gap” is the inability to accommodate large numbers of users in the initial market after a new product launch. This challenge can be overcome by sharing the value of a new product.
For most technology-based innovations, four bridges need to be built to close the circle of commercialization. The key to bridging the stages is not the developer’s subjective judgment about the value of the technology and its derivative products. Rather, the key is to validate the innovation from the perspective of the consumer; the core value of the technology must be verified at each step. In particular, Jolly [15] emphasizes that, from the first step in the technology commercialization process, providing sufficient information about the technology and the market to interested stakeholders can reduce errors due to subjective judgment of the commercial value of an idea [43]. Kim et al. [44] verified that the evaluation of a product from the technology developer’s perspective is different from the consumer’s evaluation. Namely, the developer’s evaluation is typically higher than the consumer’s rating. This suggests that the first step toward successful technology commercialization is to reduce the mismatch between developers and consumers.
In the same vein, Sohn [24] divided the gaps between business entities participating in the commercialization process into the “technology gap” and “technology financing gap.” The technology gap is caused by a mismatch between the technology providers and technology consumers in the process of technology transfer and commercialization. Therefore, it is necessary for the provider to understand the needs of the market for the purpose of utilizing the technology, and the consumer should maximize the value of the technology based on a similar sufficient understanding of the technology for it to succeed in the target market. The technology financing gap is a gap between technology demanders and commercial investors, which refers to the problem that there is high uncertainty about the recovery of investment capital because of the lack of mutual understanding of the technology and the market. This leads to uncertainties in market success and challenges in maintaining financing. In later research, Sohn et al. [25] further elaborated on the technology gap in the commercialization of technology developed by public research institutes. Thereby, gaps were classified based on the subject of the commercialization: researchers, universities, policy, culture, and recognition.

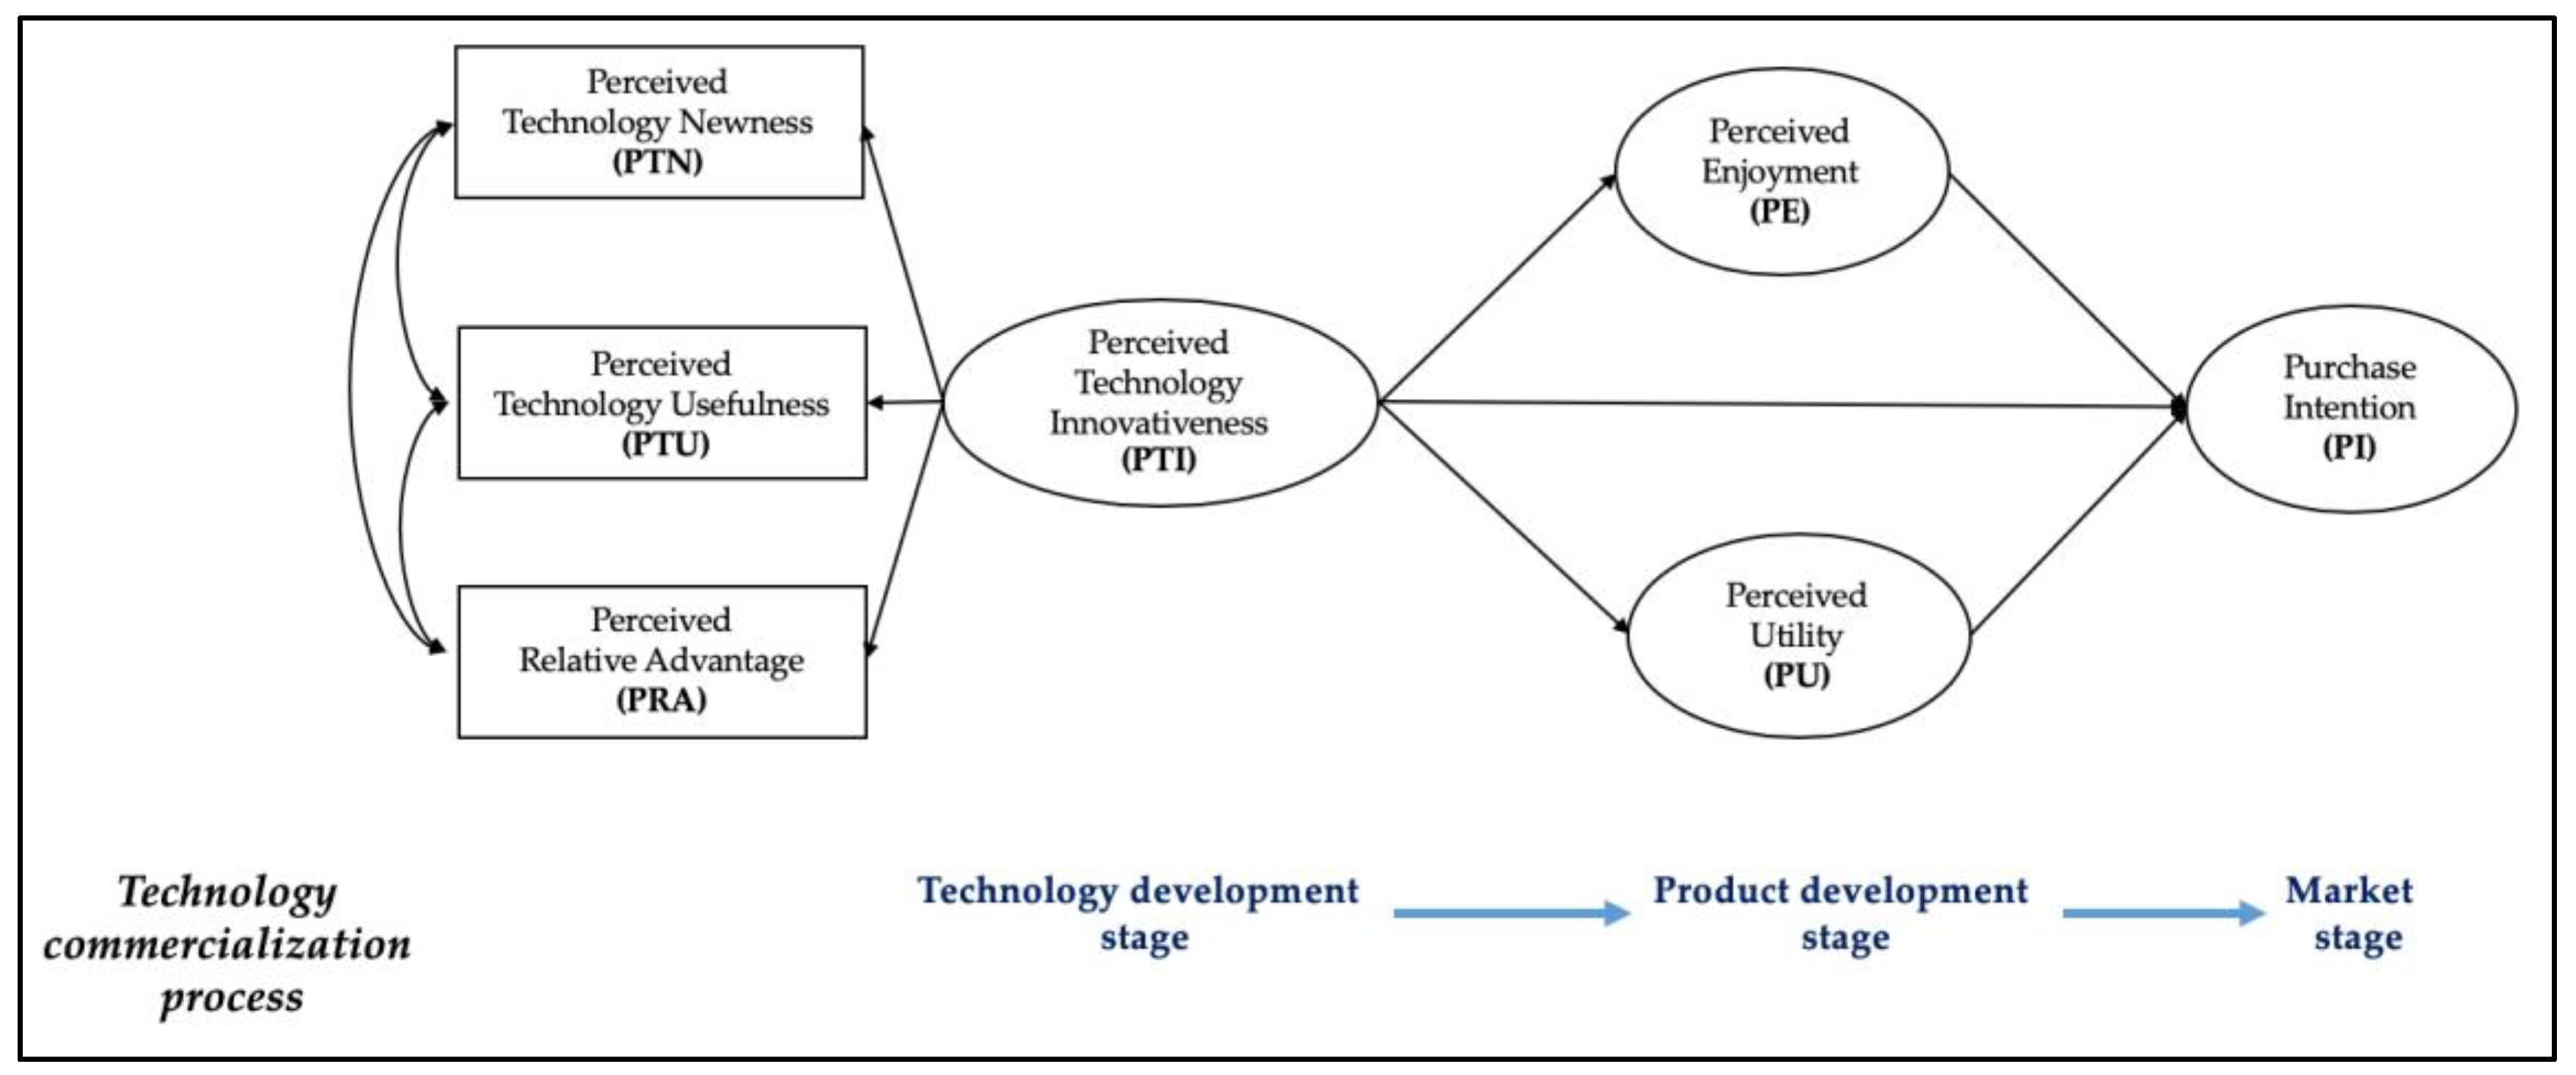
3. Three-Stage Technology–Product–Market Model

In this study, the three-stage TPM model was designed to account for each stage of the technology commercialization process: technology development, product development, and marketization stages. Moreover, this model aims to capture mediating effects in the product development stage, where the technology and market transfer gap occurs. These mediating effects are suggested as a bridge to overcome both the technology transfer and market transfer gaps, in line with Jolly [15], as shown in Figure 1.
We define the following research questions to validate the three-stage TPM model as follows:
Research Question 1.
Does the market consumer’s positive evaluation of technology characteristics directly affect his or her acceptance intention in the future?
Research Question 2.
Is technology acceptance mediated by the value that consumers perceived the technology generates when it is applied to a product?

3.1. Technology Stage

Technological attributes refer to the perceived and actual characteristics of a technology that influence various aspects of its adoption [45]. If a technology has highly attractive characteristics, from a consumer’s perspective, they will be more motivated to adopt it [46,47]. This is particularly important in reference to the creativity and problem-solving ability of high-risk and high-reward projects.
The existing literature on technological attributes focused on evaluating the superiority of a technology, such as its utility and competitiveness, whereby utility is a measure of whether the technology can solve the issues of the target consumer and competitiveness measures the degree to which competitors can compete in the industry through commercialization.
On the other hand, Lowe and Alpert [48] explained innovativeness as the superiority in new product development research, which consists of the perceived newness and perceived relative advantage of a product. The authors also emphasize that understanding consumers’ perceptions of innovativeness helps to explain and predict unexpected consumer responses. In particular, negative reactions to new products that firms had expected would be successful can be explained in this way. Perceived innovativeness is also considered to be a formative construct comprised of a combination of overall measures determining how new the technology is perceived to be and the extent to which the innovation would change consumption patterns [49]. Other researchers have defined innovativeness as creativity or novelty [50,51]. Technological novelty is determined by comparing a new technology with existing technologies to identify the uniqueness—or, rather, the novelty—of the technology [50]. This comparison enables the creation of new categories relating the technology to existing technologies [50]. In particular, mindful adopters engage in information seeking and compare the new technology with existing technologies to determine technological novelty [51]. Sorescu and Spanjol [27] define innovativeness with respect to the novelty and superior consumer benefits generated by a product and explain that an innovative product is one that is the first to bring a certain novel and significant consumer benefit to the market. Danneels and Kleinschmidt [52] explained that innovativeness, from a consumer’s perspective, is comprised of key innovation attributes, such as relative advantage, compatibility, complexity, trialability, and observability.
This study reconstructed the perceived technology innovativeness (PTI) from the perspective of consumers based on the detailed factors of innovativeness presented in previous research. PTI consists of perceived technology newness (PTN), perceived technology usefulness (PTU), and perceived relative advantage (PRA). Specifically, PTN is defined as the degree of novelty and improvement compared to the existing technology. PTU is defined as the degree of convenience and utility attained when using a technology. Finally, PRA is defined as the benefit that can be achieved by using a new technology in comparison to competing technology. Details of each variable are described in Table 1.

3.2. Product Stage

The product stage considers the perceived value of a product. Perceived value is an overall assessment of the superiority and efficiency of a product, which is the motivation that leads to consumer behavior. It affects the judgment, preference, and choice of products. In general, it has been understood that consumer evaluations of new technologies are based on rational responses. Additionally, technology adoption intention can be guided by both extrinsic and intrinsic motivations. Extrinsic motivations concern utilitarian attitudes, while intrinsic motivations are hedonic attitudes, such as perceived enjoyment [53]. Products that are presumed to provide high functional benefits lead to utilitarian attitudes, while products with high perceived newness lead to hedonic attitudes [48]. Recent research has shown that consumers are affected by an initial emotional response when they are exposed to innovation [54,55], especially within the information and communications technologies (ICT) field.
This study considers both the emotional and rational values of the products to which the technology is applied as sub-factors in the product stage. In addition, it analyzes how the value of innovative technology is influenced by the value factor. Emotional value can be explained as the perceived enjoyment (PE), meaning fun, excitement, etc., that will be felt when using the product. In the adoption of information systems with excellent technological advances, the enjoyment of experiencing the newest technology is an important adoption factor, along with the functional benefits [56]. The rational value of a product is the perceived utility (PU), which refers to the benefits, advantages, and usefulness of a product. PU factors cannot explain the adoption of hedonic goods that do not offer PU [57]. However, tangible and highly functional products also provide PE [58].

3.3. Market Stage

Purchase intention (PI) is considered to be an indicator of the probability that beliefs and attitudes will be translated into action. Fishbein [59] considers intention to be a good prediction index of behavior and argues that behavior is determined by intention. Similarly, a user’s adoption of a product is an expression of behavior change. Consumer behavior is influenced by psychological, personal, social, and cultural factors. Psychological and personal factors include attitudes, motivations, needs, values, egos, personalities, lifestyles, demographic characteristics, etc. Social and cultural factors include reference groups, families, cultures, social classes, etc.

4. Methodology

4.1. Research Subjects and Data

The purpose of this study is to confirm the difference between the consumer’s perception of technology and products incorporating that technology. In addition, in the process of commercialization of the technology, we aim to raise the problem of predicting market success if predications are solely based on the superiority of technology from developers’ perspectives. In order to verify the research model, we surveyed 350 potential end-users of a new technology by e-mail.
Our questionnaire covers the technology stage, product stage, and market stage. The questions about the technology stage gathers information about the perceived technology innovativeness regarding a new technology developed by the Electronics and Telecommunications Research Institute (ETRI). This technology is named “Zing” and it can transfer large amounts of data, equivalent to approximately three movies, within one second over a distance of 10 cm. It has an Internet speed of 3.5 gigabits per second (Gbps), which is 8000 times faster than conventional near field communication (NFC) technology while consuming only 1/4000 of the power. The product stage investigates the perceived product value of customers about the technical product, “Wireless USB” using Zing. This product does not need to be plugged in like traditional portable storage devices, and it synchronizes almost instantaneously, transferring data in real time. The reason we chose this product is because the technology developers who developed the Zing technology expect it to be applied to this product. Lastly, the market stage investigates customers’ purchase intention toward the product.
The survey was conducted online during the month of April in 2016. The potential consumers were randomly allocated to reflect the population ratio, by gender and age, registered in the resident population statistics (March 2016) of the Korea Ministry of Government Administration and Home Affairs. Respondents were selected from people who have experience using USB technology. The gender ratio is 57.7% for men and 42.3% for women, and 59.1% of respondents were under forty years of age.

4.2. Analysis

The three-stage TPM model is a modification of the TAM, where it distinguishes between the technology development, productization, and market launch stages. It is designed to emphasize the importance of the productization process in the technology commercialization process and to overcome the gap by verifying the mediating effects of the commercialization process.
This paper uses two methods to achieve the final results. The research model was analyzed with structural equation modeling (SEM) using the STATA 12.1 program (StataCorp LCC, College Station, TX, USA). SEM is used to analyze the structural relationship between measured variables and latent constructs. The method applied is a combination of factor analysis and multiple regression analysis. It includes confirmatory factor analysis, confirmatory composite analysis, path analysis, partial least squares path modeling, and latent growth modeling. Confirmatory factor analysis (CFA) is used to test whether measures of a construct are consistent with a researcher’s understanding of the nature of that construct.
After this analysis, we followed the hierarchical χ2 model proposed by Holmbeck [60] and Ji and Kang [61] to confirm the mediating effect of the productization stage.

5. Results

5.1. Factor and Reliability Analyses

An exploratory factor analysis and confirmatory factor analysis of the potential variables included in the research model were conducted. The results are depicted in Table 2. The fit of factor analysis was conformed according to the typical model fit criteria of the comparative fit index(CFI), turker-lewis index (TLI), root mean square of approximation (RMSEA), and standardized root-mean-square residual (SRMR). It is generally considered good when CFI and TLI are higher than 0.90, RMSEA is between 0.05 and 0.08, and SRMR is lower than 0.07 [62].The exploratory factor analysis was used to select variables with a factor load of 0.6 or more. As a result of the reliability test using Cronbach’s α, all the variables were confirmed to have a reliability higher than 0.702. In addition, through confirmatory factor analysis, discriminant validity was confirmed, as shown in Table 2. The path coefficient ( λ ), which is the path load between all the latent variables and latent factors, was very high and statistically significant (p < 0.001). The conceptual reliability coefficient and the average variance extracted (AVE) were 0.90 or above.
A correlation analysis of the measured variables showed that all variables except the perceived relative advantage (PRA) and perceived technology usefulness (PTU) were below 0.80.

5.2. Correlation

The results of the analysis of the bivariate correlation between the variables are shown in Table 3. All variables were positively correlated, showing evidence of discriminant validity.

5.3. Path Analysis Result

The fit of the structural model was confirmed according to RMSEA and CFI values. RMSEA is a fit index developed to overcome the limitations of the statistical model of the sample, where 0.1 or less is appropriate [62]. CFI is one of the most widely used indices and a model is generally considered to be suitable when CFI is higher than 0.90 [62].
The RMSEA value of this model was smaller than 0.1 and the CFI value was 0.95, both of which satisfy the minimum requirements. In addition, SRMR was 0.04 (a value lower than 0.07 is generally accepted to be suitable), so fitness was confirmed (Table 4).
As shown in Table 4, the perceived newness and usefulness of the technology have a significant effect on the perceived innovativeness of the technology. In particular, the end users felt that the technology was more innovative when they perceived the technology to be useful (p < 0.001). On the other hand, the perceived relative advantage of the technology did not have a significant effect on its perceived innovativeness (p > 0.01). End users seemed to perceive innovation as something that was radically different rather than an incremental improvement.

5.4. Hierarchical χ2 Analysis Result

In order to verify the mediating effect of the productization stage, Holmbeck [60] conducted a hierarchical χ2 analysis (Table 5). The hierarchical χ2 analysis compares the differences of Δχ2 with the degrees of freedom. If the difference of Δχ2 was significant, we selected a partial model with many paths (step 3), and if not, we selected a full model (step 2) with a small number of paths [61].
The analysis shows that the effect of PTI on the purchase intention (PI) was mediated by step 2, which excluded the mediating effects of PEV and PRV. The Δχ2 values, which considered the degrees of freedom (df = 1), were compared to step 3, which included the mediating effects. Since the Δχ2 (2.74) was not significant, we selected step 2 since the complete model (Δχ2 > 3.84, df = 1) was the superior model.
The hierarchical χ2 analysis of Table 5 shows that PTI did not directly affect PI, but it influenced the mediating effect of PE and PU. This supports the claim by Sohn et al. [12] that the process of raising the market value of a technology is important. In particular, the emotional value of the product had a more significant effect on the purchase intention than the rational value of the product (PE = 0.646, PU = 0.435). This is in line with previous studies that find that market consumers are affected by their initial emotional response when they are exposed to innovative digital technology [53,54]. Therefore, it is particularly important for technology products based on ICT to emphasize emotional value and seek product development and promotion strategies that increase market acceptance.

6. Discussion and Conclusions

6.1. Discussion

The existing technology commercialization process, based on technology developers and suppliers, fails when it does not accurately assess market needs. Open innovation strategies not only save time and money in resource utilization, but also enable the rapid introduction of technologies whereby ideas can be absorbed from alternative channels instead of using internal resources that may only be capable of limited technological progress. Google is a company that in some ways uses an aggressive and closed strategy, but also embraces ideas and suggestions from experts, freelancers, and users to solve specific problems. The company has done this by introducing an open innovation business model. In particular, more than 130 million Google users form a group to evaluate the feasibility of new services. As in the case of Google, in order to ensure success in commercialization, it is necessary to identify the needs of potential customers in the market and anticipate the market demands for new technologies and products. In the case of new technologies or convergence technologies for which the market is uncertain, demand forecasting through market validation is critically important. Therefore, our study suggests a customer-centric methodology for technology and product validation.
This study developed a three-stage technology–product–market model. Consumers in the market were surveyed to gather data and test the model using structural equation modeling. Though most previous studies have applied the TAM to evaluate the acceptance of a new product, these studies tested the relationship between technology development and purchase intent by treating technology and a product to which the technology is applied as the same. However, technology is not released to the market as it is, and market acceptance can change depending on how the product or service applies the technology. Therefore, we developed the three-stage TPM model and indirectly confirmed the existence of gaps by verifying the mediating effects of the product stage.
Our analysis result showed that end-users’ perceptions of the innovativeness of a technology does not lead to the purchase of products, even if they perceived the technology to be innovative. In other words, there is a gap between the technology development stage and commercialization. This implies that product purchase intention was significantly influenced by its perceived value. These results support the findings of previous studies [53,54] that have found that the emotional value of a product has a more significant effect on purchase intention than the rational value. The result of the hierarchical χ2 analysis showed that there was a full mediating effect between the emotional value and rational value of the product. This answered the research question 2, emphasizing the importance of the productization stage. Therefore, the technology market transfer gap proposed by Jolly [4] can be reduced by raising the perceived value of the product. Thus, concepts from marketing management about consumer behavior cannot be ignored in the process of turning a technology into a product.
This study addresses the limitations of earlier research on the technology commercialization process and fills the gaps in the literature. It has the following academic implications. First, this study verified that the existing validation methods should be revised, moving away from the viewpoint of the technology developer or supplier toward a comprehensive analysis of both the technical developers’ and market consumers’ viewpoints. Second, the three-stage TPM model developed in this study can be used to predict the success of commercialization of a new technology as it can confirm whether potential customers will accept a new product in the market. This can reduce prediction errors and market failures, which have frequently been experienced in new product launches that were based on the developers’ evaluations of a technology without confirming market demand. In addition, this study is significant in that it can supplement the limitations of the TAM, which is used to predict market acceptance, and suggests an index that can more accurately predict the success factors in the market.
The empirical results of this study have the following practical implications. First, as a result of the analysis of the three-stage TPM model, it was found that customers do not purchase a newly developed technology directly. Instead, acceptance of a technology depends on which product or service utilizes the technology because consumers buy products or services, not the technology itself. Therefore, the analysis and verification of a technology and the products to which it is applied must be considered distinct, and a market-oriented commercialization strategy, including a marketing strategy, should be established. Second, technology developers and suppliers can accurately judge whether consumers will be interested in a technology or its related products using the three-stage TPM model by understanding how perceptions of the technology innovativeness directly affect purchase intention or are mediated by the value of the product. This insight can be used to develop a market strategy emphasizing the attributes of the technology, as well as to develop products that are important to consumers. However, since the result of this study may be different for the same technology through different products or cultural contexts, the model needs further verification through future study. Third, the three-stage TPM model developed in this study can accommodate the evaluation of the market from an open innovation perspective by procuring external resources from potential users. Using this model, companies can sustain a competitive advantage and reduce the risk of market failure of a new technological product.

6.2. Conclusions

The results of this study confirm the research questions, i.e., that it may be wrong to assume that the innovativeness of a technology will lead to the purchase of a product, which has also been emphasized in previous studies. Market end users judge the value of a product before determining their purchase intention. The fact that emotional value has a more significant influence on purchase intention than practical value, even if it is a product that has a strong practicality and generates little enjoyment through use, suggests a great deal to technology and product developers. This model indirectly confirmed the possibility that a new technology will fall into a gap if the productization strategy, as part of the technology commercialization process, is not appropriately established.

Author Contributions

Conceptualization, M.K., Y.-w.S. and S.-y.P.; data curation, Y.-w.S., formal analysis, M.K.; methodology, M.K.; project administration, H.P; validation Y.-w.S. and S.-y.P.; writing-original draft preparation, M.S.; writing-review and editing, M.K., H.P., Y.-w.S. and S.-y.P.

Funding

This research received no external funding.

Acknowledgments

This article is based on a part of the first author’s Ph.D. dissertation.

Conflicts of Interest

Authors declare no conflict of interest.

References

  1. Cooper, L.G. Strategic marketing planning for radically new products. J. Mark. 2000, 64, 1–16. [Google Scholar] [CrossRef]
  2. Jin, S.H.; Choi, S.O. The E ff ect of Innovation Capability on Business Performance: A Focus on IT and Business Service Companies. Sustainability 2019, 11, 5246. [Google Scholar] [CrossRef]
  3. Kirchberger, M.A.; Pohl, L. Technology commercialization: A literature review of success factors and antecedents across different contexts. J. Technol. Transf. 2016, 41, 1077–1112. [Google Scholar] [CrossRef]
  4. Lee, G.W.; An, J.H.; Lee, J.S.; Jun, Y.J.; Han, H.N.; Lee, B.R.; Lee, S.A.; Min, B.Y.; Seol, J.Y. Study on Ways to Activate Technology Transfer Commercialization of National R&D Projects for Realization of Creative Economy; Korea Institute of S&T Evaluation and Planning: Seoul, Korea, 2015. [Google Scholar]
  5. George, G.; Wood, D.R. The Effects of Business-university Alliances on Innovative Output and Financial Performance: A Study of Publicly Traded Biotechnology Companies. J. Bus. Venturing. 2002, 17, 577–609. [Google Scholar] [CrossRef]
  6. Markham, S.K.; Lee, H. Product Development and Management Association’s 2012 Comparative Performance Assessment Study. J. Prod. Innov. Manag. 2013, 30, 408–429. [Google Scholar] [CrossRef]
  7. Holmgren, A.; Karlsson, S. The Process of Technology Commercialization—A Case Study of Project CHRISGAS Annie. Bachelor’s Thesis, Jönköping University, Jönköping, Suède, 2007. [Google Scholar]
  8. Markman, G.D.; Siegel, D.S.; Wright, M. Research and Technology Commercialization. J. Manag. Stud. 2008, 45, 1401–1423. [Google Scholar] [CrossRef]
  9. Cooper, R.; John, A. Coordinating Coordination Failures in Keynesian Models. Q. J. Econ. 1988, 103, 441–463. [Google Scholar] [CrossRef]
  10. Kim, K.H.; Hyun, S.H.; Choi, Y.J. Effects of Strategic Resources on Technology Commercialization. J. Inf. Technol. Serv. 2006, 5, 151–163. [Google Scholar]
  11. Kim, C.; Ko, C.; Seol, S. Case Studies on the Failure of Commercialization of Technology. J. Korea Technol. Innov. Soc. 2012, 15, 203–223. [Google Scholar]
  12. Jung, W.; Roh, D.; Min, S.L.; Lee, S. The Effects of Technological Innovation Strategies on Management Performance in Venture Firms: Focused on the Mediating Effects of Technology Commercialization Jung. Korean Manag. Consult. Rev. 2016, 16, 61–77. [Google Scholar]
  13. Lee, K. Death Valley and Chasm: Barriers to Biotechnology Commercialization. Korea Mark. Assoc. 2006, 40, 73–76. [Google Scholar]
  14. Lim, I.J.; Lee, S.M.; Lee, J. A Study on the Success Factors of Technology Transfer and Commercialization in the High- Technology Industry: Collaboration between KETI and Probe Card Company. J. Korea Technol. Innov. Soc. 2014, 17, 490–518. [Google Scholar]
  15. Barr, S.H.; Markham, S.K.; Kingon, A. Bridging the Valley of Death: Lessons Learned From 14 Years of Commercialization of Technology Education. Acad. Manag. Learn. Educ. 2009, 8, 370–388. [Google Scholar]
  16. Murphy, L.M.; Edwards, P.L. Bridging the Valley of Death: Transitioning from Public to Private Sector Financing; National Renewable Energy Laboratory: Golden, CO, USA, 2003.
  17. Abereijo, I.O. Transversing the “valley of death”: Understanding the determinants to commercialisation of research outputs in Nigeria. Afr. J. Econ. Manag. Stud. 2015, 6, 90–106. [Google Scholar] [CrossRef]
  18. Wang, M.; Pfleeger, S.; Adamson, D.M.; Bloom, G.; Butz, W.; Fossum, D.; Gross, M.; Kelley, C.; Kelly, T.; Kofner, A.; et al. Technology Transfer of Federally Funded R&D.; RAND Science and Technology Policy Institute: Santa Monica, CA, USA, 2003; pp. 1–99. [Google Scholar]
  19. Park, J.B. Actual Conditions and Development Tasks of Korean Technology Commercialization; Korea Institute for Industrial Economics & Trade: Sejong, Korea, 2008. [Google Scholar]
  20. Sohn, S.J.; Lee, Y.J.; Jung, S.; Lim, C.Y. Recommendation for Promoting Technology Commercialization; Science and Technology Policy Institute: Washington, DC, USA, 2009. [Google Scholar]
  21. Shin, Y.; Ha, K. A study on the effect of technology management capability on the success of technology commercialization. Soc. Digit. Policy Manag. 2012, 10, 97–110. [Google Scholar]
  22. Savaneviciene, A.; Venckuviene, V.; Girdauskiene, L. Venture Capital a Catalyst for Start-Ups to Overcome the “Valley of Death”: Lithuanian Case. Procedia Econ. Financ. 2015, 26, 1052–1059. [Google Scholar] [CrossRef]
  23. Jolly, V.K. Commercializing New Technologies—Getting From Mind to Market; Harvard Business School Press: Boston, MA, USA, 1997. [Google Scholar]
  24. Sohn, S.J. A Study on the Recognition of Technology Commercialization Gap and Bridge Design; Science and Technology Policy Institute: Sejong, Korea, 2015. [Google Scholar]
  25. Sohn, S.J. C&BD Approach for Enhancing Technology Commercialization of Public Research Organizations (PROs); Science and Technology Policy Institute: Sejong, Korea, 2015. [Google Scholar]
  26. Chandy, R.K.; Tellis, G.J. Organizing for Radical Product Innovation: The Overlooked Role of Willingness to Cannibalize. J. Mark. Res. 1998, 35, 474–487. [Google Scholar] [CrossRef]
  27. Sorescu, A.B.; Spanjol, J. Innovation’s Effect on Firm Value and Risk: Insights from Consumer. J. Mark. 2008, 72, 114–132. [Google Scholar] [CrossRef]
  28. Davis, F.D. Perceived Usefulness, Perceived Ease of Use, and User Acceptance of Information Technology. MIS Q. 1989, 13, 319–340. [Google Scholar] [CrossRef]
  29. Parker, K.; Mainelli, M. Great mistakes in technology commercialization. Strateg. Chang. 2001, 390, 383–390. [Google Scholar] [CrossRef]
  30. Ram, S.; Sheth, J.N. Consumer resistance to innovations: The marketing problem and its solution. J. Consum. Mark. 1989, 6, 5–14. [Google Scholar] [CrossRef]
  31. Ram, R. Exports and economic growth in developing countries.pdf. Econ. Dev. Cult. Chang. 1987, 36, 51–72. [Google Scholar] [CrossRef]
  32. Maine, E.; Garnsey, E. Commercializing generic technology: The case of advanced materials ventures. Res. Policy 2006, 35, 375–393. [Google Scholar] [CrossRef] [Green Version]
  33. Lo, C.; Wang, C.; Chien, P.; Hung, C. Technovation An empirical study of commercialization performance on nanoproducts. Technovation 2012, 32, 168–178. [Google Scholar] [CrossRef]
  34. Shapiro, S.M. 24/7 Innovation: A Blueprint for Surviving and Thriving in an Age of Change; McGraw-Hill Companies: New York, NY, USA, 2001. [Google Scholar]
  35. Bessant, J.; Tidd, J. Managing Innovation: Integrating Technological, Market and Organizational Change, 5th ed.; Wiley: Hoboken, NJ, USA, 2013. [Google Scholar]
  36. Cooper, R.G. Winning at New Products, 5th ed.; Addison-Wesley: Boston, MA, USA, 1986. [Google Scholar]
  37. Kim, C. Case Studies on the Successes and Failures of Commercialization of Technology; Korea Institute of Science and Technology Information: Daejeon, Korea, 2013. [Google Scholar]
  38. Chesbriough, H.W. Open Innovation:The New Imperative for Creating and Profiting from Technology; Harvard Business School Press: Boston, MA, USA, 2003; ISBN 1578518377. [Google Scholar]
  39. Kim, H.; Park, S.; Joh, W. A Study on Technology Development Performance and Technology Commercialization Performance According to the Technology Development Capability of SMEs Focusing on a Comparative Analysis of Technology Business Groups. J. Open Innov. Technol. Mark. Complex. 2019, 5, 65. [Google Scholar] [CrossRef]
  40. Joueid, A.; Coenders, G. Marketing Innovation and New Product Portfolios. A Compositional Approach. J. Open Innov. Technol. Mark. Complex. 2018, 4, 19. [Google Scholar] [CrossRef]
  41. Hau, Y.S. An empirical analysis of the influence of external knowledge network on SMEs’ new technology development and technology commercialization capabilities in the perspective of open innovation An empirical analysis of the influence of external knowledge netw. J. Digit. Converg. 2016, 14, 149–156. [Google Scholar] [CrossRef]
  42. Park, H.J.; Shin, W.S. Fostering Technology Commercialization through Open Innovation. In Proceedings of the 2009 Spring Conference of the Korean Operations Research and Management Science Society & Korean Institute Of Industrial Engineers, Busan, Korea, 22 May 2009. [Google Scholar]
  43. Tsang, E.W.K. Transaction cost and redource-based explanation of joint ventures. Organ. Stud. 2000, 21, 215–242. [Google Scholar] [CrossRef]
  44. Kim, M.; Lim, K.S.; Park, S.Y. The Technology and Product Perception Gap of Digital Innovative Technology in the Stakeholder: Focused on Technology Developer and Market End-user. J. Korean Entrep. Soc. 2017, 12, 51–73. [Google Scholar] [CrossRef]
  45. Williams, B.L.; Suen, H.K.; Zappe, S.E.; Heikkila, T. Diffusion of US Army chemical weapons disposal technologies: Public perception of technology attributes. J. Environ. Plan. Manag. 2003, 46, 499–523. [Google Scholar] [CrossRef]
  46. Slater, S.F.; Mohr, J.J. Successful Development and Commercialization of Technological Innovation: Insights Based on Strategy Type. J. Prod. Innov. Manag. 2006, 23, 26–33. [Google Scholar] [CrossRef]
  47. Gu, W.; Bao, P.; Hao, W.; Kim, J. Empirical Examination of Intention to Continue to Use Smart Home Services. Sustainability 2019, 11, 5213. [Google Scholar] [CrossRef]
  48. Lowe, B.; Alpert, F. Forecasting consumer perception of innovativeness. Technovation 2015, 45–46, 1–14. [Google Scholar] [CrossRef]
  49. Olshavsky, R.W.; Spreng, R.A. An exploratory study of the innovation evaluation process. J. Prod. Innov. Manag. 1996, 13, 512–529. [Google Scholar] [CrossRef]
  50. Verhoeven, P.; Sinn, F.; Herden, T.T. Examples from Blockchain Implementations in Logistics and Supply Chain Management: Exploring the Mindful Use of a New Technology. Logistics 2018, 2, 20. [Google Scholar] [CrossRef]
  51. Sun, H.; Fang, Y.; Kong, H.; Kong, H. Choosing a Fit Technology: Understanding Mindfulness in Technology Adoption and Continuance. J. Assoc. Inf. Syst. 2016, 17, 377–412. [Google Scholar] [CrossRef] [Green Version]
  52. Danneels, E.; Kleinschmidt, E.J. Product innovativeness from the firm’s perspective: Its dimensions and their relation with project selection and performance.pdf. J. Innov. Manag. 2001, 18, 357–373. [Google Scholar] [CrossRef]
  53. Lin, C.P.; Bhattacherjee, A. Extending technology usage models to interactive hedonic technologies: A theoretical model and empirical test. Inf. Syst. J. 2010, 20, 163–181. [Google Scholar] [CrossRef]
  54. Zhang, P. The affective response model: A theoretical framework of affective concepts and their relationships in the ICT context. MIS Q. 2013, 37, 247–274. [Google Scholar] [CrossRef]
  55. Han, M.; Wu, J.; Wang, Y.; Hong, M. A Model and Empirical Study on the User’s Continuance Intention in Online China Brand Communities Based on Customer-Perceived Benefits. J. Open Innov. Technol. Mark. Complex. 2018, 4, 46. [Google Scholar] [CrossRef]
  56. Hong, S.; Tam, K.Y. Understanding the Adoption of Multipurpose Information Appliances: The Case of Mobile Data Services. Inf. Syst. Res. 2006, 17, 162–179. [Google Scholar] [CrossRef]
  57. Turel, O.; Serenko, A.; Bontis, N. User acceptance of hedonic digital artifacts: A theory of consumption values perspective. Inf. Manag. 2010, 47, 53–59. [Google Scholar] [CrossRef]
  58. Yoo, C.; Kwon, S.; Na, H.; Chang, B. Factors A ff ecting the Adoption of Gamified Smart Tourism Applications: An Integrative Approach. Sustainability 2017, 9, 2162. [Google Scholar] [CrossRef]
  59. Fishbein, M.; Ajzen, I. Belief, Attitude, Intention and Behaviour: An Introduction to Theory and Research; Addison-Wesley: Boston, MA, USA, 1975. [Google Scholar]
  60. Holmbeck, G.N. Toward Terminological, Conceptual, and Statistical Clarity in the Study of Mediators and Moderators: Examples From the Child-Clinical and Pediatric Psychology Literatures. J. Consult. Clin. Psychol. 1997, 65, 599–610. [Google Scholar] [CrossRef]
  61. Ji, S.; Kang, Y. Discussion on mediation test of structural equation model in social science feild. J. Korean Data Anal. Soc. 2014, 16, 3121–3131. [Google Scholar]
  62. Steiger, J.H. Structural model evaluation and modification approach. Miltivariate Behav. Res. 1990, 25, 173–180. [Google Scholar] [CrossRef]
Figure 1. Research model: Three-stage technology–product–market (TPM) model.
Sustainability 11 06267 g001
Table 1. Variable indicators.
VariableIndicatorReference
Perceived Technology Newness
(PTN)
This technology is new[45,48,50,51,52]
This technology is different
This technology is unique
This technology is original
Perceived Technology Usefulness
(PTU)
Using this technology is useful[28,46,52]
Using this technology improves performance
Using this technology increases productivity
Perceived Relative Advantage
(PRA)
This technology is higher quality than the competition[48,52]
This technology solves problems I had with existing technology
Perceived Technology Innovativeness
(PTI)
How innovative is this technology?[48,49]
This is an innovative technology
Perceived Enjoyment
(PE)
Using this product is exciting[48,53,54,57]
Using this product is fun
This product is enjoyable
Perceived Utility
(PU)
This product is effective[48,54,56]
This product is helpful
This product is practical
Purchase Intention
(PI)
I need this product[59]
I want to purchase this product
Table 2. Factor and reliability analyses.
VariableLoading/WeightCronbach’s α λ Discriminant ValidityAVE
PTN0.8590.9000.840 ***0.9800.926
0.8350.878 ***
0.7780.807 ***
0.7780.810 ***
PTU0.8540.8660.846 ***0.9910.975
0.7930.818 ***
0.7610.815 ***
PRA0.8790.7020.754 ***0.9740.950
0.6610.721 ***
PTI0.8780.7940.760 ***0.9850.970
0.6860.868 ***
PE0.8090.9010.855 ***0.9930.981
0.8040.864 ***
0.6750.887 ***
PU0.8020.8880.858 ***0.9920.978
0.7920.868 ***
0.7040.831 ***
PI0.8660.8150.814 ***0.9850.971
0.7500.850 ***
χ2 = 336.214 (df = 143, p = 0.000)
CFI = 0.963, TLI = 0.955, RMSEA = 0.062, SRMR = 0.050
*** p < 0.01.
Table 3. Correlation analysis.
VariablePTNPTUPRAPTIPUPEPI
PTN1------
PTU0.63 *1-----
PRA0.58 *0.64 *1----
PTI0.76 *0.72 *0.62 *1---
PU0.64 *0.80 *0.59 *0.69 *1 -
PE0.61 *0.72 *0.59 *0.66 *0.75 *1-
PI0.44 *0.69 *0.40 *0.52 *0.64 *0.66 *1
* p < 0.05.
Table 4. Path analysis.
PathβSEZ
PTN→PTI0.3180.0496.50 ***
PTU→PTI0.6600.0739.02 ***
PRA→PTI0.0820.0820.99 (n/s)
PTI→PE0.9080.01654.98 ***
PTI→PU0.8390.02138.56 ***
PTI→PI−0.2680.177−1.51 (n/s)
PE→PI0.6460.0966.72 ***
PU→PI0.4350.1483.06 **
χ2 = 398.59, df = 141 (p = 0.001) RMSEA = 0.072, CFI = 0.95, TLI = 0.94, SRMR = 0.04
** p < 0.05, *** p < 0.001, (n/s): not significant.
Table 5. Hierarchical χ2 analysis result.
Step χ2 d f p-ValueRMSEACFITLISRMR
Step 1
(Non-nested Model)
20058p < 0.0010.0840.9530.9370.040
Step 2
(Full Model)
401.33142p < 0.0010.0720.9500.9400.043
Step 3
(Partial Model)
398.59141p < 0.0010.0720.9500.9400.042
Stepwise Δχ2 analysisΔχ2ΔdfAccept Model
Step 2–Step 32.741Step 2

