Carbon Taxation: A Tale of Three Countries


1
Univ. Grenoble Alpes, CNRS, GAEL, 38000 Grenoble, France
2
School of Resource and Environmental Management, Simon Fraser University, Vancouver, BC V6B 5K3, Canada
3
Department of Economics, University of Gothenburg, PO Box 640, 40530 Gothenburg, Sweden
*
Author to whom correspondence should be addressed.
Sustainability 2019, 11(22), 6280; https://0-doi-org.brum.beds.ac.uk/10.3390/su11226280
Submission received: 29 July 2019
/
Revised: 30 October 2019
/
Accepted: 5 November 2019
/
Published: 8 November 2019
(This article belongs to the Special Issue Economics of Environmental Taxes and Green Tax Reforms)
Abstract
:Carbon pricing is considered by most economists as a central dimension to any climate policy. It is assumed to bring simple, transparent, and cost-effective means to change investment and consumption behaviors. The most straightforward method is carbon taxation, but its implementation is more complex. This study provides a comparative analysis of carbon taxation in three countries—Sweden, Canada, and France—aimed at drawing lessons for the future of carbon taxation. Comparing the experience of the three countries reveals that carbon taxes, once in place, do have the intended effect. In this sense, they work well. However, the analysis also reveals very different situations in terms of advances, difficulties, and results, which highlights the need to carefully consider the social and political conditions for the acceptance and effective implementation of such economic instruments. Against this background, the comparative analysis yields four main insights that deserve further research from economics and social scientists: the ability to combine pure economic instruments and other regulation or policies and measures; the management of lobbies and vested interests; the identification of a clear strategy for the recycling of the carbon revenues, whether earmarked or not; and finally, the importance of these three dimensions of carbon taxes in the new settings of zero net emission policies.
1. Introduction
Economists argue that carbon pricing, especially in the form of a carbon tax, is the climate policy that offers the lowest cost method to reduce greenhouse gas (GHG) emissions (cap-and-trade systems for carbon emission permits offer alternative ways of pricing carbon but are not the subject of this paper). Since governments first started contemplating climate policy three decades ago, the real-world experience has been complicated. While some jurisdictions have implemented carbon taxes, others have not. Where governments have priced carbon, the price has often been too low to cause major GHG reductions, and has usually been implemented in a portfolio alongside other policies, such as regulations, subsidies, public direct investment, and information programs.
Since the Paris Agreement in 2015, governments have continued to grapple with implementing and increasing the stringency of their climate policies. As such, they might benefit from comparative studies that show how carbon taxation efforts can differ between countries that in other respects are quite similar. Such comparative analysis of carbon taxation can contribute to the identification of pros and cons for different practices and inform our understanding of the conditions under which carbon taxes may be successful. This could help policy makers in assessing the relative importance of factors such as social acceptance of a policy tool such as a carbon tax, the degree of public trust in government, the fossil fuel endowment of a given jurisdiction, key trade relationships, the combination with complementary climate policies, and the design details of the carbon pricing policy.
Sweden, France, and Canada are the countries that have made the greatest efforts to introduce carbon taxes and provide an interesting contrast in terms of their experiences over the past three decades. All three are comparatively wealthy countries, with strong public awareness of climate change and broadly-accepted political commitments to GHG reduction targets. Yet, these countries have had quite different experiences with carbon taxation. In this paper, we compare the history, politics, and effectiveness of carbon taxes in these countries to identify and discuss some of the reasons for these different experiences, in hopes that this comparative analysis will provide valuable lessons on how to achieve better success in the future with carbon taxation, and indeed all GHG reduction policies.
2. Economic Growth, Energy Consumption, and CO2 Emissions: A Tale of Three Countries
This section briefly presents the background and data to observe the decarbonization (Table A1) trends before and after the introduction of carbon taxation. This will help us understand how taxes and related policies may work as complements in the decarbonization process. Our set of three countries—Sweden, France, and Canada—indeed illustrate the diversity in the long-term patterns of evolution of economic growth, energy consumption, and CO2 emissions. Against the background of these trends, an in-depth analysis is made of carbon taxation in the three countries in the following chapters.
2.1. GDP Growth and GHG Emissions
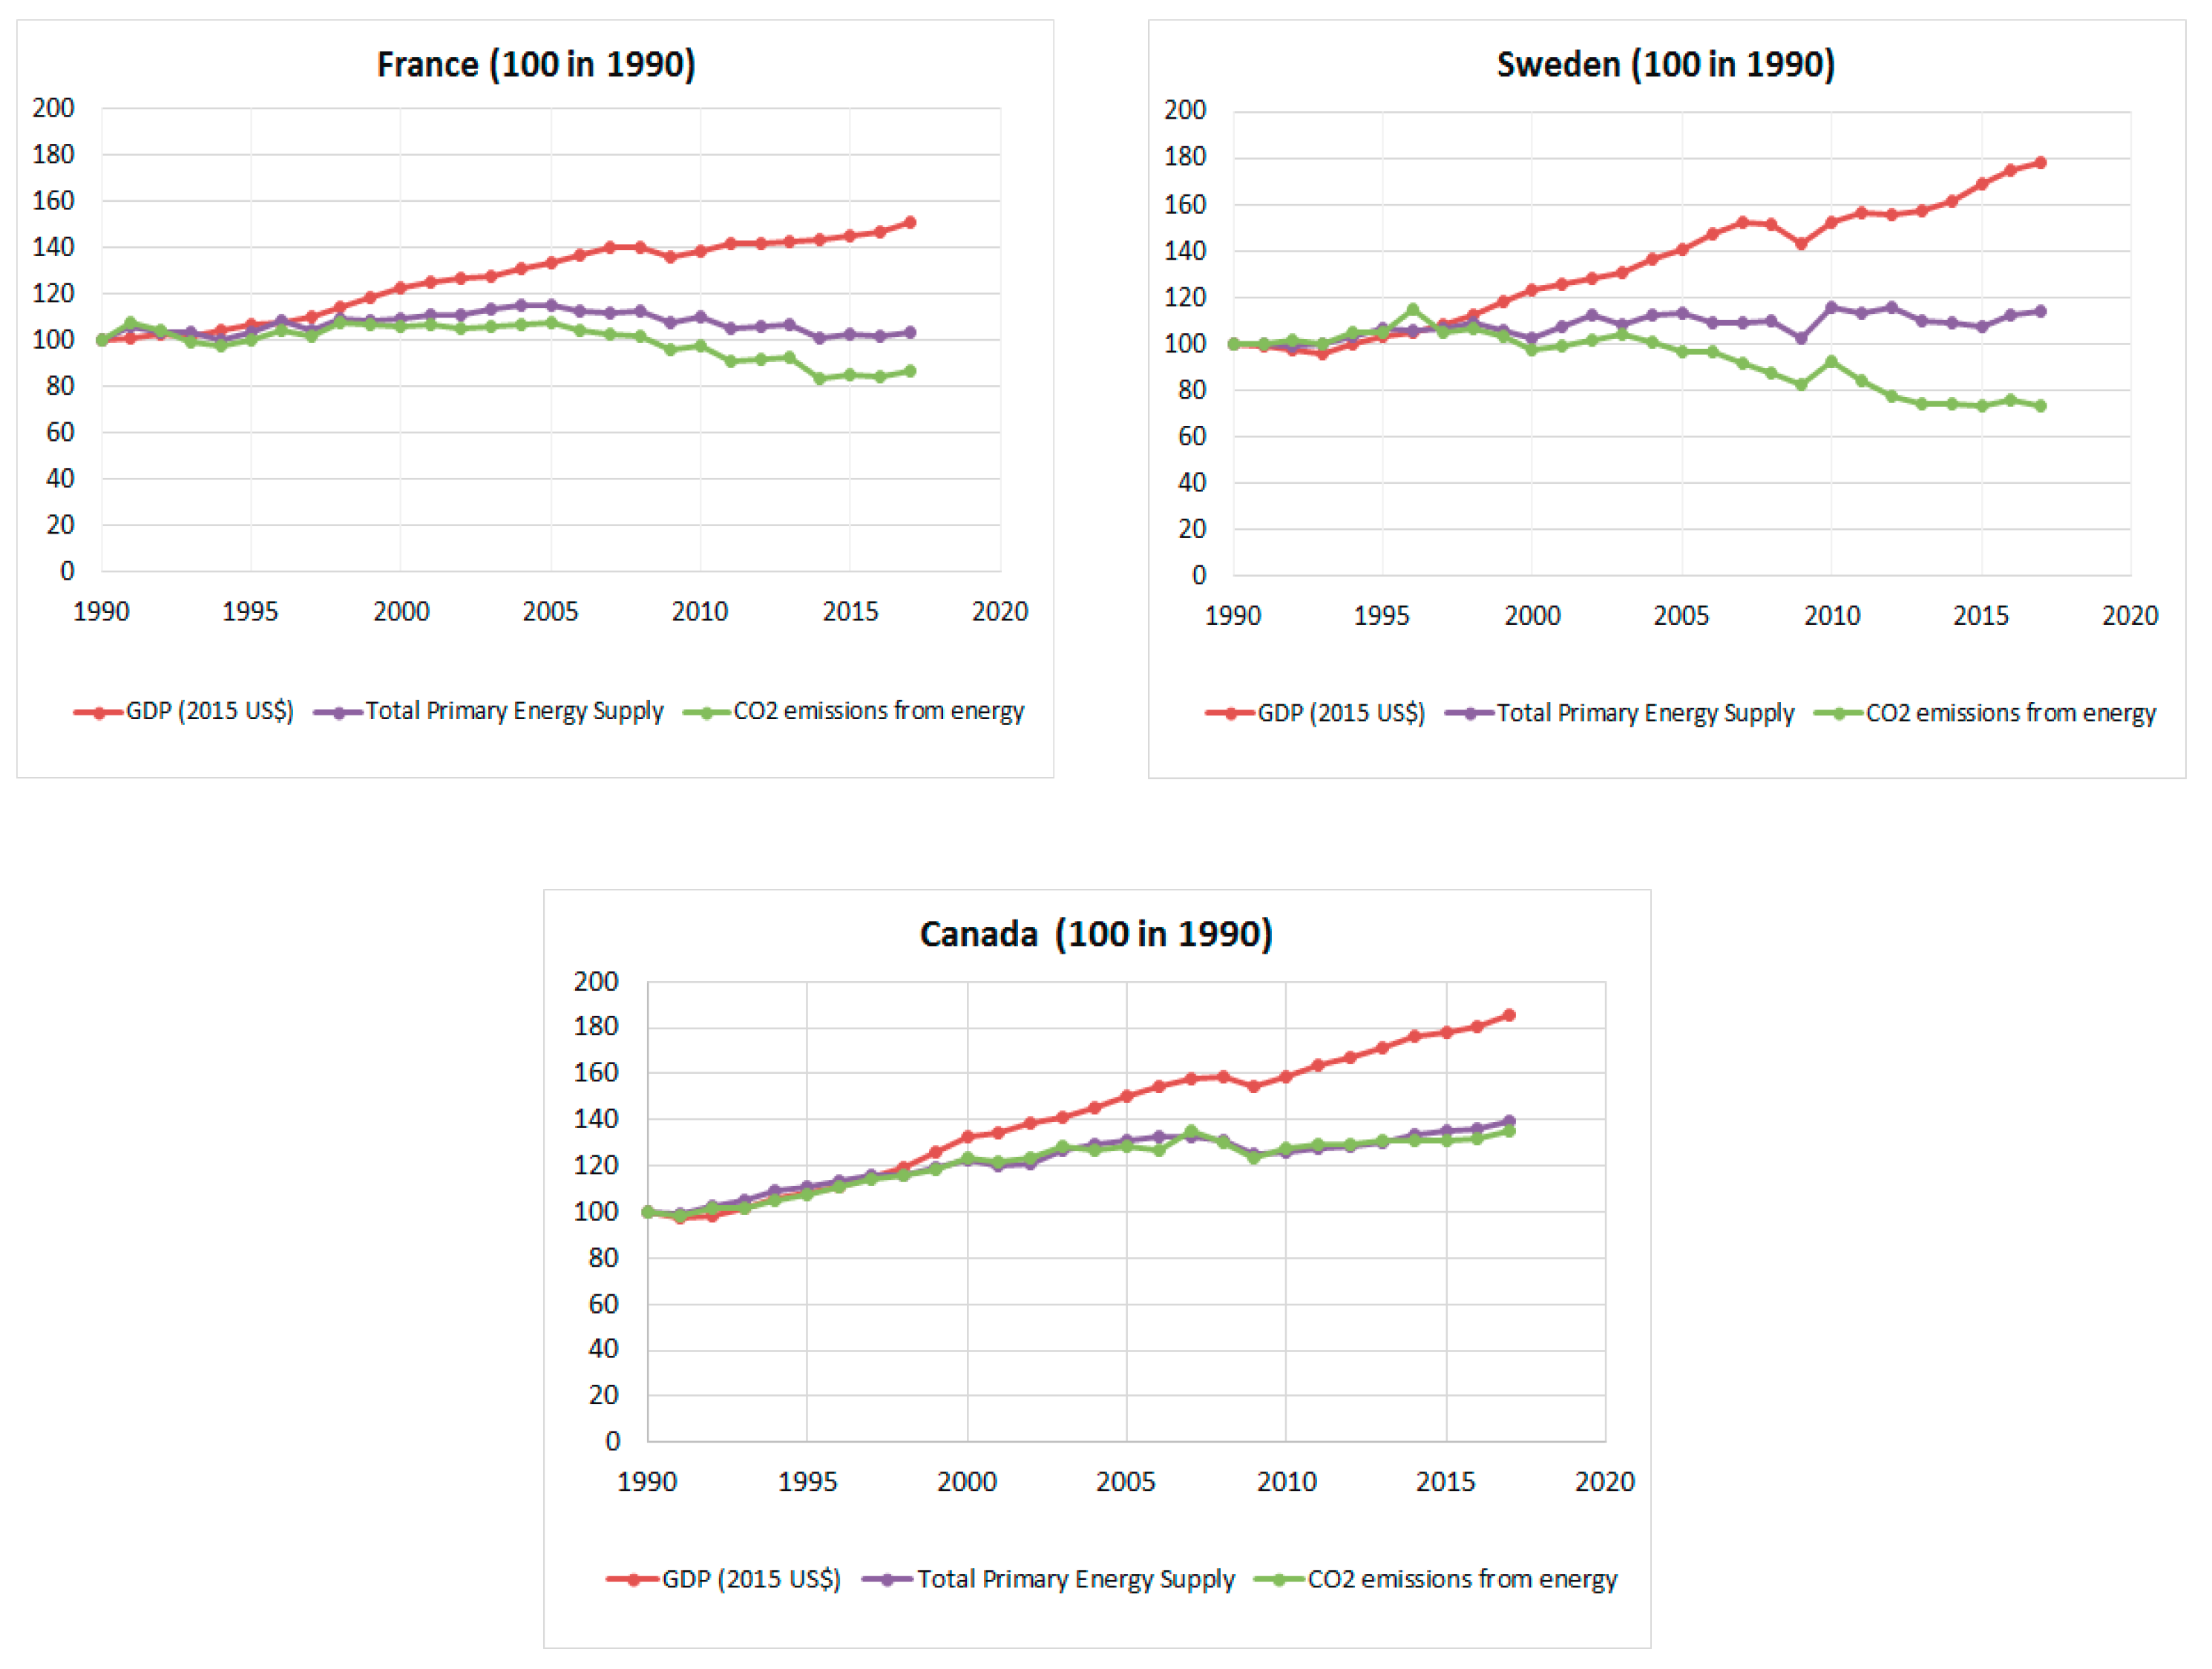
When one considers the relative dynamics of CO2 emissions and GDP growth since 1990, often considered as the starting date for climate policies, the situation stands as below (Figure 1): France has experienced a slow economic growth (1.5%/year, i.e., +51% from 1990 to 2017) and moderate reductions in energy-related emissions (−13%); Sweden benefitted from a higher economic growth (2.2%/year, i.e., +78%) and significant emission reductions (−26%); Canada experienced the highest nomic growth rate of the three countries (2.3%/year, i.e., +86%), but their emissions increased by a significant amount, although in a lesser proportion than GDP (+36%).
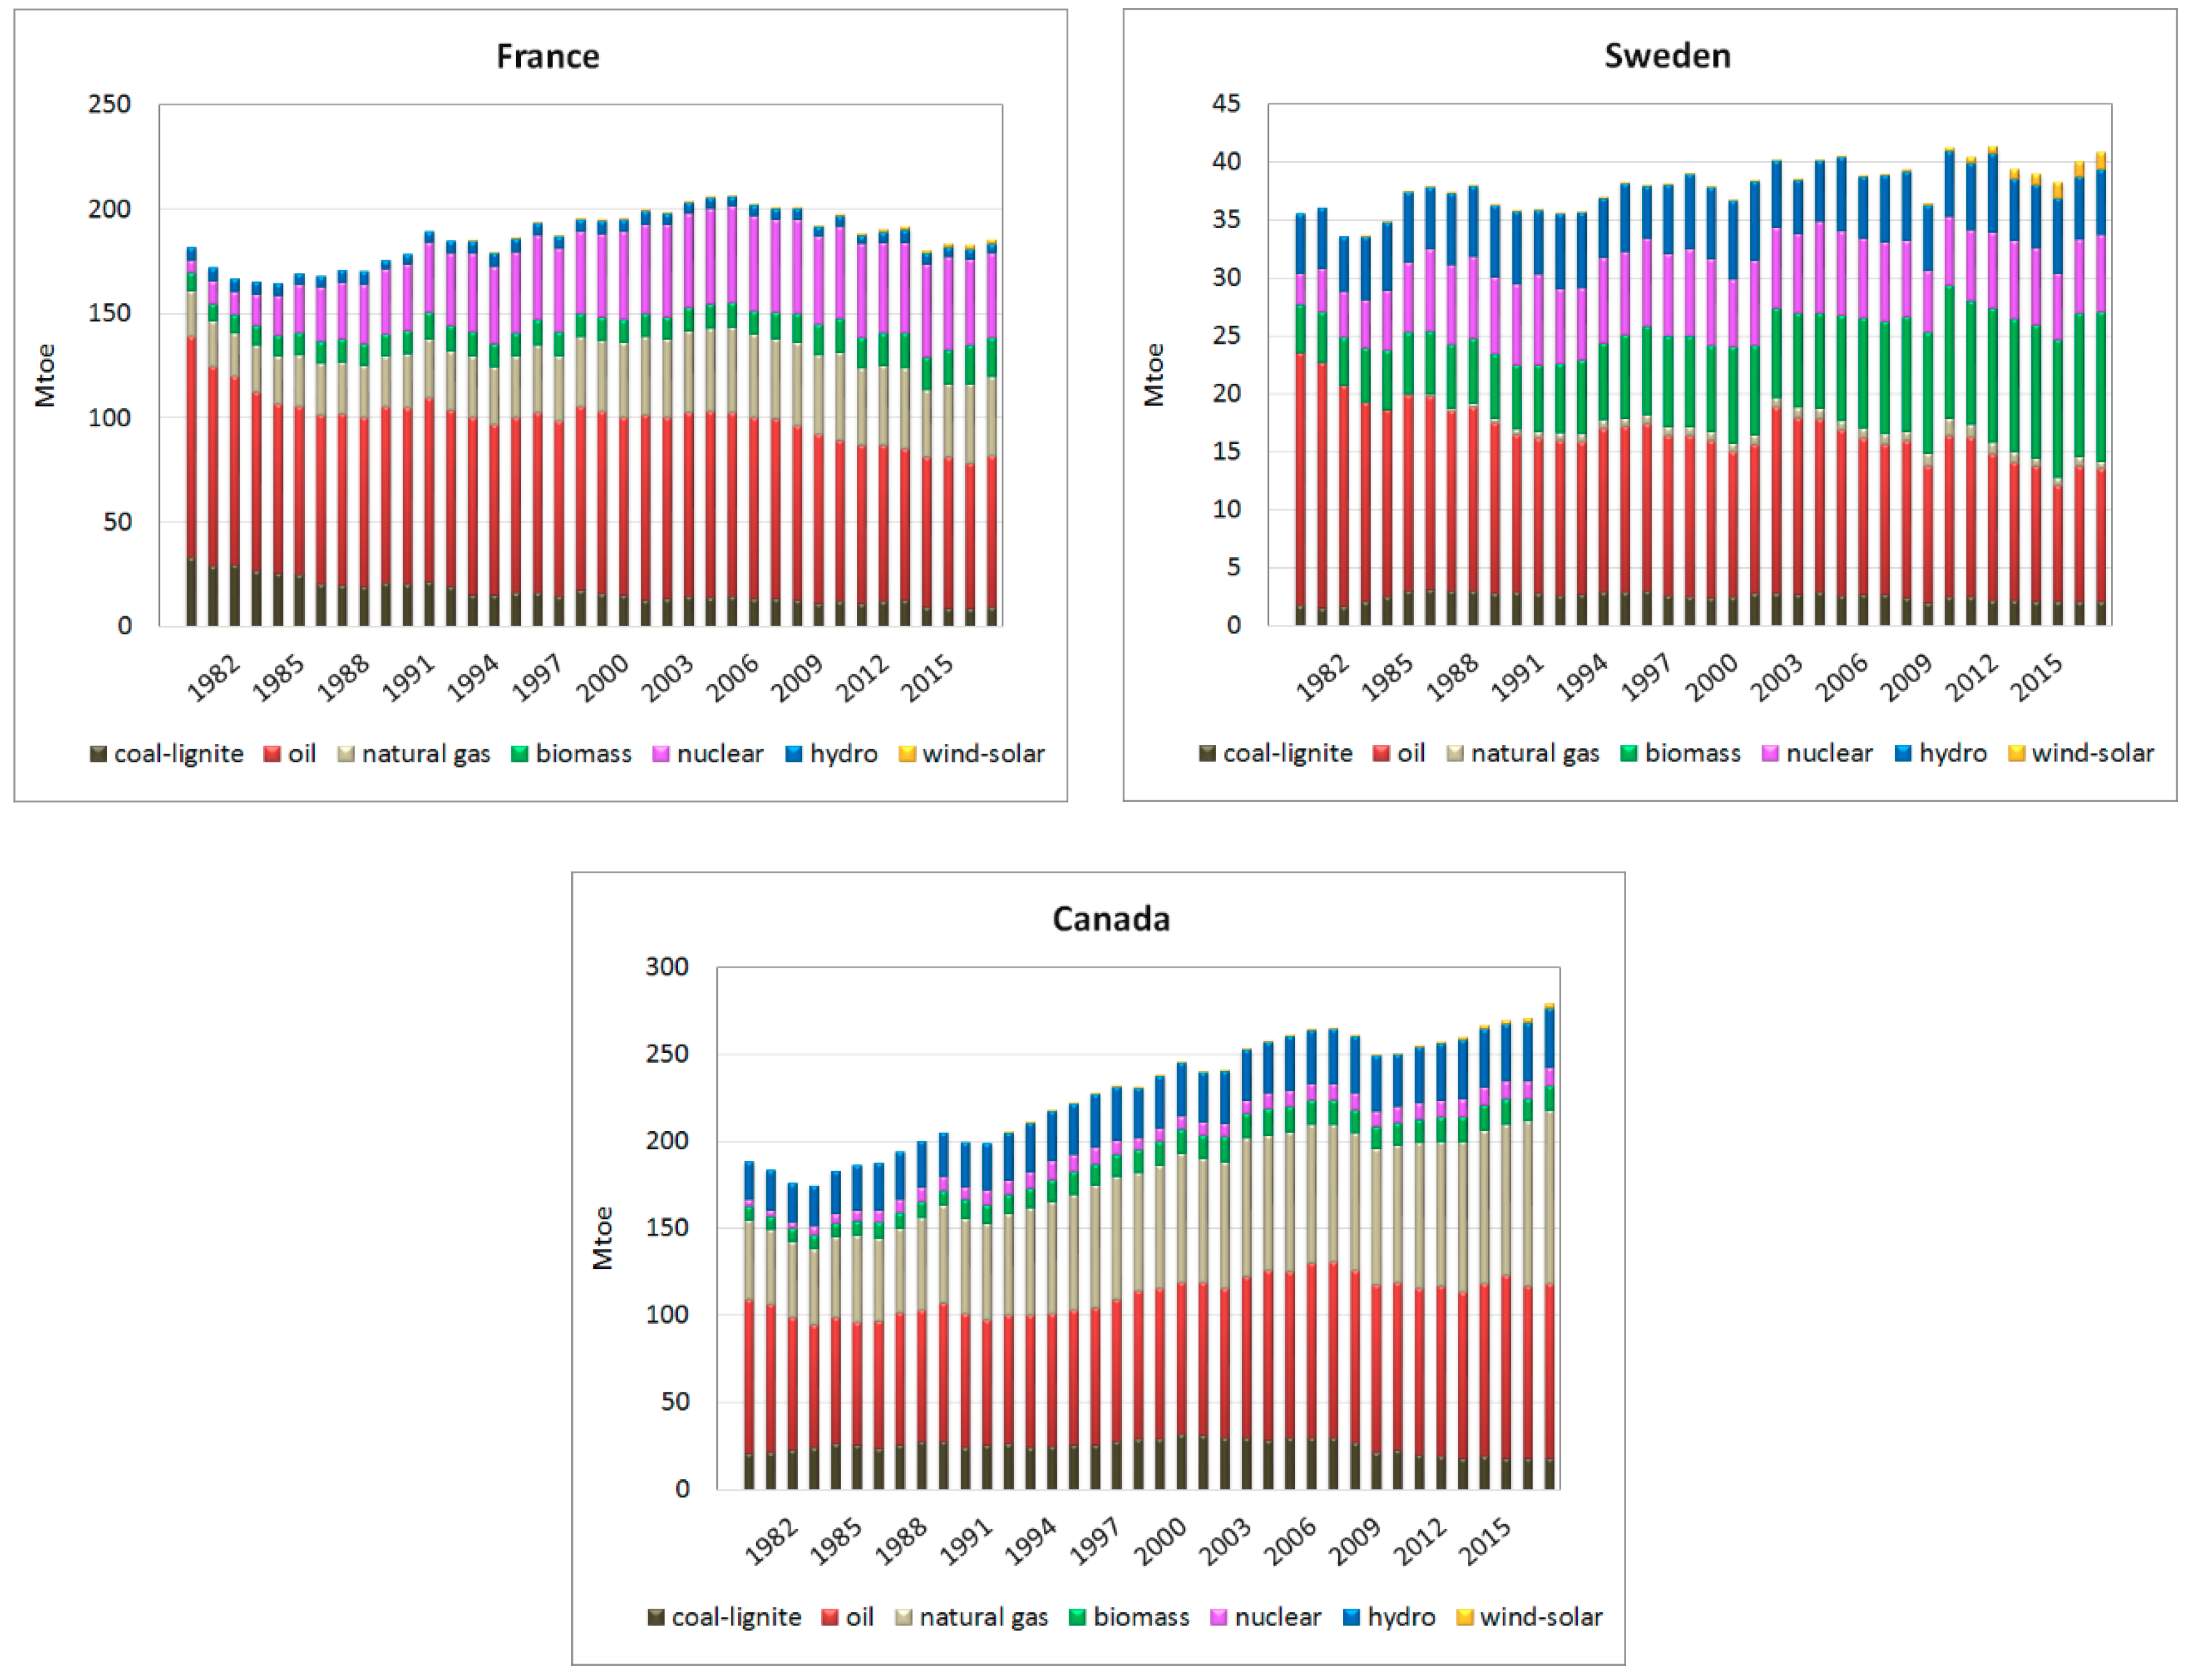
In the three countries there has, thus, been a clear decoupling of CO2 emissions, but in different proportions and with different outcomes. This is explained by the proper dynamics of energy consumption and of the primary energy mix in each country (Figure 2). Part of the decoupling of CO2 emissions could also be explained by deindustrialization and increased imports of energy-intense goods over the period. However, this phenomenon has relatively little importance for the development and is, thus, not really central to the analysis here.
2.2. Total Primary Energy Supply
In France, the post-oil-shock energy policies triggered the launching of an ambitious nuclear power program, starting in 1974. This program resulted in a rapid increase of nuclear-based power, with the entry into production of the first nuclear plants soon after 1980 and a total of 63 Gigawatt electrical (GWe) installed in 2019. This allowed in the following decade a considerable reduction of the consumption of coal and oil in thermal power plants and the corresponding CO2 emissions (−22 %). Between 1990 and 2005, coal and oil consumption stabilized, while natural gas consumption increased. As a result, emissions slightly increased over the same period in spite of the supplement of nuclear power. In 2005, total energy consumption peaked, with the global picture changing afterwards.
From 2005 to date, total primary energy and CO2 emissions have decreased by 10% and 15%, respectively. Four groups of factors explain these evolutions: consumption saturation effects (even electricity consumption has stabilized), oil and gas price increases, the 2008 economic crisis and its aftermaths, and finally the introduction of new climate policies (the 2005 Energy Act targets a 75% reduction in emissions by 2050 and identifies corresponding policies and measures). However, it is still difficult to decide the relative weight of these different factors. Furthermore, the most recent data show that CO2 emissions ceased to decline in 2016 and 2017. This has introduced a controversial issue in French energy policy: the assumed insufficient action of the State in the deployment of the so-called “energy transition”.
In Sweden, the energy situation at the start of the observation period was still largely dominated by the weight of oil, which alone represents 61% of TPES at that date. In the 70s, similarly to France, Sweden launched a large nuclear program with 12 reactors, of which eight are still in operation today, representing 35%–40% of electricity production. The introduction of nuclear power explains the first wave of CO2 emission reductions from 1980 to 1990 (Figure 1). The second major change in Sweden’s energy system was the continuous development of biomass energy, particularly for use in district heating systems. The absolute amount of biomass has tripled between 1980 and today, from 4 to 12 million tonnes of oil equivalent (Mtoe). This transition was incentivized by the carbon tax of 1991. Over the period under review, natural gas does not see any significant development, while the contribution of hydro energy is almost stable. As the total primary energy supply has increased only slowly and with strong cyclical variations, the combination of nuclear and biomass development has resulted in a decrease of oil consumption, which was halved in absolute terms and was brought down from the above mentioned 61% to only 28% in 2017. This explains the halving of total emissions between 1980 and today.
The energy profile of Canada is quite different from those of France and Sweden. Particularly, due to strong economic growth and to a lower level of energy/GDP decoupling, total primary energy supply (TPES) increased rather regularly at a non-negligible rate of 1.25%/year since 1990, while coal and oil consumption are similar in 1980 and in 2017. In spite of the increases in hydro, nuclear, and biomass, most of the increase in energy consumption was met by natural gas, the consumption of which has more than doubled. This massive development of natural gas is the main factor behind the 36% rise in total emissions over the period. Of course, analyzing the overall Canadian energy profile does not provide many relevant insights due to the huge differences in demand and supply patterns at the provincial level, as we explain below.
2.3. Carbon Intensity of Energy and Energy Intensity of GDP
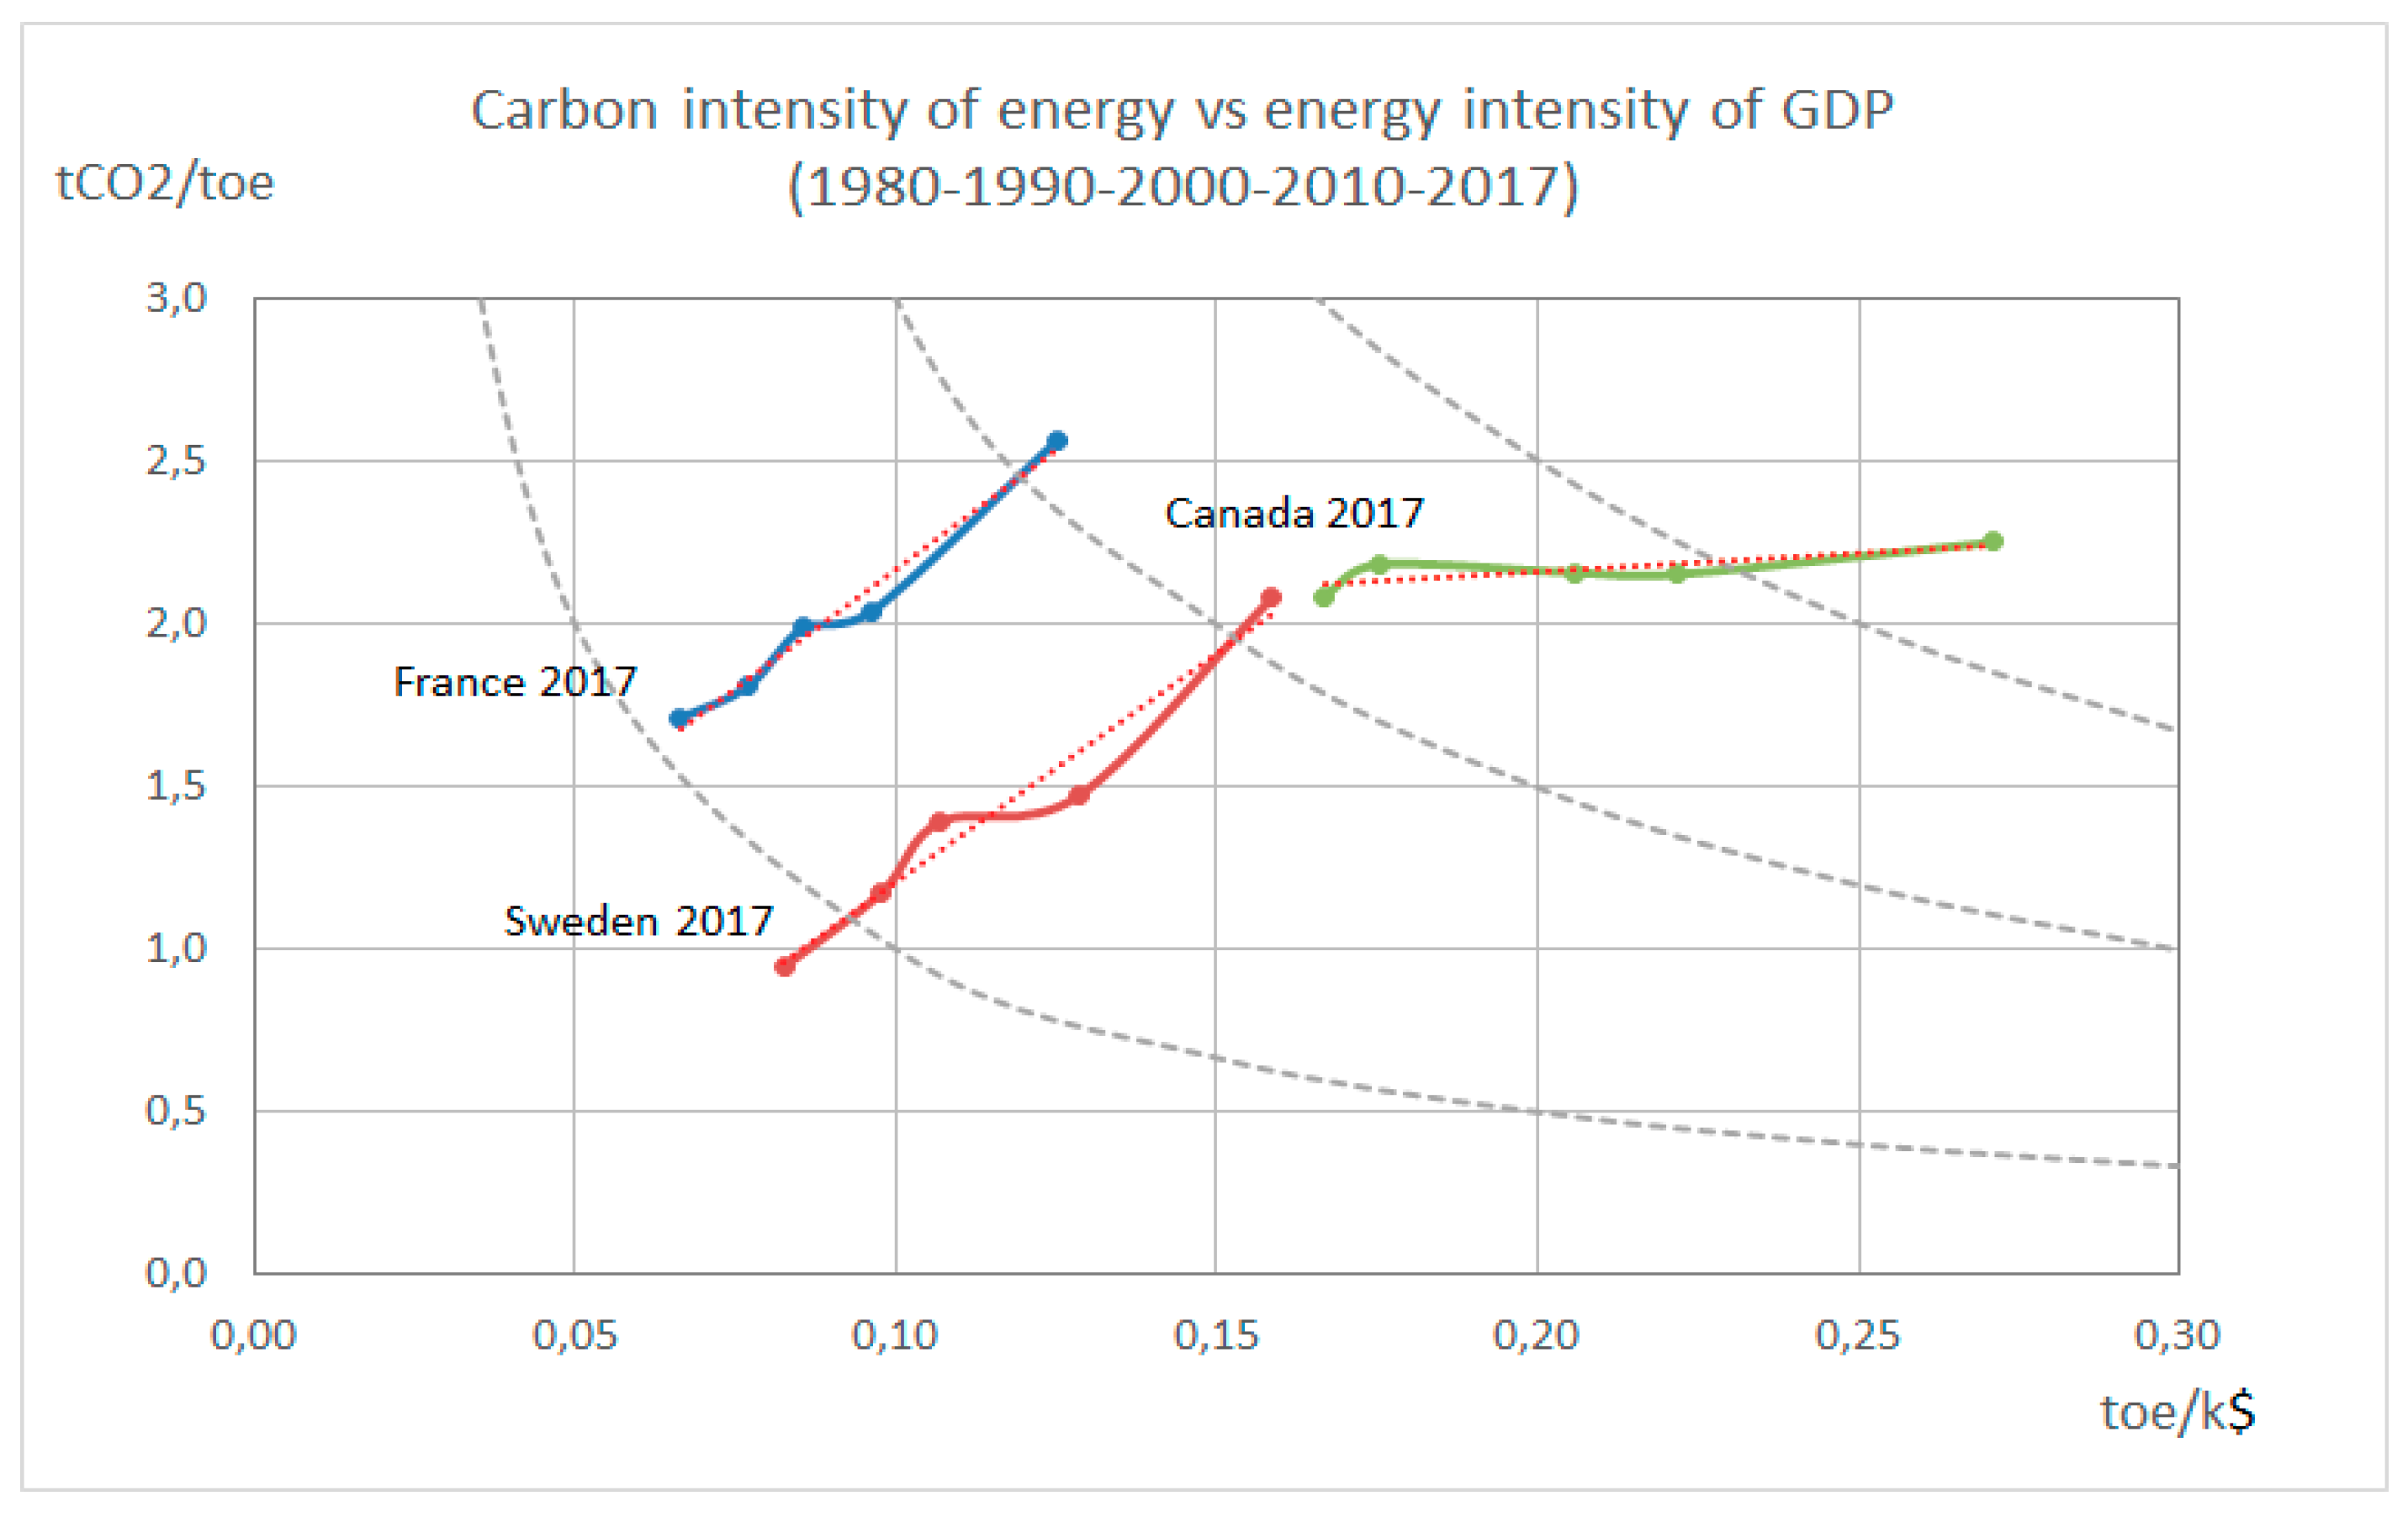
At this stage, it is possible to provide some elements of comparison for the decarbonization process that indeed took place in the three countries. For that purpose, one can compare the changes observed in the energy intensity of GDP and in the carbon intensity of energy, the combination of which allows us to explain aggregate changes in the carbon intensity of GDP, as a measure of the decarbonization of the economy, by a simple Kaya-type equation: CO2/GDP = (CO2/E) × (E/GDP).
The decarbonization trajectories followed by the three countries over the last four decades are illustrated in Figure 3. The first remark is that the 1980s, which immediately followed the two oil shocks, already showed strong reductions in the emission intensity of GDP in the three countries. In Sweden and in France, it was also a decade of rapid decarbonization of the energy mix, mostly due to the rapid deployment of nuclear energy. As a result of post-oil-shock policies in both countries, about half of the progress in GDP decarbonization—from more than 0.3 tCO2/k$ in 1980 to about 0.1 tCO2/k$ in 2017—was accomplished in the decade spanning 1980–1990.
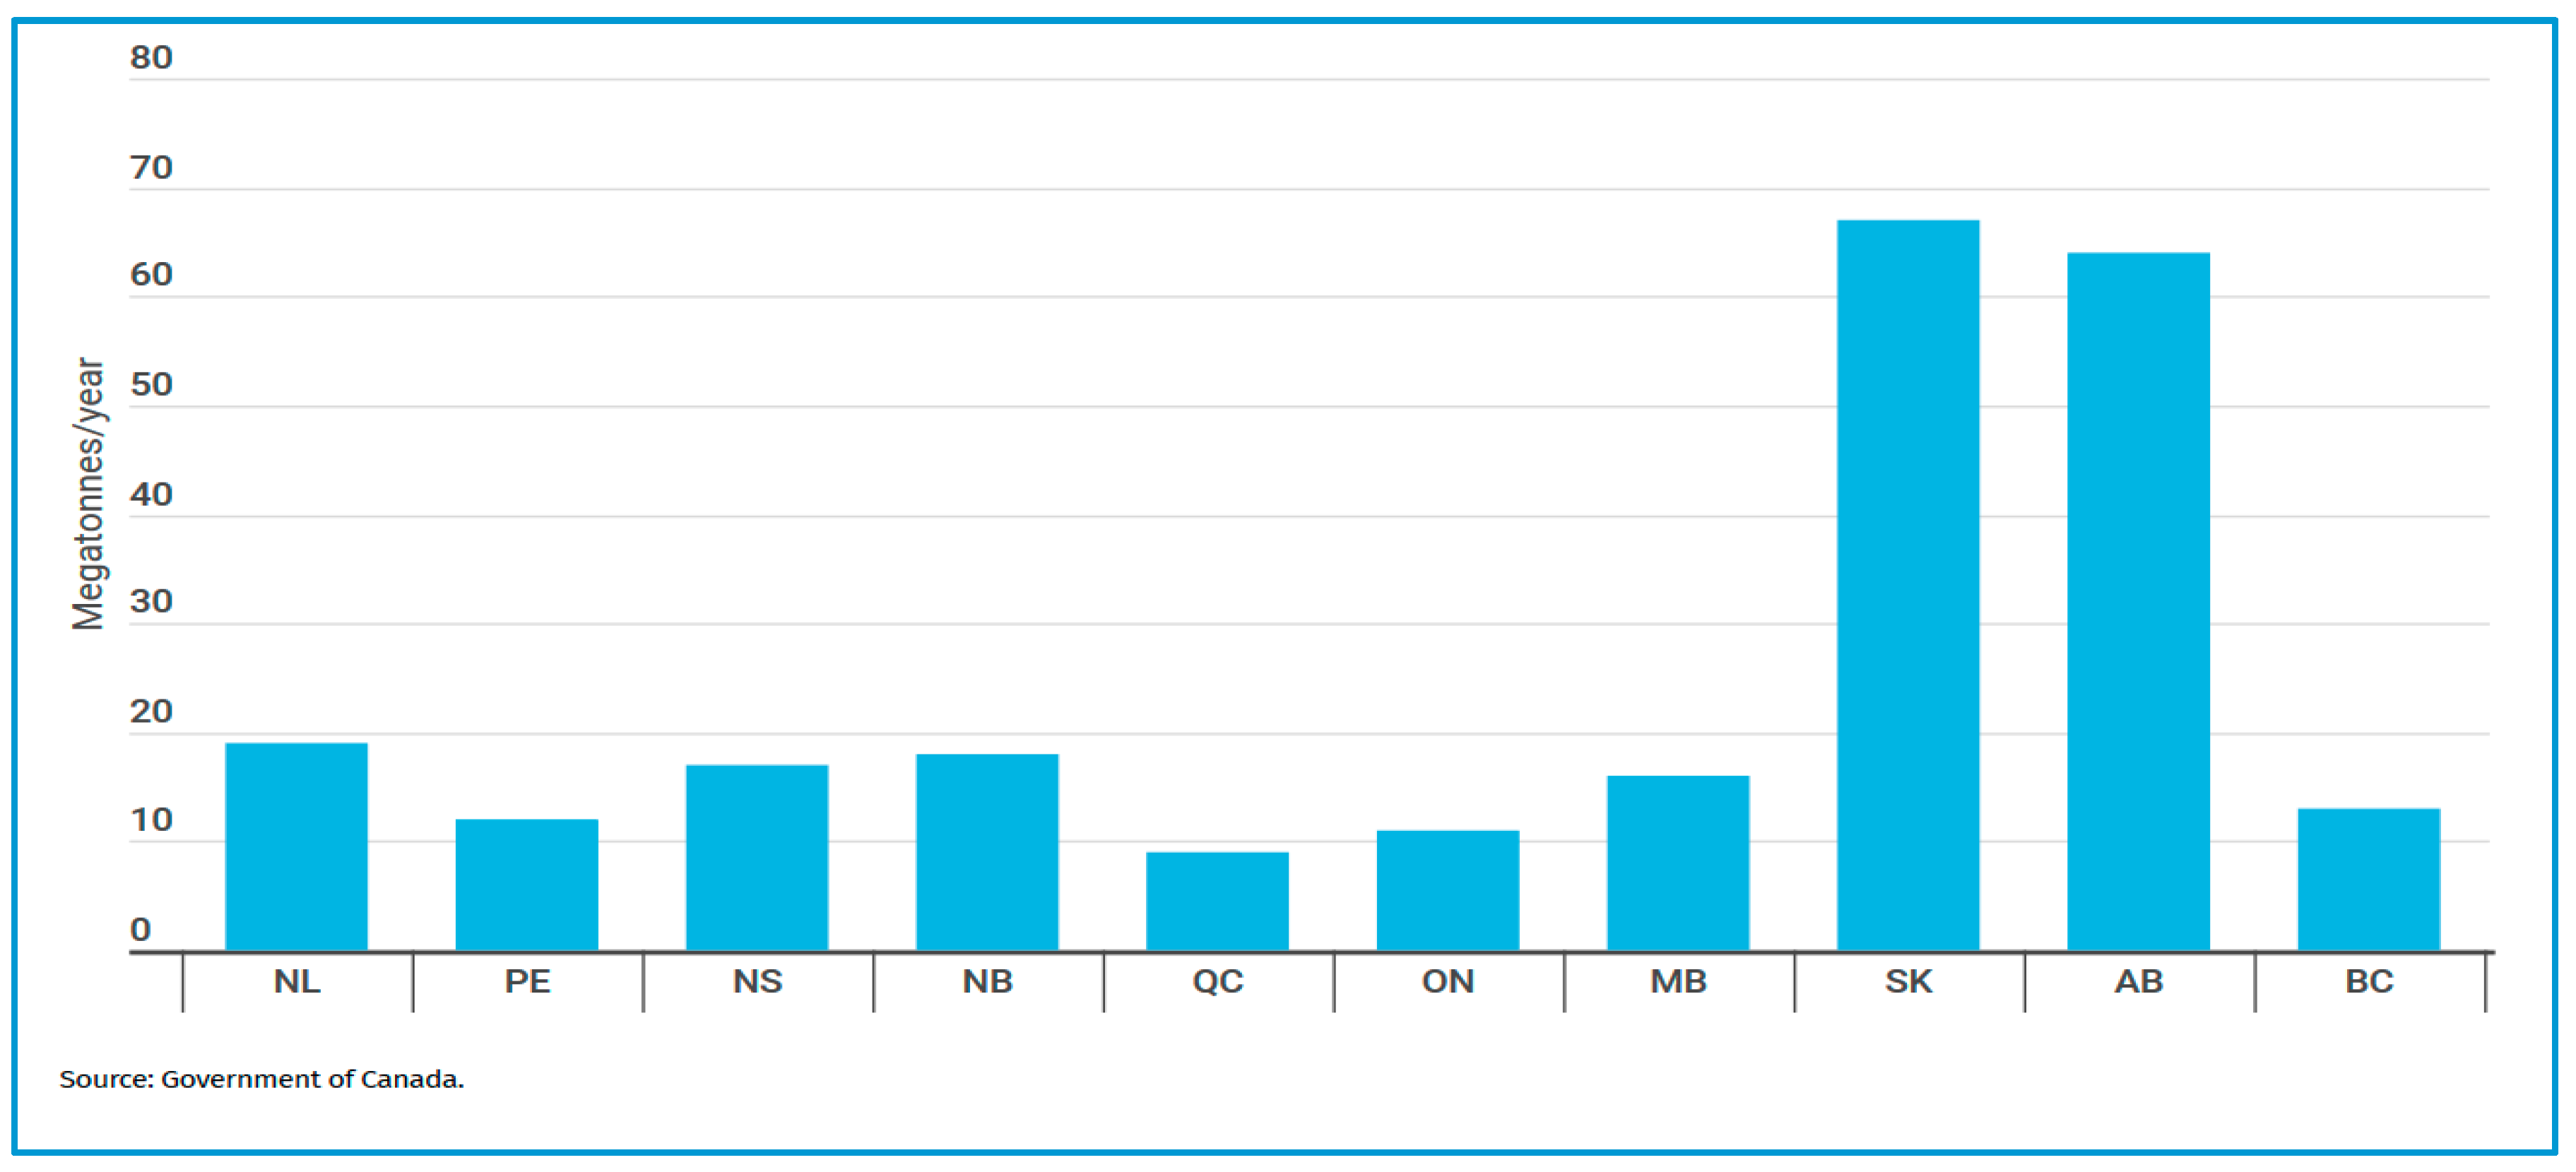
Sweden shows a balanced profile, with comparable reductions in the carbon intensity of energy and energy intensity of GDP. The same applies to France, although the reduction in energy intensity is slightly more important than the decarbonization of energy. In Canada, most of the decarbonization was obtained by the reduction in energy intensity of GDP, with a hardly noticeable reduction in carbon intensity of energy. Being regionally diverse in its fossil fuel resource endowment, Canada’s aggregate result indeed masks very different regional developments. In particular, one should distinguish the provinces of Quebec and Ontario on the one hand, and the fossil-fuel-rich provinces of Alberta and Saskatchewan on the other (Figure 4). Together, Quebec and Ontario account for 23 million out of Canada’s total population of 37 million, and their per capita emission level at near to 10 tCO2e is much nearer to that of France or Sweden than the aggregate Canadian pattern.
3. The Carbon Tax in Sweden
The carbon tax was introduced in 1991 at a rate corresponding to 24 € per ton of carbon dioxide, and has gradually been increased. As of 2019, it is SEK 1180 (115 € at exchange rate as of January 1, 2019). By increasing the tax level gradually, households and businesses have had time to adapt, which has improved political acceptability. Tax revenues are not earmarked, as the spending of the revenues is decided in the normal annual budget process, which in that way deals with the distributional consequences.
As might be expected, since the tax has been in place it has had the expected effect of incentivizing agents to reduce carbon emissions. Although there are some difficulties with definitive attribution, carbon intensity has fallen as expected. Generally, the carbon tax has worked smoothly and not triggered greater opposition than other taxes. The bigger question is perhaps why it succeeded in Sweden and how readily this experience can be transferred to other countries.
3.1. Context to the Politics and History of Carbon Taxes in Sweden
Indeed, the introduction of carbon taxes in Sweden was possible thanks to some special features. Sweden has for a long time been a high-tax country. In the 1970s, marginal income taxes reached 90%. In the major tax reform of 1990/91, the dominant concern was lowering these rates. The second priority was other progressive taxes on wealth, inheritance, and property, which were reduced or abolished. The reform was a considerable simplification of the tax system, which was very popular. There was general agreement on not cutting too much of the “welfare state” (i.e., the state expenditures) nor revenues. The solution was to broaden tax bases, reduce deductions, lower direct tax rates, and increase indirect taxation. In this context, the carbon tax was not a big problem and it was rather perceived as part of the solution.
Sweden has no fossil fuel resources, no big fossil-fuel-producing companies, and much less anti-climate lobbying. Furthermore, it has a harsh climate and a concern for dependency on imported fuels. These factors have favored policies for energy efficiency, biomass use, collective solutions for urban heating and public transport, and again high taxes. Two other features may have been important in the actual implementation of the carbon tax: first, a relatively high degree of trust in the political system, and second, a skewed distribution of industrial size, with a small number of very large firms (Asea Brown Boveri-ABB, Volvo, IKEA). Finally, whereas in many countries the concern with a carbon tax is the increase in general taxation, in the Swedish case the total tax pressure as a percentage of GDP fell from over 50% in 1990 to 44% in 2018.
3.2. Carbon Pricing Experiences in Sweden
3.2.1. Development of the Carbon Tax Rates
The CO2 tax was introduced in 1991 on all major fossil fuels at rates equivalent to 27 €/tCO2. At the same time the energy tax rates were reduced by 50 %, which still meant an increase for all fuels (although the increase varied in magnitude between fuels). To some extent, one could call part of the tax rise in 1991 a re-labelling, but overall this was still a pioneering (and very high) level of taxation on fuels compared to other countries.
The CO2 tax rates have over the years been gradually but substantially increased, with the purpose of achieving cost-effective emission reductions, while still giving households and companies time to adapt. Tax increases on energy and carbon have been combined with reduction of other taxes, with the stated purpose of avoiding increases in the overall level of taxation, addressing undesirable distributional consequences, and stimulating job growth.
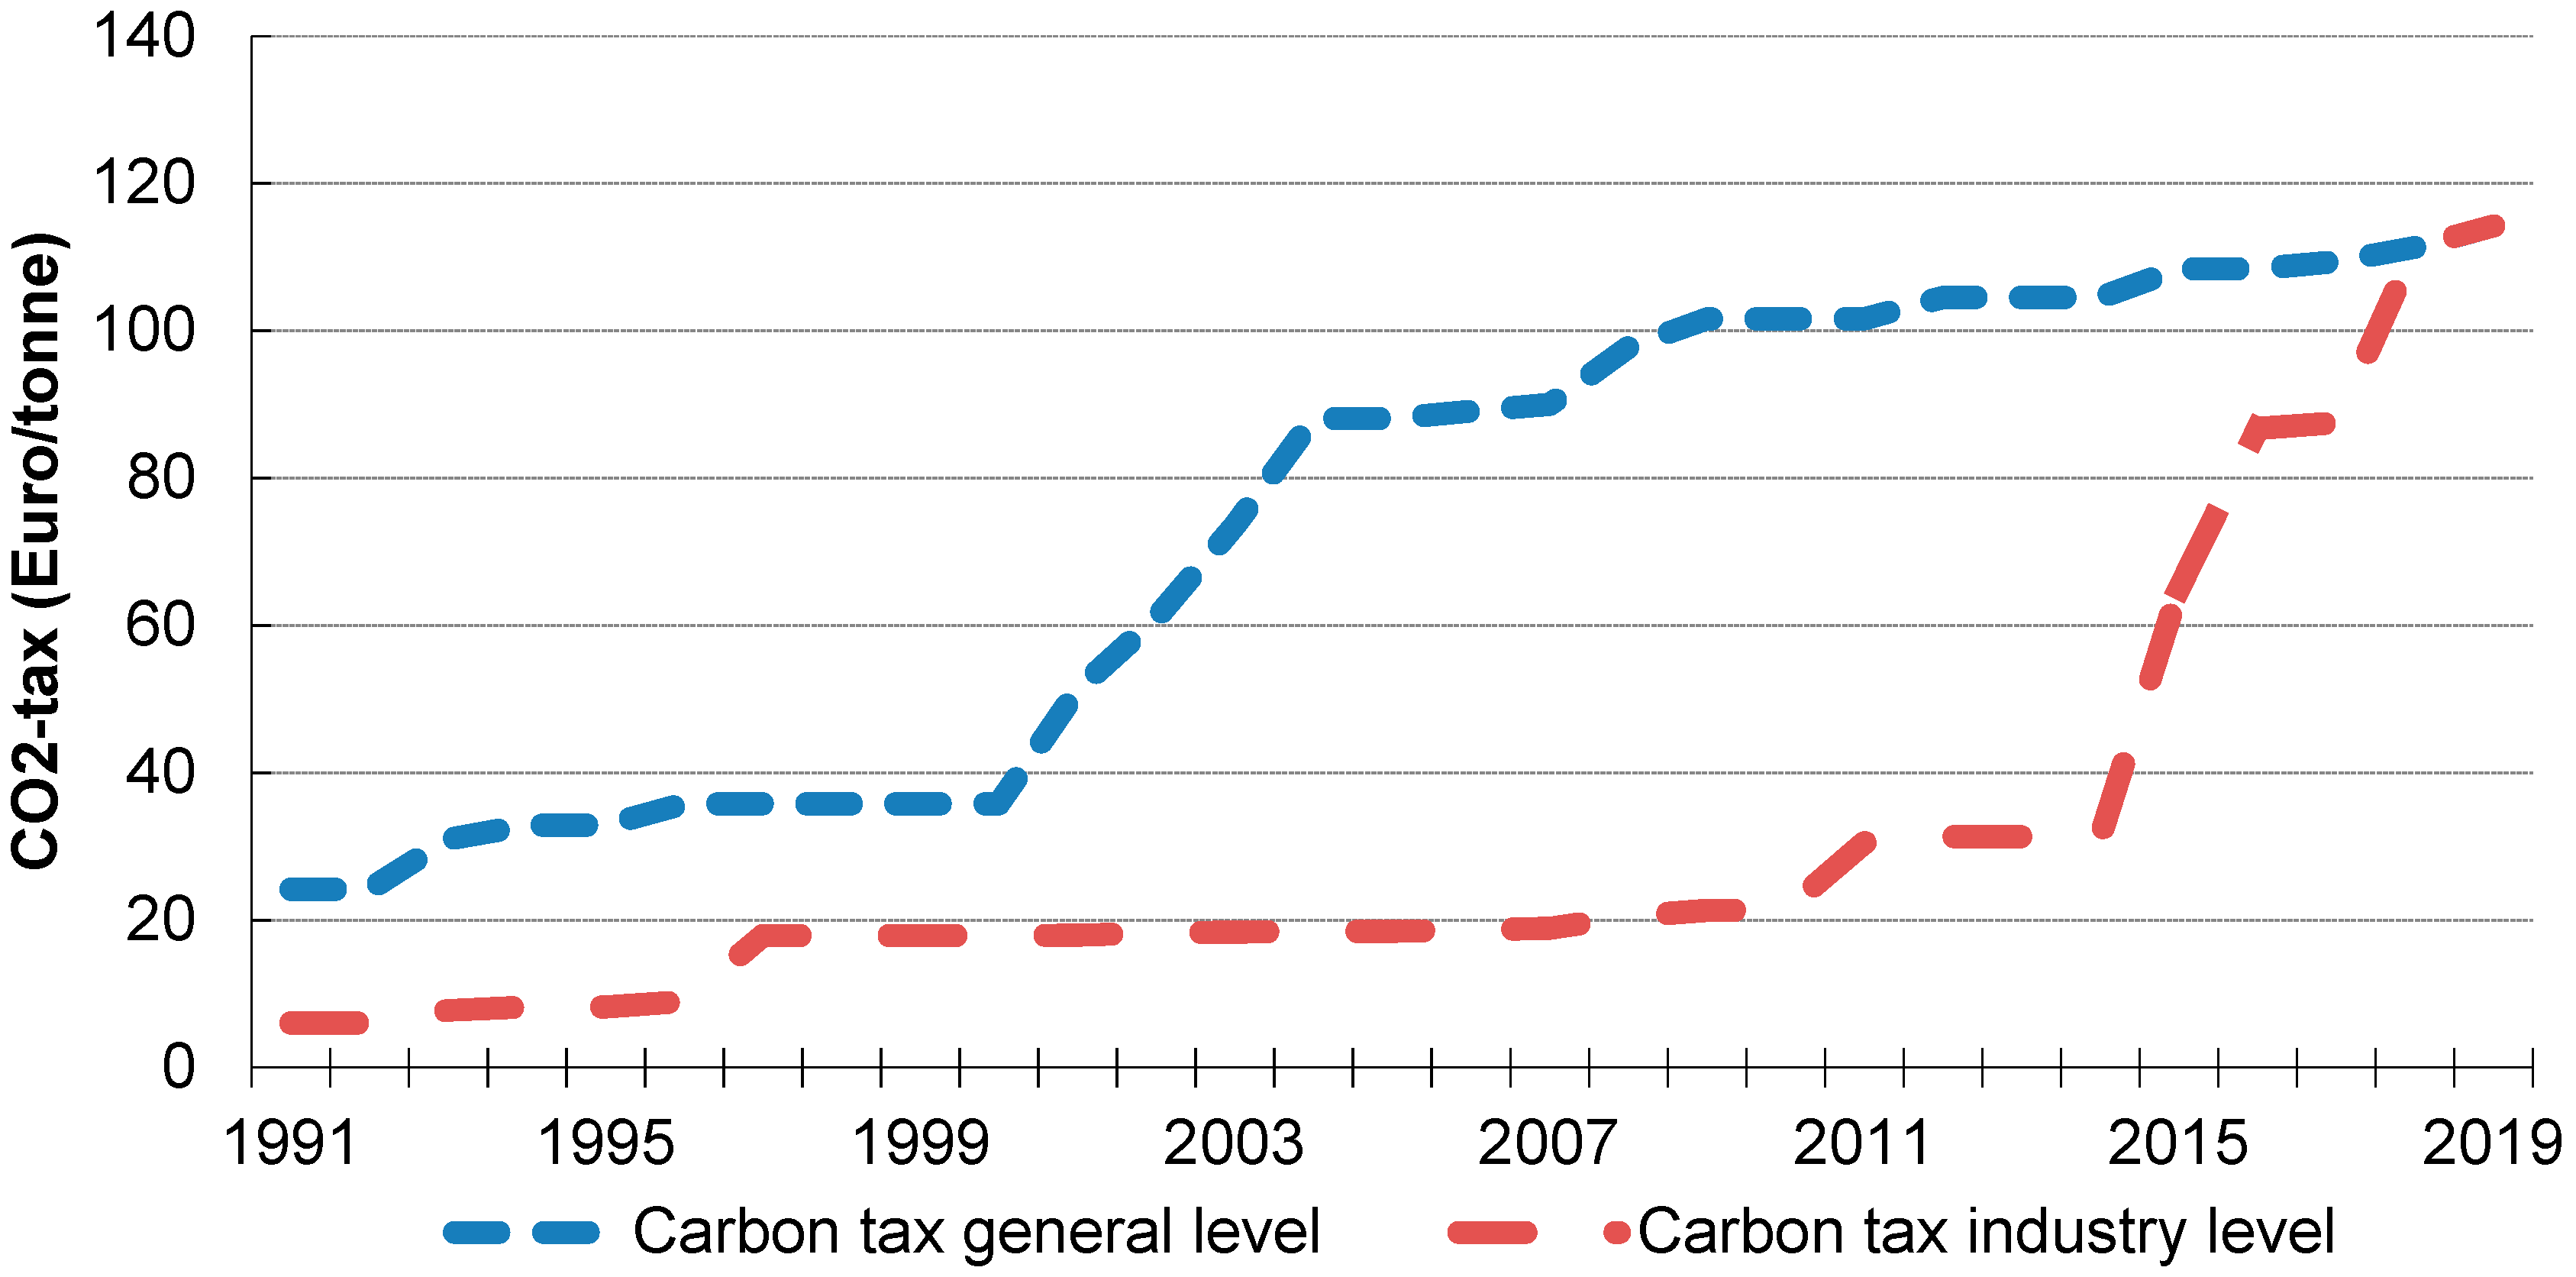
An essential aspect when designing the energy taxation system has been to strike a balance between fulfilling environmental objectives and accounting for the risks of carbon leakage (which in turn is related to securing the competitiveness of certain sectors that are subject to international competition). As mentioned above, Sweden is a very small open economy with a small number of large and quite easily mobile companies. Trade-exposed sectors, mainly in industry, were, therefore, initially taxed at a considerably lower rate than households (see Figure 5 for the development of the two tax levels). Today, these industries are assumed to have had enough time for adjustment and the environmental motive has become stronger over time, so now virtually all the exceptions and lower rates have been abolished.
Motor fuels used in vehicles are basically taxed according to the general CO2 tax level. The sharp increase of CO2 taxation between 2000 and 2004 was, to some extent, offset by a reduction of the energy tax as far as motor fuels were concerned. The CO2 tax proportion of the total tax on fuels (energy tax and CO2 tax) was heavily increased. On the other hand, the sharp CO2 tax increase was not combined with energy tax cuts on heating fuels used by households and services. Note that the energy tax and CO2 tax should be seen in combination, as two tax components rather than as two separate taxes. Sweden has been using these taxes as instruments to support various policy objectives. Apart from raising revenues, the energy tax takes account of other external effects than CO2 emissions (such as noise, congestion, and road wear from traffic) and also acts as a way of generally stimulating energy efficiency.
In 2009, the Swedish Parliament adopted a number of tax changes in the climate and energy area that entered into force in steps throughout the period 2010–2015. The purpose was to increase the transparency and efficiency of the taxes in the area of climate and energy policy. From 2011, the energy tax on heating fuels became strictly based on the energy content of the products. As for heating fuels used by industry not covered by the European Union Emissions Trading Scheme (EU ETS), the lower level of the CO2 tax was raised to 30% of the general level in 2011 and has since been gradually raised. As of 2018, the industry tax level outside the EU ETS is the same as the general tax level.
There is a constant pressure from lobbyists to create exceptions to the carbon tax for fishermen, smaller diesel trains, farmers, large computer servers, and greenhouses. Very often arguments are made that a particular industry is threatened, that taxes are lower abroad, and that the activity may be moved to neighboring countries and that there will be a loss of employment in sensitive areas. In spite of this, the number of exceptions and their level have generally been reduced as the governments have successively chipped away at various tax expenditures. Trucks in the mining sector was one of the most recent exceptions removed. There is now only one major exception and it is that Sweden was obliged to remove the CO2 tax within the industries that are part of the EU ETS cap-and-trade program, since it conflicts with the European Union principle against double taxation. In addition, there was little point in having national policies for those emissions that are regulated at the European Union level, since they only resulted in emissions moving within the EU ETS without affecting the total.
3.2.2. Effects of CO2 Taxation
The long-term aim of the Swedish Government is zero net emissions of greenhouse gases to the atmosphere by 2045. The carbon tax and other measures are intended to reduce greenhouse gas emissions and contribute to reaching the goals set.
It is not easy to draw firm conclusions from aggregate data about effects; this is a task that really requires detailed research for each industry and sector. Relatively little of such research appears to be available, although one study [6] found real reductions in those countries that have carbon taxes. Other studies examining the effect of carbon taxes are [7,8] for Norway, and [9] for the United Kingdom, finds that carbon taxes contribute CO2 reductions. In [10], the author concludes that the energy tax in Holland had a small but significant impact on household energy consumption. In [11], they find strong impacts on energy intensity from the United Kingdom’s Climate Change Levy (CCL), introduced in 2001, on manufacturing plants. In [12], the author estimates the mitigation effects of the carbon taxes of five European countries (Denmark, Finland, Sweden, Netherlands, and Norway), again finding some evidence that CO2 taxes were effective in reducing CO2 emissions. Several of these papers suggest that the mitigation effects are reduced due to tax exemption policies for energy intensive industries.
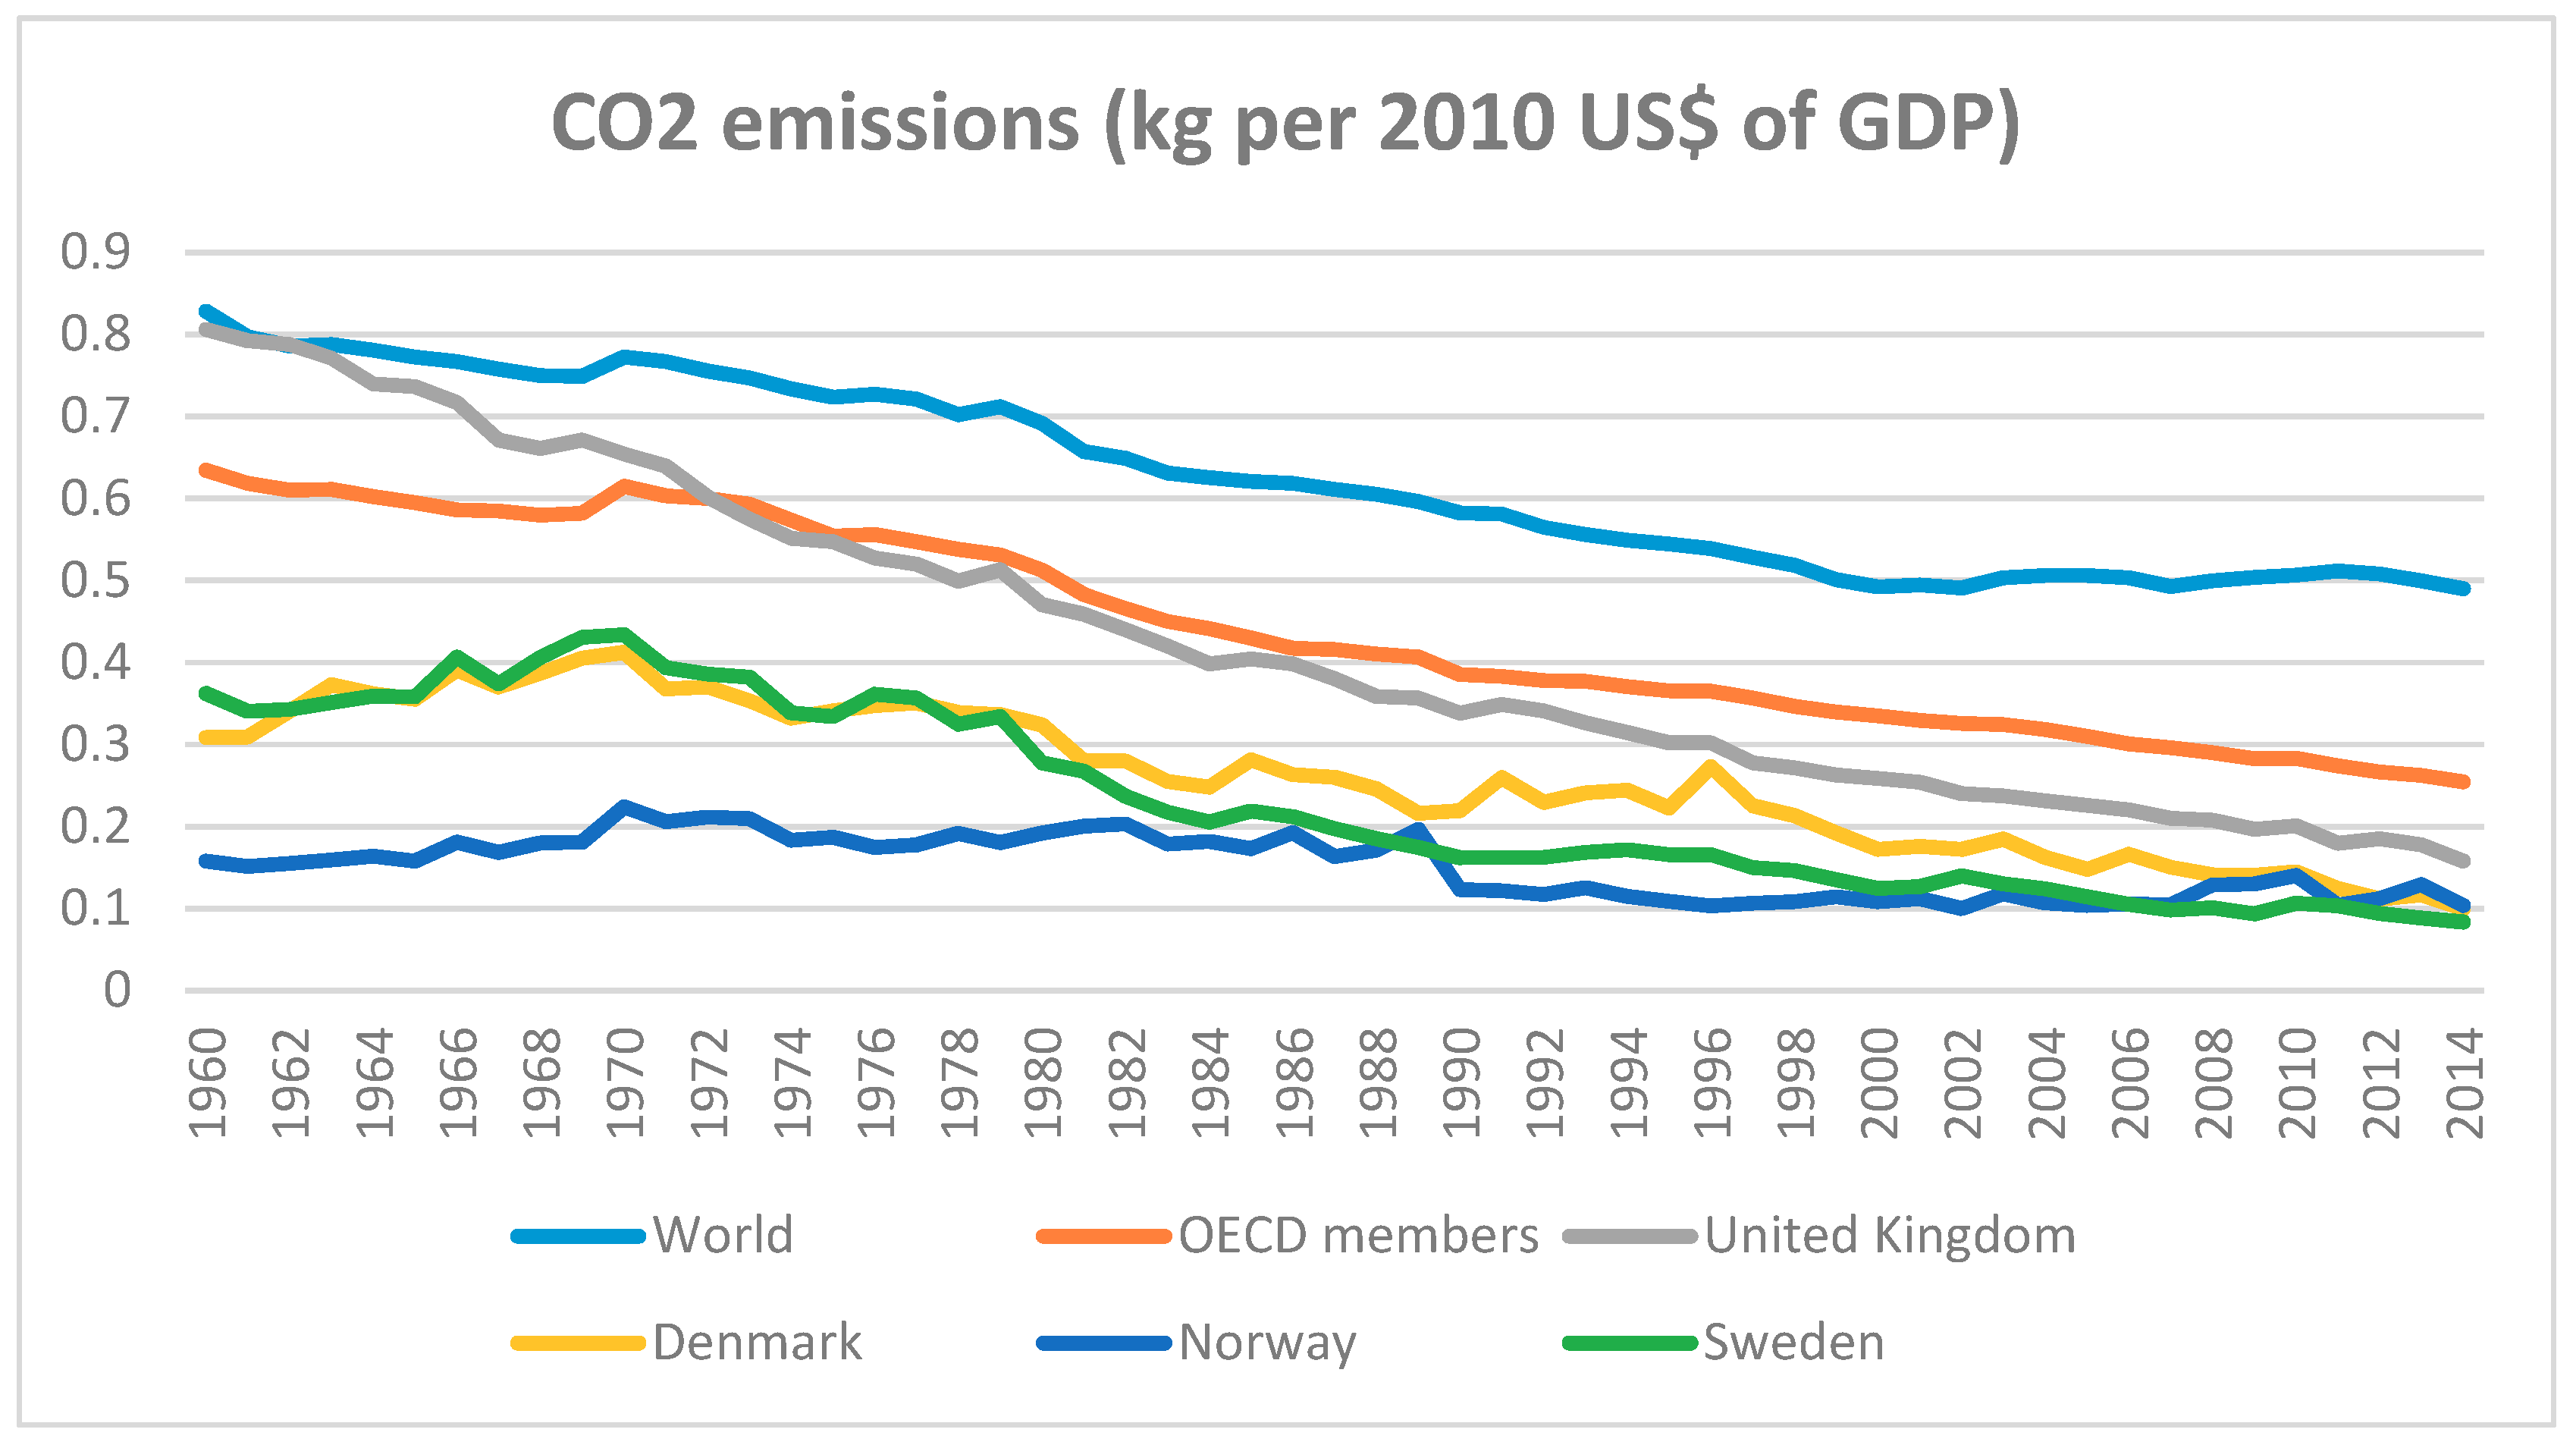
Actually, looking at carbon emissions and GDP, we find decoupling or decreasing emission rates in relation to GDP in most countries (Figure 6). However, Sweden has more rapid decoupling (in spite of having already low values in 1990). It is not easy to attribute this difference definitively to carbon taxes, as there are other policies and factors in each country that also contribute to the effects observed.
One important domain where we know that taxes have played a large role is in building heating. In spite of having a much harsher climate than most countries in Europe, Swedish buildings typically do not use more energy than their European counterparts. This is explained by tougher building standards, such as requiring more insulation and three-layer glass windows, as well as by the prominent role of district heating and its fuel mix.
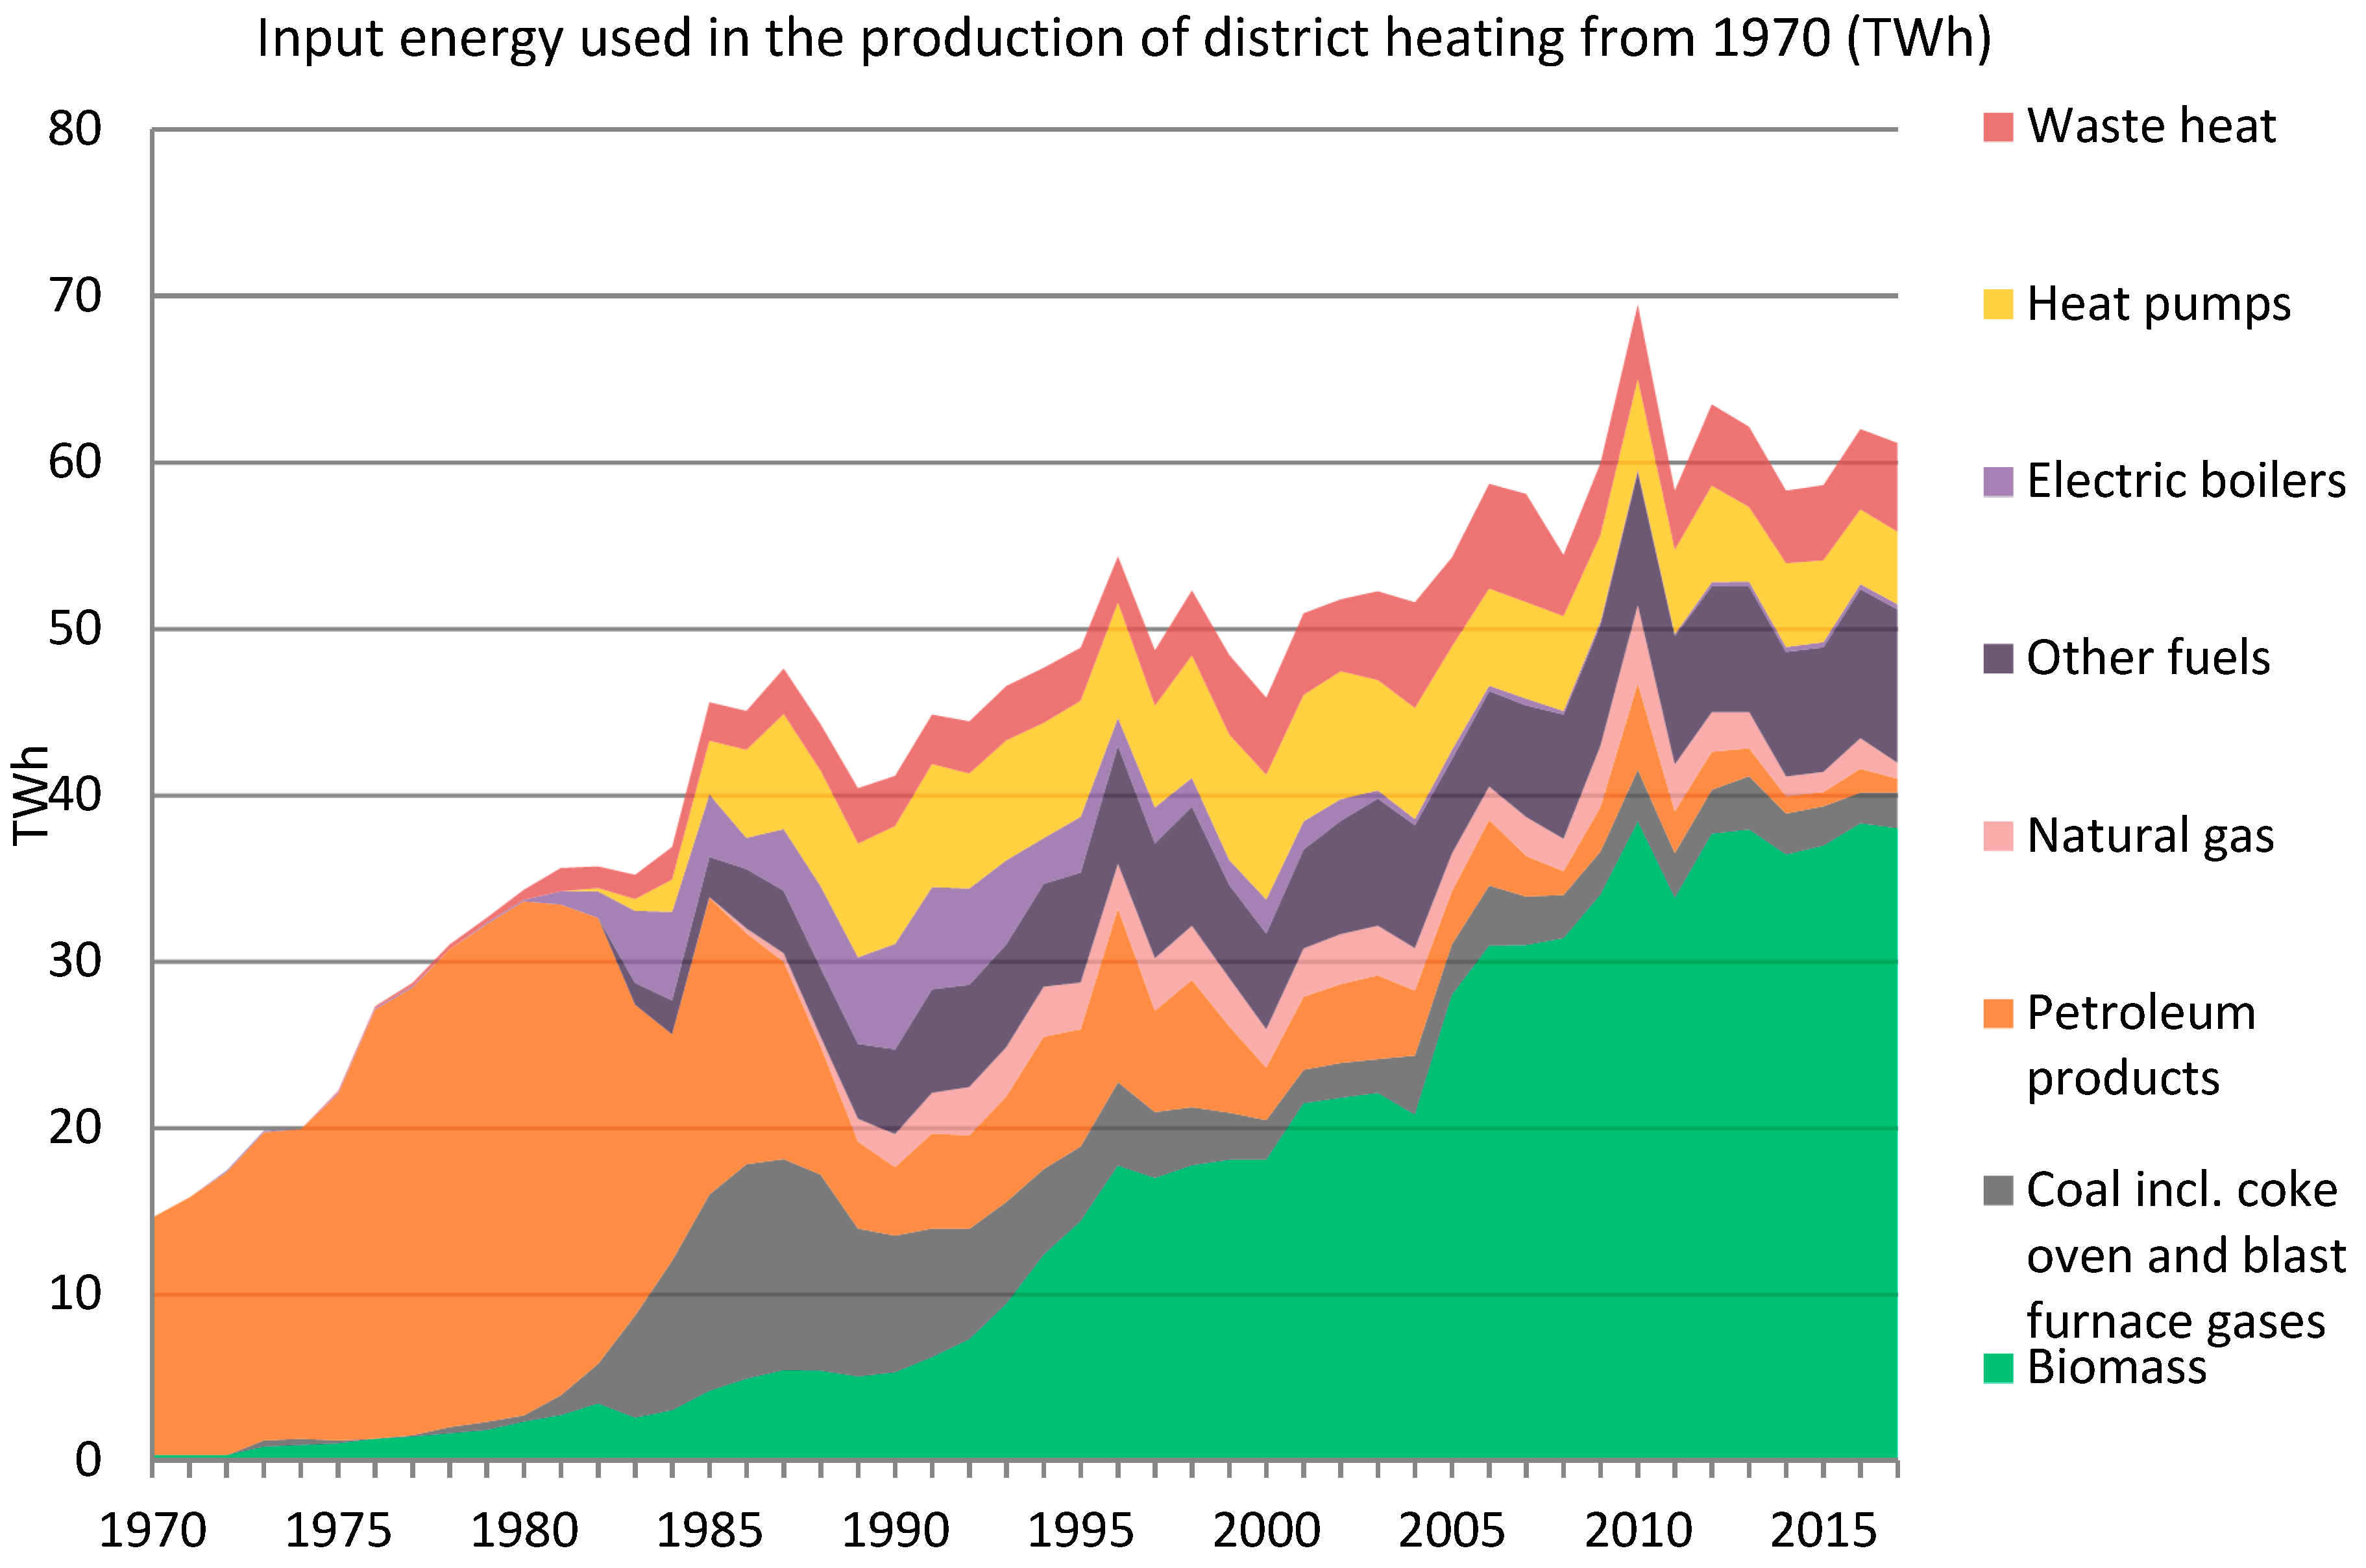
District heating has expanded significantly and is an efficient way to heat buildings, since it allows for centralized heat production and the use of waste heat, co-generation, heat pumps, and other efficient solutions. For many decades Sweden has heated most of its cities and towns mainly through district heating, and this system is constantly being expanded. Until the 1980s this district heating system was fueled primarily by fossil fuels, particularly oil. Today, district heating is to an overwhelming extent fueled by biofuels (e.g., wood residues and pellets) and household waste, as shown in Figure 7. Biofuels also have a large market share of heating in those houses that are not connected to district heating grids.
Also, in industry and other sectors, the use of biofuels and residues has increased significantly, while the overall use of coal in the Swedish economy has been cut by more than 50% since its peak in the 1980s.
When it comes to the transport sector, Sweden is fairly similar to the rest of the European Union. In virtually the whole of Europe and Japan, fuel taxes are high, while other countries such as the United States have low levels of taxation, with countries such as Australia, Canada, and New Zealand being somewhat intermediate. The differences are sizeable, with prices in most European countries being more than double U.S. prices, with consumption per capita of less than half. Earlier studies [14,15] summarize a number of earlier surveys, showing price elasticities of demand to be around −0.7. A recent study [16] with a careful identification strategy shows a clear and quite sizeable effect of the carbon tax in Sweden.
3.3. Concluding Remarks
The Swedish experience has shown a gradual but determined increase towards a fairly uniform national tax on fossil CO2. It shows that demand elasticity has increased over time. The tax has had a major impact on heating, where biofuels, heat pumps, waste, and surplus heat used in district heating have replaced oil, resulting in reduced tax revenues from the carbon tax. The low share of tax revenues from environmental taxes in Sweden is sometimes misinterpreted as showing that Swedish taxes are not efficient or do not apply everywhere. The truth is the opposite. The tax has been effective over a long time so the tax base has already eroded.
In summary, the following points appear to have been important:
- The carbon tax was part of a tax reform. Under that condition, the total tax share of GDP did not rise but fell.
- The risk of carbon leakage was addressed through temporary tax exemptions in sectors sensitive to trade, but these exceptions have largely been eliminated. Today the remaining exemptions are industries participating in the EU ETS.
- The Swedish experience shows that emission reductions can be combined with economic growth. During the 1990–2010 period, the CO2 equivalent emissions were reduced by 8%, while at the same time economic activity increased by 51%. As shown in Figure 2, the decoupling also occurred in other countries but it was stronger in Sweden.
- In addition to the above, a further important advantage of a tax (as compared with a cap-and-trade program) is that the tax works well together with other instruments of climate and energy policy, such as green certificates, subsidies for renewables, and regulations that have been introduced after (or in some cases before) the tax.
4. Carbon Pricing: The Canadian Experience
4.1. Carbon Pricing within the Canadian Constitutional, Energy, Economic, and Political Context
4.1.1. A Federalist Political System
The distribution of overlapping and separate powers in the Canadian federal system have profoundly affected Canada’s carbon taxation efforts. Both provincial governments and the federal government have authority over the environment. Both also have extensive taxation authority, including on income and energy consumption. However, only provincial governments own the natural resources and regulate or own the energy utilities within their borders, while only the federal government has authority over the trans-border movement of goods, whether inter-provincial or international. Canada also has three sparsely populated northern territories that have less political and economic autonomy vis-à-vis the federal government.
For those seeking to increase the scope and stringency of GHG policies, this split in jurisdictional authority can be beneficial, but also problematic. GHG policy adoption has been fostered by the willingness of some provinces to show policy leadership, including experiments with carbon taxes. This can reduce the risks associated with subsequent policy adoption by other provinces or the federal government. However, efforts by the federal government to ensure a coherent national approach tend to be resisted by those provinces that are less keen on GHG reduction, which they do by politically opposing and legally challenging the federal government’s constitutional authority. The ultimate effect is to impede federal efforts to implement nationwide GHG policies, including national carbon taxes, and thus to achieve national GHG commitments resulting from international negotiations, such as at Kyoto in 1997 and Paris in 2015.
4.1.2. Regionally Heterogeneous Resource Endowments
Some regions of Canada, such as Quebec and British Columbia, are endowed with high-quality hydropower resources, leaving their electricity systems with near-zero GHG emissions, and thus electricity prices that are unaffected by carbon taxes. Other provinces, especially Alberta and Saskatchewan, have traditionally been more dependent on fossil fuels for electricity generation. These two provinces, along with Newfoundland in the east, are also endowed with petroleum resources, on which their economies are highly dependent. As resource owners, these three provincial governments earn substantial economic rent (in the form of royalties), especially during periods of high oil prices. However, all Canadians benefit because these industries generate high corporate and personal income tax revenue for the federal government, which is redistributed nationwide via federal programs. There is also a federally-administered equalization system between wealthier and less-wealthy Canadian provinces, with the wealthier provinces often being those with an oil endowment.
The heterogeneity of these energy endowments results in different perceptions of the urgency and mechanisms of GHG reduction. Notably, the expansion of the Alberta oil sands from 0.3 million barrels per day (mbd) in 2000, to 1.5 mpd in 2010, and to 2.8 mpd in 2018 has caused an almost 50% increase in Alberta’s emissions since 2000 [17]. Alberta is the largest emitter of GHGs in Canada, and this increase alone ensured that Canada failed to meet its 1997 Kyoto commitment for a 6% reduction in national emissions by 2010. Ironically, while the European Union was able to reach an agreement to allocate its Kyoto target among its 15 member countries in 1997, Canada was not able to reach a national agreement to allocate its Kyoto target among its 10 provinces.
4.1.3. U.S. Economic, Political, and Social Influence
As the much smaller neighbor, Canada has an asymmetrical economic and political relationship with the United States. With its economy being more dependent on exports to the United States than vice versa, the Canadian government is susceptible to arguments by Canadian industries that GHG policies must not undermine their competitiveness with U.S. firms. Thus, since the 1980s Canada has been a policy-taker when it comes to U.S. vehicle efficiency and emission regulations. Likewise, major emissions-intensive, trade-exposed industries, such as steel, cement, petro-chemicals, metal smelting, aluminum, pulp and paper, oil and gas, and oil refining, have resisted any GHG policies that would increase their cost of production relative to U.S. competitors.
Canada also shares with the United States (and the United Kingdom) a plurality electoral system, in which a political party can achieve a majority government without winning a majority of the votes. This is especially the case in Canada, where the strength of three and sometimes four distinct national parties can enable one party to attain majority control of parliament with only 40% of the total vote. In such systems, election outcomes are often determined by a small number of “swing” constituencies. Since rural constituencies tend to vote conservatively and many urban constituencies tend to vote progressively, it is the suburban “swing” constituencies that sometimes determine Canadian and U.S. elections. Political campaigns in Canada can, therefore, hinge on a few “wedge issues” that motivate a small percentage of voters in these swing constituencies to shift their vote. If proposed by one party, carbon pricing offers an enticing wedge for political opponents to attack. Since suburban voters generally have higher vehicle use rates, they can be particularly sensitive to policies that explicitly and clearly increase the price of gasoline [18,19].
Finally, a significant share of Canadians distrust government, and are likely to disbelieve evidence from government and independent sources showing that their personal costs are modest from the carbon pricing policies that cause the GHG reductions they desire.
4.2. Carbon Pricing Experiences in Canada: Advance, Retreat, Advance?
4.2.1. 1988–2005
In 1988, the Canadian government made its first GHG abatement commitment. Over the next decade, it contemplated but did not implement carbon prices, instead pursuing a portfolio of information programs, voluntary inducements, and modest subsidies especially targeted at energy efficiency. Later research showed that these policies had little effect. Provincial governments were less active during this period, largely seeing the issue as a federal responsibility.
After Canada signed the Kyoto Protocol in 1997, the federal government launched a national climate change process seeking to secure unanimous provincial agreement on a slate of policies by which Canada would achieve its 2010 commitment. However, after two years of negotiations it became obvious that the provinces could not agree on a fair allocation and the federal government was unwilling to impose a significant national policy. Alberta in particular argued that even an allocation in which its emissions rose while those of other provinces fell would cause it a larger relative cost. Thus, from 1998 to 2005, there was much GHG policy discussion in Canada, but little progress, with a contributing factor being the decision by U.S. President G.W. Bush in 2001 to withdraw the United States from the Kyoto Protocol [20]. This period was also characterized by rising oil prices that attracted massive investments to expand the Alberta oil sands, leading to a regional economic boom that also had a positive effect on the national economy.
4.2.2. 2005–2015
Global interest in GHG reduction peaked again in the period 2005–2008 thanks to the coincidence of Nicholas Stern’s report on climate economics for the United Kingdom government, Al Gore’s movie The Inconvenient Truth, Hurricane Katrina, and the European Union implementation of its cap-and-trade program for industry. Republican and Democratic politicians at the U.S. state and federal level explored bi-partisan GHG policy development, while California passed legislation that set ambitious GHG targets and delegated implementation to state regulatory agencies, especially the California Air Resources Board.
Ironically, this period of GHG policy enthusiasm coincided with the election in Canada of Conservative Prime Minister Stephen Harper, who did not conceal his disinterest in GHG reduction and instead vigorously promoted Alberta oil sands expansion alongside speeches promoting Canada as a “global energy superpower.” This lack of federal effort motivated some provinces to do more out of frustration [20].
In 2005, Alberta had already pre-empted federal policy by implementing its own carbon intensity regulation on large industrial emitters, charging a penalty of $10/tCO2 on all emissions that exceeded the intensity target (dollars in nominal Canadian dollars in the year in which they are identified). Because this carbon charge was applied only on excess emissions, it had almost no effect on the production cost of oil from the oil sands.
The government of Ontario pursued a phase-out of coal-fired power plants, which had accounted for 25% of electricity generation. In replacement, it refurbished nuclear plants, approved natural gas plants, and established generous renewables feed-in tariffs. From 2004 to 2014, this combination of regulation and subsidy reduced GHG emissions from Ontario electricity by 90%, the single most important GHG reduction in Canada.
In 2007–2008, the British Columbia government simultaneously implemented a suite of significant policies, including a clean electricity regulation (which caused the cancellation of two proposed coal plants), a low carbon fuel standard to match California’s, energy efficiency regulations, and a revenue-neutral carbon tax, starting at $10/tCO2 and rising to $30/tCO2 by 2012.
In the federal election of 2008, the leader of the center Liberal party, Stephan Dion, presented a national carbon tax as his main policy. Stephen Harper focused his campaign on preventing the “job-killing carbon tax” and won enough swing suburban constituencies to win re-election, again as a minority government. Harper won re-election again in 2011, this time with a majority, albeit with only 40% of the vote.
The carbon tax was also the central issue in the British Columbia election of 2009. The Liberal government announced the policy one year before an election, while holding an unprecedented 20% lead over the social democrats. However, this party could not ignore this enticing wedge issue for swing voters, so it abandoned its own carbon tax platform and launched an “axe-the-tax” campaign. Over the next six months, the governing party lost its 20-point lead and was on course to lose the next election when the financial crash of 2008 shifted voters’ attention and caused a fall in global oil prices. The social democrats found themselves campaigning against a carbon tax just as gasoline prices were falling. The government prevailed in a close election and the carbon tax survived. Once it reached its scheduled level of $30/tCO2 in 2012, the next government promised to freeze it [21]. An interesting feature of the British Columbia carbon tax initiative was its revenue neutrality. The government promised that all carbon tax revenues would be returned directly as income tax cuts or lump sum payments. Thus, the government cut the corporate income tax rate and cut the lowest of the personal income tax rate categories, while also making tri-annual payments to people whose income was too low to benefit from a tax cut. Thus, the government promoted and defended the carbon tax as a tax shift rather than a tax increase, arguing that it was raising taxes on undesirable activities, such as emitting GHGs, while decreasing taxes on desirable activities, such as labor and investment. Over the years, some of the revenue neutrality has been undermined by specific targeted uses of the carbon tax revenue, but in total it is still mostly revenue neutral, which is an appealing prospect for right-of-center voters and their political representatives.
With Harper as national leader, the provincial initiatives continued, with first Quebec and then Ontario joining California’s cap-and-trade system. Quebec’s participation officially began in 2013 and Ontario’s in 2017. The carbon trading price in this system has remained at or near its regulated price floor, which rises gradually over time. A key reason for the price to stay low is that in California other flexible regulations are causing most of the GHG reductions. According to the California Air Resources Board, the cap-and-trade policies are accounting for about 15% of GHG reductions, while 60%-70% result from flexible regulations, such as the renewable portfolio standard, the vehicle emissions standard, and the low carbon fuel standard.
4.2.3. 2015–Present
Two elections in 2015 changed the political landscape for carbon pricing in Canada. The social democrats attained power in Alberta because of a vote-split among conservative parties, and the Liberals under Justin Trudeau replaced Stephen Harper nationally. The Alberta government passed a carbon tax focused on the final consumption of petroleum products and natural gas, while also implementing a coal plant phase out, methane emissions regulations, a cap on oil sands emissions, and a modification of the industry regulation to an output-based pricing system. As with the previous industry policy, this regulation applies a carbon charge on a small percentage of industrial emissions, with negligible effect on the production cost of oil and only modest emission reductions. The carbon pricing policy was projected to cause less than 5% of GHG reductions in the slate of Albertan climate policies.
4.3. Perspectives
The Canadian Liberal government of Justin Trudeau has pursued several important policies, including a backstop national carbon price (for those provinces lacking their own carbon price) that would rise to $50/tCO2 by 2022, a national coal plant phase-out by 2030, national methane regulations, and a clean fuel standard that covers the same fossil fuels as the carbon pricing policy [22]. The clean fuel standard is similar to the low carbon fuel standard in California, but it applies to all fossil fuels in all sectors of the economy.
However, the pendulum has recently swung against carbon pricing in some provinces. A Conservative government was elected in Ontario in 2018 while campaigning on a promise to immediately end participation in the cap-and-trade program with Quebec and California, with the party leader claiming he would eliminate “carbon taxation” in Ontario. In 2019, a new Alberta Conservative government campaigned on eliminating the carbon tax, which it has now done. This has left the federal backstop carbon price as the only carbon price for most Canadian provinces.
5. Climate Policy and Carbon Taxation in France: Much Theory but Little Practice
France is a highly centralized country with a presidential regime, a powerful central administration, and an ever-present Ministry of Finances. However, in parallel, it has also often been noted that the institutions of the “civil society” (also in French the “corps intermédiaires”) are weaker than in other countries, as few of them are rooted in a culture of dialog or concertation. Most trade unions, but not all of them, are indeed acting in a hard protest perspective and this explains the difficulties often encountered in the “social dialog”.
As far as climate policies and carbon taxation are concerned, these considerations are extremely important as they contribute to explaining the difficulties in the consensus building around carbon taxation. The “Gilets jaunes” crisis of 2018–19, which was initially triggered by the proposed increase in the value of the carbon tax, is a clear illustration of this structural problem in France. Carbon taxation has acted as a revealing agent of some of the political weaknesses of France. Hence, the future of carbon taxation will clearly depend on the capability of the French society to overcome the problem of defiance towards market mechanisms and the corresponding institutions [23].
5.1. Carbon Tax and Climate Policy in the National and International Context
In spite of the above-mentioned structural features, one has to recognize that in France there also exists a tradition of mobilizing economic expertise for public policy decision, in the intellectual tradition of the so-called “engineer economists”. In this perspective, the Commissariat Général du Plan, an institution rooted in the post-war institutional system, has played a key role also in its ability to associate stakeholders, particularly trade unions and industry representatives. It is now known as France Stratégie and is defined as a public think tank attached to the Prime Minister. The Conseil d’Analyse Economique by the Prime Minister or the Conseil Economique pour le Développement Durable by the minister of ecology, although more academic and expert-based, have also played important roles in advising the government on environmental policies.
The number of high-quality official reports and analyses ordered by politicians and delivered on the issues of economic instruments for the environment is impressive, but their practical results are few and remain fragile. Since the early 1990s, at least twelve official reports have dealt with the issue of economic instruments and price signals for climate policies.
5.1.1. Early Times: 1990–2008
Carbon taxation is indeed an old story in France. It began in 1990 when Yves Martin, a key civil servant in environmental policy and then president of the Greenhouse gas commission, or more precisely the Mission Interministérielle sur l’Effet de Serre, proposed the introduction of a carbon tax. It was the year of the first Intergovernmental Panel on Climate Change (IPCC) report, with, in perspective, the start of international climate negotiations and the Rio Conference of 1992. An example of the use of economic instruments for the environment in market economies, this pioneering proposal aimed to introduce a carbon tax in France, rising in 20 years to 1000 French franc (FF)/tC (233 €/tC in today’s money or 63 €/tCO2). However, by then, and contrarily to what happened in Sweden, no practical step was taken by the government.
As the international negotiation proceeded in the 1990s, the focus was placed more on the design of the international climate regime, from Rio to Kyoto, and the associated institutions and instruments. However, in 1993 research performed by a former high-level civil servant (E. Malinvaud) mentioned the cost of a low qualification workforce as a cause of mass unemployment in Europe and the introduction of a carbon tax as a means to reduce labor costs [24]. This central issue was further explored by Bureau and Hourcade in a 1998 report for the Conseil d’Analyse Economique [25], and after twenty years it is still looming today.
After the failure of The Hague conference in 2000, which could have introduced a U.S.–Europe convergence on an international emission trading system, the question of the carbon tax was again seriously considered. This was in spite of the implementation of the European Emission Trading system for industrial emissions, which represents 50% of European emissions (although by that time only 40% in France), because of the predominance of nuclear energy in the power sector.
A first attempt to introduce a carbon price in 2000 in the broader context of a revision of the environmental taxation system failed because of considerations of fiscal equality. However, an original feature of the French public system is the consideration of external costs and the introduction of shadow prices in public investment decisions. In 2001, a report for the Commissariat Général du Plan firstly attempted to quantify the social value of avoided carbon [26]. On this basis, the first Commission Quinet (2008–2009) [27] carefully computed the future trajectory of the “carbon value” to be used in public investment decisions. It was calibrated to meet the factor 4 reduction of France’s emissions by 2050; this value started at 32 €/tCO2 in 2010 and the trajectory was set to increase to 56, 100, and 200 €/tCO2 by 2020, 2030, and 2050, respectively.
Whereas the carbon value represented a shadow price for GHG emissions, in preparation for the 2007 presidential election, an environmental activist and would-be candidate, Nicolas Hulot, proposed to the main candidates the concept of a real carbon tax through his “ecological pact”.
5.1.2. 2009–2014: From Failure to Success
While the right-wing President elected in 2007, Nicolas Sarkozy, accepted the idea of the carbon tax, a dedicated commission, headed by a former left-wing Prime Minister Michel Rocard, was created in 2009 [28]. This commission encompassed experts from the administration and the academy together with representatives of NGOs, trade unions, and business. It settled on the project of “Climate and Energy Contribution” based on the assessment by the Quinet Commission: introduction at 32 €/tCO2, rising to 100 €/tCO2 in 2030. While no clear decision was made on the use of the corresponding fiscal resources, the law was adopted by the parliament by the end of 2009. However, at the very eve of its application, the law was rejected by the constitutional council because of inequalities among large and small enterprises and because of too many exceptions to the general rules.
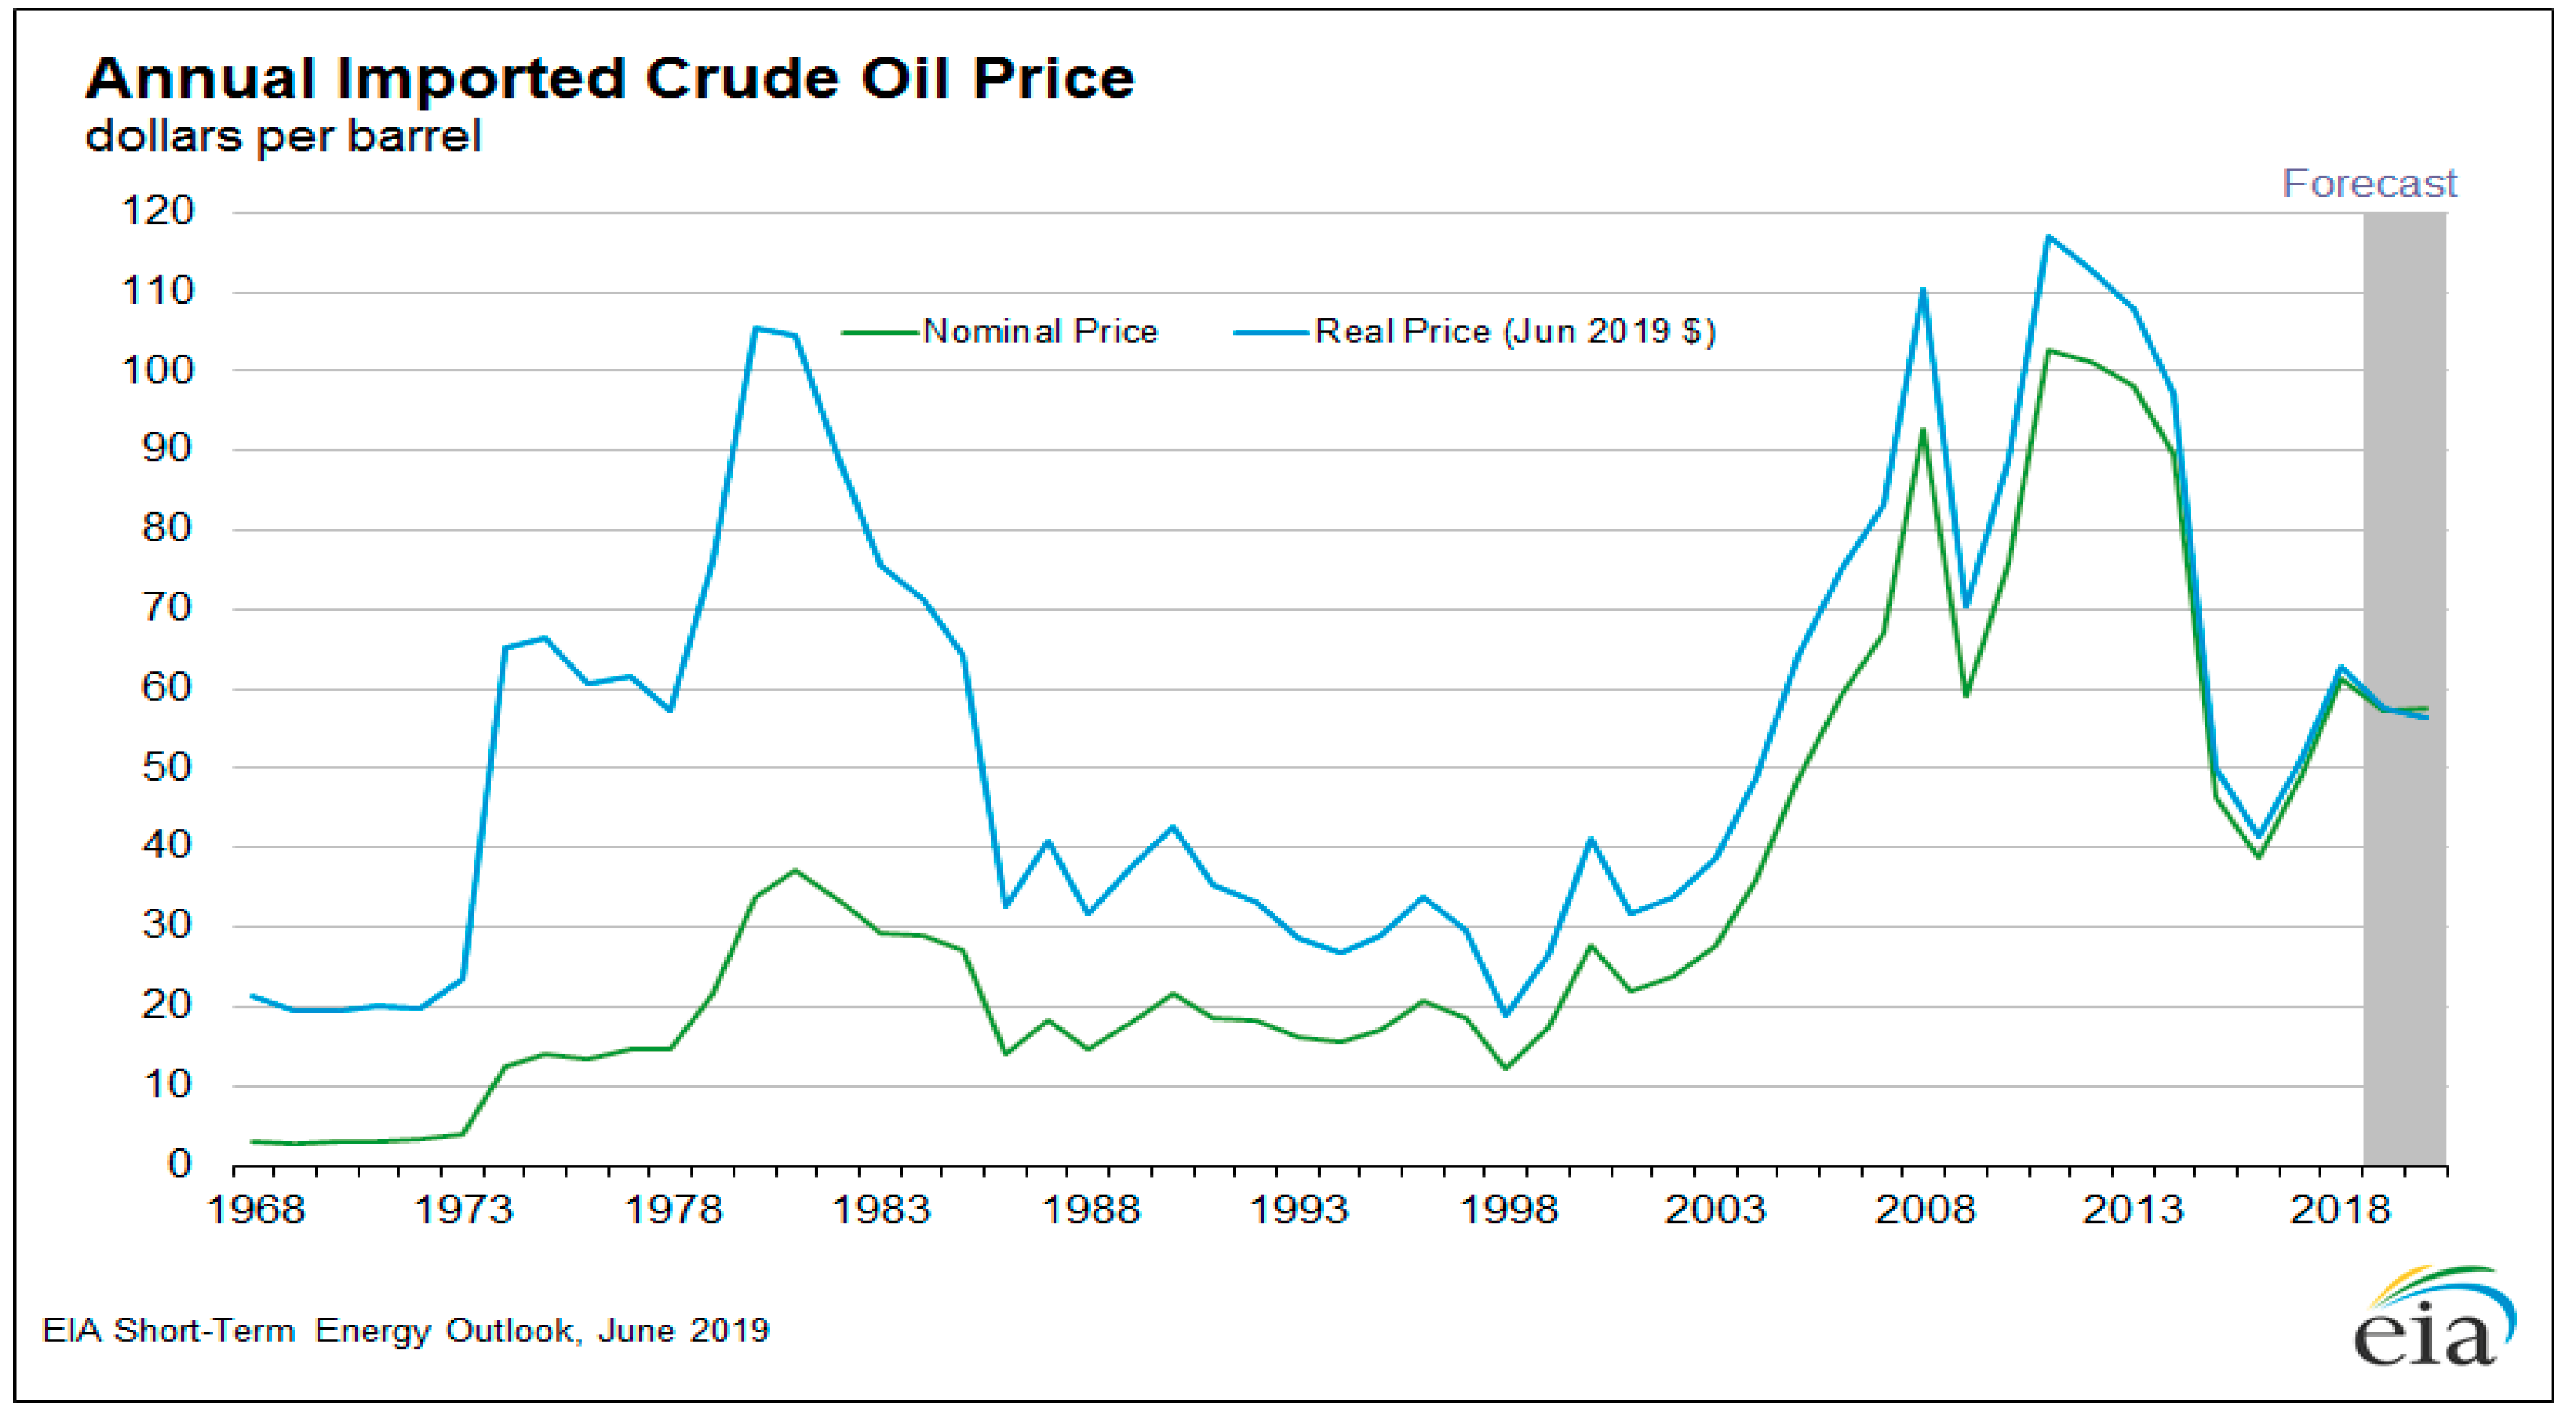
These were hard times for the proponents of the carbon tax. However, a new commission was created in 2011, in charge of “remettre l’ouvrage sur le métier” (translated as “put the matter back on the drawing board”) [29]. After the election of François Hollande in 2012 and partly due to tight budgetary constraints, the work of this committee on ecological taxation was used to incorporate a carbon component into energy taxation, starting at 7 €/tCO2 in 2014 and rising to 14.5 €/tCO2 in 2015 and 22 €/tCO2 in 2016 [30]. The introduction of this carbon tax was made less painful by the decline in oil price in 2014 and by a reduction of some other taxes, in particular for the transport sector (Figure 8).
This was the first introduction of the carbon tax in France, and this means that up to that point the transformation observed in the decarbonization of the energy system resulted from other policies: the nuclear program with impacts in the 1980s and 1990s, and in parallel the combination of policies and measures for energy efficiency and renewable energy, as mostly designed and implemented by the national agency for energy efficiency, Agence de l'environnement et de la maîtrise de l'énergie (ADEME).
5.1.3. 2014–2018: From Success to Failure
In 2015, the Energy Transition for Green Growth Act was voted in by the parliament, just in advance of the 2015 United Nations Climate Change Conference, COP21, in Paris. The act confirmed the carbon price trajectory to 56 and 100 €/tCO2 in 2020 and 2030, respectively, according to the 2009 Quinet Commission. Let us recall here that 100 €/tCO2 corresponds to approximatively 25 €c/l of gasoline.
After the election of Emmanuel Macron, the reduction of the budget deficit was considered to be more important than ever. The resources provided by energy and carbon taxation were carefully considered by the Ministry of Finance. In particular, the Finance Law for 2019 introduced two measures with impacts on the price of transport fuels: the alignment of the taxes on diesel with those on gasoline, and an extra 10 €/tCO2 to be implemented in 2019. This last measure represents only 2.5 €c/l of gasoline, but combined with the oil price increase at the end of 2018, it was resented as unbearable by households living in non-metropolitan areas, which often drive diesel cars for personal or professional activities. The results were the “gilets jaunes” and the current standstill in carbon taxation.
5.2. Energy and Climate Policies and Trends in Emissions
As identified in Section 2, and from observation of Figure 1, one can identify four periods in the dynamics of the energy sector emissions in France: 1980–1990, 1990–2005, 2005–2015, and 2015 to date. This is a sequence of decline–stabilization–decline–stabilization.
5.2.1. Policies and Price Effects in the Four Sub-Periods
The deployment of nuclear energy in the first period was the pure result of strong national command- and control-type decisions immediately after the first oil shock and the accompanying oil price increases. It is known that two major infrastructure programs were decided in the same Council of Ministers in March 1974: the nuclear program and the innovative high-speed train program. The results were rapidly felt, as three-fourths of the nuclear capacities of today were already available in 1990, only 15 years after the launch of the program.
During the first stabilization period, 1990–2005, the primary consumption of fossil fuel almost stabilized, with a further decline of coal and an increase of natural gas. This means that active policies and measures for energy efficiency promoted by ADEME had largely been counterbalanced by adverse lagged price effects; the countershock had taken place in 1986 and the new price increases of the early-2000s had not yet been felt. The 15% increase in primary consumption was fueled by nuclear electricity, as biomass and hydroelectricity were stable and wind and solar were still so small that they were not noticeable.
The following decline period, 2005–2015, was strongly impacted by the rise in the price of fossil energy, which even resisted the 2008 crisis. The economic crisis of course added a negative activity and purchasing power factor to this price effect. From 2005 to 2015, total fossil fuel consumption in the energy sector (and hence emissions) was reduced by 20%. This, to some extent, shows the power of the price effect, even when it does not stem from environmental policies. Remember that the first carbon tax was introduced in 2014 and at an unnoticeable level (2 €c/l of gasoline).
Finally, the last stabilization (or even slight emission increase) period after 2015 can also be interpreted as mostly an effect of lower prices. It has, however, strong consequences in the French political context, as it will be interpreted by the green parties or NGOs as a proof of the insufficient effort and dedication of the government to implement strong climate policies that should accompany the commitments of the Paris Agreement.
5.2.2. Sectoral Insights
The building sector, both residential and tertiary, only represents 17% of sectoral emissions from energy consumption in France. This is due to the predominance of low carbon electricity and of natural gas. Emissions plateaued during the 1998–2008 period before a marked decrease of about 20%, largely explained by the combined impacts of energy efficiency policies, with a continuous decline in energy consumption per square meter, and of the strong increases of oil and natural gas prices in 2008. However, in recent years the increasing trend in per capita building surface and the low energy prices since 2014 have resulted in new increases in this sector’s emissions.
Transport is the major emitting sector in France, with 29% of the energy-related emissions. Similarly to the building sector, emissions peaked in the 2000s and diminished significantly after 2008. This is largely due to the reduction in energy consumption per vehicle km for automobiles (–20% since 1990). Since 2014, however, the increase in total traffic, in the size of the vehicles, and more recently, the substitution of gasoline fueled cars for diesel cars, has induced a new increase in energy consumption and emissions.
For industry, which represents 11% of the total, emissions were almost flat between 1990 and 2008, in spite of economic growth. This is due to improvements in the energy efficiency and production processes of industries, but also clearly to a movement of deindustrialization, which has particularly hurt the heavy energy-intensive industries, such as steel, cement, and chemical industries. This movement accelerates after 2008 and it explains the 20% reduction in emissions since that date, which conversely to the building and transport sectors had a limited impact on international energy price decreases in recent years.
Finally, the energy sector represents only 9% of total emissions, with slightly more than 50% of the sector’s emissions from power generation. Due to the high share of nuclear power in the total generation (75% on average), the emissions of this subsector are remarkably low when compared to other countries; depending on the yearly variations, the average carbon content of 1 kWh is only 65 g/kWh.
5.3. How to Reintroduce Carbon Taxation: Proposals and Perspectives
These analyses indicate that in spite of the overall 20% reduction in GHG emissions since 1990, there is still a long way to go to follow a pathway compatible with the long-term target of zero net carbon emissions in 2050 that was set out by the National Low Carbon Strategy published in December 2018. In particular, trends in years since 2014 have shown worrying signs of emission increases in key sectors. The decline in international energy prices during this period, to some extent, illustrates the importance of price effects. However, at the same time, the gap between observed trends and official targets fuels the discontent of the citizens and the political opposition concerning the desire and capability of the government to really take adequate measures in favor of the energy transition.
In principle, one key element of the solution should have been the reinforcement of carbon taxation, as initially envisaged by the government in the 2018 budget. However, as a consequence of the way this was introduced, it has only triggered a wave of social protest, which might ultimately even threaten the very existence of carbon taxation. This raises the question of how to design future carbon pricing policies, that may “reconcile French people with the carbon tax [by] disentangling beliefs from preferences” [31].
On the NGO and think tank side [32], a recent proposition for a “just taxation” focused on the necessity of transparent recycling of the carbon tax revenues, first to protect and compensate the lower-income households, and second to finance an ambitious plan for energy transition investments. On the government side, a decision has been taken to organize a “convention” of 150 citizens that will precisely examine the different dimensions of the problem and express advice on the principles and conditions of carbon taxation, before the end of 2019. The future is still undecided.
6. Conclusion
In theory, carbon taxation is the climate policy that offers the easiest way to reduce GHG emissions. In practice it works well but the implementation of carbon taxes has proven complicated. In this paper, we compare three countries—Sweden, France, and Canada—that have made great efforts in terms of carbon taxation to identify the factors that led to their very different experiences. Such analysis can be valuable for policy makers as it provides insights on the pros and cons of different approaches and contributes to the identification of factors that are important for the acceptance and success of carbon taxes. Of course, the unique and distinctive features of the three countries under review make a direct generalization to other countries difficult, but the lessons drawn are still highly relevant for the understanding of carbon taxation and applicable beyond the countries under scrutiny.
Our comparative analysis yields several important insights. The first is that implementation and acceptance of an environmental policy based on taxation is not as simple as indicated in environmental economics textbooks. Although introducing environmental costs into the decision function of decentralized economic actors and consumers may appear as the simplest, clearest, and most effective solution, this reflects what is sometimes called the “blackboard economics” view of the world. The tale of the three countries in this paper shows that real-world acceptance of carbon taxation faces an array of challenges depending on the categories of consumers and industries, the fossil fuel resource endowment of a given region, the power of fossil fuel and other lobbyists, and the receptivity of voters to taxation policies.
One striking aspect that emerges is that confidence in government and in its ability to manage fiscal revenues in a transparent, just, and effective way is key for the acceptability of environmental policies based on taxation. Looking at the stories of the three countries, it seems that confidence in the government has played a major role in their experience with carbon taxation. In Sweden, the relatively high confidence in the political system is often associated with the acceptance of carbon taxation, while the lower levels of such confidence in Canada and France may have contributed to difficulties. In Canada, the challenge of low governmental confidence overlaps with complications from the federal nature of its political system and the heterogeneity in the structure and supply mix of the energy sector between regions. In France, the confidence and acceptability problem is of a different nature, as the country’s governance is highly centralized. However, lack of confidence in the government, combined with an apparent aversion against social inequalities, results in strong opposition to any measure that may be seen to hurt the purchasing power of households. Addressing this dimension is probably the most important condition for the adoption of tax-based policies.
The second striking feature of the analysis is that carbon taxes are not applied in isolation. It is clear from the analysis that significant emission reductions, at least in terms of GHG intensity of GDP, occurred before 1990; that is, before the introduction of any carbon tax, even in the case of Sweden. These reductions were caused by other policies and measures designed to abate emissions and these did not stop when carbon taxes were introduced. It is difficult to disentangle the price effects of carbon taxation from the effects of other climate and non-climate policies. As a matter of principle we know that a tax has the advantage of application to a broader class of cases than interventions to individual industries or sectors. In the case of Sweden, it is generally thought that the carbon tax played a role in the decarbonization of the energy supply of the Swedish buildings. However, this was enabled by the pre-existence of a well-developed district heating system and the availability of an abundant and cheap supply of wood to supply district heating systems, as well as the heating systems in individual buildings. These unique circumstances suggest that carbon taxation might not work quite as smoothly in other jurisdictions. Thus, combining a carbon tax with other policies, therefore, appears to be a sensible and necessary path for successful carbon taxes.
A third insight that emerges from the analysis is the importance of considering the existence of energy lobbyists in the design of a carbon tax policy. This is obviously an issue in Canada, where the importance of fossil fuel industries hinders the development and survival of carbon taxes. In France, this is a lesser issue since the electricity sector is dominated by nuclear power, while the country’s primary oil and gas producer TOTAL has until now been an outward oriented company. Industry concerns about emission leakages and competitiveness have been regionally addressed by the multi-country Emissions Trading System of the European Union. However, the inclusion of an emissions source as important as transportation has been unachievable in the 14 years since the creation of this carbon pricing system. On the other hand, the transport sources pay fuel taxes that are considerably higher than the EU ETS prices. In countries with strong fossil lobbies, any transitional problems are likely to be exploited heavily to whip up discontent against the overall climate policy. Even in Sweden, which has no fossil lobby, there is pressure from lobbyists from high energy-using companies. These lobbyists helped create exceptions to the carbon tax for some energy-intensive industries, arguing that the tax would endanger their competitive position. The challenge of industry leakage has been addressed by the adoption of differentiated carbon taxes during a twenty years transition period. The main goal for a country’s policy in such circumstances must be to make sure that exemptions are temporary, and here Sweden has withstood the test quite well. Today, the country’s carbon taxes have, however, converged to be similar for most sectors of the economy, with the only major exemption being for those industries that are covered by the EU ETS.
A fourth important insight concerns the use of carbon tax revenues. While the Canadian practice depends on the regional constituencies, France has thus far applied the “budget unicity” principle of public economics, in that carbon tax revenues are not earmarked for anything specific, but instead allocated by the government to expenditures of the highest social value. However, the “gilets jaunes” protests against planned carbon tax increases in 2018–2019 have profoundly undermined this policy approach in France. The need for transparency and the want for the carbon tax money not being “diverted” by the State and fully used either for household compensation or the financing of the energy transition has become a prerequisite for any new consideration of a reinforcement of the carbon tax in France. On the other hand, the Swedish experience shows that direct revenue recycling does not have to be a precondition for acceptability. Presumably the electorate somehow judges the total results of policy in many domains. Overall, comparing the revenue recycling in the countries under review shows that the acceptability and efficiency of the recycling mechanism plays a major role in acceptance of the carbon tax. However, it also shows that the optimal design of revenue recycling is very context-specific.
The fifth consideration raised by this analysis is whether carbon taxation can play the lead role in the countries under our review when the decarbonization objective is to transform a national energy system to one with near-zero GHG emissions. In the wake of the Paris agreement and the 1.5 °C Special Report of the IPCC, all three countries have adopted ambitious carbon-neutral or near-zero carbon targets for 2050. A carbon tax will have to rise significantly, especially from its low levels in France and Canada, if this policy is to play the leading role in deep decarbonization. This raises concerns about the political feasibility of relying primarily on carbon taxation for this development [33]. On the other hand, solving each sector’s carbon emissions separately will also require very drastic instruments and still risks overlooking the risks of new emissions from new uses of fossil fuel. The only general policy instrument to deal with these is indeed carbon pricing. At this stage, it is, however, premature to provide specific policy indications for feasible carbon tax reforms. Any policy that helps to implement carbon taxes is desirable. However, as the analysis highlights, finding such a policy is not necessarily easy. A first step in the process of designing new carbon policies would be to carefully take the five issues identified above into account, and especially the issue of confidence in the political system and its ability to manage carbon taxes in a just and efficient manner. From this perspective, there may be value in research that explores combinations of climate policies, both in terms of the economic efficiency, but also the political acceptability when it comes to deep decarbonization and zero net emission policies.
Author Contributions
Conceptualization and editing, T.S., P.C., and M.J.; writing of respective country studies for Sweden, Canada, and France, T.M., M.J., and P.C.; data treatment for country comparison, P.C.
Funding
Thomas Sterner would like to thank Mistra Carbon Exit and BECC.
Acknowledgments
The authors wish to acknowledge the contribution of Bradford Griffin, Simon Fraser University, in his treatment of data for different provinces of Canada.
Conflicts of Interest
The authors declare no conflict of interest.
Appendix A

Table A1.
Factors of decarbonization (1990–2017).
| Title 1 | 1990 | 2017 | 2017/1990 | |
|---|---|---|---|---|
| France | E/PIB | 0.096 | 0.066 | 69% |
| Non Fossil/E | 27% | 35% | ||
| CO2/E | 2043 | 1713 | 84% | |
| Sweden | E/PIB | 0.128 | 0.083 | 64% |
| Non Fossil/E | 52% | 65% | ||
| CO2/E | 1475 | 0.948 | 64% | |
| Canada | E/PIB | 0.221 | 0.167 | 75% |
| Non Fossil/E | 22% | 22% | ||
| CO2/E | 2155 | 2089 | 97% |
References
- Carbon Dioxide Information Analysis Center, Oak Ridge National Laboratory. Global, Regional, and National Fossil-Fuel CO2 Emissions (1751–2014). 2017. Available online: https://data.ess-dive.lbl.gov/view/ess-dive-ba81a8a8e0bef31-20180727T203854467 (accessed on 24 July 2019).
- Environment and Climate Change Canada. National Inventory Report: Greenhouse Gas Sources and Sinks in Canada. 2018. Available online: http://www.publications.gc.ca/site/eng/9.506002/publication.html (accessed on 24 July 2019).
- Statistics Canada. Table 25-10-0029-01 Supply and Demand of Primary and Secondary Energy in Terajoules, Annual. 2019. Available online: https://www150.statcan.gc.ca/t1/tbl1/en/tv.action?pid=2510002901 (accessed on 24 July 2019).
- Statistics Canada. Table 36-10-0222-01 Gross Domestic Product, Expenditure-based, Provincial and Territorial, Annual (x 1,000,000). 2019. Available online: https://www150.statcan.gc.ca/t1/tbl1/en/tv.action?pid=3610022201 (accessed on 24 July 2019).
- Statistics Canada. Table 25-10-0004-01 Supply and Demand of Primary and Secondary Energy in Terajoules, Quarterly, with Data for Years 1978–2001. 2002. Available online: https://www150.statcan.gc.ca/t1/tbl1/en/tv.action?pid=2510000401 (accessed on 24 July 2019).
- Sumner, J.; Bird, L.; Dobos, H. Carbon taxes: A review of experience and policy design considerations. Clim. Policy 2011, 11, 922–943. [Google Scholar] [CrossRef]
- Bruvoll, A.; Larsen, B.M. Greenhouse gas emissions in Norway: Do carbon taxes work? Energy Policy 2004, 32, 493–505. [Google Scholar] [CrossRef]
- Bruvoll, A.; Larsen, B.M. Greenhouse gas emissions in Norway: Do carbon taxes work? In Environmental Taxation in Practice; Sterner, T., Muller, A., Eds.; Ashgate Publishing Limited: Hampshire, UK, 2006. [Google Scholar]
- Cambridge Econometrics. Modelling the Initial Effects of the Climate Change Levy; Report Submitted to HM Customs and Excise; Cambridge Econometrics: Cambridge, UK, 2005. [Google Scholar]
- Berkhout, P.H.G.; Ferrer-i-Carbonell, A.; Muskens, J.C. The ex post impact of an energy tax on household energy demand. Energy Econ. 2004, 26, 297–317. [Google Scholar] [CrossRef]
- Martin, R.; de Preux, B.; Wagner, U.J. The Impacts of the Climate Change Levy on Manufacturing: Evidence from Microdata. Working Paper 17446, NBER Working Paper Series. 2011. Available online: https://www.nber.org/papers/w17446.pdf (accessed on 23 July 2019).[Green Version]
- Lin, B.; Li, X. The effect of carbon tax on per capita CO2 emissions. Energy Policy 2011, 39, 5137–5146. [Google Scholar] [CrossRef]
- World Bank. CO2 Emissions (kg per 2010 US$ of GDP). Available online: https://data.worldbank.org/indicator/EN.ATM.CO2E.KD.GD?end=2014&locations=US-1W-OE-GB-DK-NO-SE&start=1960&view=chartCzxc (accessed on 23 July 2019).
- Andersson, J. Cars, Carbon Taxes and CO2 emissions. Centre for Climate Change Economics and Policy Working Paper n° 238. London School of Economics and Political Science. 2017. Available online: https://www.cccep.ac.uk/wp-content/uploads/2017/03/Working-paper-212-Andersson_update_March2017.pdf (accessed on 23 July 2019).
- Sterner, T. Fuel taxes: An important instrument for climate policy. Energy Policy 2007, 35, 3194–3202. [Google Scholar] [CrossRef]
- Andersson, J.J. Carbon Taxes and CO2 Emissions: Sweden as a Case Study. Am. Econ. J. Econ. Policy 2019, 11, 1–30. [Google Scholar] [CrossRef]
- Canadian Association of Petroleum Producers. Statistical Handbook; CAPP: Calgary, QC, Canada, 2018. [Google Scholar]
- Harrison, K. The comparative politics of carbon taxation. Annu. Rev. Law Soc. Sci. 2010, 6, 1–23. [Google Scholar] [CrossRef]
- Rabe, B. Can We Price Carbon? MIT Press: Cambridge, MA, USA, 2018. [Google Scholar]
- Simpson, J.; Jaccard, M.; Rivers, N. Hot Air: Meeting Canada’s Climate Change Challenge; McLelland and Stewart: Toronto, ON, Canada, 2007. [Google Scholar]
- Jaccard, M. The political acceptability of carbon taxes: Lessons from British Columbia. In Handbook of Research on Environmental Taxation; Milne, J., Anderson, M., Eds.; Edward Elgar: Cheltenham, UK, 2012; pp. 175–191. [Google Scholar]
- Government of Canada. Federal Actions for a Clean Growth Economy; Government of Canada: Ottawa, ON, Canada, 2018. Available online: https://www.canada.ca/en/services/environment/weather/climatechange/climate-action/federal-actions-clean-growth-economy.html (accessed on 23 July 2019).
- Algan, Y.; Cahuc, P. La Société de Défiance: Comment le Modèle Social Français s’Autodétruit; CEPREMAP: Paris, France, 2007; Available online: https://www.cepremap.fr/publications/la-societe-de-defiance-comment-le-modele-social-francais-sautodetruit/ (accessed on 23 July 2019).
- Dreze, J.; Malinvaud, E. Croissance et emploi: L'ambition D'une Initiative Européenne. Revue de l'OFCE 1994, 49, 247–288. [Google Scholar] [CrossRef]
- Bureau, D.; Hourcade, J.-C. Les dividendes économiques d’une réforme fiscale écologique. In Fiscalité de l’Environnement; Conseil d’Analyse Économique; La Documentation Française: Paris, France, 1998; pp. 41–81. Available online: http://www.cae-eco.fr/IMG/pdf/008.pdf (accessed on 23 July 2019).
- Boiteux, M. Transports: Choix des Investissements et Coût des Nuisanes. Commissariat General du Plan. 2001. Available online: https://www.ladocumentationfrancaise.fr/rapports-publics/014000434/index.shtml (accessed on 23 July 2019).
- Quinet, A. La Valeur Tutélaire du Carbone; La Documentation Française: Paris, France, 2009; Available online: https://www.ladocumentationfrancaise.fr/rapports-publics/094000195/ (accessed on 23 July 2019).
- Rocard, M. Rapport de la conférence des experts et de la table ronde sur la contribution Climat et Energie. Ministère de l’Écologie, de l’Énergie, du Développement Durable et de la Mer, Ministère de l’Économie, de l’Industrie et de l’Emploi. 2009. Available online: https://www.ladocumentationfrancaise.fr/rapports-publics/094000351/index.shtml (accessed on 23 July 2019).
- De Perthuis, C. Trajectoires 2020–2050 vers une Économie Sobre en Carbone. Centre d’Analyse Stratégique, 2011. Available online: https://www.ladocumentationfrancaise.fr/rapports-publics/114000655/index.shtml (accessed on 23 July 2019).
- De Perthuis, C. Travaix du Comité pour la fiscalité écologique—Rapport d’étape. Ministère de l’Écologie, du Développement Durable et de l’Énergie, Ministère de l’Économie et des Finances. 2013. Available online: https://www.ladocumentationfrancaise.fr/rapports-publics/134000547/index.shtml (accessed on 23 July 2019).
- Douenne, T.; Fabre, A. Can We Reconcile French People with the Cqrbon Tax? Disentangling Beliefs from Preferences. Working Paper WP 2019.10. French Association of Environmental and Resource Economists. Available online: https://ideas.repec.org/p/fae/wpaper/2019.10.html (accessed on 24 July 2019).
- Réseau Action Climat. Nos Propositions Pour une Nouvelle Fiscalité Carbone et Energétique Plus juste. 2019. Available online: https://reseauactionclimat.org/contribution-climat-solidaire/ (accessed on 24 July 2019).
- Green, J.; Sterner, T.; Wagner, G. A balance of ‘bottom-up’ and ‘top-down’ in linking climate policies. Nat. Clim. Chang. 2014, 4, 1064–1067. [Google Scholar] [CrossRef]
Figure 1.
GDP and energy-related CO2 emissions. Source: ENERDATA.

Figure 2.
Primary energy supply, by source. Note: in order to avoid an overvaluation of nuclear energy in total primary energy supply comparative to renewable electricity sources, it has been accounted using the “consumption equivalent” of electricity. Source: ENERDATA.
Figure 2.
Primary energy supply, by source. Note: in order to avoid an overvaluation of nuclear energy in total primary energy supply comparative to renewable electricity sources, it has been accounted using the “consumption equivalent” of electricity. Source: ENERDATA.

Figure 3.
Carbon intensity of energy vs. energy intensity of GDP. Source: ENERDATA.

Figure 4.
Per capita greenhouse gas (GHG) emissions by Canadian province. Note: NL = Newfoundland and Labrador; PE = Prince Edward Island; NS = Nova Scotia; QC = Québec; ON = Ontario; MB = Manitoba; SK = Saskatchewan; AB = Alberta; BC = British Columbia. Source: [1,2,3,4,5].

Figure 5.
Development of the Swedish CO2 tax for different areas of use. Nominal CO2 tax levels; for 2016–2018, the 2016 level is used. From 2008, industry usage outside the European Union Emissions Trading Scheme (EU ETS) is shown. Currency conversion based on an exchange rate of SEK 10.33 per EUR. Source: Government Offices of Sweden.

Figure 6.
The decoupling of CO2 emissions from GDP. Source: [13].
Figure 6.
The decoupling of CO2 emissions from GDP. Source: [13].

Figure 7.
Energy input in district heating in Sweden 1970–2017, measured as terawatt hours divided by GDP (TWh/GDP). Source: Swedish Energy Agency.
Figure 7.
Energy input in district heating in Sweden 1970–2017, measured as terawatt hours divided by GDP (TWh/GDP). Source: Swedish Energy Agency.

Figure 8.
Annual imported crude oil price. Source: US Energy Information Administration (EIA).

© 2019 by the authors. Licensee MDPI, Basel, Switzerland. This article is an open access article distributed under the terms and conditions of the Creative Commons Attribution (CC BY) license (http://creativecommons.org/licenses/by/4.0/).
Share and Cite
MDPI and ACS Style
Criqui, P.; Jaccard, M.; Sterner, T. Carbon Taxation: A Tale of Three Countries. Sustainability 2019, 11, 6280. https://0-doi-org.brum.beds.ac.uk/10.3390/su11226280
AMA Style
Criqui P, Jaccard M, Sterner T. Carbon Taxation: A Tale of Three Countries. Sustainability. 2019; 11(22):6280. https://0-doi-org.brum.beds.ac.uk/10.3390/su11226280
Chicago/Turabian StyleCriqui, Patrick, Mark Jaccard, and Thomas Sterner. 2019. "Carbon Taxation: A Tale of Three Countries" Sustainability 11, no. 22: 6280. https://0-doi-org.brum.beds.ac.uk/10.3390/su11226280
Note that from the first issue of 2016, this journal uses article numbers instead of page numbers. See further details here.