Personalized Evaporative Cooler to Reduce Energy Consumption and Improve Thermal Comfort in Free-Running Spaces


Research Group in Thermal Engineering, Department of Energy and Fluidmechanics, School of Engineering, Universidad de Valladolid, Paseo del Cauce No.59, 47011 Valladolid, Spain
*
Author to whom correspondence should be addressed.
Sustainability 2019, 11(22), 6451; https://0-doi-org.brum.beds.ac.uk/10.3390/su11226451
Submission received: 18 October 2019
/
Revised: 5 November 2019
/
Accepted: 12 November 2019
/
Published: 16 November 2019
(This article belongs to the Special Issue The Application of Renewable Energy in Sustainable Architecture)
Abstract
:The need to reduce energy consumption in buildings is imperative, but we must maintain individual thermal comfort of the occupants to ensure their well-being and productivity. Personal conditioning systems (PCS) have been suggested as a strategy to achieve both energy efficiency and thermal comfort, as they are considered to be low-energy consumers, allow increasing set-point temperatures, and give occupants the chance to control their own personal environment. While most warm-environment PCS are based on air-movement devices, the potential of using desk direct evaporative coolers (dDEC) has been scarcely explored. This work presents the results of the characterization of a dDEC and its potential for improving the indoor temperature and thermal comfort in a free-running office space. The study proposes adapted corrective power (CPa) and cooling fan efficiency for evaporative systems (CFEe) indexes. Results show that the dDEC achieves thermal comfort with a local effect, and it is recommended to be positioned directly on the desk surface, orientated to the occupant, and at a certain distance. Under these conditions, the CPa reaches −2.8 °C, involving better CFEe than the desk fans studied in the literature. Speed has little effect on the local air conditions, though it does improve the perception of thermal comfort. The relative humidity of the air does not exceed the recommendable limits, but renovation of the indoor air enables better conditions.
1. Introduction
1.1. Energy Context: Toward Net Zero Energy and Carbon
Urban populations can spend an average of 80 to 90% of their time in indoor spaces [1] and use heating, ventilation, and air-conditioning systems (HVAC) to achieve thermal comfort and good air quality. Data regarding European building stock highlight that these buildings are responsible for approximately 40% of energy consumption and 36% of CO2 emissions, hence, they are largest energy consumer in Europe. Currently, approximately 35% of the building stock of the European Union are over 50 years old and almost 75% of buildings are energy inefficient [2]. Buildings in Spain account for 31% of all energy use in the country, with 66% of this energy consumption attributed to HVAC [3].
Worldwide, most adults spend one-third of their life at work [4]. Furthermore, office buildings represent 23% of the total non-residential floor space in Europe and, together with wholesale and retail trade buildings, account for more than 50% of energy use from non-residential buildings [5], with one third of their energy consumption attributed to HVAC [6].
Over the last few years, issues have arisen in Europe that are closely related, including global warming awareness, the energy efficiency of buildings, the risk of overheating, alongside the achievement of human comfort in indoor spaces.
Energy efficiency improvement in buildings relies on the reduction of energy demand, an improvement in the performance of the building services (HVAC, lighting, and hot water supply) and the integration of renewable energies [7,8]. These strategies should not hinder the objective to ensure thermal comfort for occupants, although frequently this is not achieved. In order to reach the European goals for 2050, the Directive 2010/31/EU introduced a mandatory implementation of nearly zero energy buildings (nZEB) by 2021 [8]. The approach toward this ambitious target must be cost-optimal to make nZEB cost-effective and to always maintain the high expectations of the occupants in terms of indoor comfort [9].
1.2. Occupants’ Thermal Comfort: Personal Control Over the Thermal Environment to Improve Satisfaction
In tertiary buildings, especially in medium and large companies, it is common to implement HVAC services to achieve a certain indoor climate for the entire space, despite the energy bills. Moreover, due to gender, age, and other human factors, these systems do not always provide thermal comfort for all occupants. The same HVAC systems can also be a source of indoor contaminants if disregarded, affecting occupant health [10].
In addition to this, under general HVAC systems, occupants are not able to freely adjust the set-point temperature or air movement to their personal thermal requirements, while greater possibilities of personalized control over climate quality can transform into a wider tolerance to indoor climate conditions [11,12,13,14]. Personalized thermal control even achieves decreased HVAC energy consumption, as shown by individuals’ feedback conducted by Li et al. [15]. Moreover, a poor indoor climate can also affect occupant productivity, which personalized control can improve [16,17,18]. User control is, therefore, essential for individual satisfaction [19].
Consequently, this scenario requires not only an improvement in the efficiency of centralized HVAC services, but also the consideration of new ways to provide control for occupants over their personal thermal environment, which results in a greater tolerance of temperature and decreased HVAC system energy consumption.
1.3. Personal Conditioning Systems: Energy Saving and Increased Comfort
In order to improve individual occupant satisfaction while saving a significant amount of energy, several studies highlighted the adequacy of personalized comfort systems, especially for those spaces with sedentary occupants, such as offices [12,20,21,22,23].
While conventional services approached the entire volume of the occupied space, personal conditioning systems (PCS) acclimatized the micro-environment of each occupant by providing direct cooling to the individual’s body [20]. It was found that the implementation of PCS allowed relaxation of the global temperature range without increased thermal comfort dissatisfaction. This provided a decrease in energy consumption due to lower energy requirements compared to general HVAC systems and relaxation of the set-point temperature [22].
As Hoyt, Arens, and Zhai [22] indicated, by incorporating PCS, the indoor set-point temperature was increased in cooling mode without compromising individual thermal comfort. They found that increasing the indoor set-point temperature by 1 °C saved about 10% of the energy consumed for air-conditioning. Therefore, making use of these complementary devices could influence the design of the HVAC systems, which are commonly oversized in order to reduce the transient discomfort when people enter the conditioned indoor environment from an extreme outdoor climate [24]. In addition, PCS allow users to control their thermal environment, adapting it to their personal requirements. Thus, PCS enhances both energy saving and perceived comfort [21].
Among the typical technologies to provide individual thermal comfort reviewed in the literature [21,25,26], are:
- Ventilation: desk fans, ceiling fans and nozzles;
- Radiant cooling and/or heating: footwarmers, legwarmers or radiant panels;
- Evaporative coolers, which also provide humidification;
- Comfort chairs, possibly incorporating thermo-electric devices and/or fans;
- Garments, which usually incorporate phase-change materials and/or fans.
Recent studies demonstrated that air movement plays an important role in thermal comfort [27], so strategies followed for warm environmental conditions are based on personalized ventilation. However, individual ventilation may not be an effective strategy for heating, because high air speeds can create a risk of local discomfort due to draught rate.
Nicol and Humpreys [28] stated that, although EN 15251 allowed an increase in neutral temperature for air speed if the occupant has direct control of air movement, e.g., through a fan, its application in free-running buildings was uncertain. They also concluded that humidity had little effect on the neutral temperature, though this may create discomfort with temperature rises above neutral conditions.
Zhai et al. [29] demonstrated that with the use of personalized ventilation, thermal comfort could be maintained even if room temperatures reached 30 °C for a relative humidity of about 60%. Through their revision of the literature, Veselý and Zeiler [25] determined that, if a maximum of 1.5 m/s air speed was driven toward the upper body region, thermal comfort could be achieved under air temperatures up to 30 °C.
In order to characterize the efficiency of the air-movement-based personalized devices, Zhang et al. [18] introduced the concept of corrective power (CP), defined as “the difference between two ambient temperatures in which the same occupant thermal sensation is achieved—one with PCS in use, and one without PCS (i.e., uniform environment) as the reference condition”.
The advantages of PCS for individual body cooling have motivated various researchers to explore their effectiveness [20,21,30]. Schiavon and Melikov [30] studied the performance of conventional and low power fans and found that their cooling efficiency was good compared to conventional fans. They also studied the cooling effect on different body parts in terms of thermal sensation and thermal comfort.
1.4. Personalized Evaporative Coolers
The majority of PCS proposed for warm environments are based on personal ventilation. Studies where personal evaporative coolers are implemented are very scarce [24,31,32], and they are usually contextualized in a conditioned space [24,32].
Evaporative cooling is a well-known technique in HVAC systems, either by reducing air temperature through an adiabatic evolution of the humid air or by water cooling through cooling towers [33].
The phenomenon of evaporative cooling bases on the evaporation of water within non-saturated air, decreasing the temperature due to the energy that water requires to evaporate. Its application is particularly effective in hot and dry climates [32], where relative humidity is low, especially in naturally ventilated buildings; furthermore, these occupants accept a significantly wider range of thermal conditions compared to those of buildings with mechanical cooling [11], so the increase in relative humidity is compensated. Therefore, small or medium-sized direct evaporative coolers aimed toward personal cooling are more common in homes and small businesses in hot and arid regions [31,33].
Yang, Cui, and Lan [33] highlighted cost-effectiveness and its potential for energy saving among the benefits of this passive cooling technology, but also its “environmental friendliness” because it avoids, or at least limits, the use of some refrigerants which can increase danger to the environment.
Compared to other diverse technologies for personal cooling, the effect of evaporative coolers is due not only to air movement but also to decreased air temperature, resulting in a larger cooling capacity. In order to increase their portability and, therefore, their applicability for personal cooling, Day and Sumathy [31] focused their research on the development of evaporative cooling devices with smaller sizes and weights, but increasing their cooling capacity for personal cooling.
The purpose of this research was to study the potential of a desk direct evaporative cooler (dDEC) to improve the indoor temperature and the thermal comfort in an office space under free-running conditions by adapting the concept of corrective power (CP) for evaporative coolers.
2. Materials and Methods
In order to study the potential of the selected dDEC, it is firstly characterized in terms of air conditions provided (saturation efficiency, air velocity and flow rate). Then this paper analyses its capability to improve the thermal conditions at an occupied office spot, by testing its effect on a climate chamber simulating an office space.
This section describes the methodology followed towards this purpose. It firstly presents the proposed system; then, the testing space and measuring equipment used. Finally, it explains the tests performed and the different operating parameters analysed.
2.1. Desk Direct Evaporative Cooler (dDEC)
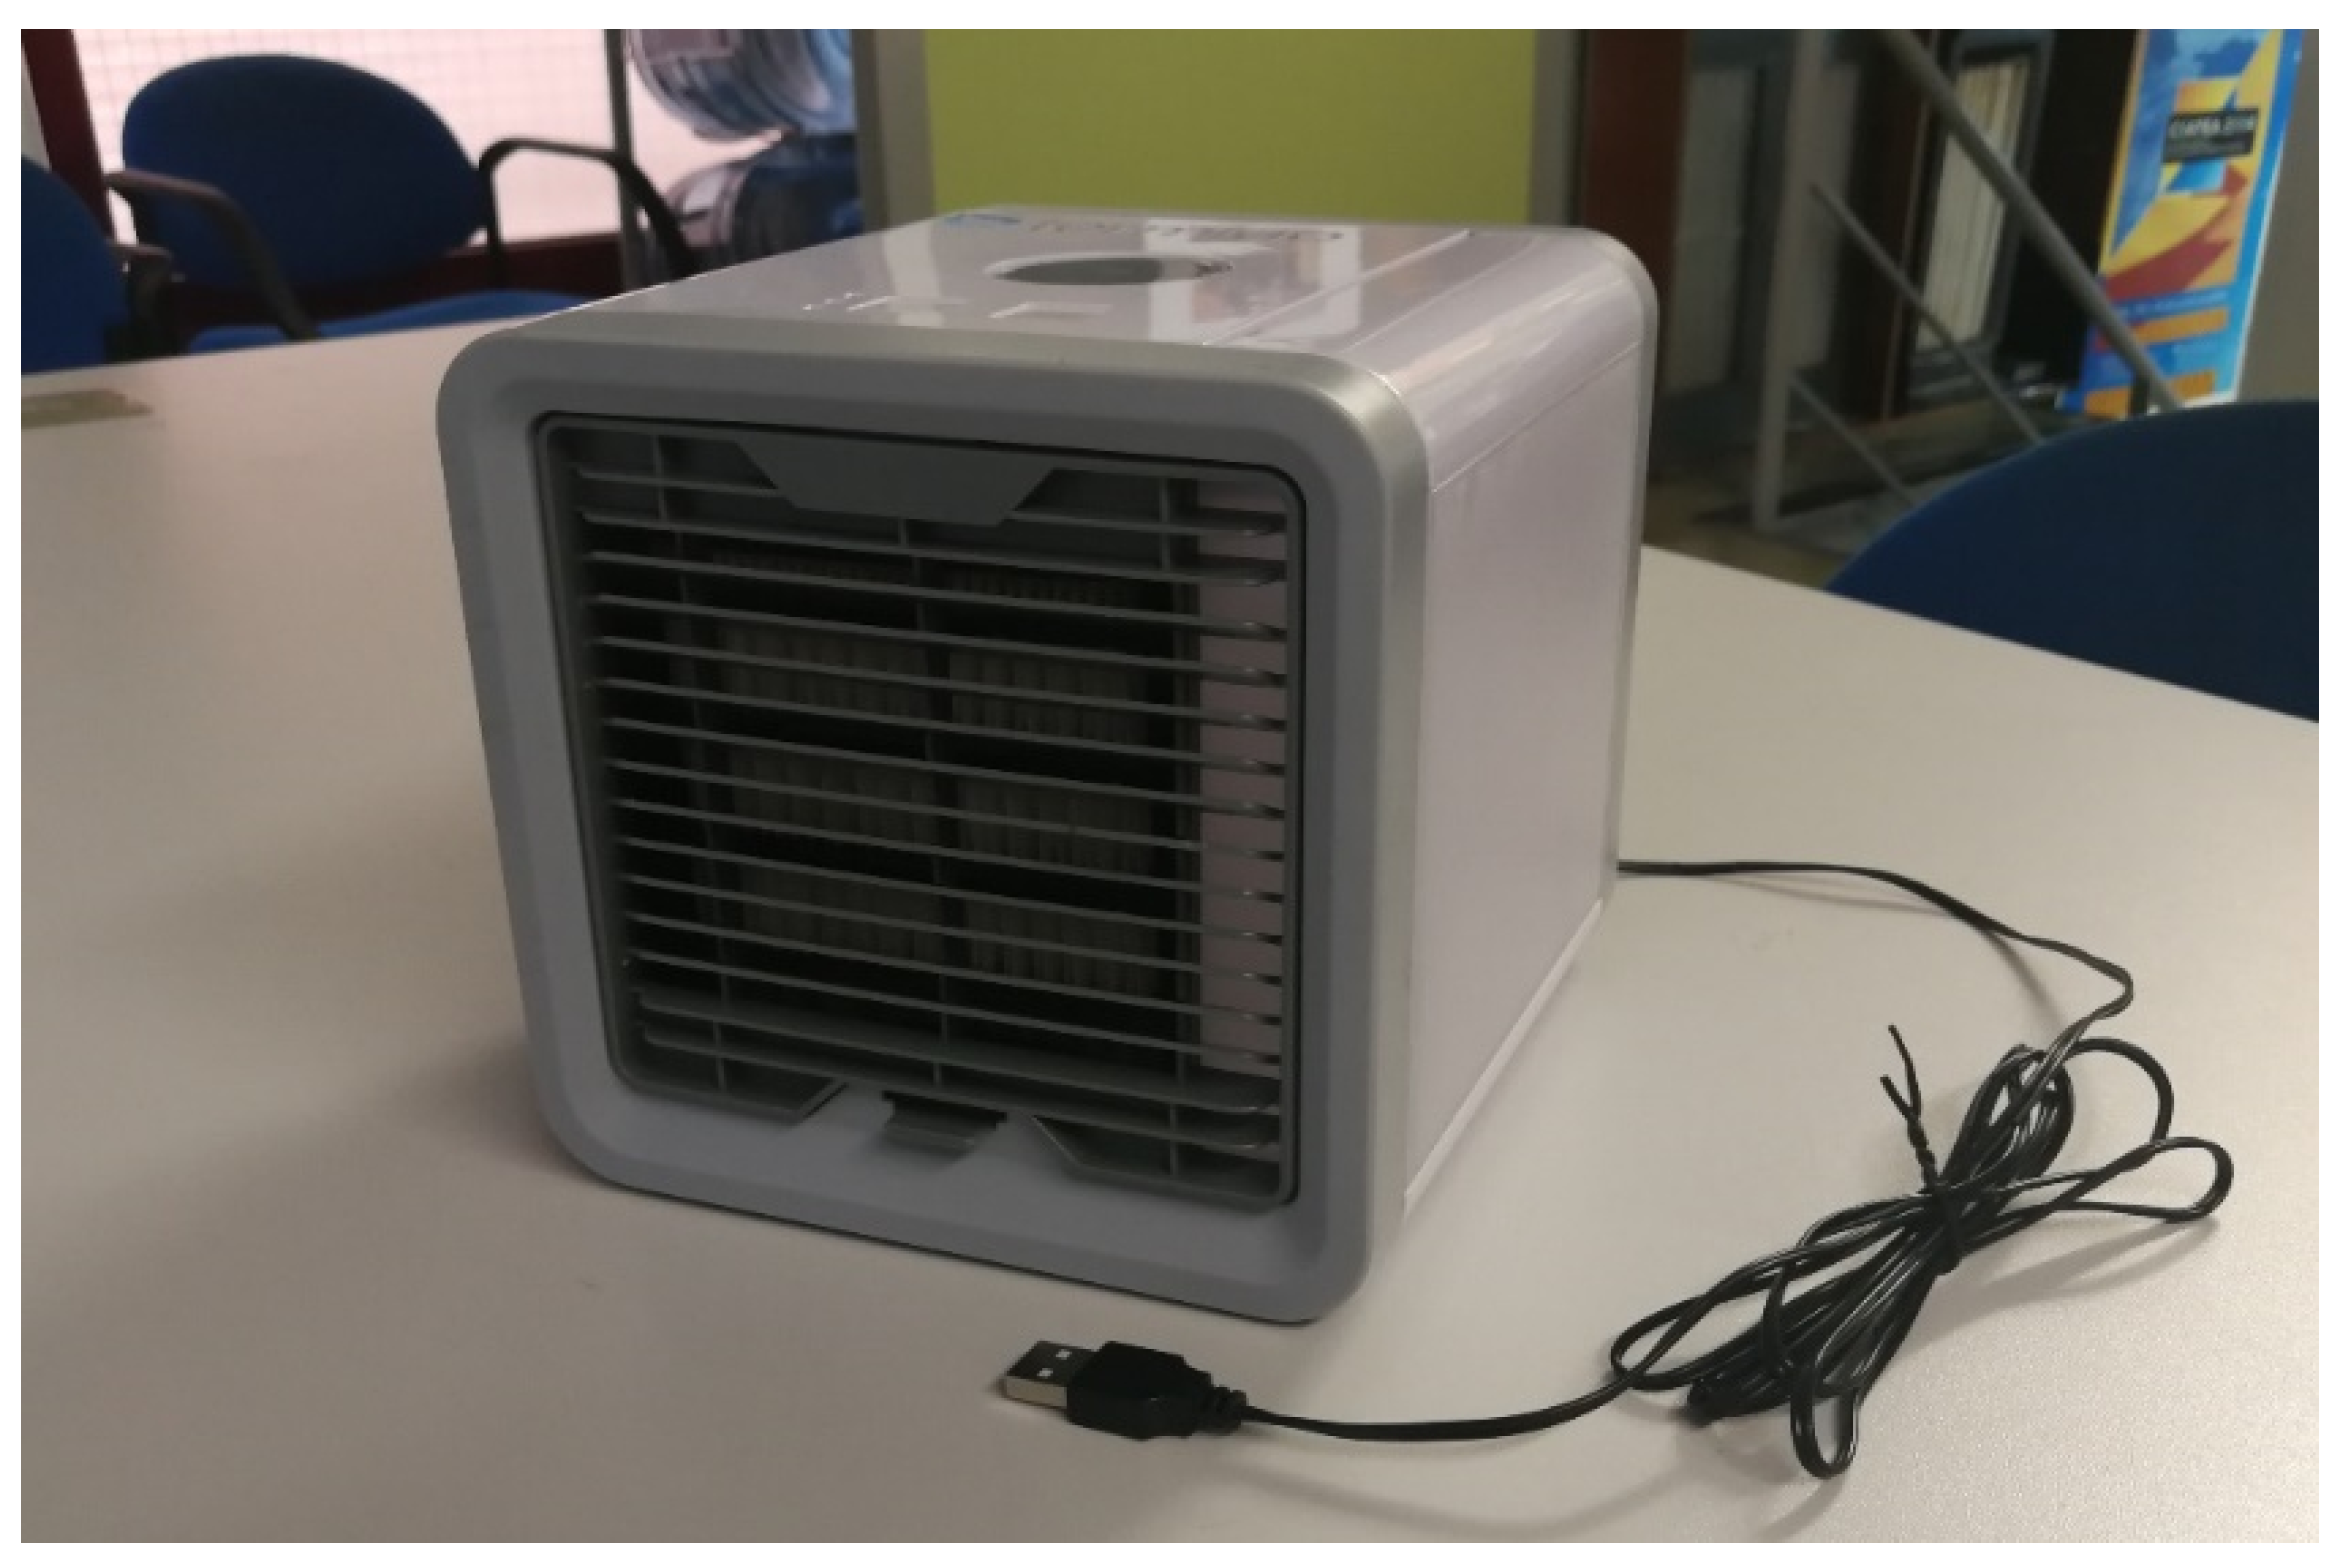
The target system was a commercial, personalized cooler to be placed at a desk, where the effect was based upon the adiabatic, evaporative cooling phenomenon (Figure 1). Its dimensions were 16.5 cm × 16.5 cm × 17 cm and its weight was 0.86 kg while dry. It was equipped with a small fan with three speed levels and a media that became humid by capillarity from water available at a small side tank. Hence, evaporation in the dDEC took place from a humid surface. It was plugged in via a USB and was said to require only 10 W. The specifications of the product stated a 2 m2 actuation area and 6–8 °C as the lowest temperature achievable, enabling up to 8 h of operation under the lowest speed level. No further technical specifications were available.
2.2. Case Study and Measuring Equipment
This work focused on the application of the proposed dDEC to improve the thermal conditions in offices of free-running buildings. The target space for the study was the climate chamber available at the laboratory of the Thermal Engineering Group of the University of Valladolid, which was prepared and equipped to simulate an office space with two desks.
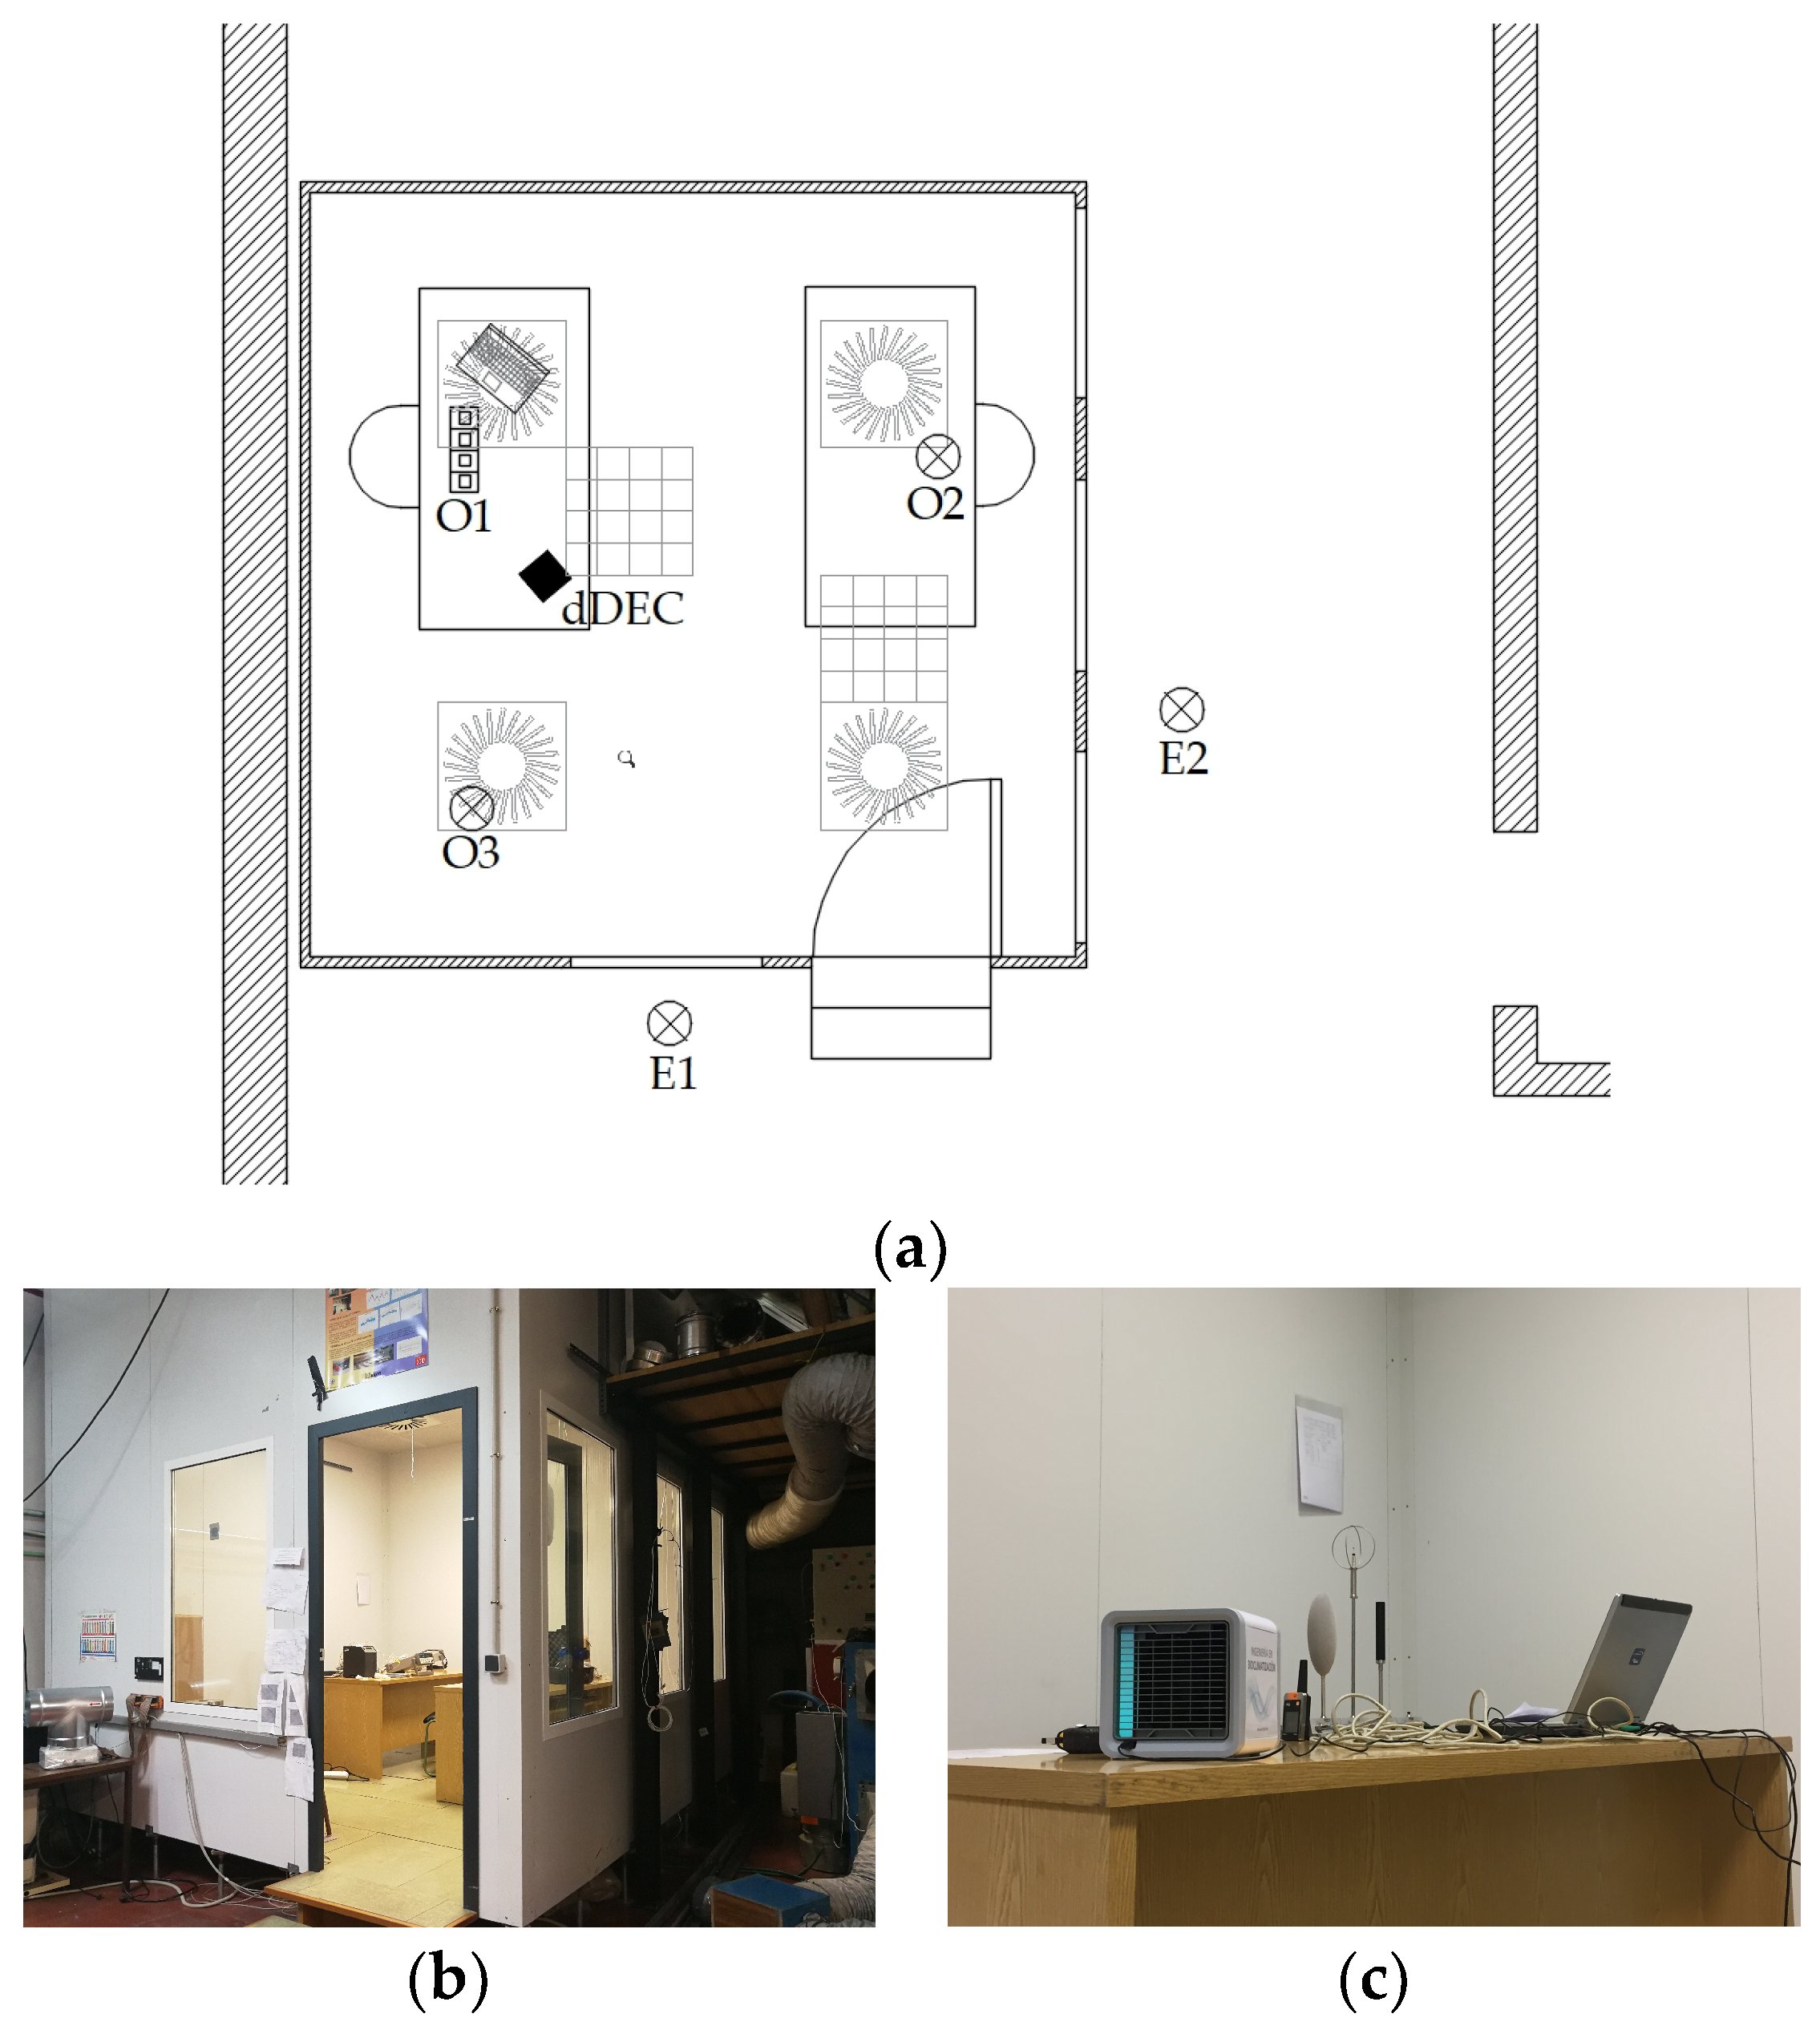
The climate chamber had dimensions of 4 m × 4 m × 3 m and was built with 40 mm polystyrene sandwich panels with 0.6 mm steel plating. It had four windows 0.9 m × 1.4 m each, which were double-glazed 4/8/4, and a door with dimensions of 0.82 m × 2.04 m, with a total glazed area of 6.7 m2 (Figure 2). Performing the tests in this isolated space permitted us to disregard transmissible thermal loads. The chamber permitted ventilation to be supplied through four rotational diffusers and had two luminaires equipped with four lamps each.
Lighting yielded a total sensible load of 228 W and the only electric device was a personal computer with an expected sensible load of 250 W. Occupation during the tests ranged from 0 to 3, generating 75 W and 55 W per person as the sensible and latent loads, respectively, considering sedentary activity (1.2 met) [34]. Due to the absence of transmissible thermal loads and because ventilation, when supplied, was of the same conditions as the ambient air of the climate chamber, the only variable thermal loads were due to occupation.
The measuring equipment was placed within the space, as shown in Figure 2. The measuring point O1 corresponded to the occupied desk where the dDEC was placed, whereas O2 was on an adjacent desk without a dDEC. Only the former desk was expected to be constantly occupied and was equipped with the thermal comfort measuring equipment Vivo Comfort, obtained from the manufacturer Dantec Dynamics. Both O1 and O2 points also had Testo 173 sensors.
The measuring points E1 and E2 were Testo 175 sensors placed in the laboratory out of the climate chamber and aimed to check that air conditions out of the target space did not vary, thus validating the hypothesis that no transmissible thermal loads occurred.
Finally, another sensor, Testo 175, was placed at measuring point O3, corresponding to the outlet of one of the diffusers, to ensure that air conditions were also maintained during the tests when ventilation was implemented. The ventilation airflow supplied was measured using an airflow rate meter before the beginning of the corresponding test. O2, O3, E1, and E2 measured the temperature and relative humidity. Table 1 describes the measuring equipment used and their characteristics.
2.3. Performed Tests
First, the air conditions provided by the dDEC were characterized for each of the three speed levels. Airflows were obtained from the average air velocities measured with the hot wire anemometer, as indicated in Table 1, and the measurements were taken on a 3 × 3 grid of a plenum adapted at the dDEC outlet. Temperature and relative humidity at the system inlet and outlet were also measured to determine the saturation efficiency achieved. Actual power requirements for each speed level were measured using the multimeter, as described in Table 1. The obtained values are described in Section 3.1.
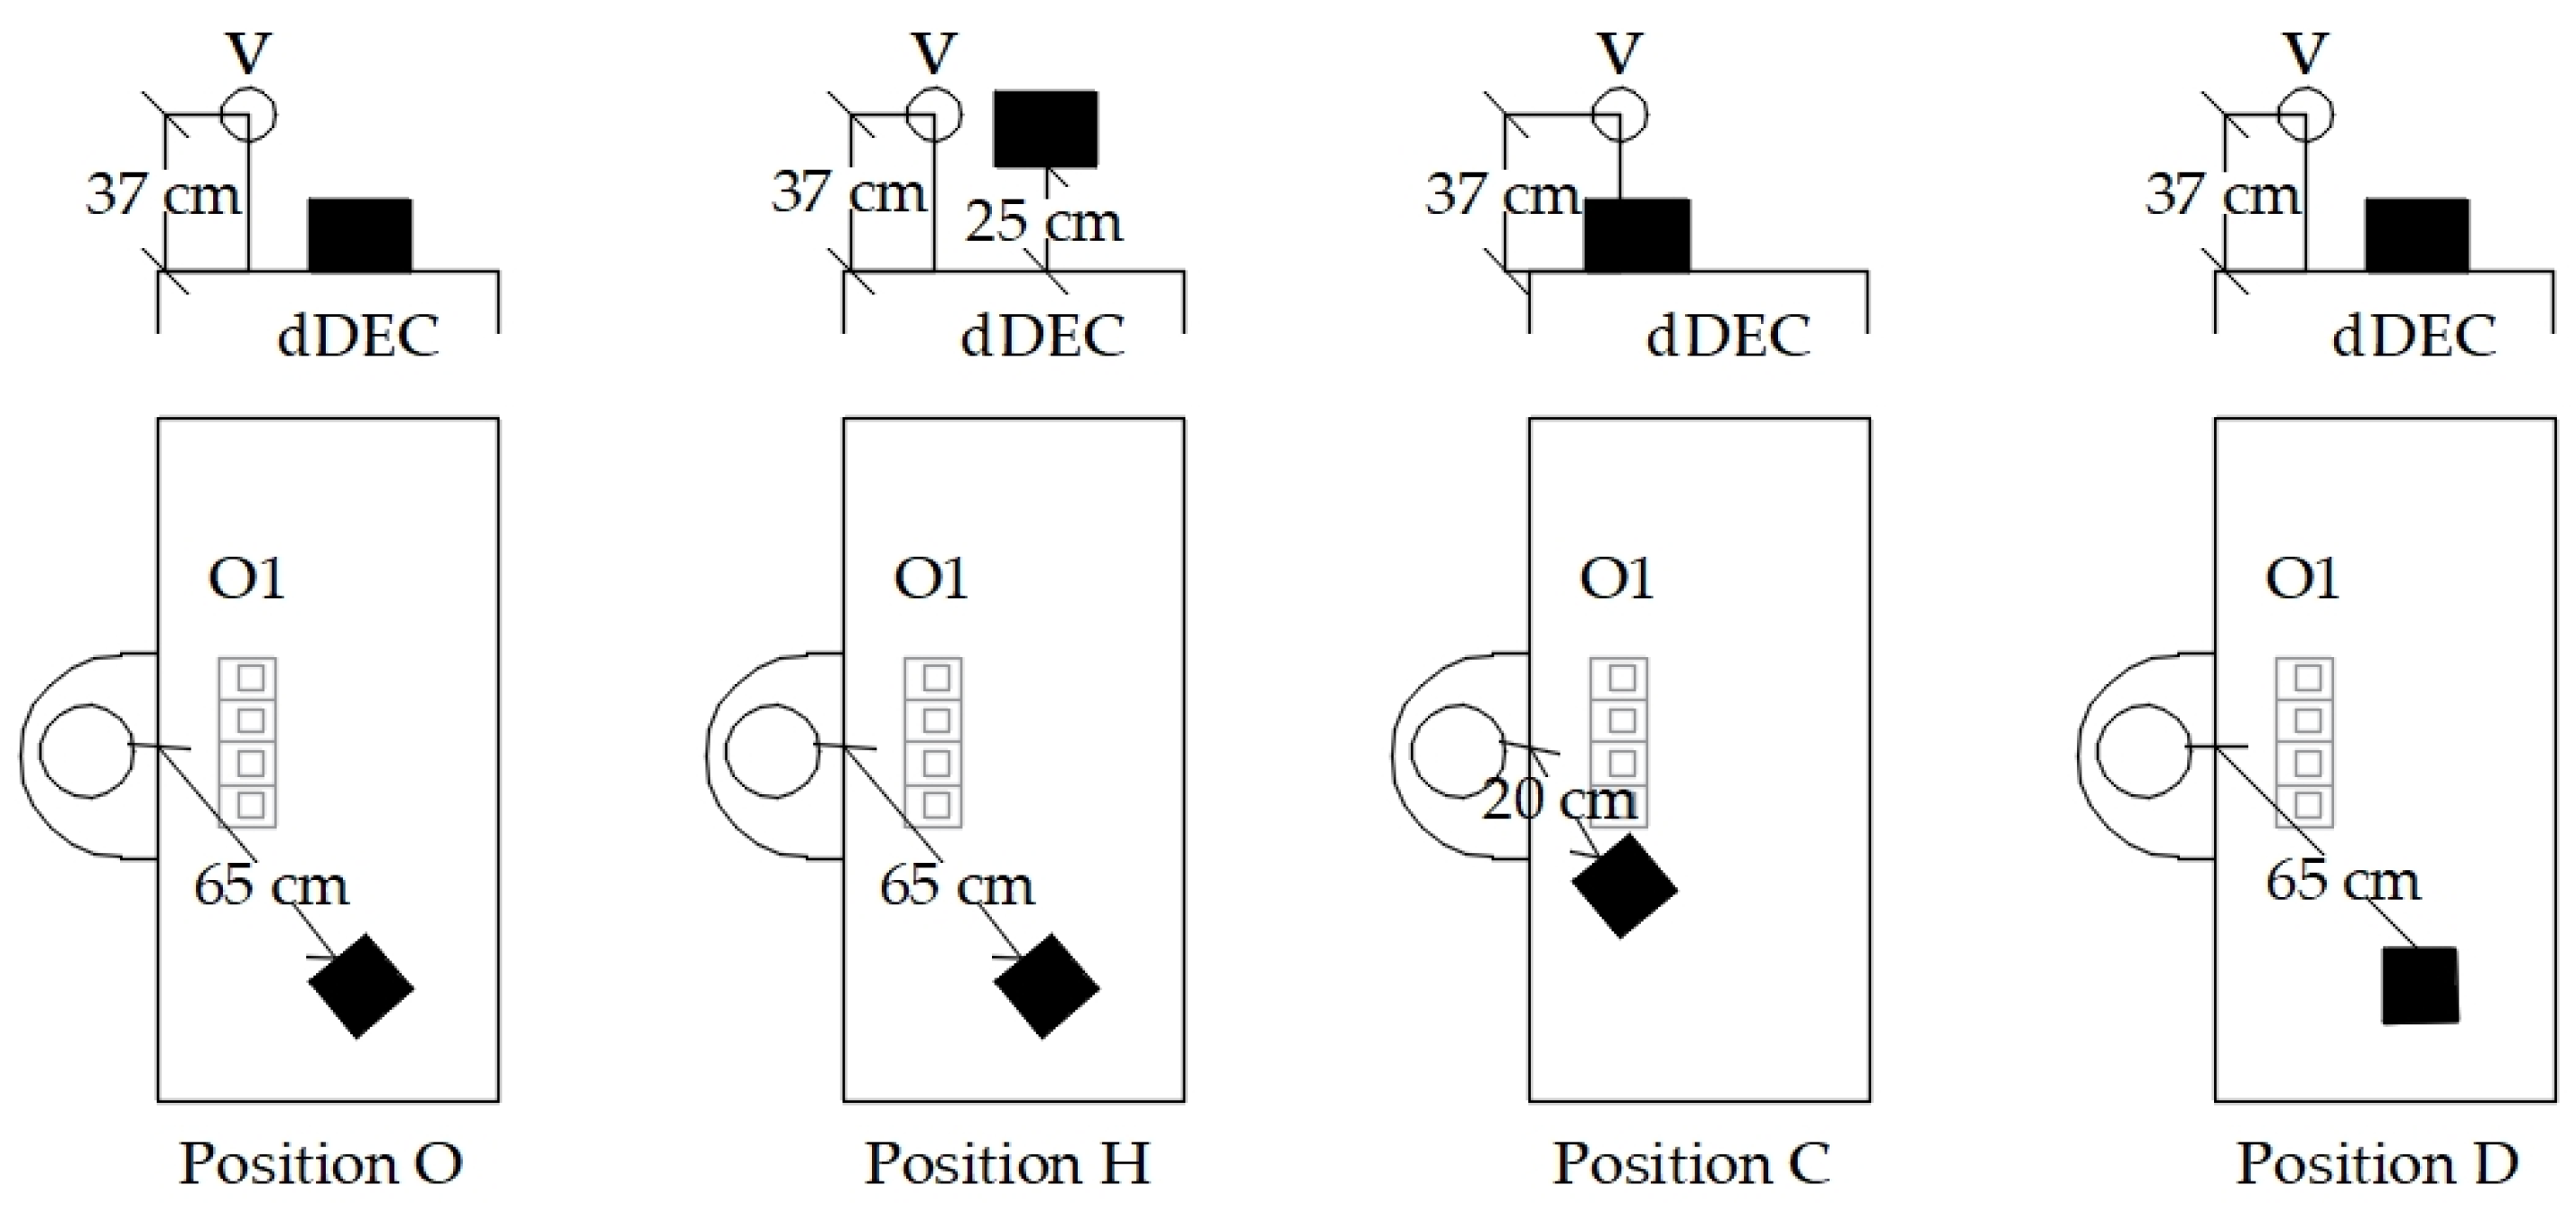
Next, the system was characterized within the target space and placed on the occupied desk. With the aim of studying the improvement introduced on the thermal conditions, several combinations of influencing parameters were reproduced during three tests. The parameters considered included the system speed level, its position on the desk relative to the occupant (Figure 3), and the possible existence of general ventilation in the target space to replace the indoor air. Table 2 decribes these parameters.
The different combinations of parameters studied in each of the three tests are described in Table 3.
The total duration of each test varied between approximately 3 to 4 h depending on the requirements of the parameter modifications.
To study the evolution of the thermal conditions during the tests, the air dry bulb temperature, the relative humidity, and the velocity were monitored together with the predicted mean vote (PMV) and the draught rate (DR); the latter two corresponded to Fanger’s thermal comfort model [34]. Monitoring of the PMV focused on approaching the acceptable indoor thermal comfort categories, namely I, II, and III representing the most, average, and least restrictive levels, while DR monitoring permitted observation of any risk of thermal discomfort due to draught.
Because the dDEC is a personalized system, the study of its cooling potential at the target space was proposed for only one office worker as the baseline occupation condition. The occupant was sedentary and their garments corresponded to 0.5 clo, i.e., the expected amount of clothing in a free-running space during summer. Occupation was not restricted during the tests, thus enabling the study of the effect of door opening and punctual occupation peaks, thereby reproducing real conditions in offices.
2.4. Adaptation of Efficiency Indexes to Evaporative Personalized Coolers
In order to study the efficiency achieved by the target dDEC, this research proposed an adaptation of the corrective power (CP) index to enable its use in this evaporative cooling case. Contrary to the CP used in the literature [18], which quantified the capability of correcting the temperature toward neutral conditions only with the perceived effect of air velocity, the proposed adapted corrective power (Cpa) was defined as
where ΔTev is the temperature modification due to evaporative cooling and ΔTfan is the temperature modification due to the air conditions induced by the device’s fan.
In this case, working with comfort measurement equipment, ΔTev is the temperature difference between the occupied zone with the dDEC and the reference case
and ΔTfan is the temperature difference for the same predicted mean vote under different conditions of air velocity and relative humidity, hence,
Finally, the cooling fan efficiency (CFE) index proposed in the literature for personalized ventilation systems [27] was also adapted to personalized evaporative coolers by using Cpa instead of the cooling effect of the fan. Thus, the evaporative cooling fan efficiency (CFEe) was described as
where is the electric power required by the device in W, thus, CFEe is given in °C/W. This index allowed a fair comparison between different personalized devices in terms of the effect generated against power required.
3. Results
The results obtained throughout the tests described above are presented herein.
3.1. Air Conditions Provided by dDEC
To characterize the air conditions provided by the dDEC, the saturation efficiency was studied [36].
where Tin is the inlet temperature of the dDEC, Tout is the outlet temperature, and Tsat in is the saturated temperature at the inlet conditions.
Table 4 describes the results obtained for the saturation efficiency, air velocity, and air flow rates measured at the dDEC outlet. These were average values obtained from the measurements performed on the 3 × 3 grid, as defined in Section 2.3. Table 4 also shows the values for the electric power obtained at each air speed level through the voltage and current values measured with the multimeter. These values corresponded to the dDEC connected to a personal computer, and were much lower than the power given in the technical specifications.
3.2. Conditions Achieved in the Office Space
Before studying the evolution of comfort conditions in the target space, the hypothesis that no transmissible thermal loads existed required validation. This was checked using the results presented in Table 5, showing that the conditions outside of the target space (measuring points E1 and E2) were maintained. This table also demonstrated that the temperature and the relative humidity of air supplied through the climate chamber diffusers during the second test were maintained at the same baseline conditions.
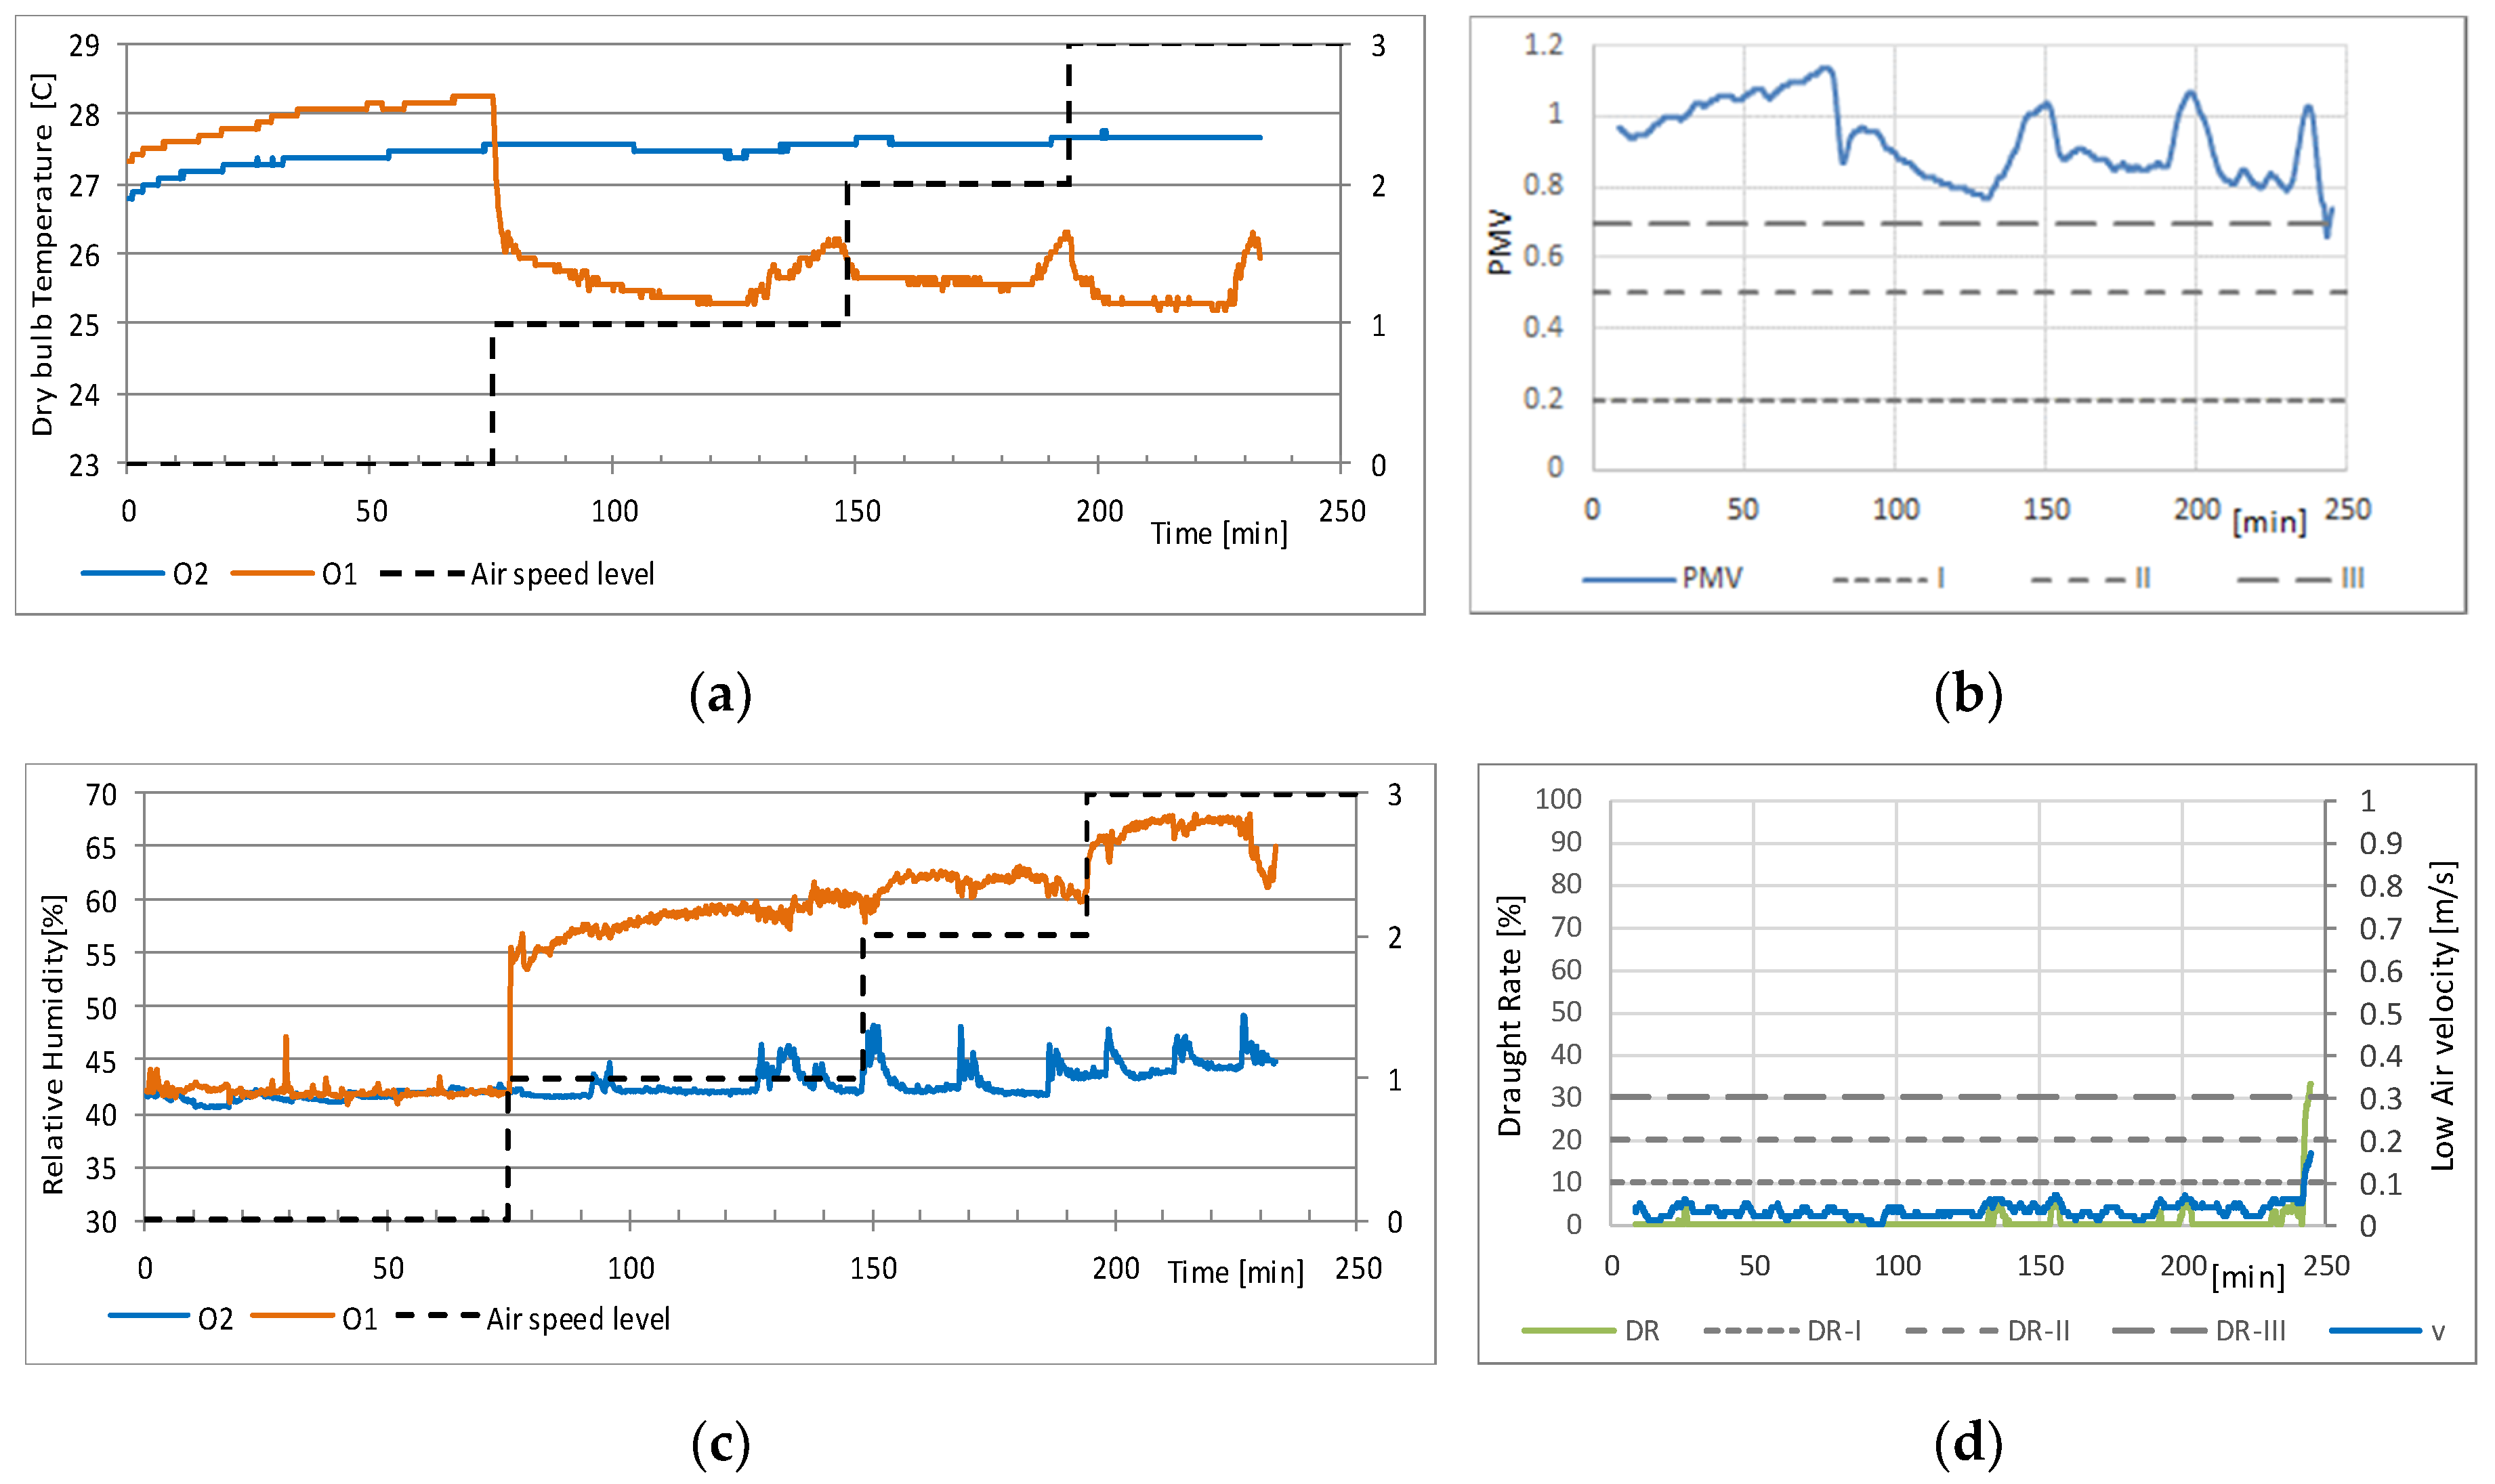
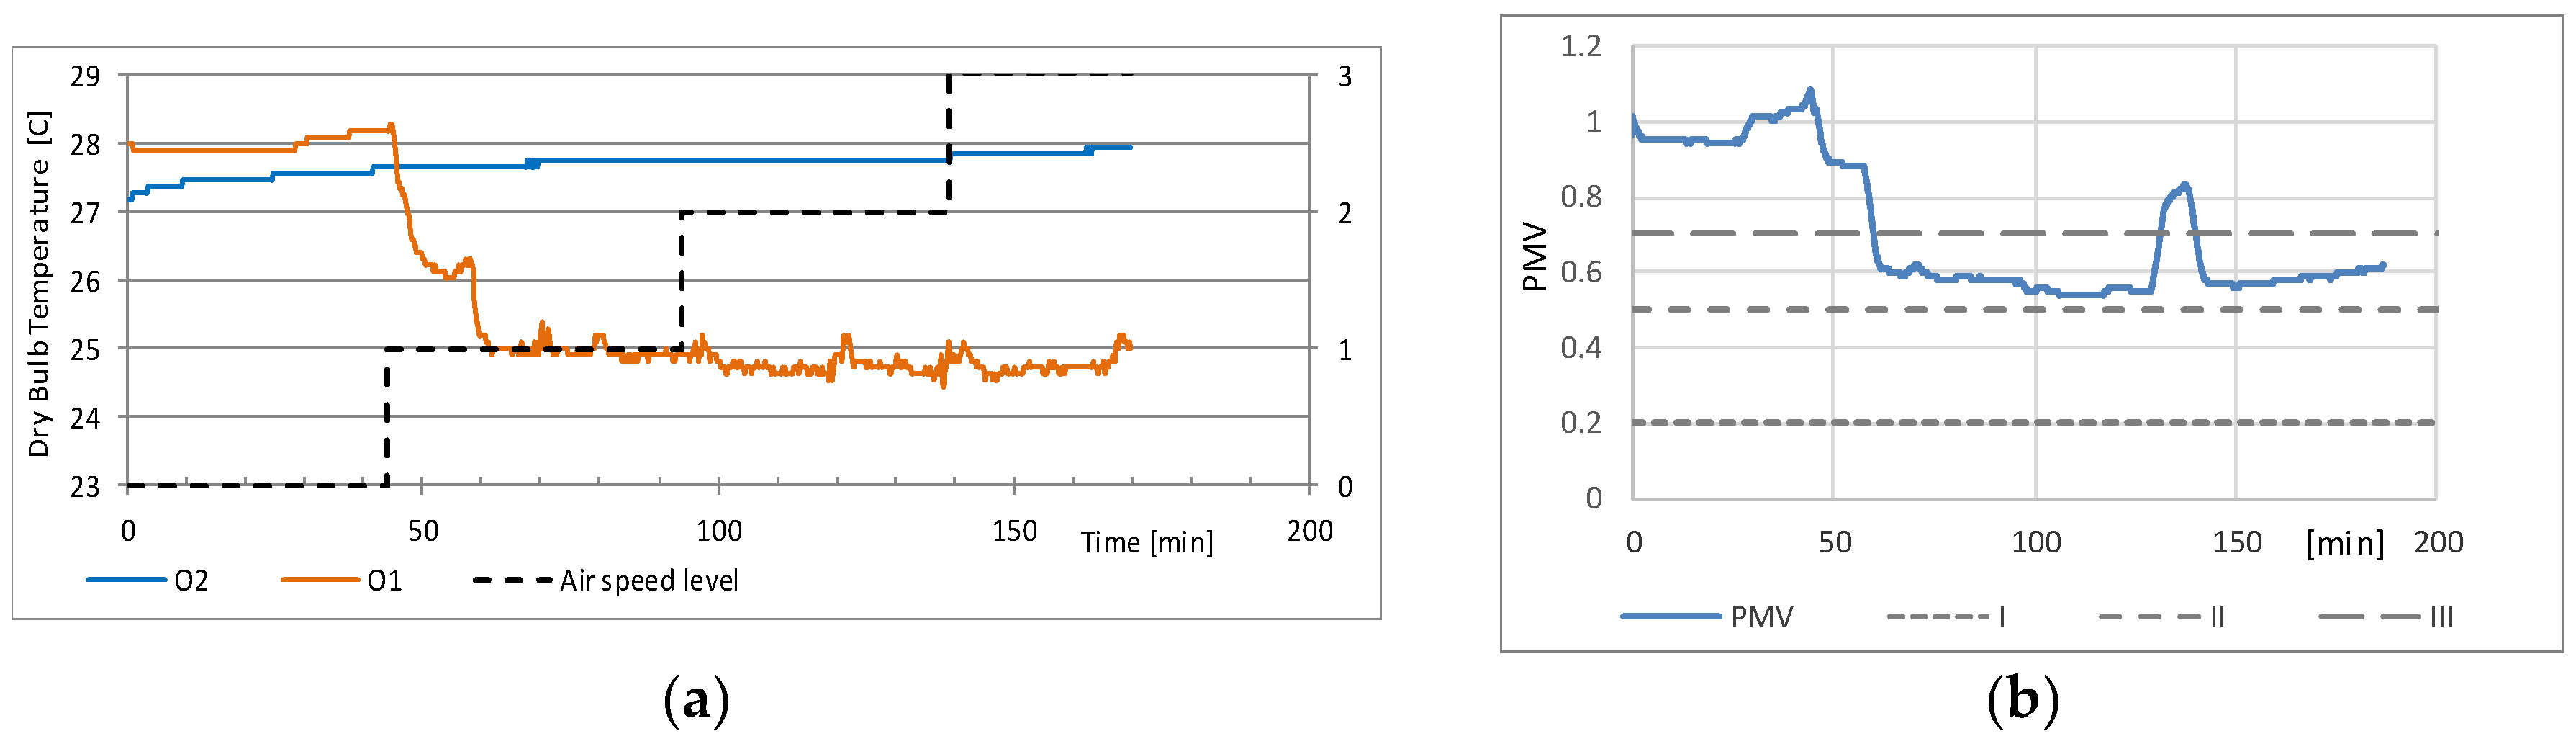
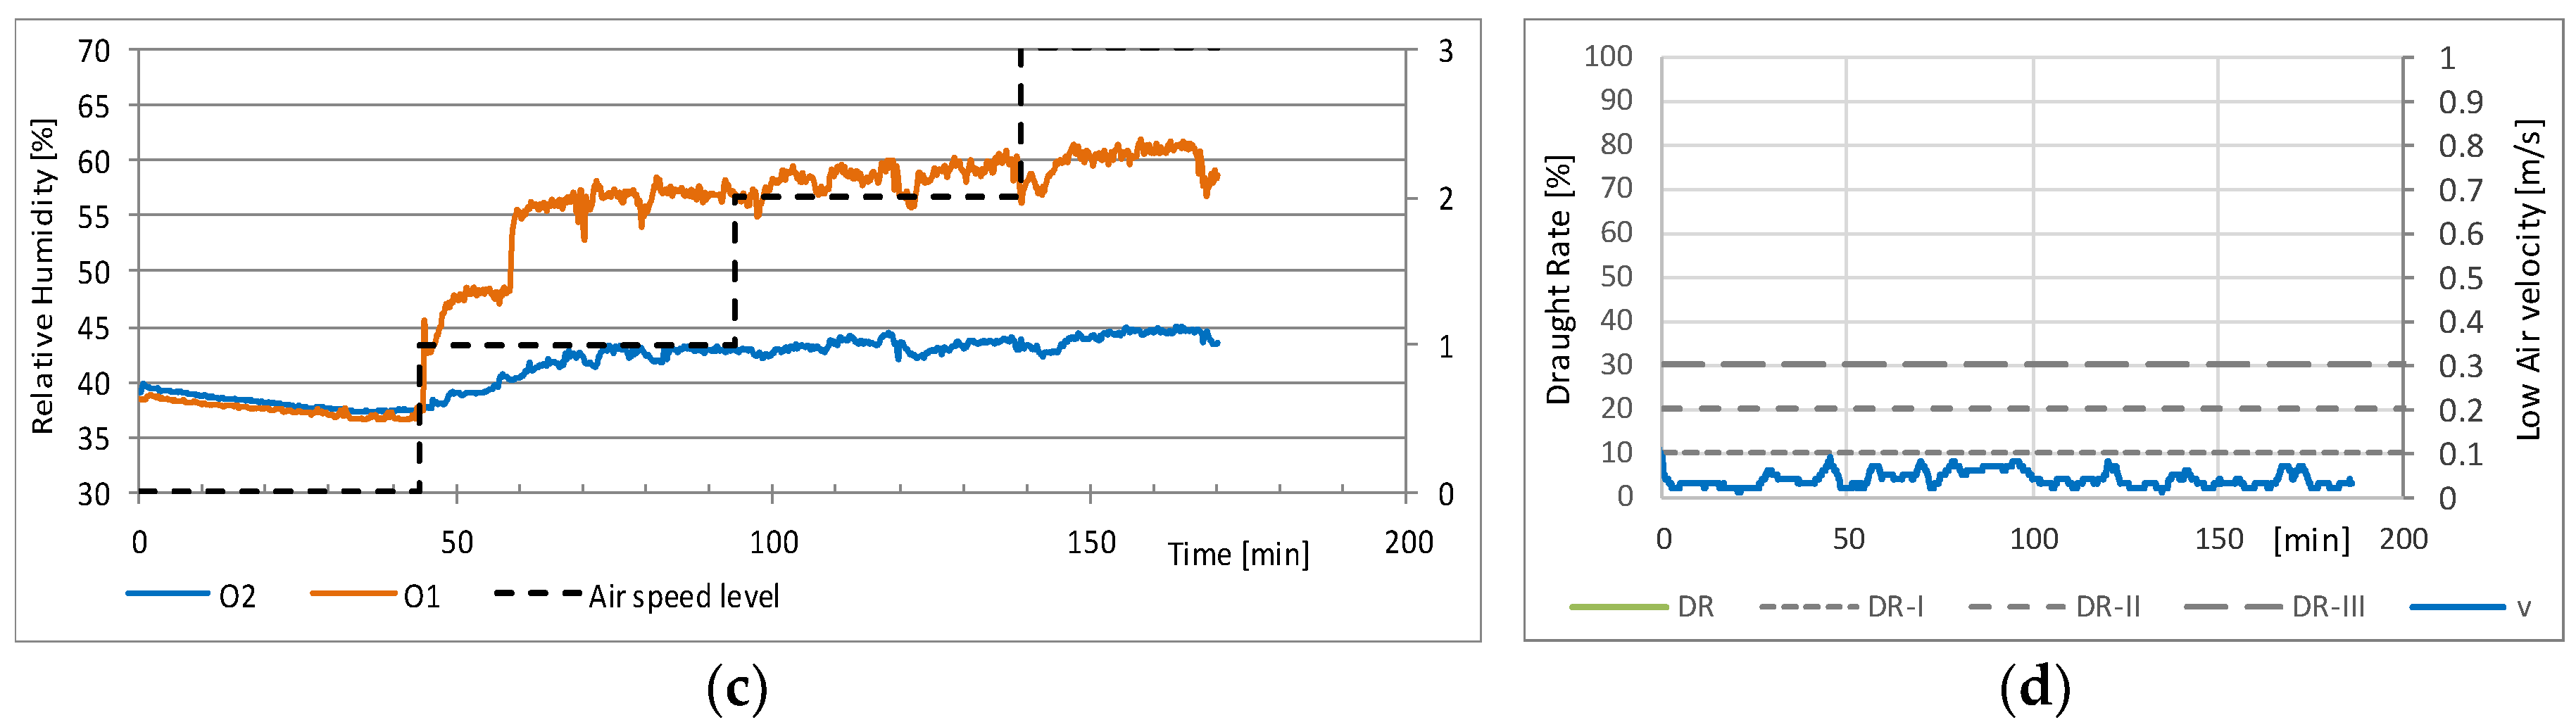
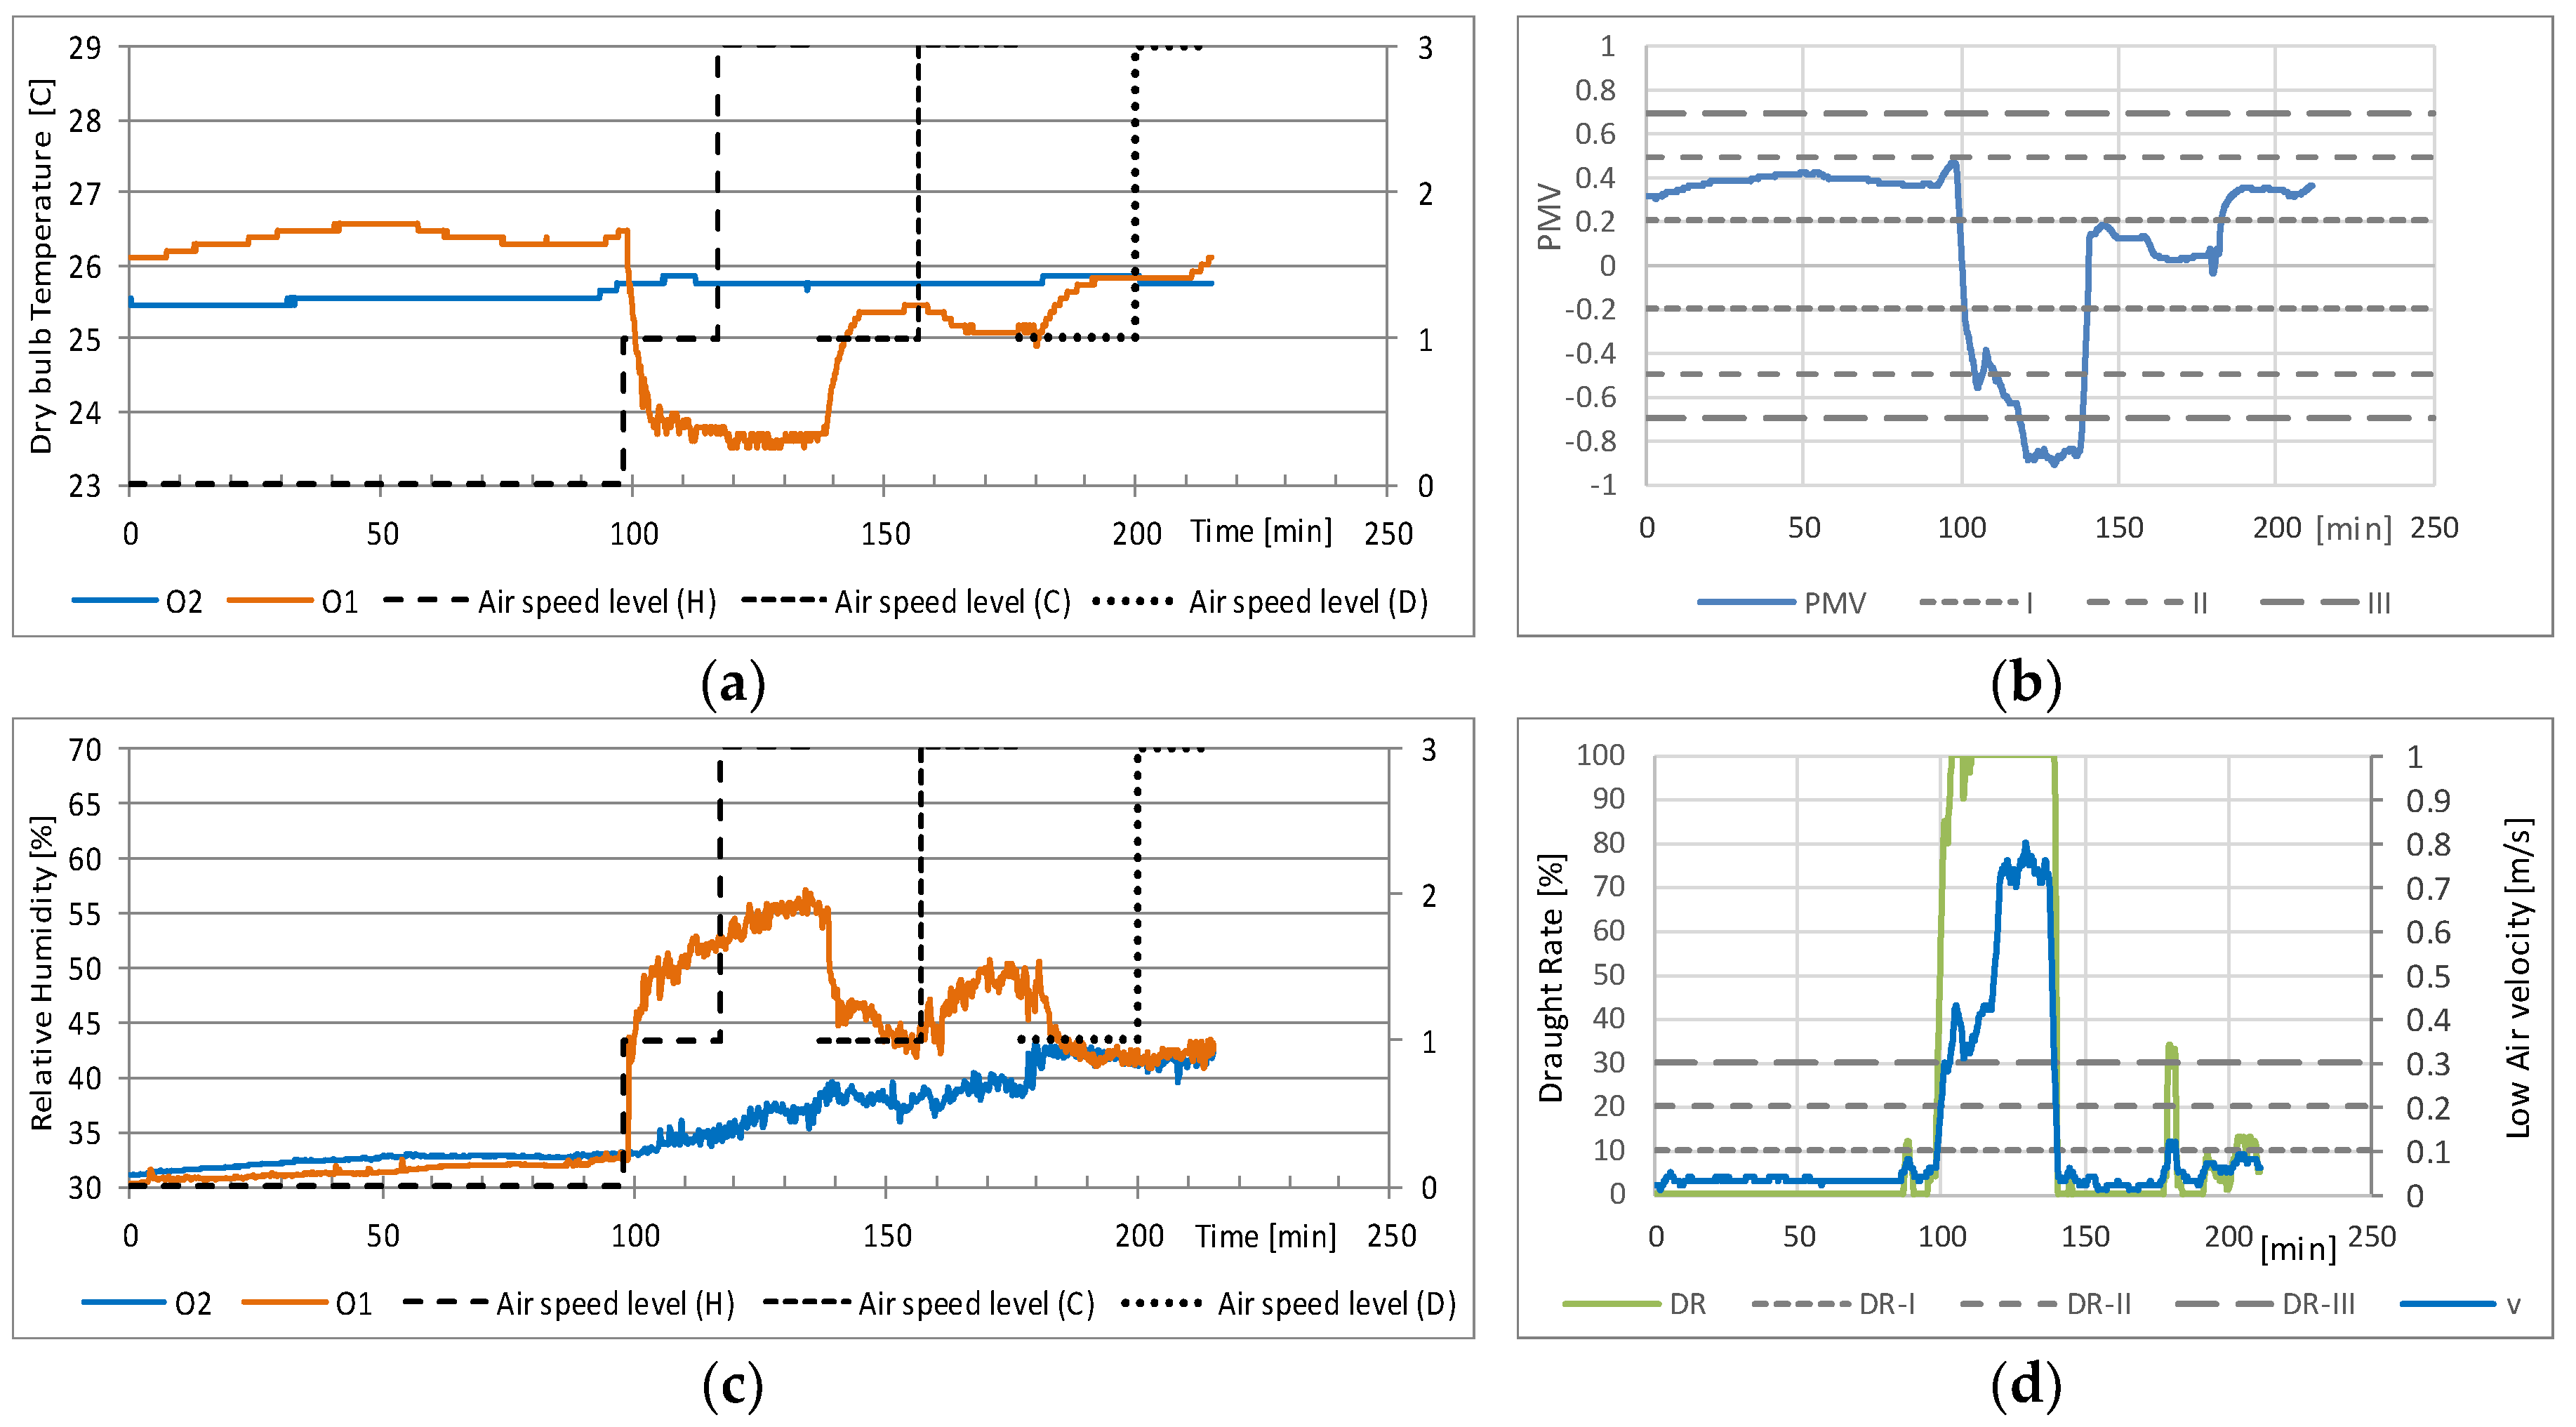
Figure 4, Figure 5 and Figure 6 present the measured variables during tests 1, 2, and 3, respectively. In all tests, the measuring started without the dDEC. The periods when the dDEC operated under the different possible modes (flow rates) are shown. The three comfort levels, i.e., I, II, and III for the predicted mean vote (PMV) and draught rate (DR) corresponded to the limits given in the standard ISO 7730, the latter being those at risk of local discomfort [34]. The Draught rate for test 2 was not obtained due to an unexpected measurement problem. However, by comparing the evolution of the measured air velocity in tests 1 and 2, it was determined that the strictest comfort range was maintained.
In test 1, as shown in Figure 4, the dDEC started operating at the lowest air speed level (V1) 75 min after the start of the test. The air speed then increased to level V2 at minute 148 and to level V3 at minute 194. There was one occupant in the office since a few minutes before the start of the test. Occasionally, the occupation increased to two (minutes 129, 134, and 228) and even three people (minute 188). The door was open right before and after these moments of higher occupation, but also opened punctually at minutes 94, 97, 151, 170, 201, and 216.
During test 2 (Figure 5), the dDEC was started at minute 44 at air speed level V1, which was later increased to level V2 at minute 94 and to level V3 at minute 139. In this case, the office was not occupied until 26 min after the start of the test. The occupation increased for a few minutes to three people around minute 117, and later to two people around minute 135. Besides these two cases, the door opened punctually at minutes 67, 94, 120, 139, 165, and 170.
Finally, Figure 6 shows the results for test 3. The system was first placed in position H and started operating at minute 98 at air speed level V1, changing to V3 at minute 117. Th position was changed to C and the air speed level returned to V1 at minute 137, increasing again to V3 at minute 157. Finally, the system was repositioned at D, operating at the V1 air speed from minute 177 and changing to V3 at minute 200. During this test, the main occupant was in the office before the start of the test, which caused a 0.7 °C difference between the temperatures registered at position O1 and O2. However, the space was left unoccupied at minute 46 until a few minutes before the dDEC started, at which point there were three people occupying the space. Right after the start of the dDEC, the occupancy decreased to one person. Later, it increased occasionally to two people (minutes 100, 136, 177, and 211). The door opened punctually at these moments, as well as at minutes 150, 159, and 192.
3.3. Adapted Corrective Power (CPa) and Evaporative Cooling Fan Efficiency (CFEe) Indexes
This work approached the study of the efficiency of the dDEC through the indexes commonly used for evaporative cooler personalized systems, as defined in Section 2.4. These indexes applied to the different conditions reproduced in the tests performed, thereby giving the results described in Table 6.
4. Discussion
The evolution of the different variables measured during the tests not only served to characterize the potential of dDECs, but illustrated the effects of the use of a space. During the first period of the tests without the device, the thermal loads, particularly the occupation load, caused a gradual increase in the temperature measured at point O1, whereas this was near negligible at O2. Latent loads did not incur relevant variations of the indoor conditions. However, during the occasional periods when two or more people occupied the target space, temperature peaks occurred at O1, moving the thermal conditions further away from the expected range of thermal comfort.
Furthermore, at those instants when the door opened, the indoor conditions showed small, punctual variations due to the partial renovation of the indoor air. This was particularly noticeable for the relative humidity registered at O2 during test 1, which showed important peaks right when the door opened due to the effect of indoor air-mixing and partial renovation.
These punctual occupancy and door-opening effects were nonetheless softened when there was renovation of the indoor air (Test 2). In addition, the humidity registered at the work spot never exceeded 60%.
In all cases, right after the start of dDEC operation, the thermal conditions around the target work spot drastically improved. Starting the operation of the dDEC at the lowest speed level enabled a temperature drop of 3 °C (tests 1 and 2, starting from 28 °C) and 2.7 °C (test 3, starting from 26 °C), whereas the relative humidity at this speed level did not reach 60%. This allowed the achievement of the thermal comfort range recommended by the Spanish standard [35] of an indoor space operating under free-running conditions, even if those conditions reached up to 28 °C. It is also foreseeable that harsher boundary free-running conditions of above 28 °C may allow slightly larger temperature drops than 3 °C, given the previous results and the fundamentals of the phenomenon of evaporative cooling. However, the device cannot be expected to reach comfortable conditions under harsher free-running conditions, and more study regarding this is required in future work.
In terms of the predicted mean vote (PMV), operation of the dDEC improved the perceived thermal environment without clear variation when changing the speed level. On the other hand, increasing the speed level only incurred local discomfort due to excessive draught rate when placed at a certain height from the desk (position H), directly affecting the occupant’s head and chest. This effect coincided with the subjective perception of the occupants, who expressed their relative discomfort under these conditions when asked about their personal impression. Moreover, increasing the speed level generated a larger CPa only at position “H”.
Increasing the speed level had a slight impact on the ΔTev obtained. This temperature difference between the target and the reference cases illustrated that the evaporative device had a positive effect on cooling the occupied space. However, contrary to results in the literature obtained for personalized fan systems [21], the ΔTfan was not favorable in this case to the effect desired. This was because the increase in the relative humidity introduced by the system hindered the PMV, canceling out the effect of the air velocity. The only case where it appeared that the cooling effect of the velocity was not balanced out by the increase in the relative humidity was when the dDEC was in position “H”, because the air velocity sensor of the thermal comfort measuring equipment directly registered this velocity.
The overall CPa results were favorable in regard to the desired cooling effect, varying the corresponding CFEe from about 0.3 to up to 5 °C/W, which were notably better results than those obtained in the literature for desk fans, which varied from 0.1 to 0.17 °C/W [30]. These favorable results were a direct consequence of the additional effect created by evaporative cooling performed without further power needs, as in the case of capillarity humidification implemented in the target dDEC, where the consumption of the fan was the only energy requirement.
The proposed calculation for ΔTev was a fair estimation of the actual decrease in the air temperature due to the dDEC, because the air conditions measured at the reference position (O2) were maintained throughout the performance of each test. On the other hand, this demonstrated that the effect of the dDEC was local and it had a negligible impact on adjacent spaces, although it did help to softening the effect of the thermal loads. Indeed, during the 1 h 20 min of test 1 when the dDEC was not operating, the temperature measured at O2 increased by 0.8 °C, whereas it slightly decreased by −0.1 °C during the 2 h 30 min when the dDEC was on. For test 2, the temperature at O2 changed by 0.5 °C during the 50 min of non-operation compared to a change of 0.3 °C during the 2 h 10 min operating period. Finally, for test 3, the temperature measured at O2 did not change during the 2h operating period, while it increased by 0.3 °C before the start of the dDEC. The relative humidity in this zone had a slight, gradual increase that did not reach 10%. Consequently, this RH was considered to be a fair reference to calculate the ΔTfan, as proposed in Equation (4).
The larger variations of the conditions at O2 occurred when the system was deflected away from the occupant. In this position, the thermal conditions at the target space O1 barely improved, highlighting the local effect of the dDEC. If the device was orientated and placed closer to the occupant (position C), the thermal conditions did not seem to improve, either. This result may have been affected by the fact that, in this position, the device drove the air directly toward the occupant’s hands, thus, the thermal comfort measuring equipment did not accurately register the temperature change. These findings and the ones mentioned above regarding the system placed at a certain height from the table (H) demonstrated that appropriate positioning of the dDEC was necessary, despite the expected 2 m2 of actuation area given in the technical specifications listed in Section 2.1.
5. Conclusions
Nowadays, there are two requirements to fulfil in the most efficient way regarding the thermal environment, namely, the reduction of buildings’ energy consumption and achievement of a high thermal comfort quantified by the percentage of satisfied occupants. In this context, personalized conditioning systems (PCS) are a promising technology that may realize both targets.
Today, existing research on PCS is very limited regarding evaporative cooling systems. This study evaluated the potential of a desk direct evaporative cooler to improve thermal conditions at offices of free-running buildings.
Due to the local effect of the dDEC, its position is a key factor. The best position is at a certain distance from the occupant (in this work, 65 cm is proposed) and directly on the desk surface, always orientated toward the occupant. Future research could be developed to study different distances of the system from the target zone.
The three speed levels did not have a clear impact on the air temperature and relative humidity of the target zone, but the speed level did have an effect on the perceived thermal comfort if the air supplied by the dDEC had a direct incidence on that zone. For sedentary activity (1.2 met) during summer (expected 0.5 clo), localized and acceptable thermal comfort could be achieved in non-conditioned office workspaces up to 28 °C. Although larger cooling effects are expected for free-running boundary conditions harsher than 28 °C, it is expected that this system could not achieve a comfortable range, which should be subject of future work.
An increase in the occupancy level made the system ineffective; consequently, there should be one device per occupant. Active renovation of the indoor air is also recommendable.
This work proposes an adaptation of the corrective power and cooling fan efficiency indexes, extending their applicability to evaporative systems. A CPa using the recommended operating mode can reach −2.8 °C, providing better CFEe than desk fan systems studied in the literature.
These results demonstrate that dDECs are effective in achieving thermal comfort, the impact is localized. The low electric power requirements (less than 1 to 3 W) and possible connections to computers make dDECs a versatile and efficient solution.
Author Contributions
For the development of this research, A.T.G. designed and developed the tests, A.T.G. and P.M.E. analyzed the results, and P.M.E. wrote the manuscript.
Funding
This research was funded by the Education Department of the Regional Government of Castile and Leon and the European Regional Development Fund (ERDF) through the research project: “Análisis de tecnologías energéticamente eficientes para la sostenibilidad de los edificios” (Ref.: VA272P18).
Acknowledgments
The authors want to acknowledge the collaboration of Alvaro Iglesias, Alberto Rodríguez, and Alejandro SanJosé in the development of the tests. The authors also want to thank Termigo Microclimas S.L. for their courtesy present that motivated the development of this study.
Conflicts of Interest
The authors declare no conflict of interest. The funders and the provider of the system had no role in the design of the study; in the collection, analyses, or interpretation of data; in the writing of the manuscript, or in the decision to publish the results.
References
- European Commission. Indoor Air Pollution: New EU Research Reveals Higher Risks than Previously Thought; Joint Research Centre: Ispra, Italy, 2003. [Google Scholar]
- European Commission. Energy Performance of Buildings|Energy. August 2019. Available online: https://ec.europa.eu/energy/en/topics/energy-efficiency/energy-performance-of-buildings/overview (accessed on 17 October 2019).
- Ministerio de Fomento. Gobierno de España, “Actualización 2017 de la Estrategia a largo plazo para la Rehabilitación Energética en el sector de la Edificación en España”. 2017. Available online: https://www.idae.es/tecnologias/eficiencia-energetica/edificacion (accessed on 17 October 2019).
- World Health Organization. WHO|Global Strategy on Occupational Health for All: The Way to Health at Work. Available online: https://www.who.int/occupational_health/publications/globstrategy/en/index2.html (accessed on 5 November 2019).
- Atanasiou, B.; Despret, C.; Economidou, M.; Maio, J.; Nolte, I.; Rapf, O. Europe’s Buildings Under the Microscope: A Country-By-Country Review of the Energy Performance of Buildings; Buildings Performance Institute Europe (BPIE): Bruxelles, Belgium, 2011. [Google Scholar]
- International Energy Agency’s Energy in Buildings and Communities Programme (IEA-EBC). 2019. Available online: https://www.ecbcs.org/ (accessed on 17 October 2019).
- European Union. Directive 2002/91/EC of the European Parliament and of the Council of 16 December 2002 on the Energy Performance of Buildings; European Union: Brussels, Belgium, 2002. [Google Scholar]
- European Union. Directive 2010/31/EU of the European Parliament and of the Council of 19 May 2010 on the Energy Performance of Buildings (Recast); European Union: Brussels, Belgium, 2010. [Google Scholar]
- Antoniadou, P.; Papadopoulos, A.M. Occupants’ thermal comfort: State of the art and the prospects of personalized assessment in office buildings. Energy Build. 2017, 153, 136–149. [Google Scholar] [CrossRef]
- Luo, M.; Cao, B.; Ji, W.; Ouyang, Q.; Lin, B.; Zhu, Y. The underline linkage between personal control and thermal comfort: Psychological or physical effects? Energy Build. 2016, 111, 56–63. [Google Scholar] [CrossRef]
- Brager, G.; Paliaga, G.; de Dear, R. Operable Windows, Personal Control and Occupant Comfort; UC Berkeley: Berkeley, CA, USA, 2004. [Google Scholar]
- Bauman, F.S.; Carter, T.G.; Baughman, A.V.; Arens, E. Field study of the impact of a desktop task/ambient conditioning system in office buildings. ASHRAE Trans. 1998, 104, 1153–1171. [Google Scholar]
- Schweiker, M.; Wagner, A. The effect of occupancy on perceived control, neutral temperature and behavioral patterns. Energy Build. 2016, 117, 246–259. [Google Scholar] [CrossRef]
- Luo, M.; Cao, B.; Zhou, X.; Li, M.; Zhang, J.; Ouyang, Q.; Zhu, Y. Can personal control influence human thermal comfort? A field study in residential buildings in China in winter. Energy Build. 2014, 72, 411–418. [Google Scholar] [CrossRef]
- Li, Z.; Loveday, D.; Demian, P. Feedback messaging, thermal comfort and usage of office-based personal comfort systems. Energy Build. 2019, 205, 109514. [Google Scholar] [CrossRef]
- .Mofidi, F.; Akbari, H. Integrated optimization of energy costs and occupants’ productivity in commercial buildings. Energy Build. 2016, 129, 247–260. [Google Scholar] [CrossRef]
- Mofidi, F.; Akbari, H. Personalized energy costs and productivity optimization in offices. Energy Build. 2017, 143, 173–190. [Google Scholar] [CrossRef]
- Mofidi, F.; Akbari, H. An integrated model for position-based productivity and energy costs optimization in offices. Energy Build. 2019, 183, 559–580. [Google Scholar] [CrossRef]
- Kwon, M.; Remøy, H.; van den Dobbelsteen, A.; Knaack, U. Personal control and environmental user satisfaction in office buildings: Results of case studies in the Netherlands. Build. Environ. 2019, 149, 428–435. [Google Scholar] [CrossRef]
- Wang, Z.; de Dear, R.; Luo, M.; Lin, B.; He, Y.; Ghahramani, A. Individual difference in thermal comfort: A literature review. Build. Environ. 2018, 138, 181–193. [Google Scholar] [CrossRef]
- Zhang, H.; Arens, E.; Zhai, Y. A review of the corrective power of personal comfort systems in non-neutral ambient environments. Build. Environ. 2015, 91, 15–41. [Google Scholar] [CrossRef]
- Hoyt, T.; Arens, E.; Zhang, H. Extending air temperature setpoints: Simulated energy savings and design considerations for new and retrofit buildings. Build. Environ. 2015, 88, 89–96. [Google Scholar] [CrossRef]
- Liu, J.; Zhu, S.; Kim, M.K.; Srebic, J. A Review of CFD Analysis Methods for Personalized Ventilation (PV) in Indoor Built Environments. Sustainability 2019, 11, 4166. [Google Scholar] [CrossRef]
- Ghaddar, N.; Ghali, K.; Chakroun, W. Evaporative cooler improves transient thermal comfort in chilled ceiling displacement ventilation conditioned space. Energy Build. 2013, 61, 51–60. [Google Scholar] [CrossRef]
- Veselý, M.; Zeiler, W. Personalized conditioning and its impact on thermal comfort and energy performance—A review. Renew. Sustain. Energy Rev. 2014, 34, 401–408. [Google Scholar] [CrossRef]
- Warthmann, A.; Wölki, D.; Metzmacher, H.; Van Treeck, C. Personal Climatization Systems—A Review on Existing and Upcoming Concepts. Appl. Sci. 2019, 9, 35. [Google Scholar] [CrossRef]
- Parkinson, T.; de Dear, R. Thermal pleasure in built environments: Spatial alliesthesia from air movement. Build. Res. Inf. 2017, 45, 320–335. [Google Scholar] [CrossRef]
- Nicol, F.; Humphreys, M. Derivation of the adaptive equations for thermal comfort in free-running buildings in European standard EN 15251. Build. Environ. 2010, 45, 11–17. [Google Scholar] [CrossRef]
- Zhai, Y.; Zhang, H.; Zhang, Y.; Pasut, W.; Arens, E.; Meng, Q. Comfort under personally controlled air movement in warm and humid environments. Build. Environ. 2013, 65, 109–117. [Google Scholar] [CrossRef]
- Schiavon, S.; Melikov, A.K. Introduction of a Cooling-Fan Efficiency Index. HVAC R Res. 2009, 15, 1121–1144. [Google Scholar] [CrossRef]
- Dai, Y.; Sumathy, K. Theoretical study on a cross-flow direct evaporative cooler using honeycomb paper as packing material. Appl. Therm. Eng. 2002, 22, 1417–1430. [Google Scholar] [CrossRef]
- Chakroun, W.; Ghaddar, N.; Ghali, K. Chilled ceiling and displacement ventilation aided with personalized evaporative cooler. Energy Build. 2011, 43, 3250–3257. [Google Scholar] [CrossRef]
- Yang, Y.; Cui, G.; Lan, C.Q. Developments in evaporative cooling and enhanced evaporative cooling—A review. Renew. Sustain. Energy Rev. 2019, 113, 109230. [Google Scholar] [CrossRef]
- International Organization for Standardization (ISO). ISO 7730:2005 Ergonomics of the Thermal Environment. Analytical Determination and Interpretation of Thermal Comfort Using Calculation of the PMV and PPD Indices and Local Thermal Comfort Criteria; International Organization for Standardization (ISO): Geneva, Switzerland, 2005. [Google Scholar]
- Ministerio de Industria, Energía y Turismo. Gobierno de España. Reglamento de Instalaciones Térmicas de los Edificios. Versión consolidada; Gobierno de España: Madrid, Spain, 2013.
- Lazzarin, R.; Nalini, L. Air Humidification. Technical, Health and Energy Aspects; Carel: London, UK, 2004. [Google Scholar]
Figure 1.
View of the target desk direct evaporative cooler.

Figure 2.
(a) Layout of the climate chamber furnished as an office space placed inside the laboratory and location of the measuring points; (b) overview of the climate chamber; (c) relative size and height of the sensors at the O1 measuring point and the desk direct evaporative cooler (dDEC) studied.

Figure 3.
Relative position of the dDEC to the occupant.

Figure 4.
Evolution during test 1 of (a) dry bulb temperatures, (b) predicted mean vote, (c) relative humidity, and (d) air velocity and draught rate.
Figure 4.
Evolution during test 1 of (a) dry bulb temperatures, (b) predicted mean vote, (c) relative humidity, and (d) air velocity and draught rate.

Figure 5.
Evolution during test 2 of (a) dry bulb temperatures, (b) predicted mean vote, (c) relative humidity, and (d) air velocity and draught rate.
Figure 5.
Evolution during test 2 of (a) dry bulb temperatures, (b) predicted mean vote, (c) relative humidity, and (d) air velocity and draught rate.


Figure 6.
Evolution during test 3 of (a) dry bulb temperatures, (b) predicted mean vote, (c) relative humidity, and (d) air velocity and draught rate.
Figure 6.
Evolution during test 3 of (a) dry bulb temperatures, (b) predicted mean vote, (c) relative humidity, and (d) air velocity and draught rate.


Table 1.
Measuring equipment.
| Sensor | Parameter Measured | Range | Accuracy |
|---|---|---|---|
| Temperature and relative humidity sensor Testo 175 | Dry bulb temperature (°C) | −20/+55 | ±0.4 °C |
| Relative Humidity, RH (%) | 0/100% | ±2% RH (from 2 to 98% RH at +25 °C) | |
| Vivo comfort Dantec Dynamics | Air velocity, v (m/s) | 0.05/1.0 | <1 m/s: ±0.01 m/s, ±0.025∙v |
| >1 m/s: ±0.1∙v | |||
| Operative temperature (°C) | 0/45 | 0 –10 °C: ±0.5 K | |
| 10 –40 °C: ±0.2 K | |||
| 40 –45 °C: ±0.5 K | |||
| Air flow meter TSI model: 8715 DP-Calc | Air volume flow, V (m3/h) | 42/4250 | ±3% of the measured value for V > 85 m3/h |
| ±12 m3/h for V ≤ 85 m3/h | |||
| Hot wire anemometer Testo 0635 1535 | Air velocity (m/s) | 0−20 | ±0.03 m/s + 4% of the measured value |
| Multimeter FLUKE 75 III | Voltage (DC) (V) | 3.2; 32; 320 | ±0.3% + 1 |
| Current (DC) (mA) | 32; 320 | ±1.5% + 2 |
Table 2.
Influencing parameters and conditions studied.
| Parameter | Conditions Studied |
|---|---|
| Air renovation indoors | (N) Without air renovation |
| (V) With air renovation (airflow for 2 people for a category 2 of indoor air quality [35]) | |
| Speed level | (V1) Lowest speed |
| (V2) Medium speed | |
| (V3) Highest speed | |
| Relative position to the occupant | (O) Oriented toward the occupant, 65 cm away, at the surface of the desk |
| (H) Oriented toward the occupant, 65 cm away, elevated 25 cm from the surface | |
| I Oriented toward the occupant, 20 cm away | |
| (D) Deflected away from the occupant, 65 cm away |
Table 3.
Operating conditions implemented during the tests.
| Test | Air Renovation | Speed Levels Tested | Positions Tested | Ambient Base Conditions | |
|---|---|---|---|---|---|
| Air dry Bulb Temperature (°C) | Relative Humidity (%) | ||||
| 1 | N | V1, V2, V3 | O | 27 | 40 |
| 2 | V | V1, V2, V3 | O | 27 | 40 |
| 3 | N | V1, V3 | H, C, D | 25 | 40 |
Table 4.
Results for the dDEC saturation efficiency, air flow, and electric power at each air speed.
Table 4.
Results for the dDEC saturation efficiency, air flow, and electric power at each air speed.
| Parameter | V1 | V2 | V3 |
|---|---|---|---|
| ε (%) | 29.8 | 17.3 | 16.2 |
| Air velocity, v (m/s) | 0.5 | 0.6 | 0.7 |
| Air volume flow, V (m3/h) | 54 | 71 | 84 |
| Electric power (W) | 0.9 | 1.9 | 2.6 |
Table 5.
Temperature and relative humidity measured in the outdoor environment and in the ventilated air.
Table 5.
Temperature and relative humidity measured in the outdoor environment and in the ventilated air.
| Test | E1 | E2 | O3 | ||||
|---|---|---|---|---|---|---|---|
| HR (%) | T (°C) | HR (%) | T (°C) | HR (%) | T (°C) | ||
| 1 | Average | 43 | 26.9 | 43 | 26.9 | - | - |
| Standard deviation | 0.83 | 0.08 | 1.15 | 0.05 | - | - | |
| 2 | Average | 38 | 27.3 | 36 | 28.3 | 37 | 28.1 |
| Standard deviation | 1.29 | 0.25 | 1.11 | 0.24 | 0.95 | 0.19 | |
| 3 | Average | 37 | 24.3 | 35 | 24.8 | - | - |
| Standard deviation | 2.01 | 0.10 | 1.01 | 0.21 | - | - | |
Table 6.
Adapted corrective power and cooling fan efficiency for the obtained evaporative indexes.
| Test | Air Renovation | Position | Air Speed | ΔTev (°C) | ΔTfan (°C) | CPa (°C) | CFEe (°C/W) |
|---|---|---|---|---|---|---|---|
| 1 | N | O | V1 | −2.1 | −0.1 | −2.2 | 2.4 |
| V2 | −2.0 | 0.0 | −2 | 1.0 | |||
| V3 | −2.4 | 0.1 | −2.3 | 0.9 | |||
| 2 | V | O | V1 | −2.8 | 0.2 | −2.6 | 2.8 |
| V2 | −3.0 | 0.2 | −2.8 | 1.4 | |||
| V3 | −3.2 | 0.6 | −2.6 | 1.0 | |||
| 3 | N | H | V1 | −2.0 | −2.7 | −4.7 | 5.0 |
| V3 | −2.1 | −4.0 | −6.1 | 2.4 | |||
| C | V1 | −0.3 | −0.8 | −1.1 | 1.2 | ||
| V3 | −0.6 | −0.3 | −0.9 | 0.3 | |||
| D | V1 | −0.1 | −1.0 | −1.1 | 1.2 | ||
| V3 | 0.1 | −1.1 | −1 | 0.4 |
© 2019 by the authors. Licensee MDPI, Basel, Switzerland. This article is an open access article distributed under the terms and conditions of the Creative Commons Attribution (CC BY) license (http://creativecommons.org/licenses/by/4.0/).
Share and Cite
MDPI and ACS Style
Tejero-González, A.; Esquivias, P.M. Personalized Evaporative Cooler to Reduce Energy Consumption and Improve Thermal Comfort in Free-Running Spaces. Sustainability 2019, 11, 6451. https://0-doi-org.brum.beds.ac.uk/10.3390/su11226451
AMA Style
Tejero-González A, Esquivias PM. Personalized Evaporative Cooler to Reduce Energy Consumption and Improve Thermal Comfort in Free-Running Spaces. Sustainability. 2019; 11(22):6451. https://0-doi-org.brum.beds.ac.uk/10.3390/su11226451
Chicago/Turabian StyleTejero-González, Ana, and Paula M. Esquivias. 2019. "Personalized Evaporative Cooler to Reduce Energy Consumption and Improve Thermal Comfort in Free-Running Spaces" Sustainability 11, no. 22: 6451. https://0-doi-org.brum.beds.ac.uk/10.3390/su11226451
Note that from the first issue of 2016, this journal uses article numbers instead of page numbers. See further details here.