Economy-Wide Effects of Climate Change in Benin: An Applied General Equilibrium Analysis

Abstract
:1. Introduction
2. Reviews of CGE Models and Economy-Wide Effects of Climate Change
3. Methods
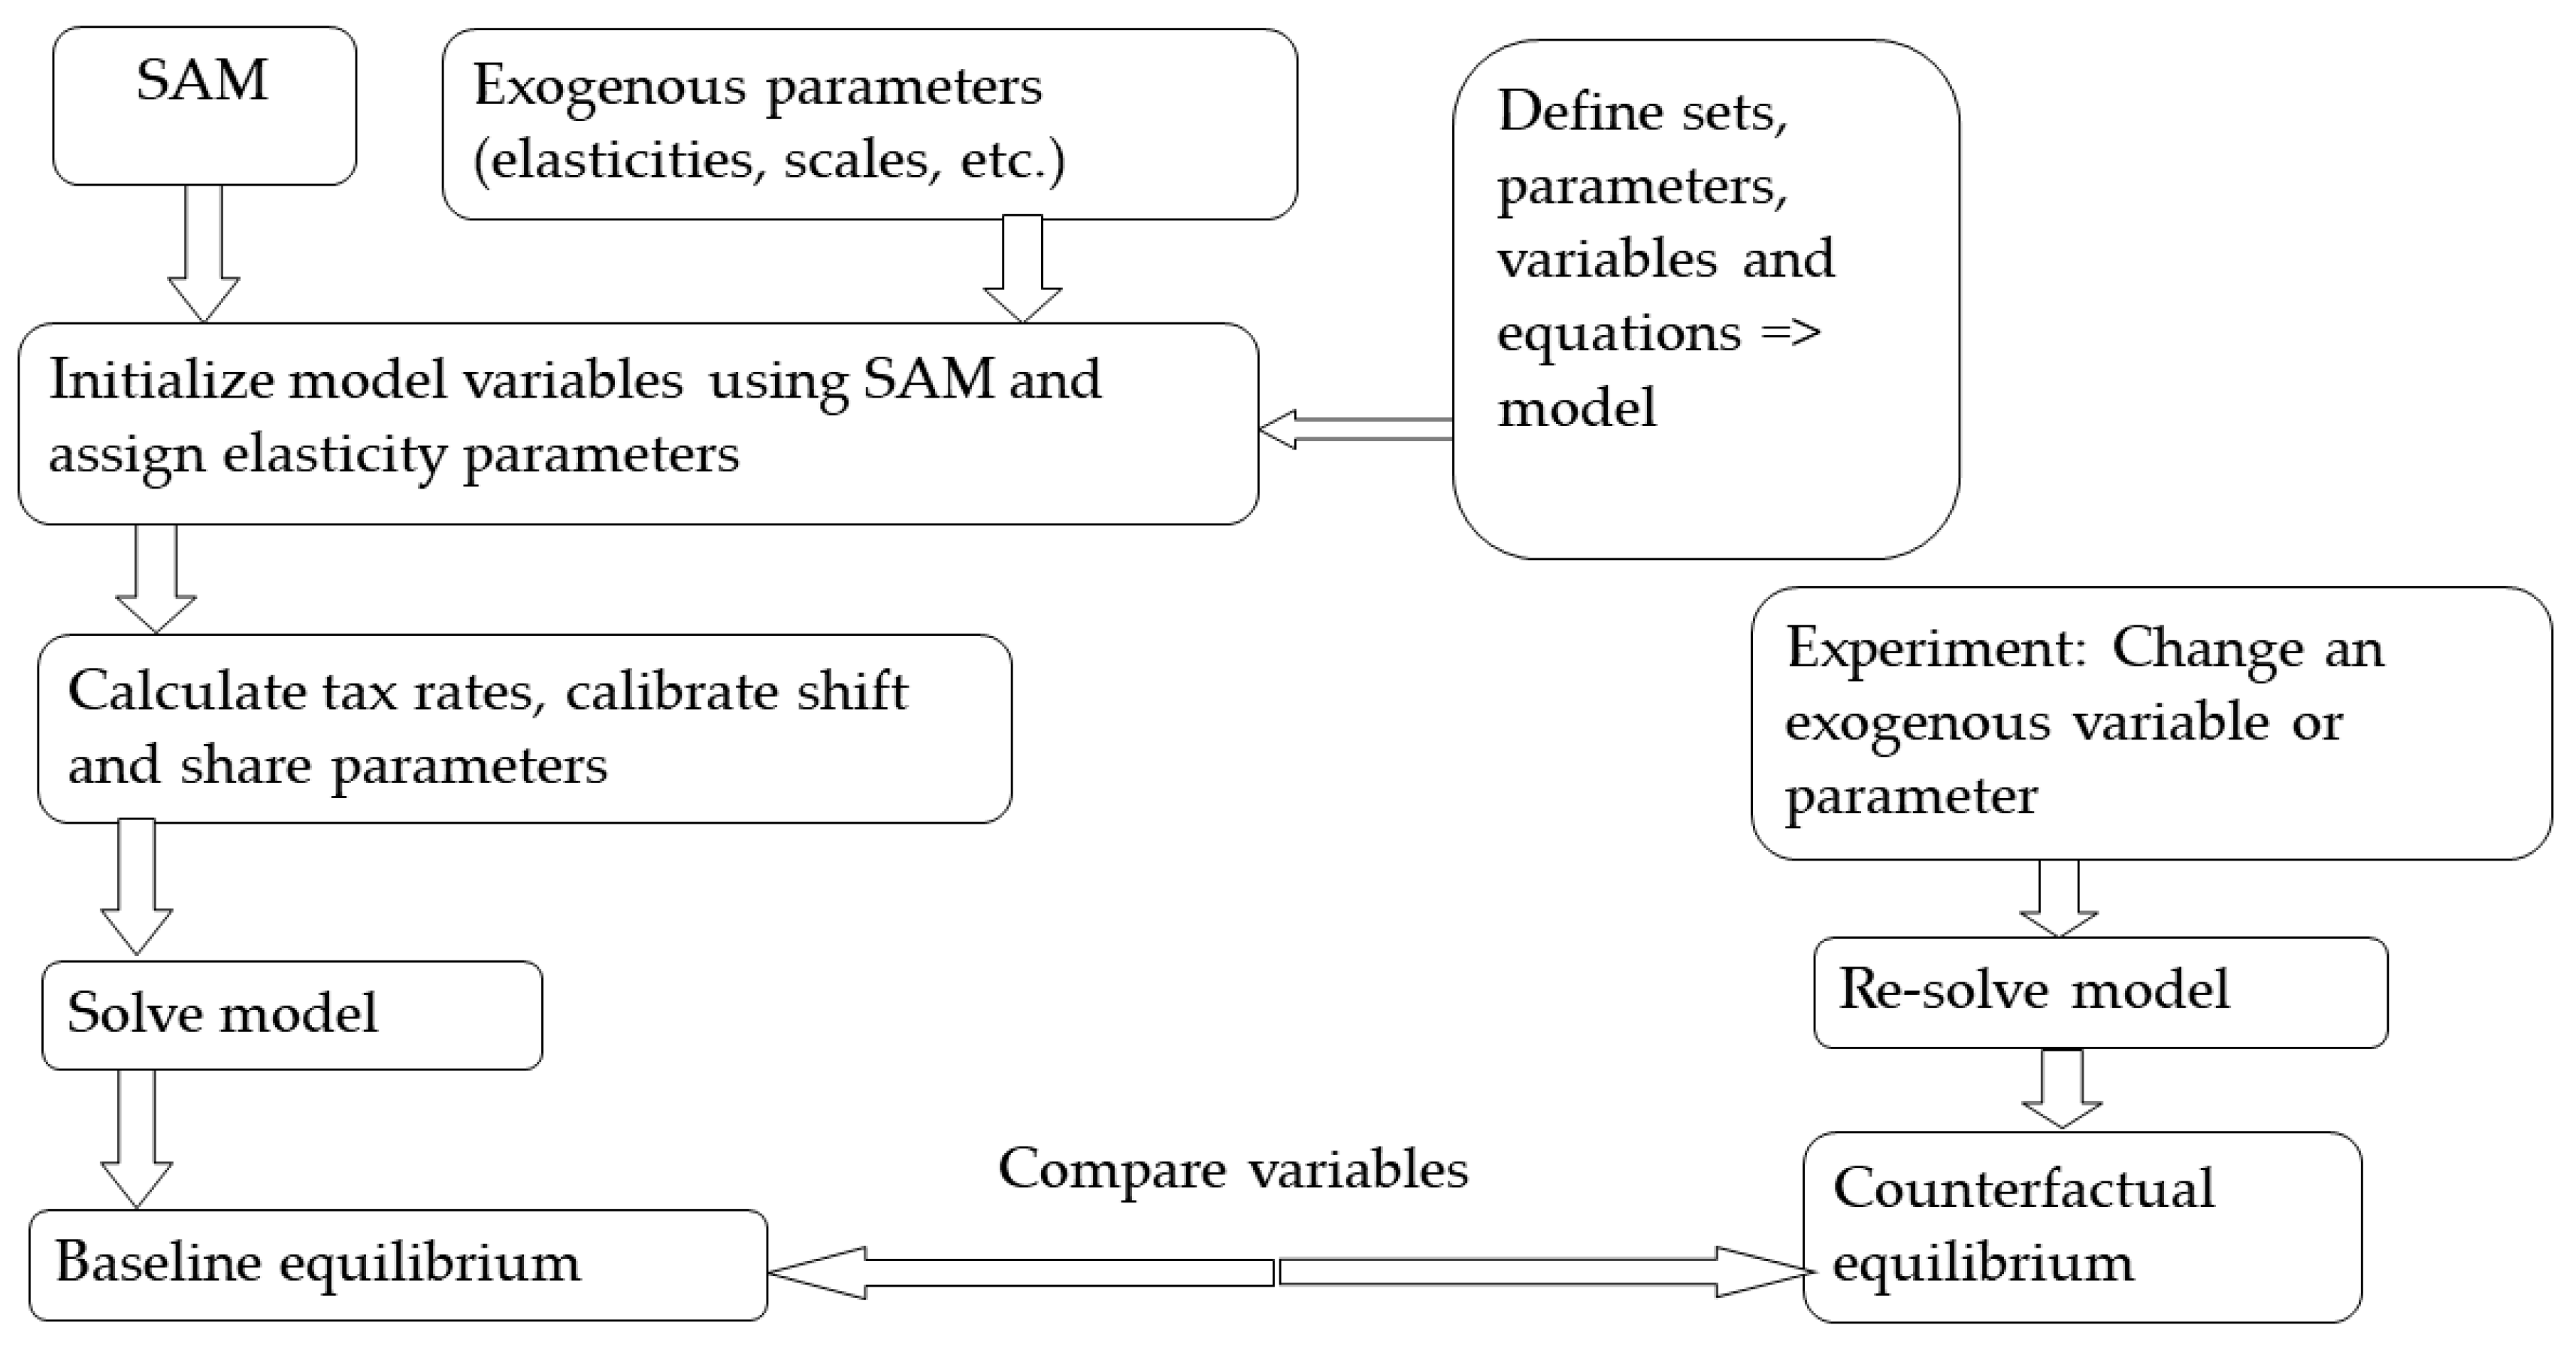
3.1. The CGE Model
3.2. Household Welfare Analysis
3.3. Scenario Considerations
3.4. Data Sources for the CGE Model
4. Results
4.1. Changes in Sectoral Output Related to Climate Change
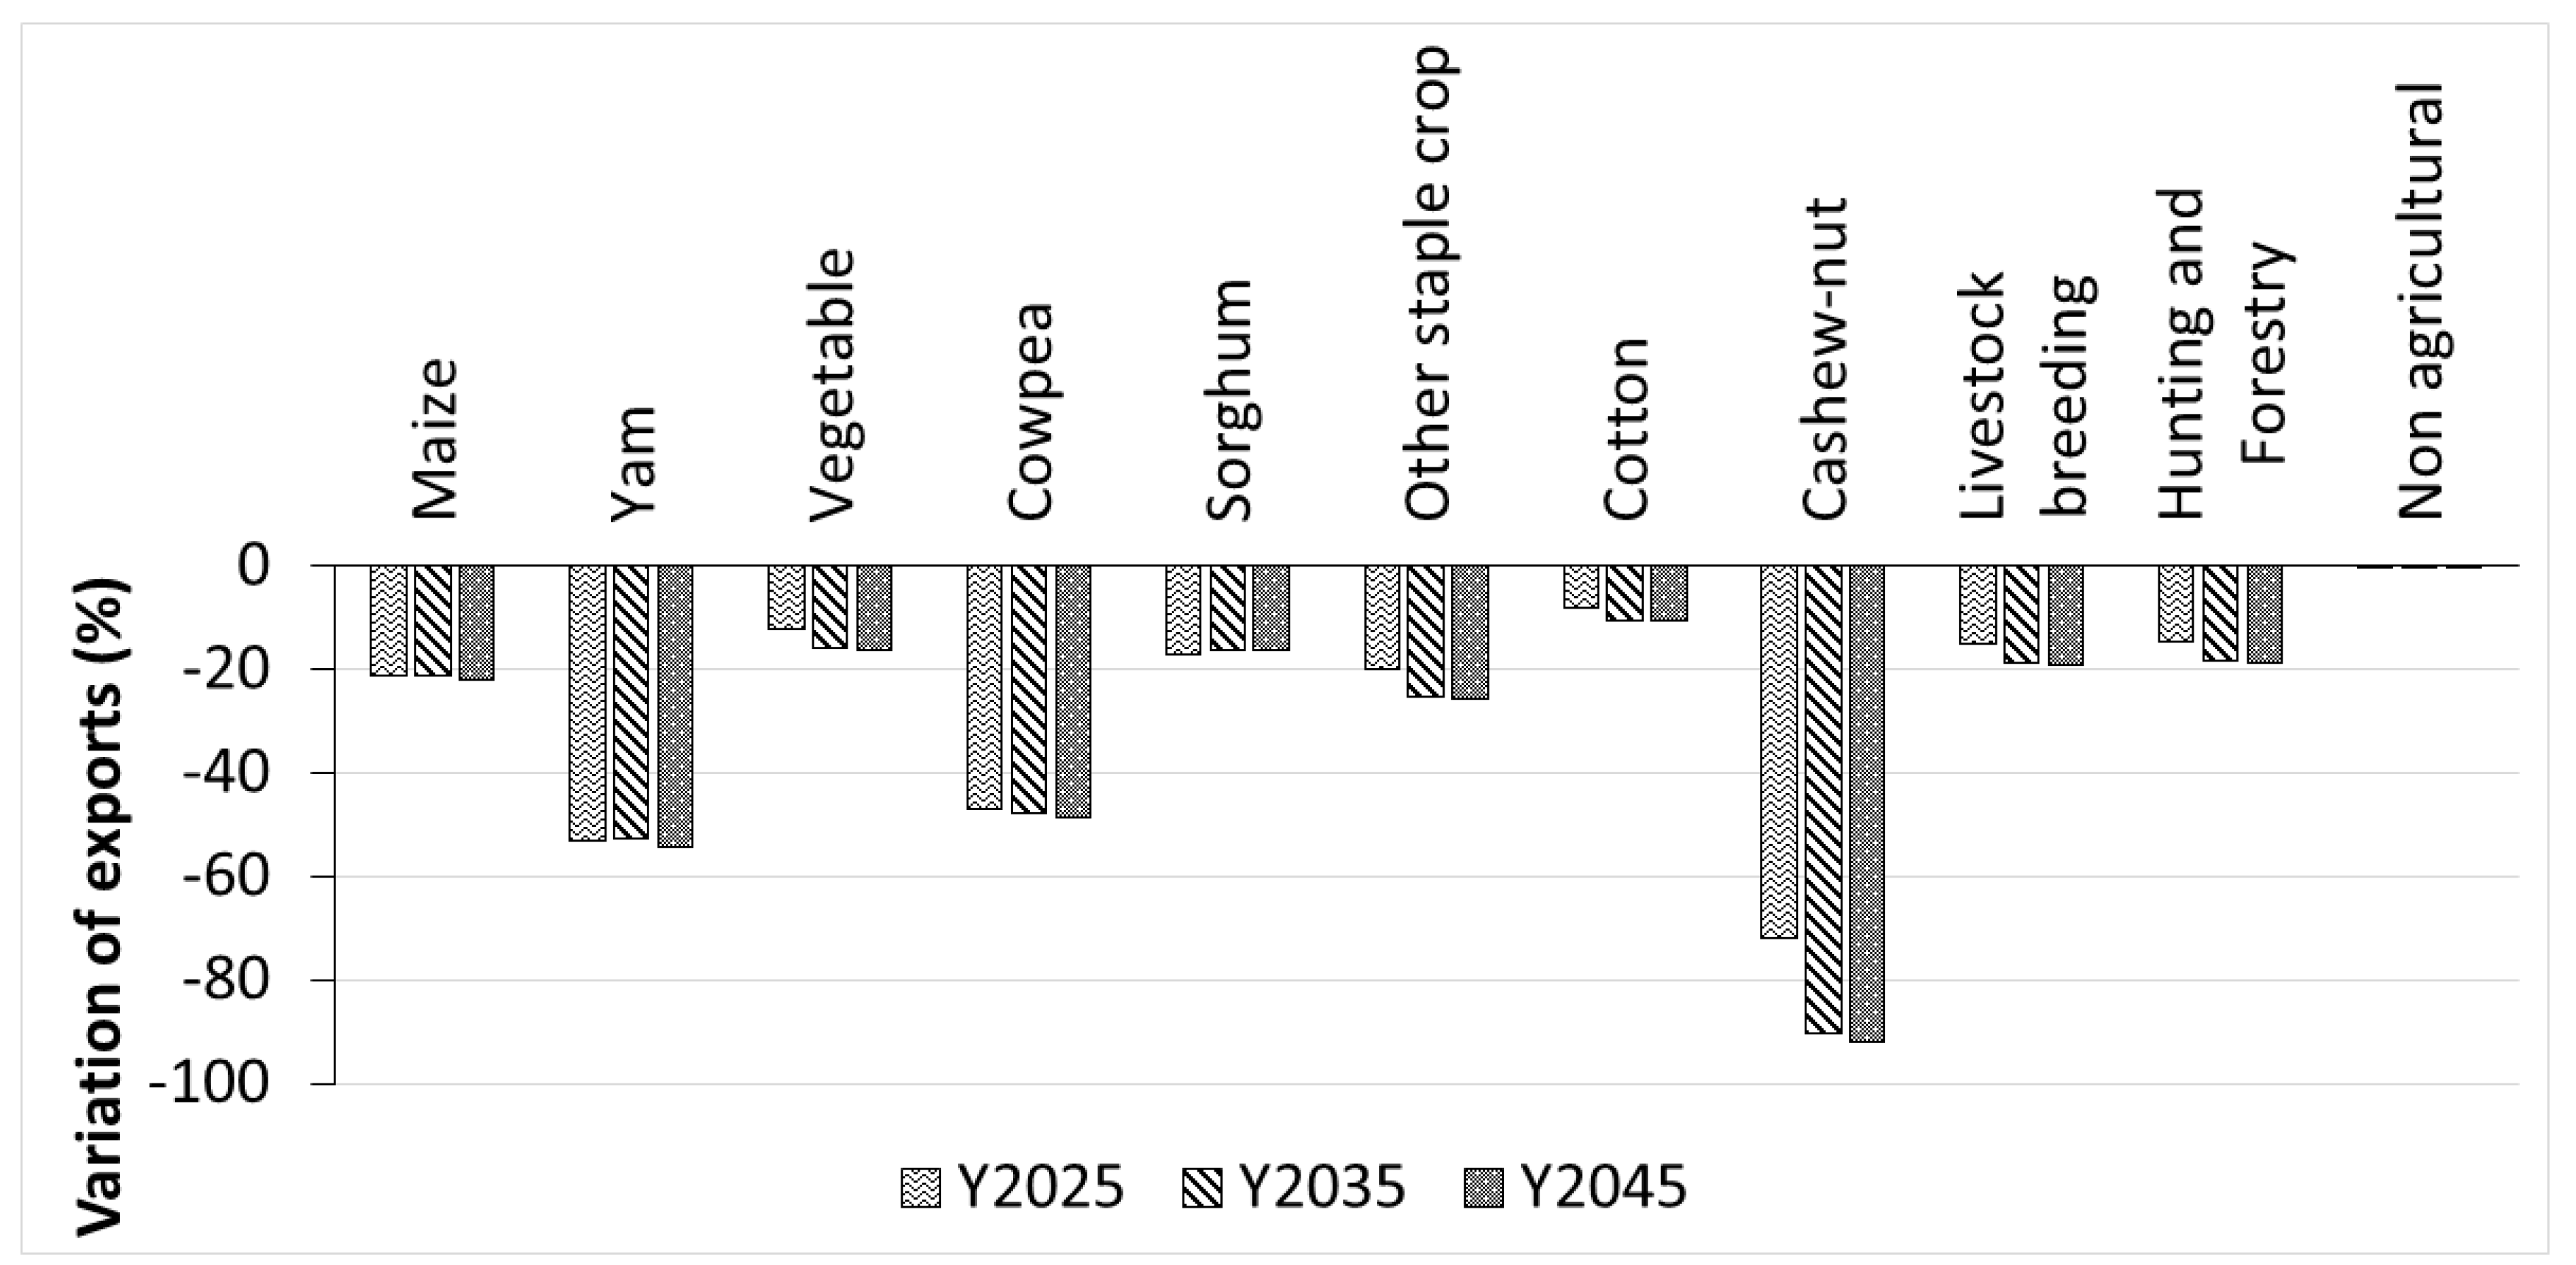
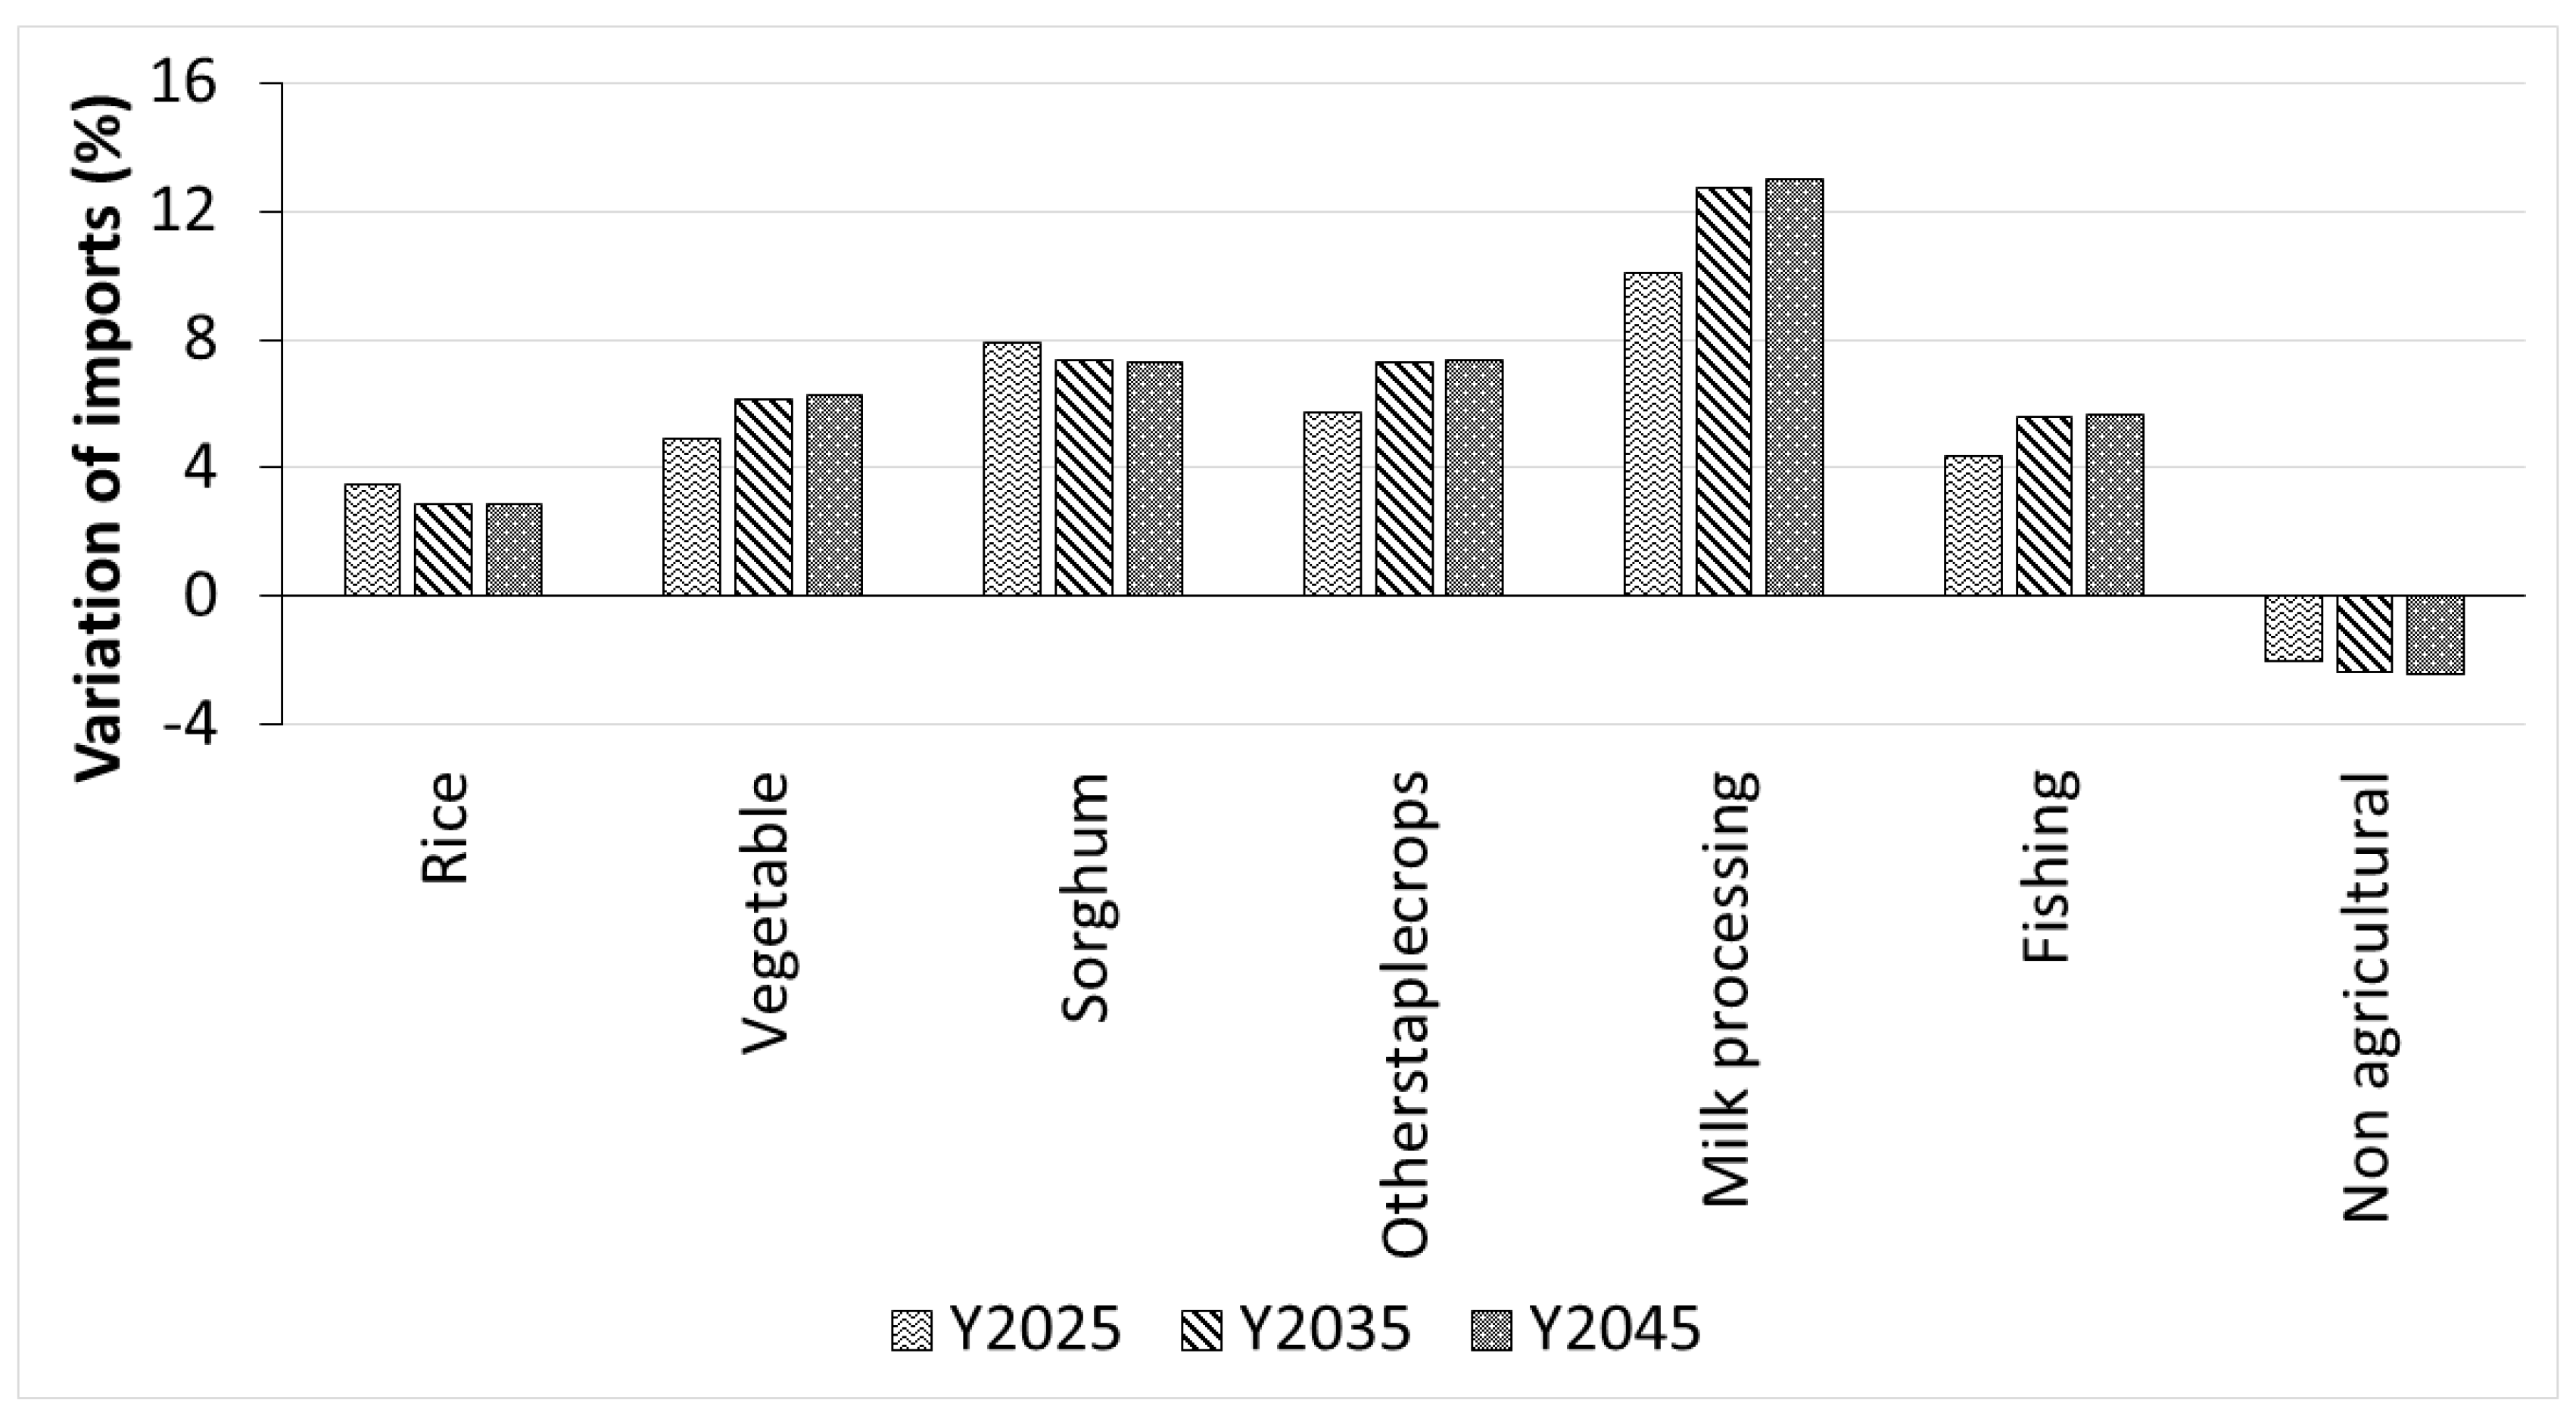
4.2. Changes in Sectoral Exports and Imports under Climate Change Scenarios
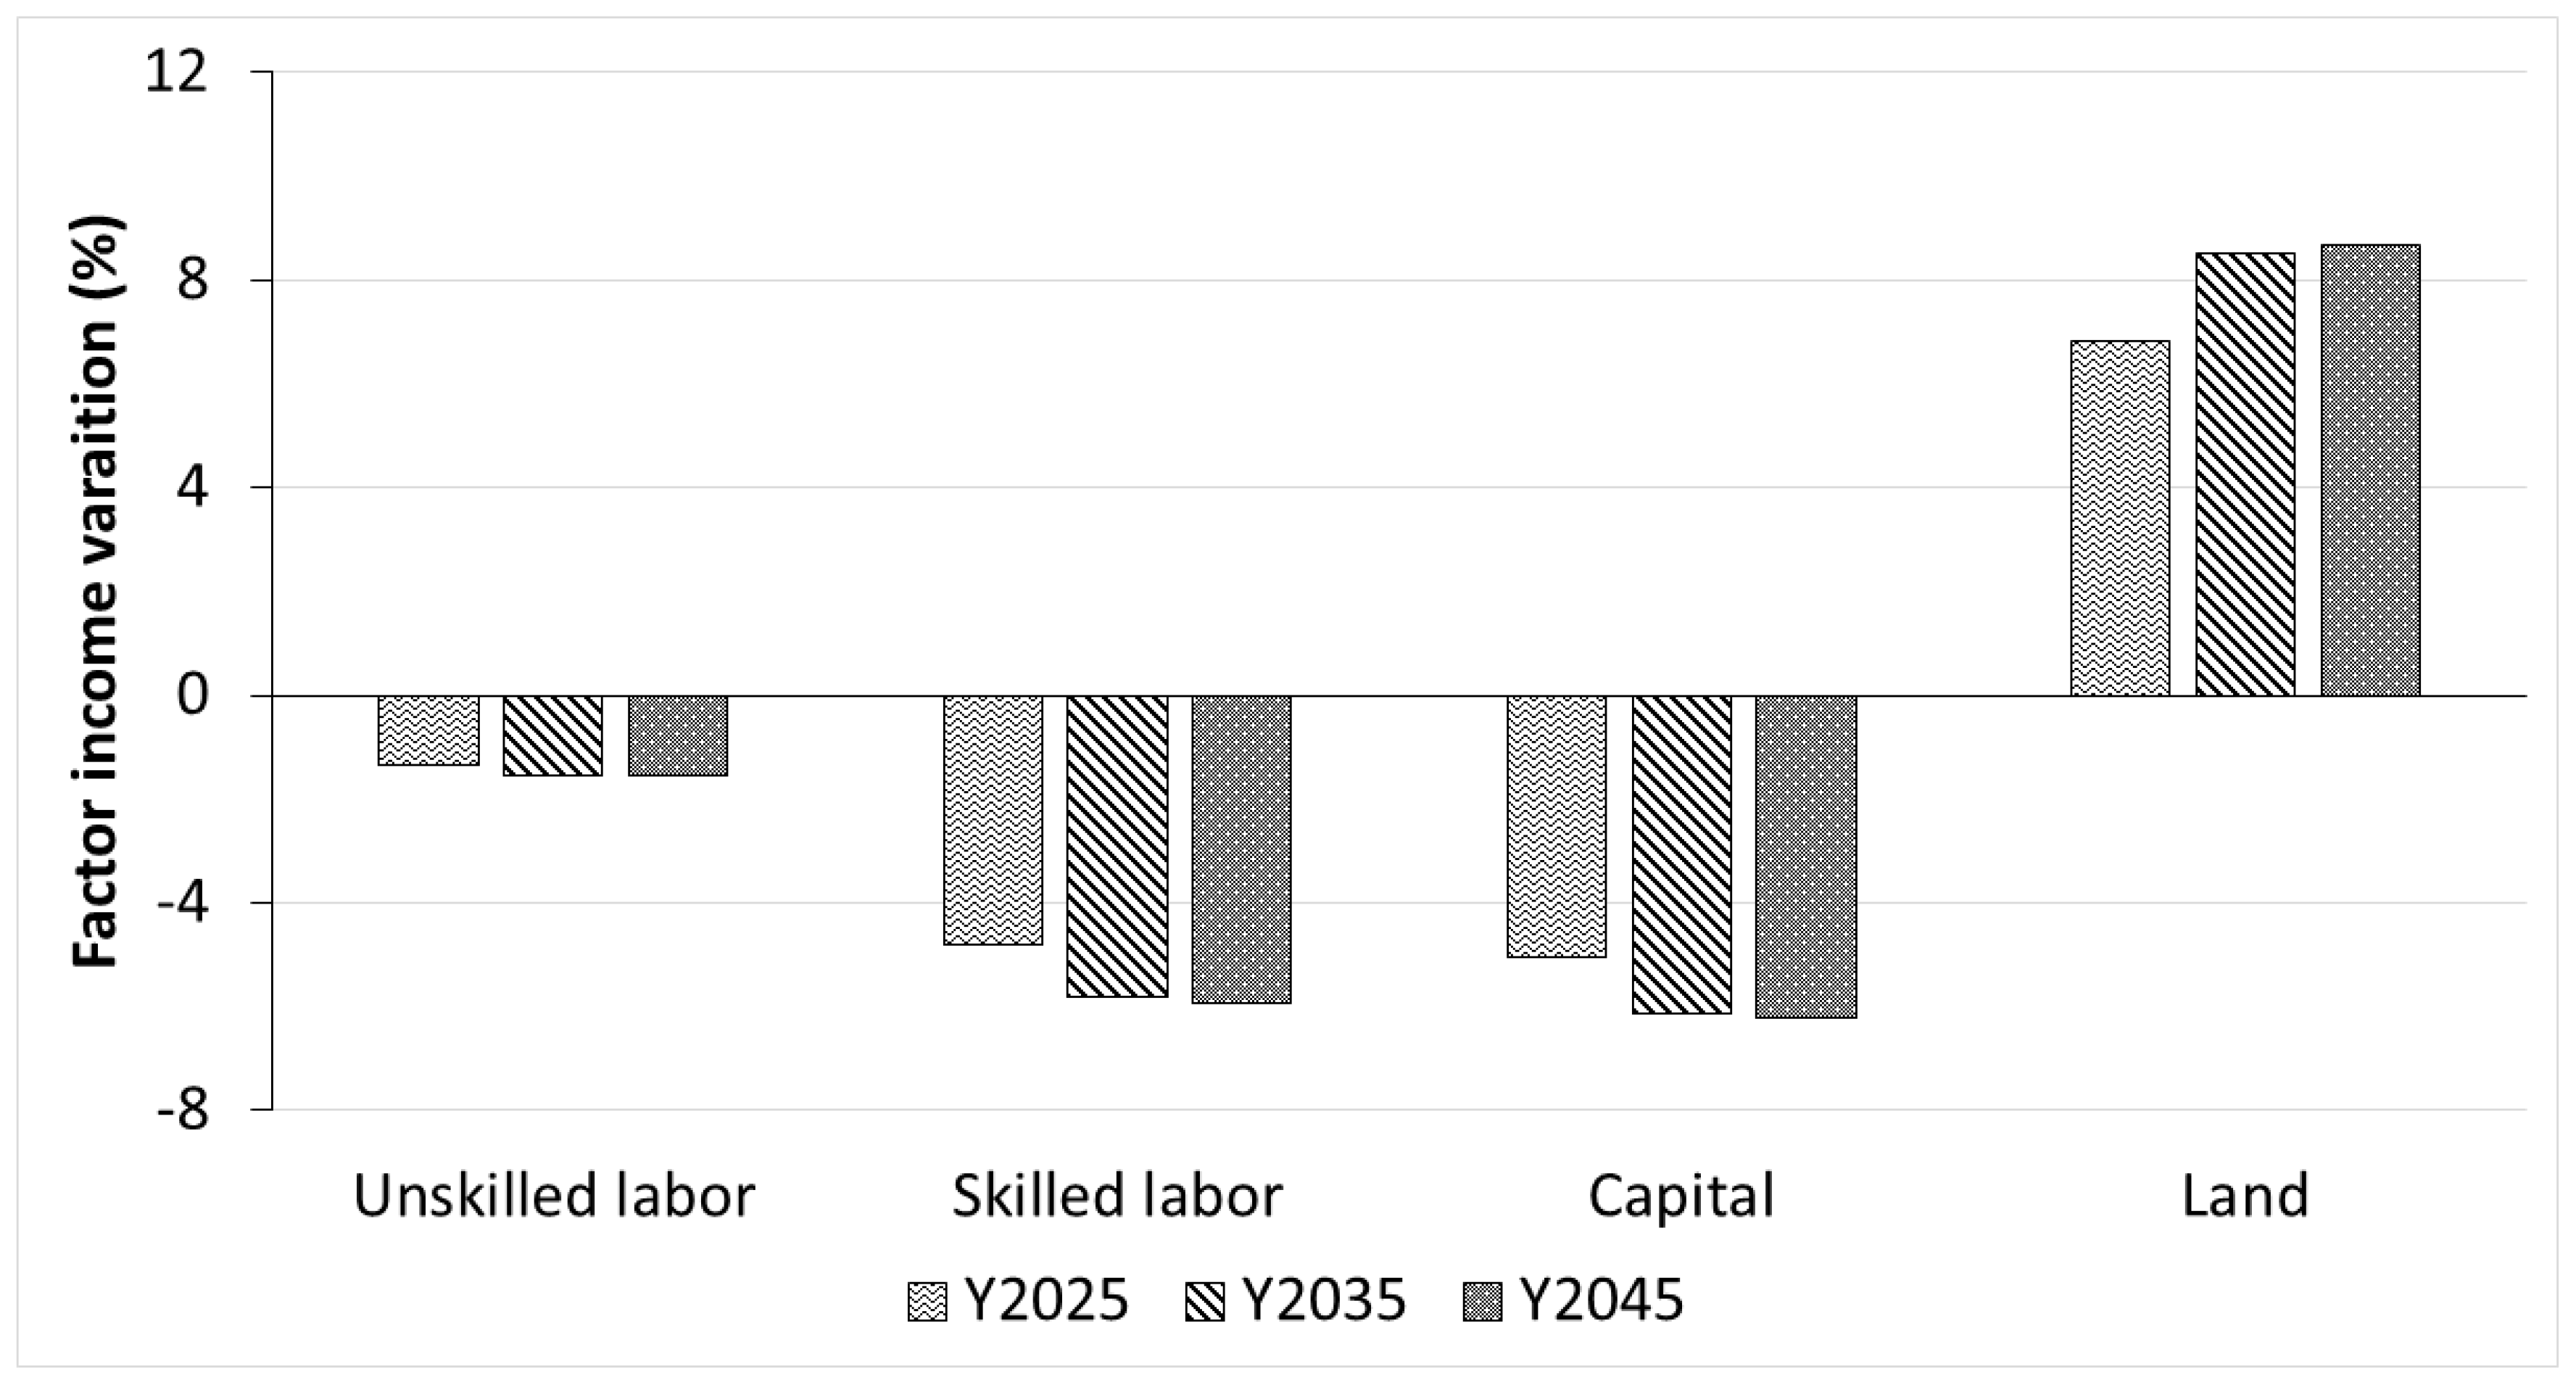
4.3. Changes in Factor Prices under Climate Change Scenarios
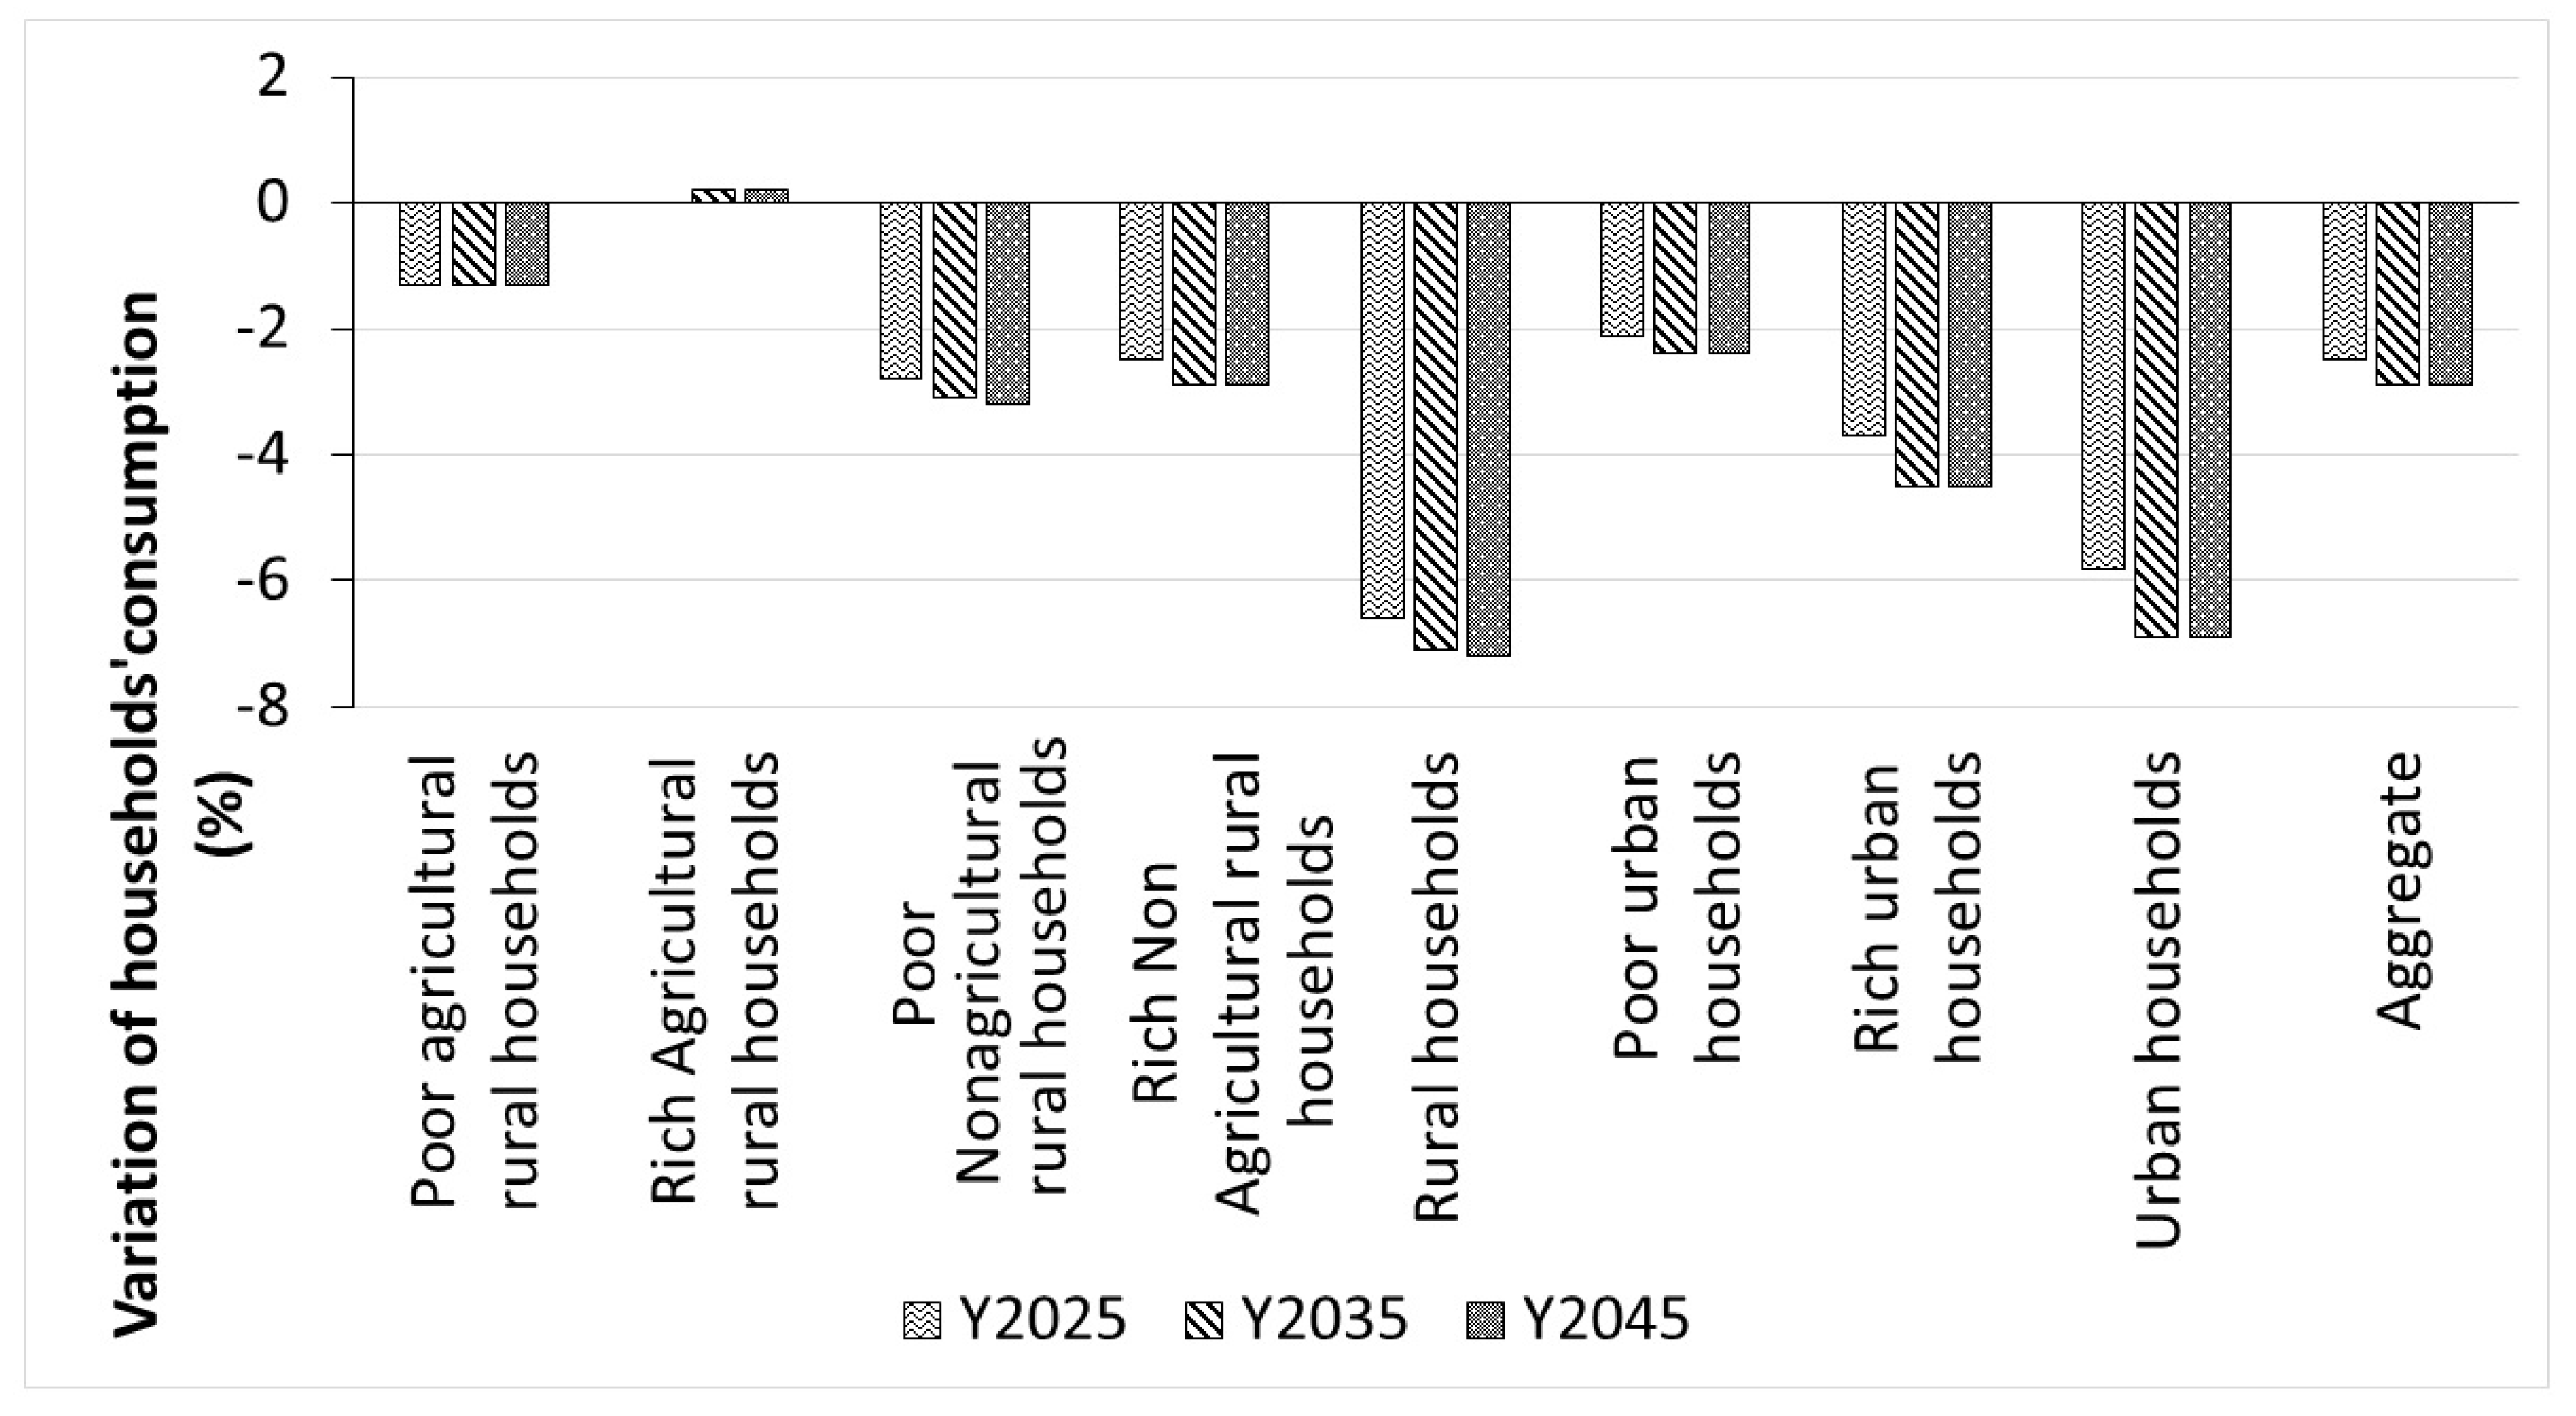
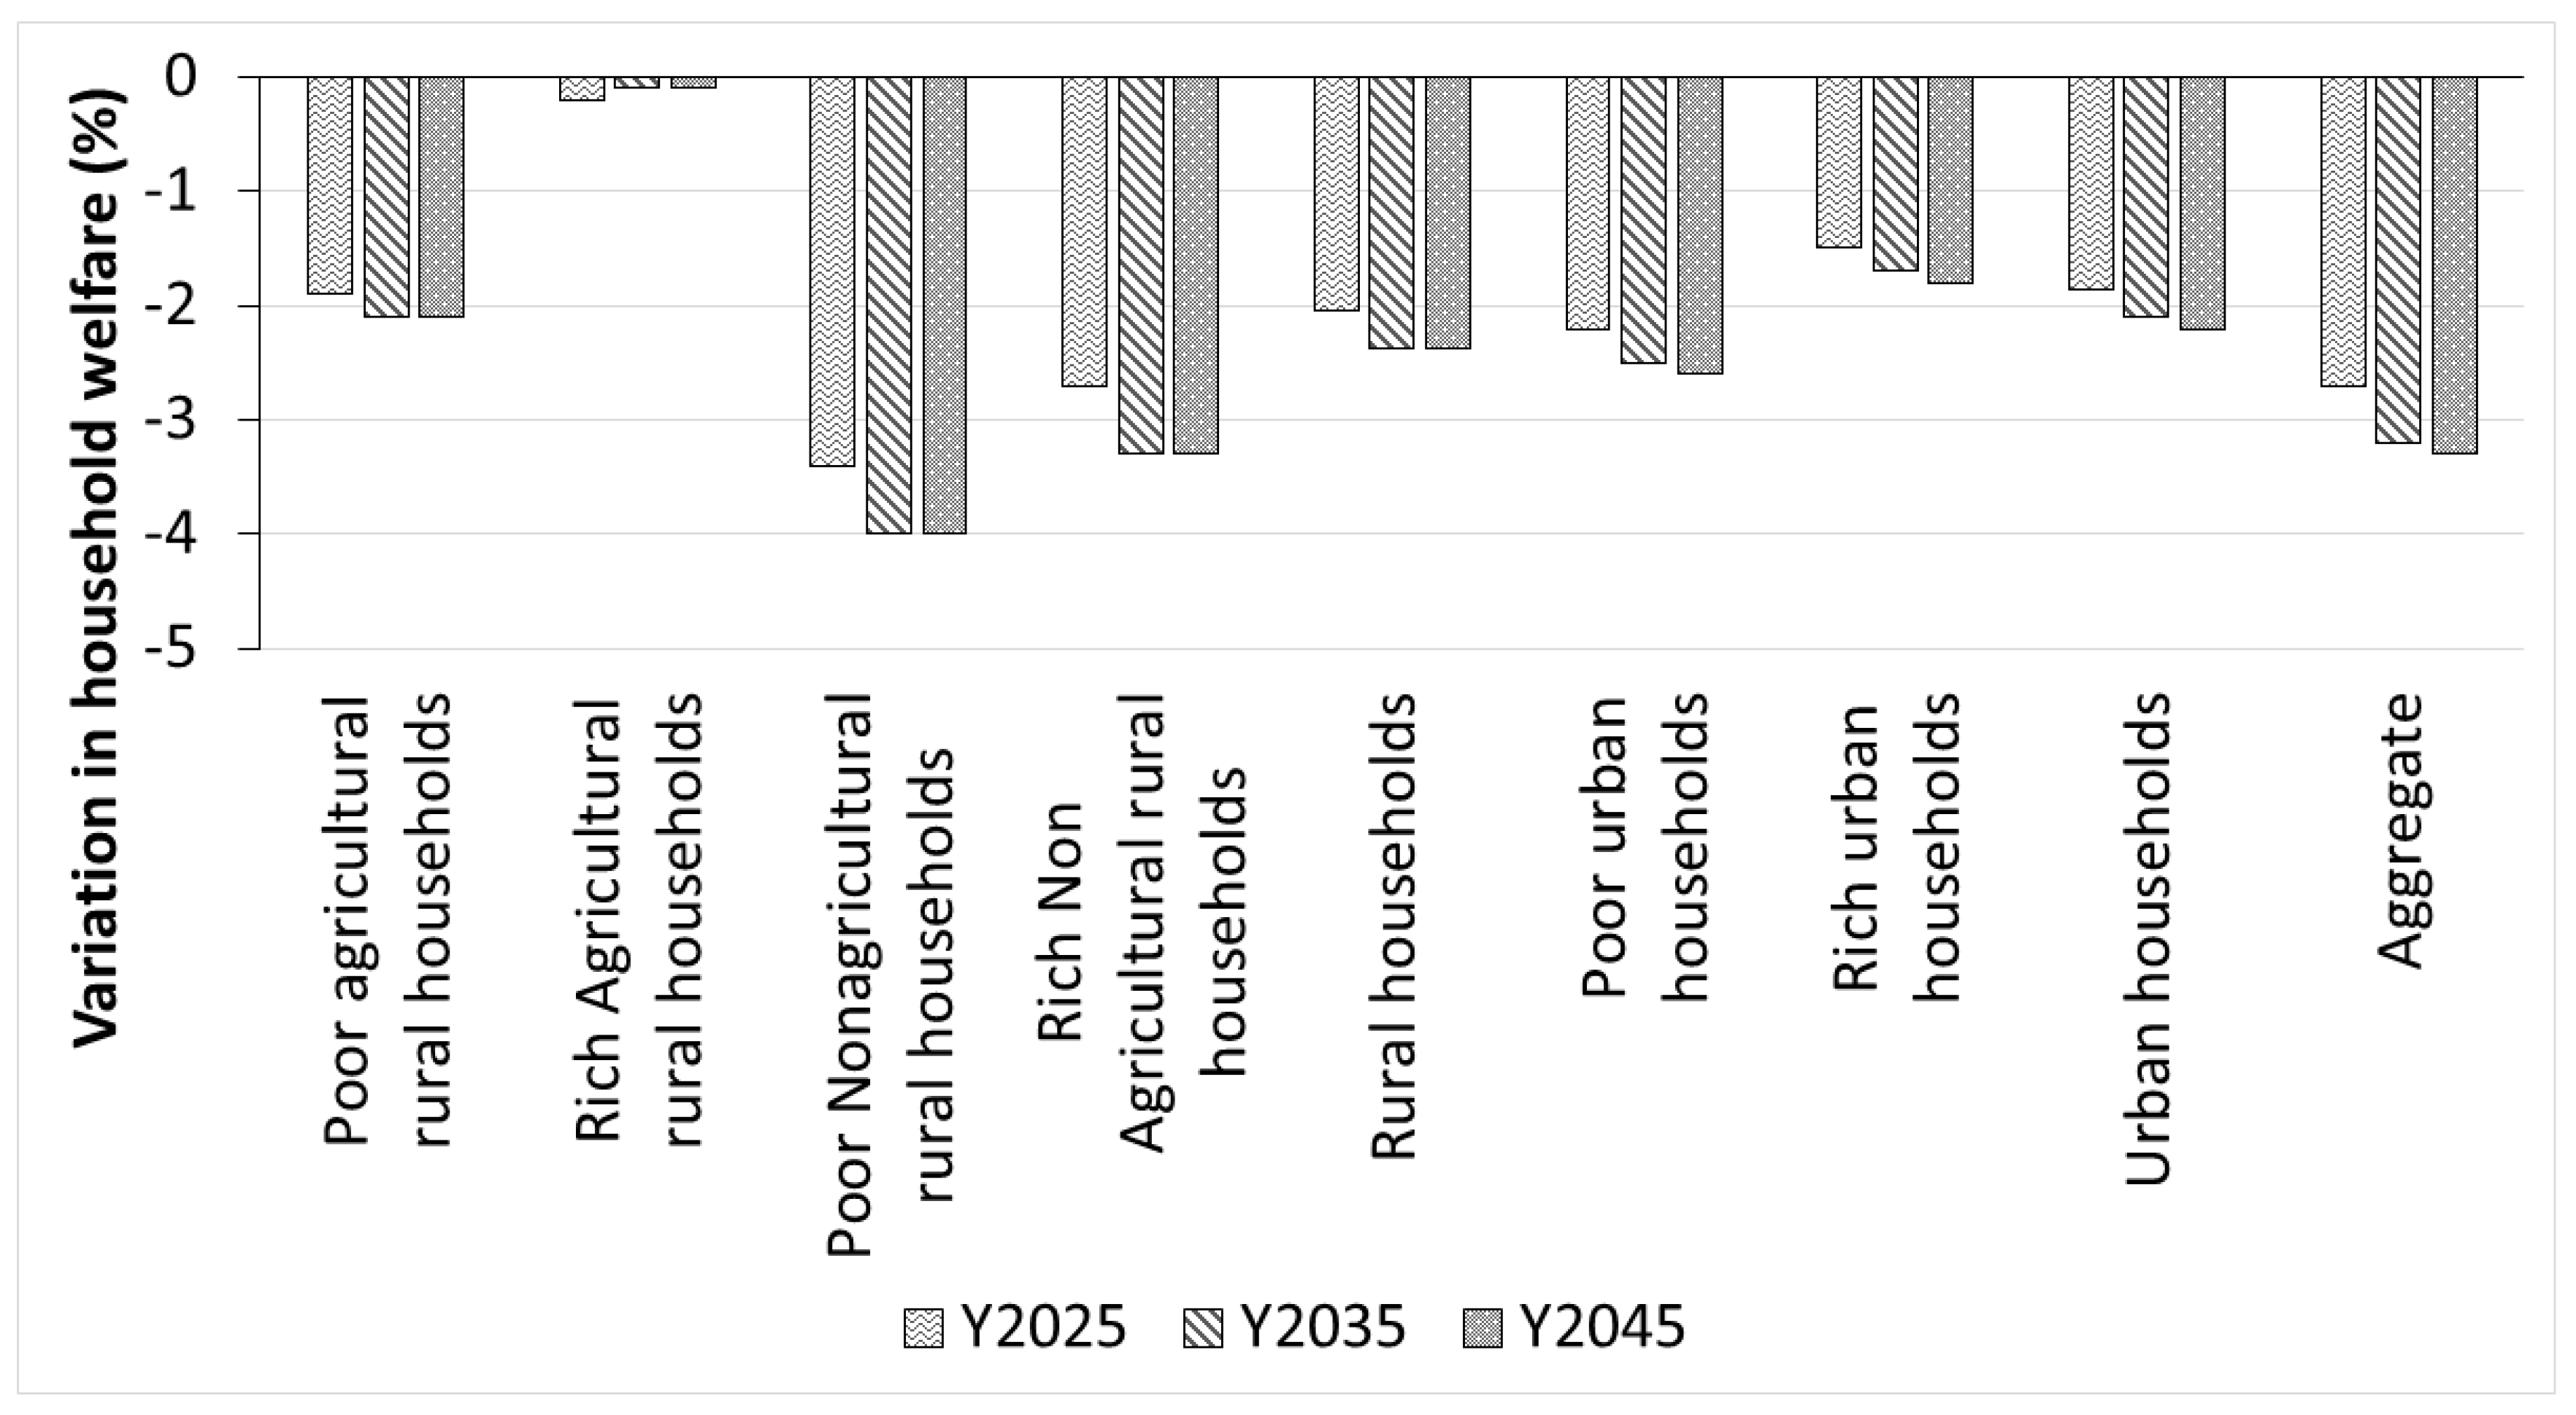
4.4. Changes in Households Consumption, Income and Welfare
5. Discussion
5.1. Economic Sectoral Effects of Climate Change
5.2. Economic Distributional Effects of Climate Change on Households’ Wealth Level and According to the Living Areas
5.3. Implications for the Dynamic Computable General Equilibrium Model and the Economic Theory
6. Conclusions
Author Contributions
Funding
Acknowledgments
Conflicts of Interest
Appendix A

| 2025 | 2035 | 2045 | |
|---|---|---|---|
| Maize | −4.4 | −10.0 | −13.9 |
| Rice | −9.6 | −20.9 | −28.2 |
| Cassava | −7.4 | −16.3 | −22.3 |
| Cowpea | −7.6 | −16.8 | −22.9 |
| Sorghum | −3.9 | −9.0 | −12.5 |
| Yam | −1.8 | −4.3 | 6.0 |
References
- IPCC. Climate Change 2013: The Physical Science Basis. In Contribution of Working Group I to the Fifth Assessment Report of the Intergovernmental Panel on Climate Change; Stocker, T.F., Qin, D., Plattner, G.-K., Tignor, M., Allen, S.K., Boschung, J., Nauels, A., Xia, Y., Bex, V., Midgley, P.M., Eds.; Cambridge University Press: Cambridge, UK; New York, NY, USA, 2013; p. 1535. [Google Scholar]
- IPCC. Climate Change 2014: Impacts, Adaptation, and Vulnerability. In Part A: Global and SectoralAspects, Contribution of Working Group II to the Fifth Assessment Report of the IntergovernmentalPanel on Climate Change; Field, C.B., Barros, V.R., Dokken, D.J., Mach, K.J., Mastrandrea, M.D., Bilir, T.E., Chatterjee, M., Ebi, K.L., Estrada, Y.O., Genova, R.C., et al., Eds.; Cambridge University Press: Cambridge, UK; New York, NY, USA, 2014; p. 1132. [Google Scholar]
- OECD. The Economic Consequences of Climate Change; OECD Publishing: Paris, France, 2015. [Google Scholar] [CrossRef]
- Nelson, C.G.; Valin, H.; Sands, D.R.; Havlík, P.; Ahammad, H.; Deryng, D.; Elliott, J.; Fujimorih, S.; Hasegawa, T. Climate change effects on agriculture: Economicresponses to biophysical shocks. PNAS 2014, 111, 3274–3279. [Google Scholar] [CrossRef] [PubMed]
- Tol, R.S.J. The Economic Effects of Climate Change. J. Econ. Perspect. 2009, 23, 29–51. [Google Scholar] [CrossRef]
- Chalise, S.; Naranpanawa, A.; Bandara, J.S.; Sarker, T. A general equilibrium assessment of climate change–induced loss of agricultural productivity in Nepal. Econ. Model. 2017, 62, 43–50. [Google Scholar] [CrossRef]
- Hounnou, E.F.; Dedehouanou, H. Variability of temperature, precipitation and potential evapotranspiration time series analysis in Republic of Benin. IJAER 2018, 4, 991–1019. [Google Scholar]
- Hounnou, E.F.; Dedehouanou, H.; Zannou, A.; Bakary, S.; Mahoussi, F.E. Influence of Climate Change on Food Crop Yield in Benin Republic. JAS 2019, 11, 281–295. [Google Scholar] [CrossRef]
- Awoye, O.H.R.; Pollinger, F.; Agbossou, E.K.; Paeth, H. Dynamical-statistical projections of the climate change impact on agricultural production in Benin by means of a cross-validated linear model combined with Bayesian statistics. Agric. For. Meteorol. 2017, 234, 80–94. [Google Scholar] [CrossRef]
- World Bank. 2019. Available online: https://data.worldbank.org/country/benin (accessed on 5 April 2019).
- Yegbemey, R.N.; Yabi, J.A.; Tovignan, S.D.; Gantoli, G.; Haroll Kokoye, S.E. Farmers’ decisions to adapt to climate change under various property rights: A case study of maize farming in northern Benin (West Africa). Land Use Policy 2013, 34, 168–175. [Google Scholar] [CrossRef]
- Kpadonou, B.A.R.; Adegbola, Y.P.; Tovignan, D.S. Local knowledge and adaptation to climate change in Ouémé.Valley, Benin. Afr. Crop Sci. J. 2012, 20, 181–192. [Google Scholar]
- Sanchez, C.A.; Fandohan, B.; Assogbadjo, E.A.; Sinsin, B. A countrywide multi-ethnic assessment of local communities’ perceptionof climate change in Benin (West Africa). Clim. Dev. 2012, 4, 114–128. [Google Scholar] [CrossRef]
- Sherony, R.K.; Knowels, J.G.; Boyd, R. The Economic Impact of Crop Losses: A Computable General Equilibrium Approach. West. J. Agric. Econ. 2008, 16, 144–155. [Google Scholar]
- Shiferaw, B.; Tesfaye, K.; Kassie, M.; Abate, T.; Prasanna, B.M.; Menkir, A. Managing vulnerability to drought and enhancing livelihood resilience in subSaharan Africa: Technological, institutional and policy options. Weather Clim. Extreme. 2014, 3, 67–79. [Google Scholar] [CrossRef]
- Brown, C.; Meeks, R.; Ghile, Y.; Hunu, K. Is water security necessary? An empirical analysis of the effects of climate hazards on national-level economic growth. Phil. Trans. R. Soc. A 2013, 371, 20120416. [Google Scholar] [CrossRef] [PubMed]
- Sadoff, C.W.; Hall, J.W.; Grey, D.; Aerts, J.C.J.H.; Ait-Kadi, M.; Brown, C.; Wiberg, D. Securing Water, Sustaining Growth. Report of the GWP/OECD Task Force on Water Security and Sustainable Growth; University of Oxford: Oxford, UK, 2015. [Google Scholar]
- Arndt, C.; Asante, F.; Thurlow, J. Implications of Climate Change for Ghana’s Economy. Sustainability 2015, 7, 7214–7231. [Google Scholar] [CrossRef]
- Bezabih, M.M.; Chambwera, J.; Stage, J. Climate change and total factor productivity in the Tanzanian economy. Clim. Policy 2011, 11, 1289–1302. [Google Scholar] [CrossRef]
- Ananda, R.R.; Widodo, T. A General Assessment of Climate Change—Loss of Agricultural Productivity in Indonesia. MPRA Paper No. 91316. Available online: https://mpra.ub.uni-muenchen.de/91316/ (accessed on 7 January 2019).
- Boccanfuso, D.; Savard, L.; Estache, A. The Distributional Impact of Developed Countries’ Climate Change Policies on Senegal: A Macro-Micro CGE Application. Sustainability 2013, 5, 2727–2750. [Google Scholar] [CrossRef]
- Thurlow, J.; Zhu, T.; Diao, X. Current Climate Variability and Future Climate Change: Estimated Growth and Poverty Impacts for Zambia. Rev. Dev. Econ. 2012, 16, 394–411. [Google Scholar] [CrossRef]
- Gebreegziabher, Z.; Stage, J.; Mekonnen, A.; Alemu, A. Climate change and the Ethiopian economy: A CGE analysis. Environ. Dev. Econ. 2015, 21, 205–225. [Google Scholar] [CrossRef]
- Juana, J.S.; Strzepek, K.M.; Kirsten, J.F. Households’ welfare analyses of the impact of global change on water resources in South Africa. Agrekon 2008, 47, 309–326. [Google Scholar] [CrossRef]
- Vista, B.A. Simulating climate-induced impacts on Philippine agriculture using computable general equilibrium analysis. J. ISSAAS 2014, 20, 16–28. [Google Scholar]
- Armington, P.A. A Theory of Demand for Products Distinguished by Place of Production. IMF Staff Pap. 1969, 16, 159–178. [Google Scholar] [CrossRef]
- Thurlow, J. A Recursive Dynamic CGE Model andMicrosimulation Poverty Module for South Africa; International Food Policy Research Institute: Washington, DC, USA, 2008. [Google Scholar]
- INSAE. Synthèse des analyses sur l’état par la structure de la population. Tome 1 Répartition Spatiale, Structure par âge et par sexe, état Matrimonial et Possession d’acte de Naissance; INSAE: Cotonou, Benin, 2017; p. 20. [Google Scholar]
- Grethe, H.; Siddig, K.; Luckmann, J. Capacity Building on Policy Analysis Using Economy-wide Models in Benin; Humboldt-Universität zu Berlin, Training material: Berlin, Germany, 2019; p. 30. [Google Scholar]
- Badolo, F.; Traoré, F. Impact of Rising World Rice Prices on Poverty and Inequality in Burkina Faso. CERDI Etudes et Documents No 22; Ferrand: Clermont, FL, USA, 2012; p. 52. [Google Scholar]
- Chitiga, M.; Mabugu, R. Evaluating the impact of land redistribution: A CGE microsimulation application to Zimbabwe. J. Afr. Econ. 2008, 17, 527–549. [Google Scholar] [CrossRef]
- INSAE. National Account: Table of Integrated Economic Account and Table of Input and Output; INSAE: Cotonou, Benin, 2013. [Google Scholar]
- Issahaku, Z.A. Climate Change, Agricultural Productivity and Poverty in Ghana’s Context: Macro-micro Analysis. Ph.D. Thesis, International Development and Cooperation Hiroshima University, Hiroshima, Japan, 2015; p. 181. [Google Scholar]
- Kilimani, N.; van Heerden, J.; Bohlmann, H.; Roos, L. Economy-wide impact of drought induced productivity losses”, Disaster Prevention and Management. Disaster Prev. Manag. Int. J. 2018, 27, 636–648. [Google Scholar] [CrossRef]
- Borgomeo, E.; Vadheim, B.; Woldeyes, B.F.; Alamirew, T.; Tamu, S.; Charles, K.; Kebede, S.; Walker, O. The Distributional and Multi-Sectoral Impacts of Rainfall Shocks: Evidence From Computable General Equilibrium Modelling for the Awash Basin, Ethiopia. Ecol. Econ. 2018, 146, 621–632. [Google Scholar] [CrossRef]
- Islam, N.; Windel, J. Climate Change and Social Inequality; Paper No. 152 ST/ESA/2017/DWP/152; Department of Economic & Social Affairs Working: New York, NY, USA, 2017; p. 32. [Google Scholar]
- Alamgir, S.M.; Furuya, J.; Kobayashi, S.; Binte, M.R.; Salam, A.M. Farmers’ Net Income Distribution and Regional Vulnerability to Climate Change: An Empirical Study of Bangladesh. Climate 2018, 6, 65. [Google Scholar] [CrossRef]
- Maddison, D.; Rehdanz, K. The impact of climate on life satisfaction. Ecol. Econ. 2011, 70, 2437–2445. [Google Scholar] [CrossRef]
- INSAE (Institut National de la Statistiqueet de l’AnalyseEconomique); PAM (World Food Program); MAEP (Benin Ministry of Agriculture, Livestock and Fisheries). Analyse Globale de la Vulnérabilité et de la Sécurité Alimentaire. Available online: http://www.insae-bj.org/autres_enquetes.html?file=files/enquetesrecensements/autres/Benin_AGVSA_Rapport (accessed on 4 December 2018).
- Dennig, F.; Budolfson, B.M.; Fleurbaey, M.; Siebert, A.; Socolow, H.R. Inequality, climate impacts on the future poor, and carbon prices. PNAS 2015, 112, 15827–15832. [Google Scholar] [CrossRef]
- Breisinger, C.T.; Zhu, P.; Al Riffai, G.; Nelson, R.; Robertson, J. Funes, and Verner, D. Global and Local Economic Impacts of Climate Change in Syria. Clim. Chang. Econ. 2013, 4, 1350001. [Google Scholar] [CrossRef]
- Chambwera, M.; Heal, G.; Dubeux, C.; Hallegatte, S.; Leclerc, L.; Markandya, A.; McCarl, B.A.; Mechler, R.; Neumann, J.E. Economics of adaptation. In Climate Change 2014: Impacts, Adaptation, and Vulnerability. Part A: Global and Sectoral Aspects. Contribution of Working Group II to the Fifth Assessment Report of the IPCC; Field, C.B., Barros, V.R., Dokken, D.J., Mach, K.J., Mastrandrea, M.D., Bilir, T.E., Chatterjee, M., Ebi, K.L., Estrada, Y.O., Genova, R.C., et al., Eds.; Cambridge University Press: Cambridge, UK; New York, NY, USA, 2014; pp. 945–977. [Google Scholar]
- Skoufias, E. The Poverty and Welfare Impacts of Climate Change: Quantifying the Effects, Identifying the Adaptation Strategies; World Bank: Washington, DC, USA, 2012. [Google Scholar]
- Al-Haboby, A.; Breisinger, C.; Debowicz, D.; El-Hakim, H.A.; Ferguson, J.; Telleria, R.; van Raheenen, T. Agriculture for Development in Iraq? Estimating the Impacts of Achieving the Agricultural Targets of the National Development Plan 2013–2017 on Economic Growth, Incomes, and Gender Equality; Discussion Paper 01349; IFPRI: Washington, DC, USA, 2014; p. 28. [Google Scholar]
- Tol, S.J.R. The Economic Impacts of Climate Change. Rev. Environ. Econ. Policy 2018, 1–22. [Google Scholar] [CrossRef]
- Deressa, T.T.; Hassan, R.M.; Ringler, C.; Alemu, T.; Yusuf, M. Determinants of farmers’ choice of adaptation methods to climate change in the Nile basin of Ethiopia. Glob. Environ. Chang. 2009, 19, 248–255. [Google Scholar] [CrossRef]
- Deressa, T.T.; Hassan, R.M.; Ringler, C. Perception of and adaptation to climate change by farmers in the Nile basin of Ethiopia. J. Agric. Sci. 2011, 149, 23–31. [Google Scholar] [CrossRef]
- Adimassu, Z.; Kessler, A. Factors affecting farmers’ coping and adaptation strategies to perceived trends of declining rainfall and crop productivity in the central Rift valley of Ethiopia. Environ. Syst. Res. 2016, 5, 1–16. [Google Scholar] [CrossRef]
- Le Dang, H.; Li, E.; Bruwer, J.; Nuberg, I. Farmers’ perceptions of climate variability and barriers to adaptation: Lessons learned from an exploratory study in Vietnam. Mitig. Adapt. Strateg. Glob. Chang. 2014, 19, 531–548. [Google Scholar] [CrossRef]
- Swedberg, R.; Joseph, A. Schumpeter, His Life and Work; Policy press in association with Blackwell Publishers: Oxford, UK, 1991; p. 304. [Google Scholar]
- Carvale, A.G.; Tosato, A.D. Ricardo and the Theory of Value Distribution and Growth; Routledge: London, UK, 1980; p. 256. [Google Scholar]


| Authors | Country | Method | Results |
|---|---|---|---|
| Bezabih et al. [19] | Tanzania 2020–2080 | A recursive dynamic CGE Model | In spite of agricultural productivity losses due to climate change effects, the authors found that the negative effects were limited and could be justified by substitution effects in the factor markets. |
| Arndt et al. [18] | Ghana 2007–2050 | Recursive dynamic CGE Model | According to the authors, climate change was projected to reduce national welfare. Poor and urban households and the northern Savannah zone could be negatively affected. An equal distribution of climate effects in terms of size, sectors, and scenarios was also observed. |
| Ananda and Widodo [20] | Indonesia | Dynamic CGE Model | According to these authors, GDP and wealth were negatively affected in the different scenarios. The more intense the climate change effects are, the more GDP, welfare, and other macroeconomic variables decline. They added that the effects were unequal among households. |
| Boccanfuso et al. [21] | Senegal 2013 | Integrated CGE Model with a Microsimultion Model | The authors claimed that an increase in the world price of fossil fuels will lead to an increase in poverty rates. Addingland productivity losses to increases in the world price of fossil fuels leads to higher increases in poverty rates. |
| Thurlow et al. [22] | Zambia 2025 | Hydro-crop (HC) Models and Dynamic CGE Model | The authors found that GDP declined by 4% and 2% of the households fall under the poverty line because of the climate change effects. |
| Gebreegziabher et al. [23] | Ethiopia 2010–2016 | Dynamic CGE Model | The authors showed that agricultural productivity losses resulting from the climate change effects lead to income drops. |
| Juana et al. [24] | South Africa | Static CGE model | The authors demonstrated that precipitation shortage due to climate change led to a general deterioration in households’ welfare, with the poor more adversely affected. |
| Vista [25] | Philippines | Static CGE model | The authors found that climate change negatively affects the real GDP, export quantity, import quantity, and employment. |
| Sector | 2025 | 2035 | 2045 |
|---|---|---|---|
| Maize | −6.807 | −6.831 | −6.872 |
| Rice | −6.699 | −6.717 | −6.855 |
| Cassava | −6.872 | −6.872 | −6.872 |
| Yam | −6.872 | −6.872 | −6.872 |
| Pineapple | −1.286 | −1.591 | −1.618 |
| Vegetable | −4.958 | −6.131 | −6.234 |
| Cowpea | −6.872 | −6.872 | −6.872 |
| Sorghum | −6.824 | −6.842 | −6.872 |
| Other staple crops | −6.872 | −6.872 | −6.415 |
| Cotton | −1.359 | −1.704 | −1.734 |
| Cashew nut | −6.872 | −6.872 | −6.872 |
| Palm grove | −1.954 | −2.396 | −2.435 |
| Other export crops | −4.882 | −5.759 | −5.835 |
| Livestock | −2.642 | −3.264 | −3.318 |
| Milk processing | −2.345 | −2.883 | −2.93 |
| Poultry farming | −2.806 | −3.441 | −3.497 |
| Hunting and forestry | −2.688 | −3.343 | −3.4 |
| Fishing | −2.19 | −2.701 | −2.746 |
| Trade | −2.43 | −2.876 | −2.918 |
| Non-agricultural | −0.894 | −1.117 | −1.136 |
| Commodities | 2025 | 2035 | 2045 |
|---|---|---|---|
| Maize | −2.790 | −2.905 | −2.915 |
| Rice | −6.699 | −6.717 | −6.855 |
| Cassava | −9.037 | −11.528 | −11.73 |
| Yam | −4.726 | −4.865 | −4.914 |
| Pineapple | −1.286 | −1.591 | −1.618 |
| Vegetable | −4.799 | −5.920 | −6.019 |
| Cowpea | −5.46 | −5.698 | −5.804 |
| Sorghum | −3.529 | −3.71 | −3.721 |
| Other staple crops | −4.542 | −5.633 | −5.729 |
| Cotton | −1.044 | −1.304 | −1.326 |
| Cashew nut | −1.923 | −2.376 | −2.415 |
| Palm grove | −1.954 | −2.396 | −2.435 |
| Other export crops | −4.882 | −5.759 | −5.835 |
| Livestock | −2.212 | −2.715 | −2.759 |
| Milk and dairy products | −2.345 | −2.883 | −2.93 |
| Poultry products | −2.806 | −3.441 | −3.497 |
| Hunting and Forestry products | −1.535 | −1.889 | −1.920 |
| Fish products | −2.190 | −2.701 | −2.746 |
| Trade products | −2.430 | −2.876 | −2.918 |
| Non-agricultural products | −1.069 | −1.313 | −1.335 |
| Commodities | 2025 | 2035 | 2045 |
|---|---|---|---|
| Maize | 2.676 | 2.187 | 2.129 |
| Rice | 1.843 | 1.261 | 1.205 |
| Cassava | 10.176 | 14.558 | 15.707 |
| Yam | 11.9 | 11.245 | 11.324 |
| Pineapple | 2.507 | 3.212 | 3.272 |
| Vegetable | 2.199 | 2.832 | 2.885 |
| Cowpea | 10.425 | 9.792 | 10.001 |
| Sorghum | 1.271 | 0.765 | 0.711 |
| Other staple crops | 2.441 | 3.13 | 3.188 |
| Cotton | 0.517 | 0.736 | 0.753 |
| Cashew nut | 0.511 | 0.716 | 0.732 |
| Palm grove | 2.194 | 2.827 | 2.881 |
| Other export crops | 2.267 | 2.923 | 2.979 |
| Livestock | 2.444 | 3.163 | 3.223 |
| Milk and dairy products | 2.453 | 3.174 | 3.234 |
| Poultry products | 1.886 | 2.45 | 2.497 |
| Hunting and forestry products | 1.94 | 2.513 | 2.561 |
| Fish products | 1.276 | 1.682 | 1.716 |
| Non-agricultural products | −1.817 | −2.173 | −2.206 |
© 2019 by the authors. Licensee MDPI, Basel, Switzerland. This article is an open access article distributed under the terms and conditions of the Creative Commons Attribution (CC BY) license (http://creativecommons.org/licenses/by/4.0/).
Share and Cite
Hounnou, F.E.; Dedehouanou, H.; Zannou, A.; Agbahey, J.; Biaou, G. Economy-Wide Effects of Climate Change in Benin: An Applied General Equilibrium Analysis. Sustainability 2019, 11, 6569. https://0-doi-org.brum.beds.ac.uk/10.3390/su11236569
Hounnou FE, Dedehouanou H, Zannou A, Agbahey J, Biaou G. Economy-Wide Effects of Climate Change in Benin: An Applied General Equilibrium Analysis. Sustainability. 2019; 11(23):6569. https://0-doi-org.brum.beds.ac.uk/10.3390/su11236569
Chicago/Turabian StyleHounnou, Femi E., Houinsou Dedehouanou, Afio Zannou, Johanes Agbahey, and Gauthier Biaou. 2019. "Economy-Wide Effects of Climate Change in Benin: An Applied General Equilibrium Analysis" Sustainability 11, no. 23: 6569. https://0-doi-org.brum.beds.ac.uk/10.3390/su11236569