Case Report

Potential Reconstruction Design of an Existing Townhouse in Washington DC for Approaching Net Zero Energy Building Goal

by
Sakdirat Kaewunruen
*,
Jessada Sresakoolchai
and
Lalida Kerinnonta
School of Engineering, University of Birmingham, Birmingham B15 2TT, UK
*
Author to whom correspondence should be addressed.
Sustainability 2019, 11(23), 6631; https://0-doi-org.brum.beds.ac.uk/10.3390/su11236631
Submission received: 21 October 2019 / Revised: 19 November 2019 / Accepted: 20 November 2019 / Published: 23 November 2019
(This article belongs to the Section Sustainable Urban and Rural Development)

Abstract

:
The concept of the Net Zero Energy Building (NZEB) has received more interest from researchers due to global warming concerns. This paper proposes to illustrate optional solutions to allow existing buildings to achieve NZEB goals. The aim of this study is to investigate factors that can improve existing building performance to be in line with the NZEB concept and be more sustainable. An existing townhouse in Washington, DC was chosen as the research target to study how to retrofit or reconstruct the design of a building according to the NZEB concept. The methodology of this research is modeling an existing townhouse to assess the current situation and creating optional models for improving energy efficiency of the townhouse in Revit and utilising renewable energy technology for energy supply. This residential building was modeled in three versions to compare changes in energy performance including improving thermal efficiency of building envelope, increasing thickness of the wall, and installing smart windows (switchable windows). These solutions can reduce energy and cost by approximately 8.16%, 10.16%, and 14.65%, respectively, compared to the original townhouse. Two renewable energy technologies that were considered in this research were photovoltaic and wind systems. The methods can be applied to reconstruct other existing buildings in the future.

1. Introduction

The concept of the Net Zero Energy Building (NZEB) has received a lot of attention in the construction industry. The construction of buildings that can produce energy by themselves without relying on energy produced from outside the building is one tool in the fight to prevent or mitigate climate change. Global warming, including the greenhouse effect, is a global concern. The emission of carbon dioxide from the US residential sector was 294.5 MMT CO2 Eq. in 2017, which is 5.59% of the total carbon dioxide emissions in the United States according to the United States Environmental Protection Agency (EPA) [1]. Moreover, Hermelink et al. [2] suggest that the residential and service sectors need to bring greenhouse gas emission down by approximately 88–91% from 1990 to 2050 with the recast of the Energy Performance of Buildings Directive (EPBD).
Due to the above problems, this study will focus on existing residential buildings to find ways to develop and improve existing buildings in order to save more energy, including keeping reliance on external sources to a minimum. The main research aim of this study is to investigate the factors that can improve existing building performance in order to be closer to the concept of NZEB and be more sustainable. In this paper, the following research questions are addressed:
  • How can we manipulate an existing building to minimise its energy use intensity by changing building elements?
  • How much does the reconstruction of the townhouse cost?
  • How can renewable energy technologies support the annual energy usage of the existing building?
In this study, a simulation of a townhouse in Washington, DC based on the building plan and details is run through a program to simulate the current status, such as building elements and energy performance. In addition to the current status of this building in the first model, this study also simulates a second model to improve energy efficiency of the building based on a previous study [3]. The second and third models show that, after changing the thermal properties of the building envelope and the thickness of the building wall, various building elements can reduce the Energy Use Intensity (EUI) value of the building by using Green Building Studio and Insight, the building performance analysis software from Autodesk (Autodesk Inc., San Rafael, CA, USA). In addition to improvements to reduce energy and costs of the above buildings, the next step is to present renewable energy technologies to determine the optimal energy production method for this building.

2. Literature Review

2.1. Definition of NZEB

A Net Zero Energy Building is a building that has reduced energy consumptions in order to be balanced between the energy demand and the energy supply from renewable energy technologies [4]. Torcellini et al. [4] classified NZEB into four categories—Net Zero Site Energy Building, Net Zero Source Energy Building, Net Zero Energy Cost Building, and Net Zero Energy Emissions Building. Each definition gives different calculations in terms of site energy, source energy, cost, and emissions.

2.2. Net Zero Energy Building Balance

Sartori, Napolitano, and Voss [5] developed Equation (1) for presenting Net Zero Energy Building balance. This equation states that net-zero energy building balance is equal to the difference of weighted supply and weighted demand, which should be equal zero.
Net Zero Energy Building Balance = ∣weighted supply∣ − ∣weighted demand∣ = 0,
where weighted demand is the sum of required energy (load) of the building and weighted supply is the sum of exported energy (generation) of the building. They are adjusted by being multiplied by proper weighting factor when the weighting factor can be determined by different factors such as climate or energy efficiency of the building. From the above equation, a Net Zero Energy Building can be achieved when weighted supply is equal to or higher than weighted demand. In addition, absolute values are used to prevent the confusion from negative or positive values of supply and demand.

2.2.1. Energy Demand (Energy Efficiency and Energy Saving)

According to the concept of NZEB, reducing energy demand of the existing building is considered in terms of energy efficiency and energy-saving. There are various factors that affect the energy efficiency of buildings. Research from Pacheco, Ordóñez, and Martínez [6] concluded that the factors that affect the design of the building include the site location, shape of the building, building orientation, building envelope, shading on buildings, passive systems, and window glazing.
From the aforementioned factors, it was found that various factors are suitable for building a new building, but some factors do not significantly change when we apply these concepts to the existing buildings, such as the location/site and building orientation. The location is an unchangeable part of the existing building, and the building orientation might be difficult to change due to environmental constraints around the building, such as the townhouses that are built next to each other. The shape of the building is likely to change, but for some existing buildings, it is found that it can be changed only a little, possibly due to the unfavorable surrounding environment or limited space.
Building envelope is one of the most important parts that can be retrofitted in order to improve the energy efficiency of existing buildings. Building envelopes include all walls, roofs, doors, and windows of the building, constituting the outermost layer of the building that separates the environment between the interior and exterior environments of the building. Akadiri, Chinyio, and Olomolaiye [7] suggest that insulating the building envelope, choice of material, and construction methods are important elements for decreasing building energy consumption.
There are various research studies that have discussed the application of the net-zero energy concept to existing buildings via changes in building envelope. One interesting piece of research is by De Berardinis, Rotilio, and Capannolo [8], who studied the renovation and improvement of hospital buildings in L’aquila, Italy of historic design according to net-zero energy and sustainable strategies using Ecotect software programs for the analysis and calculation of solar radiation. The research found that the main conditions were from construction structure, climate analysis, and assessment of environmental comfort of the building, which leads to the renovated design of buildings and thermal energy analysis and is applied to the technological innovation of solar energy. For instance, increasing the wall thickness by 14.1% can reduce the demand for heating in the winter. Sierra-Pérez at al. [9] also compared the differences between applying conventional renovation with low-energy building (Passivhaus standard) renovation. They found that conventional renovation and Passivhaus renovation can save more energy by 60% and 80%, respectively. In addition, when considering the whole life cycle of the building, Passivhaus renovation can achieve 30% better results than conventional renovation. However, it is worth to underline that the environmental impact of applying Passivhaus renovation is 40–230% higher than the conventional approach. Moreover, the amount of required material is 60% higher than the conventional renovation, while the payback is less than 1.5 and two years for the conventional and Passivhaus renovations, respectively. Meanwhile, Kaewunruen, Rungskunroch, and Welsh [3] studied an existing building model for NZEB applications based on the case study of a residential building in Nottingham, UK using BIM (Building Information Modeling) for energy and cost analysis. The research found that an improved model can be reduced energy cost per year by 6.34% by improving thermal efficiency of house elements in a model and provide a solution of renewable technologies that can gain a 23-year payback period. Another compelling piece of research is from Aksamija [10] who studied retrofitting the building envelope of a commercial building in Massachusetts by installing expanded polystyrene (EPS) rigid insulation and fiberglass batt that bring an increase in the wall resistance (R-value). For doors and windows, Roos and Karlsson [11] mention that heat loss occurring via escape through the window makes up approximately 10–20% of total heat losses in ordinary residences. Selecting the type of glass is therefore important, as it has a direct effect on the building. Double glazing is a popular choice for buildings because it has good properties in both hot and cold conditions [6]. Double glazing was developed to provide better insulation, reduce noise, and lower energy costs [12]. The use of triple glazing has also increased, as triple glazing has even better performance than double glazing. Triple glazing consists of three panes separated by argon gas, which is a poor heat conductor. An extra layer of glass acts as an additional insulation, which increases the difficulty of heat losses from the inside of the building to the outside, relating to the U-value (thermal transmittance) and R-value (resistance) of materials [13]. Therefore, heat loss from convection is very low. Moreover, the gaps between each layer of glass are small, so that air cannot circulate, which also prevents heat loss. From this, lower heat loss means lower energy consumption in the winter in order to keep the building warm. However, this better performance requires increased weight and 33–50% higher prices than double glazing [14]. Almost every paper that has been written about the building envelope of NZEB includes a section relating to the thermal properties of material use in construction. This suggests that the retrofitting or reconstruction of the building should give great importance to the properties of the materials used for construction in terms of thermal properties.
The Commercial Buildings Energy Consumption Survey (CBECS) [15,16] presented the range of Energy Use Intensity (EUI) for different types of buildings in 2003 and 2012. In 2003, the EUI from CBECS data [15] for ‘Lodging’ was 103.2 kBtu/ft2/year, which is equal to 325.5 kWh/m2/year. In 2012, the EUI was 98.55 kBtu/ft2/year, which is equal to 310.8 kWh/m2/year [16]. The EUI from CBECS was rather close to source EUI, but rather high for site EUI. On the other hand, Energy Star [17] illustrated the US National Median Reference Values for ‘multifamily housing’ that are 118.1 kBtu/ft2 for source EUI and 59.6 kBtu/ft2 for site EUI, which is equal to 372.5 and 188 kWh/m2/year, respectively. Moreover, the American Institute of Architects (AIA) [18,19] also provided a table of the US National Average Site EUI by use types and Architecture 2030 Challenge Site EUI. The table showed 58.2 kBtu/ft2/year for site EUI of ‘residential—multi-family, 2–4 units’, which is equal to 183.6 kWh/m2/year in comparison with 17.5 kBtu/ft2/year or 55.2 kWh/m2/year of goal EUI in 2030. These could be said that the estimated value of the EUI for ‘multifamily housing’, which is approximately 59.05 kBtu/ft2/year or 186.2 kWh/m2/year.

2.2.2. Energy Supply (Renewable Energy Technologies)

According to the concept of NZEB, after the reduction of overall energy demands of the building is achieved, providing sufficient renewable energy sources to meet demands is required. Existing buildings have renewable energy technologies used for reducing or disabling energy from outside energy sources, which are considered the heart of the NZEB concept [20]. A considerable amount of literature has been published on renewable energy technologies for NZEB. These studies are often referred to as solar energy, hydro energy, wind energy, and biomass. For example, a commercial building in Massachusetts also considers these four renewable sources of energy supply [10]. Chang et al. [21] simulated a personal office building in which a 500W fuel cell was installed. This fuel cell generated the power for the lighting and air conditioning systems. Loads in this study were lighting, air fan, table lamp, laptop, printer, and acoustic equipment. They found that the system can generate 12 kwh/day or 4320 kwh/year. Moreover, their system can reduce carbon emission by 7.656 kg/day or 2756.16 kg/year. During the process of power generation by the fuel cell, water is a byproduct, and it can be used as landscape water as well. Chua et al. [22] developed a combination of renewable technologies for the purpose of trigeneration. They found that the best combination consisted of 80% microturbine, 10% photovoltaic-thermal, and 10% fuel cell, which can deliver the advantages of operation cost reduction, energy saving, and environmental impact reduction. Their case study was a commercial building where the heating system, cooling system, and power system were supplied with power by the developed system. Li and Fan [23] stated that the main function of an envelope of a building is to protect the building, and this tended limited other functions of the envelope. As a result, there is a lot of wasted renewable energy potential. They tried to develop a new concept to use the envelope of the building more efficient. They presented other potential of the envelope include solar energy collection, wind power collection, and plantation on the roof. They believe that this concept can promote energy saving and environmental impact reduction. In addition, the further study of this concept can change building design and other fields to make the architecture and engineering more natural. Visa et al. [24] tried to improve an existing building which applied renewable energy concept already to reach NZEB concept. They used the Solar House as a case study. Their purposed processes for reaching NZEB concept consisted of three steps—identification for energy demand reduction, renewable energy mix development, and existing system development and/or new system addition. They found that the Solar House can achieve NZEB by adding a photovoltaic string system to the original system of solar and geothermal systems. The photovoltaic string system was used to track the climate profile and optimize the energy use in the building. They also suggested that any building can apply the renewable energy concept, but technical and economic limitations also needed to be considered.

3. Methodology

In this paper, the research methodological approach taken in this study is a mixed methodology which included data gathering, building modeling, energy and cost analysis, and utilisation of renewable energy source. Townhouse details and plans were gathered from drafting services [25] as secondary data. The first model is the original house, which is created from original material based on the construction plan. The second model is an improved thermal efficiency townhouse model, which is created from the improved thermal efficiency of materials. The third model is an improved thermal efficiency (with increased thickness insulation) townhouse model, which is created from the second model with increased thickness of insulation in the wall. Finally, an optional choice for improved energy efficiency of the townhouse is provided by adding smart windows.

3.1. Building Information Model (BIM) and Revit

For this research, information and construction details of an existing building were obtained to create the Building information model (BIM). There are a number of instruments available for modeling building. One of the most well-known tools is Revit (version 2019, Autodesk Inc., San Rafael, CA, USA) from the Autodesk package. This provides a convenient way to transfer between 2D and 3D drawings that can support the change of building design components [26]. This study also uses this benefit of Revit to create a 3D model from 2D drawings. Although 2D drawings provide details of the building, a 3D model can deliver a clearer picture of the building. Revit can integrate structural, architectural, building systems, and other components together so the generated 3D model can deliver complete detail of the building. Moreover, Revit and other BIM software can make data management possible, not only for the data for the construction but also data for operation and maintenance. The data which can be integrated in BIM is various. Using Revit for energy efficiency analysis is one of the advantages from using BIM for data management. In addition, Revit has available extensions that can increase its capability for specific purposes. For this study, the energy model of the building was created in Revit software through Green Building Studio and Insight, which are functions of building performance analysis software in the Autodesk package. Green Building Studio shows the results of the analysis in the form of the energy use intensity (EUI) in kBtu/ft2/year, annual energy cost ($/ft2), annual energy consumption, etc. Insight shows the results of the analysis in the form of the energy cost range (ECR) in USD/m2/year, the energy use intensity (EUI) in kWh/m2/year, and other details about the building performance. In this study, the building used as a case study has the following properties: multi-family use, an area of 318.75 m2, height of 12.42 m, volume of 120 m3, and its location is Washington, DC.

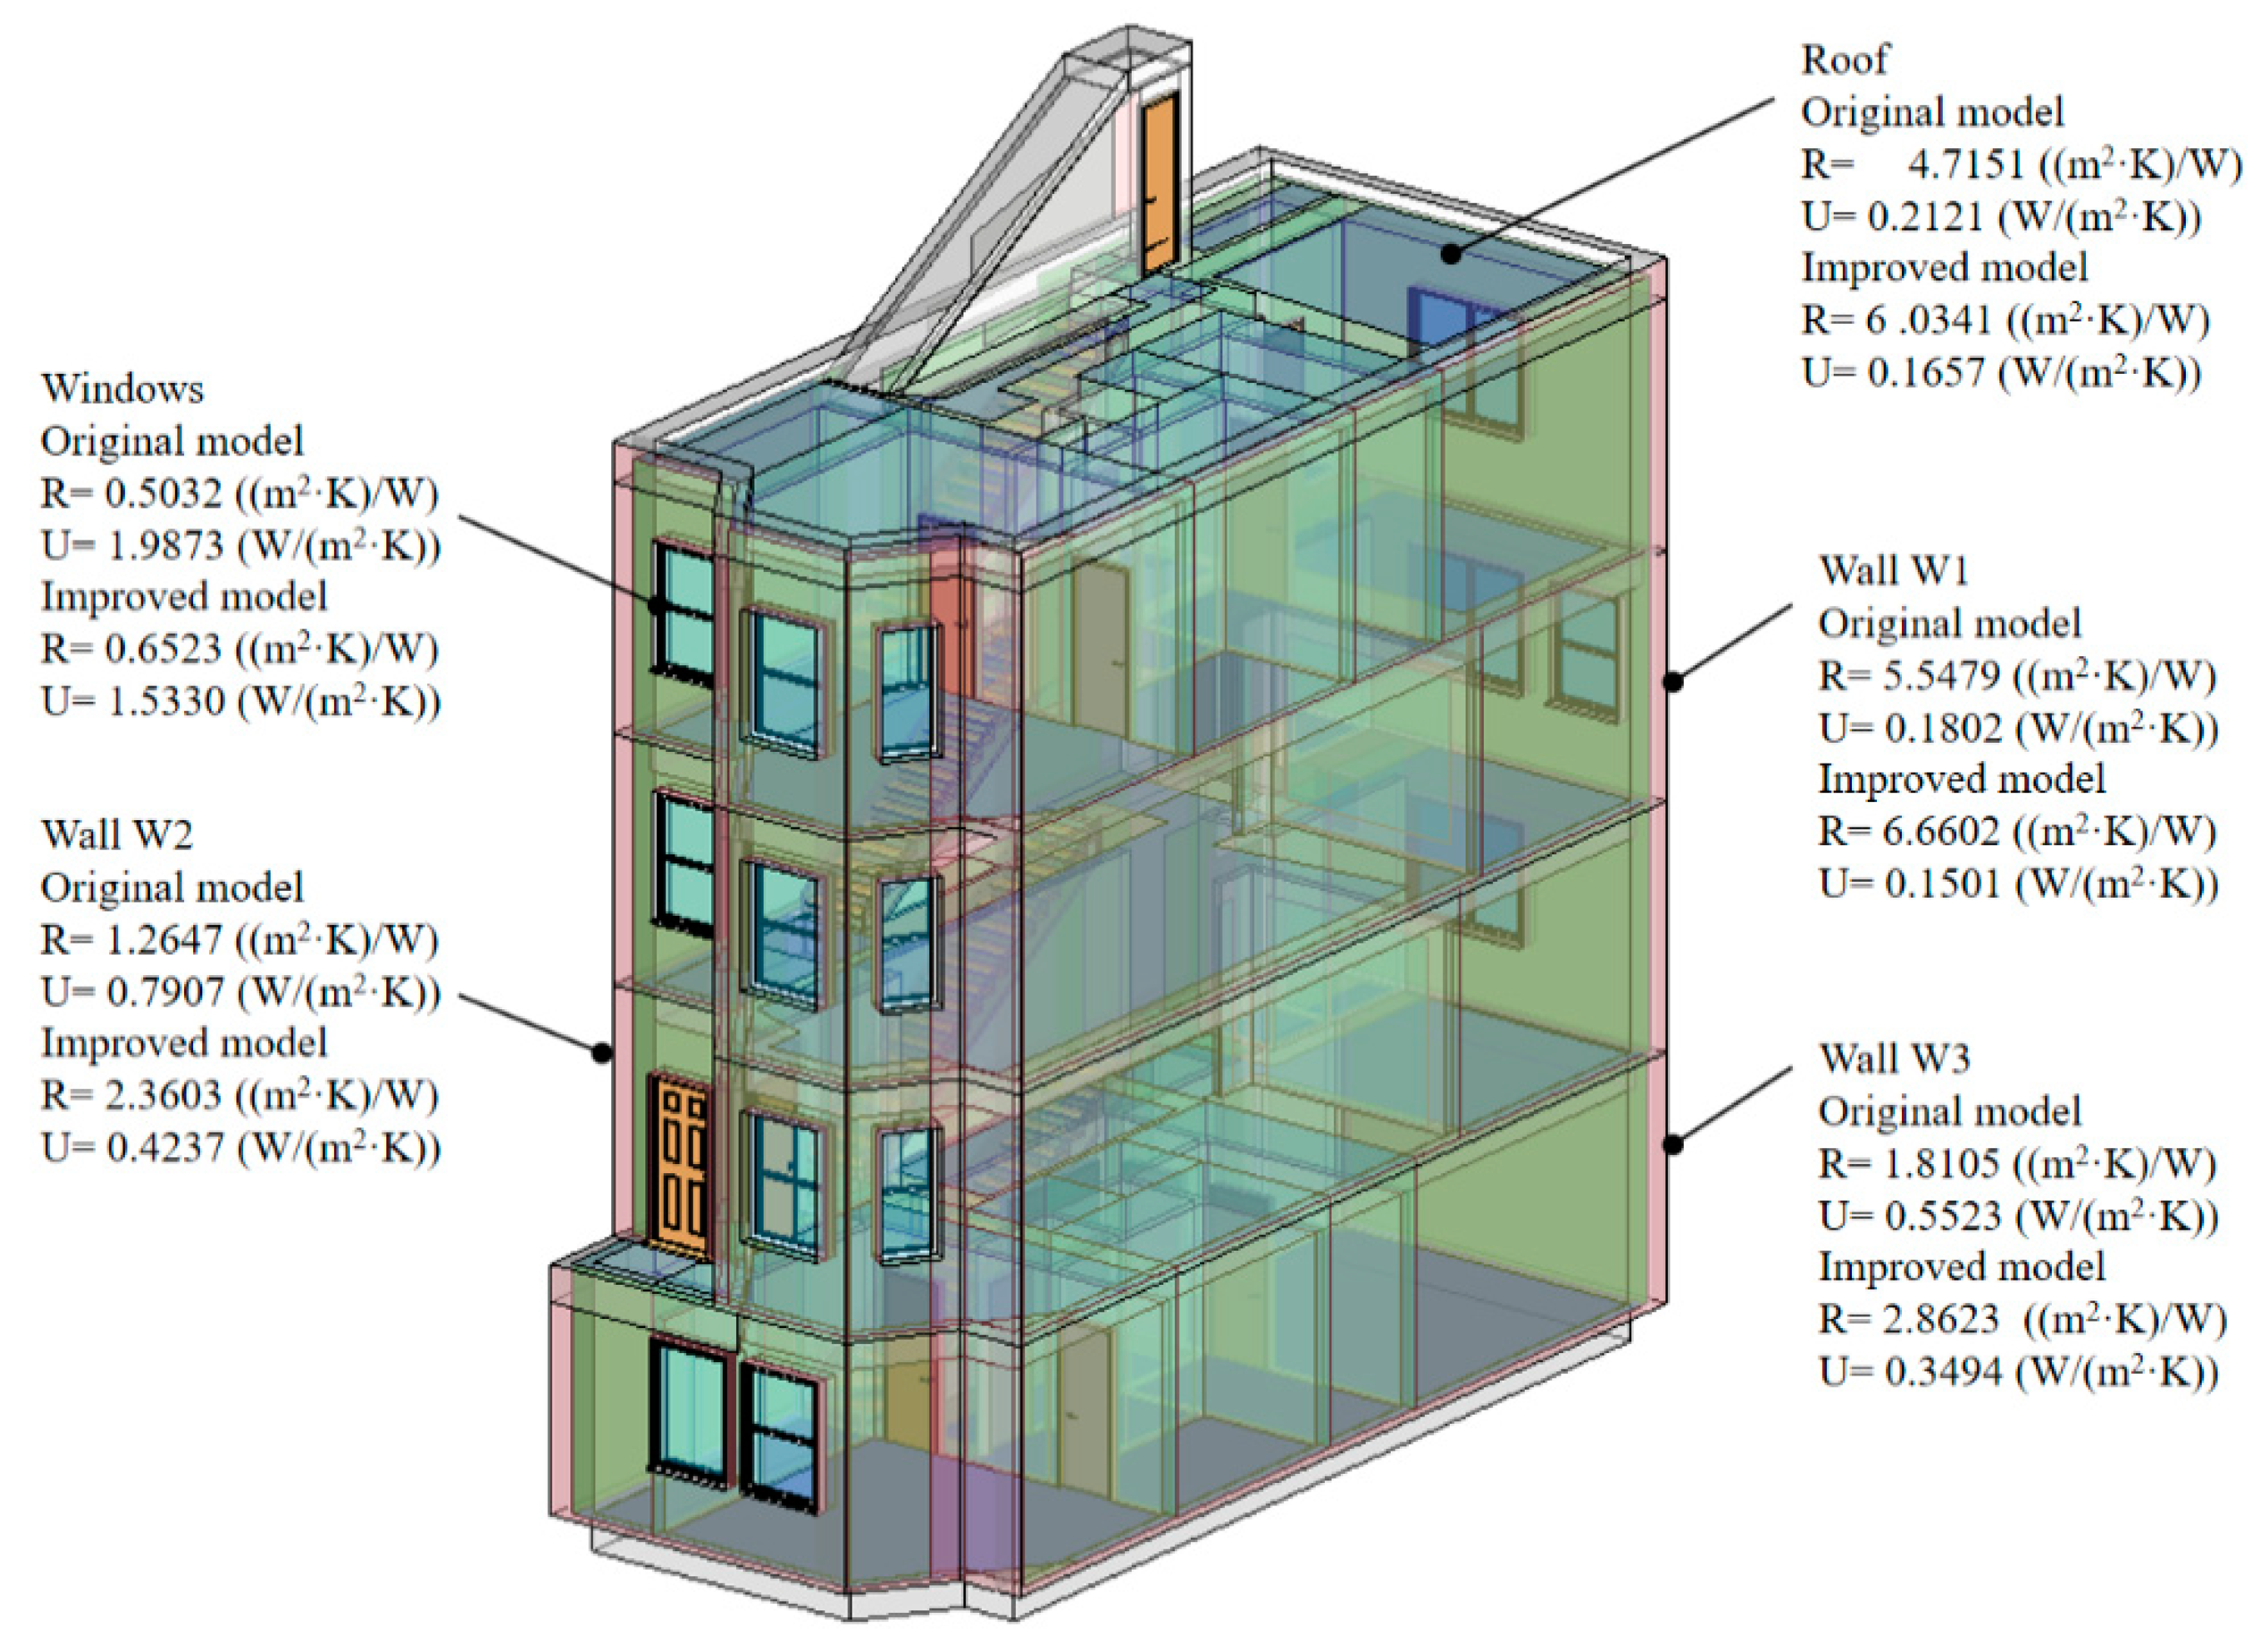
3.1.1. Elements of the Building Envelope

The existing building plan has been obtained and shows various information of the building, such as the dimensions of the building elements, construction materials, structure, and building position. This information was identified in the Revit software in order to simulate and model 2D and 3D drawings. The building components, such as walls, floors, roofs, windows, and doors, consist of several element details. Revit also provides the material thermal properties from the detailed elements. The energy analysis in Revit software offers three methods to specify thermal properties of building elements—conceptual types, schematic types, and detailed elements [27]. These methods also can work together in different stages. In this study, detailed elements are chosen to play an important role during energy analysis due to their giving more realistic results. In this research, the improved thermal efficiency methodology was prepared by adapting the procedure used by Kaewunruen, Rungskunroch, and Welsh [3]. The changing materials and thermal conductivities (k or λ) of building elements are intended to increase the thermal resistance of the building envelope (higher R-value) and to decrease the thermal transmittance (lower U-value) [28]. There are two sets of thermal properties of building elements data for two models. On one hand, the model of the building with original element details is modeled. On the other hand, the model of the building with improved thermal properties is modeled by changing the materials of the building envelope for better thermal conductivity and upgrading windows from double glazing to triple glazing. The data in Figure 1 presents the increase of R-values and decrease of U-values after improving the thermal properties of the building envelope. The third model was drawn from the improved thermal efficiency townhouse model by adding the thickness of insulation based on the research from De Berardinis, Rotilio, and Capannolo [8], which is mentioned in the literature review. This referred to Horizon 20-20-20 which aimed to reduce carbon emission by 20% compared to 1990, increase the use of renewable energy to 20%, and increase energy efficiency by 20% in 2020.

3.1.2. Energy and Cost Analysis

Green Building Studio and Insight software play a crucial role in energy and cost analysis in Revit. Insight presents the energy cost range (ECR) and the energy use intensity (EUI).
After reducing energy via the methods mentioned above, the different renewable energy technologies, such as photovoltaic system (solar cell) and wind system (wind turbine), are adapted to supply the remaining energy of the townhouse.

4. Results

4.1. Energy and Cost Analysis Result

4.1.1. Three Models from Revit Software

The energy analysis from the Green Building Studio and Insight software calculated several areas of performance of building. The results of the energy analysis were that energy use intensity (EUI) of from the original townhouse model, the improved thermal efficiency townhouse, and the improved thermal efficiency (with increased thickness of the insulation) were equal to 154.5 kWh/m2/year, 141.9 kWh/m2/year, and 138.8 kWh/m2/year, respectively. The results obtained from the energy analysis of all models can be compared in Table 1, showing EUI, remaining energy, annual reduced energy in kWh.
Table 2 shows the energy results obtained from the energy analysis of all models in terms of energy cost. The average electricity cost of energy is equal to £0.127/kWh [29], which is applied to calculate annual energy cost. Table 2 below provides EUI, remaining energy, annual energy cost, and annual reduced energy cost.
From the two tables above, the improved thermal efficiency townhouse model can reduce energy use and cost by around 8.16% from the original townhouse model. The improved thermal efficiency with increased thickness of insulation model can reduce energy use and cost by around 10.16% from the original townhouse model.

4.1.2. An Option for Improved Energy Efficiency of the Townhouse

In addition to the above three models, this paper provided one more option to improve energy efficiency of the townhouse with switchable windows, which are known as smart windows. This technology involves windows with a control system based on occupancy, temperature, and solar radiation [30]. According to Karlsson’s experiment [30], the smart switchable windows reduced energy consumption of buildings but depending on various factors such as the location and orientation of the building, type of building, building occupancy, weather, etc. Therefore, Karlsson’s study was conducted in three different locations—Stockholm, Denver, and Miami—to monitor the differences in potential energy-saving.
The graph below illustrates the comparison between the average monthly temperature of Stockholm, Denver, Miami, and Washington, DC in order to find a location with similar weather conditions with the townhouse location. The weather data used to create a chart, which is shown in Figure 2, was obtained from weather reports collected during 1985–2015 [31,32,33,34].
As seen from the graph, Denver has the weather most like Washington, DC. Therefore, this research applied the finding of a switchable window energy-saving which is 25–75 kWh/m2/year (kWh per square metre glazed area) of energy-saving in a Denver-like climate from Karlsson’s study. The glazing area of this townhouse was 29.75 m2 which means that the potential energy-saving is around 736.25–2208.75 kWh/year. Therefore, the remaining energy of this building is equal to 42,033.75–43,506.25 kWh/year, which results in a reduction 1.66–4.99% from the improved thermal efficiency (with increased thickness insulation) townhouse model summarised in Table 3. The relevant properties of the smart windows are shown in Table 4 based on the referred study [30].

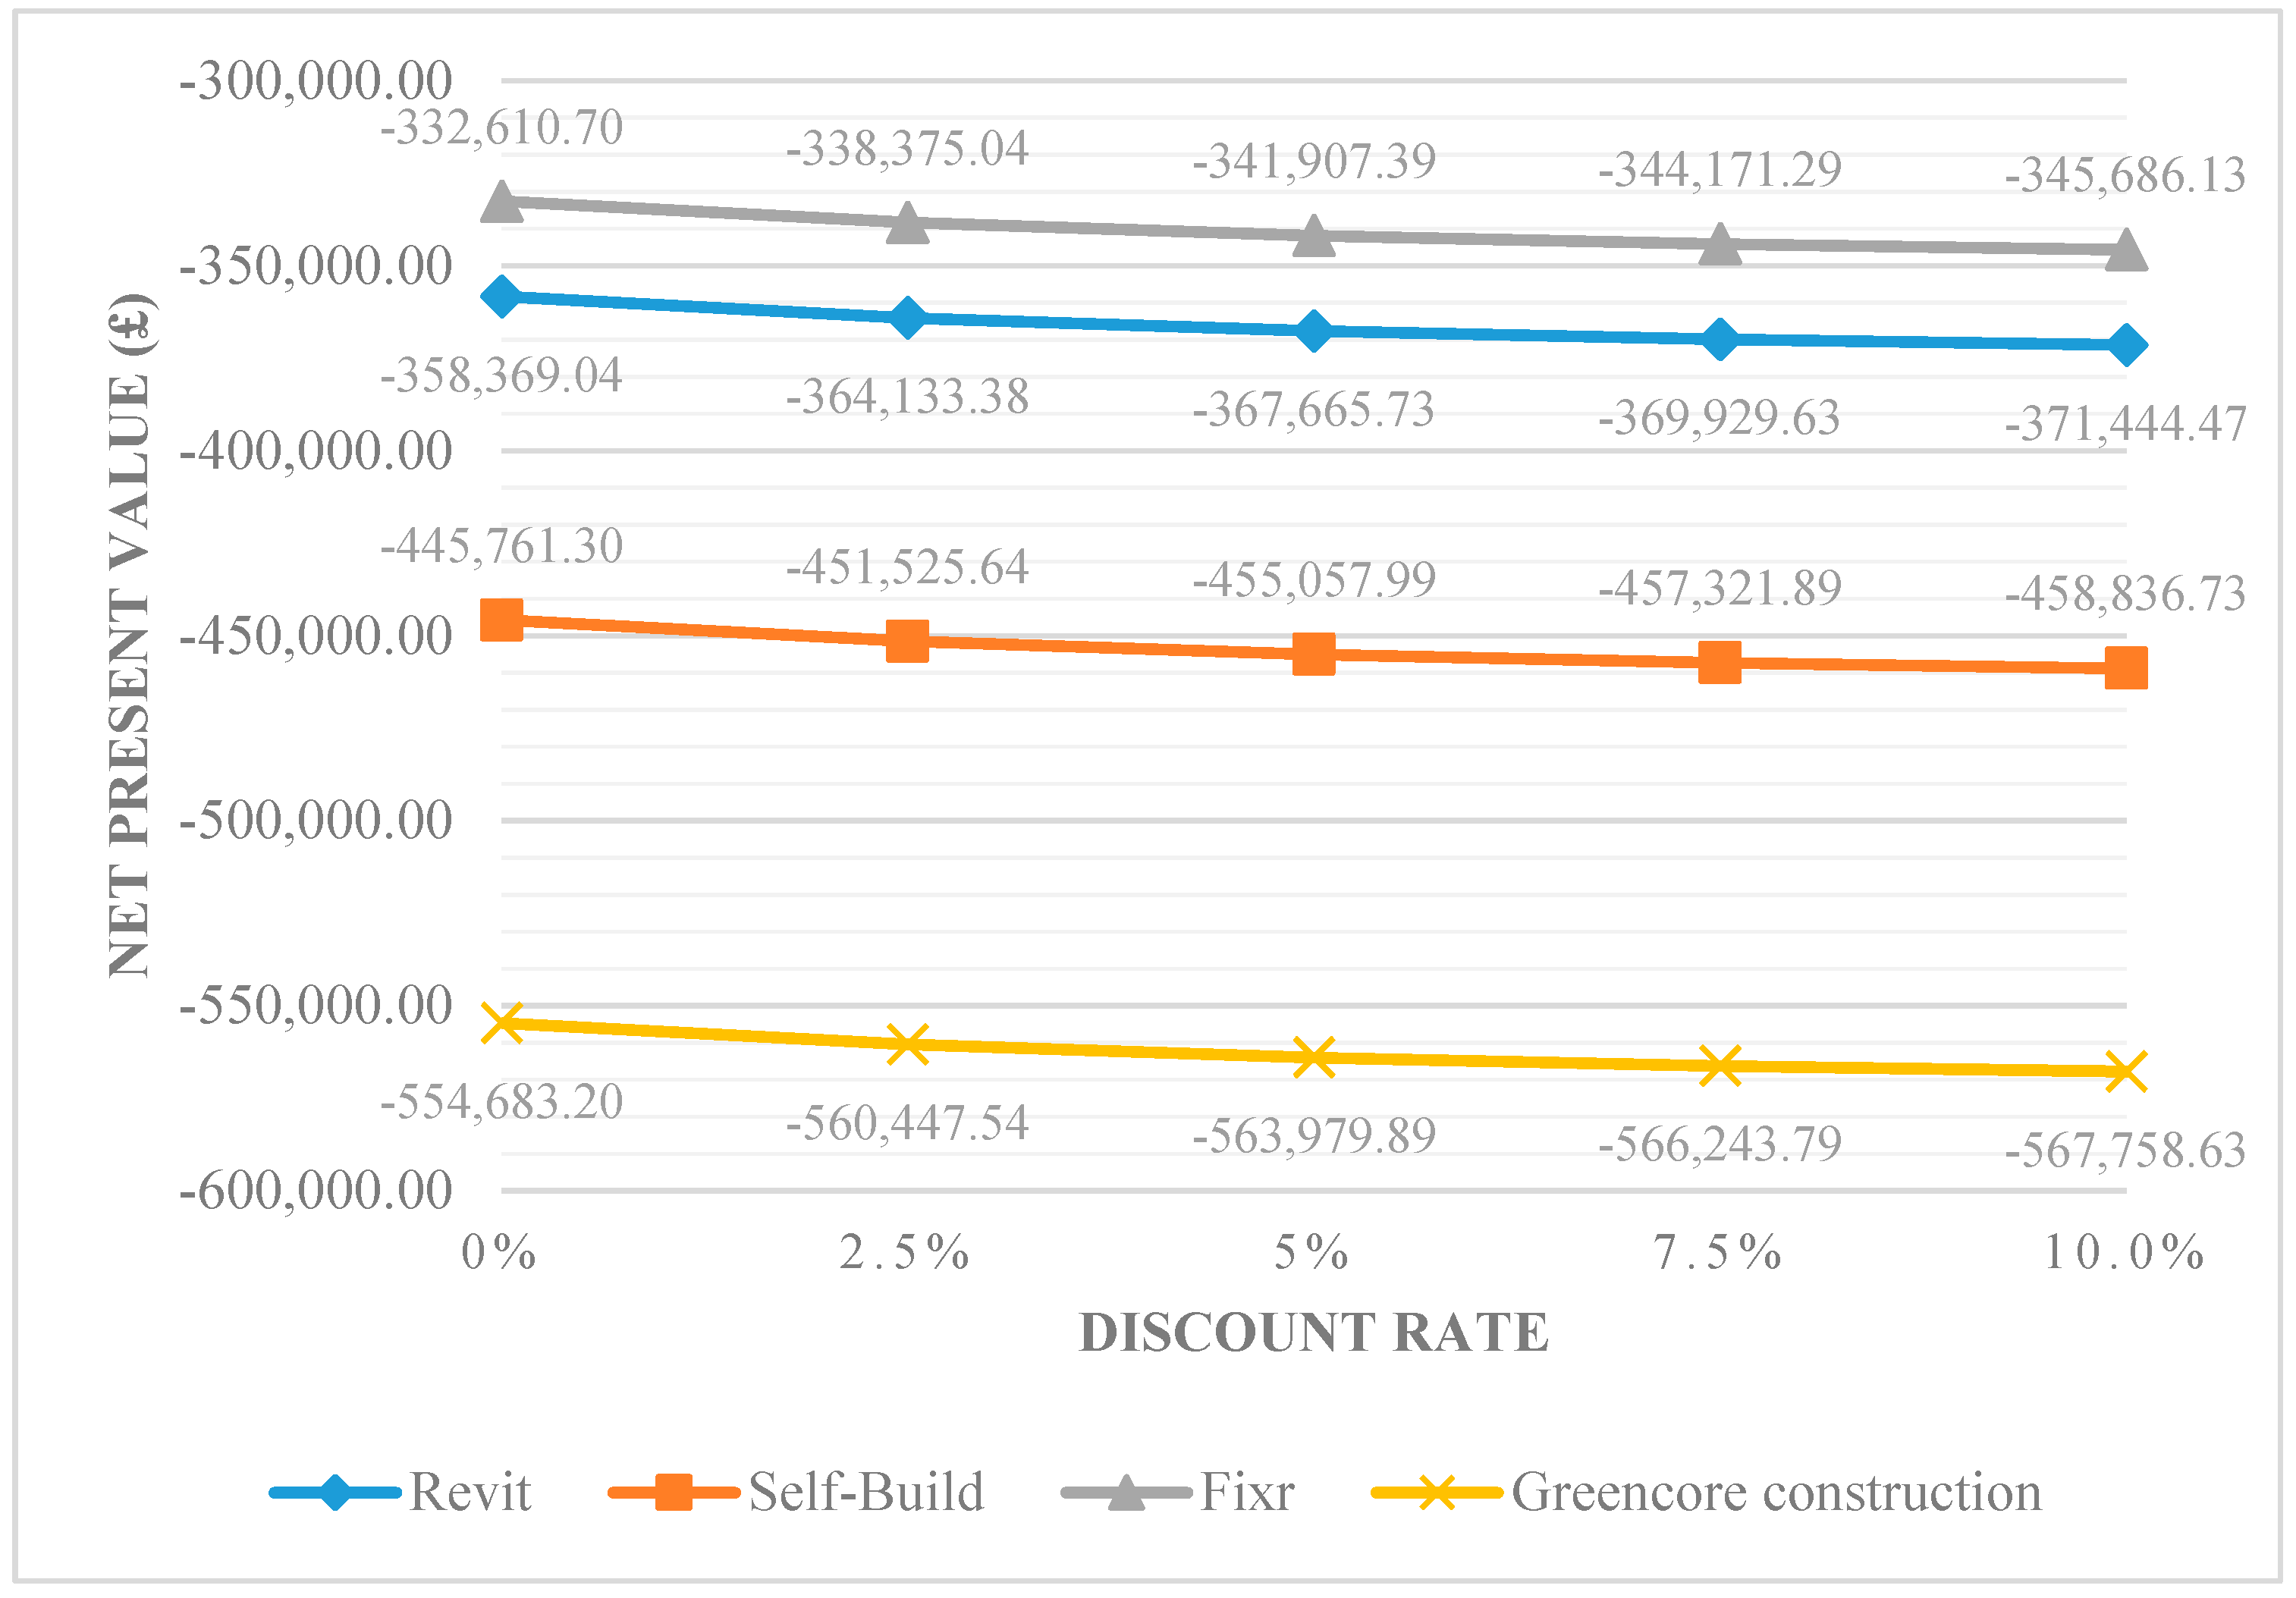
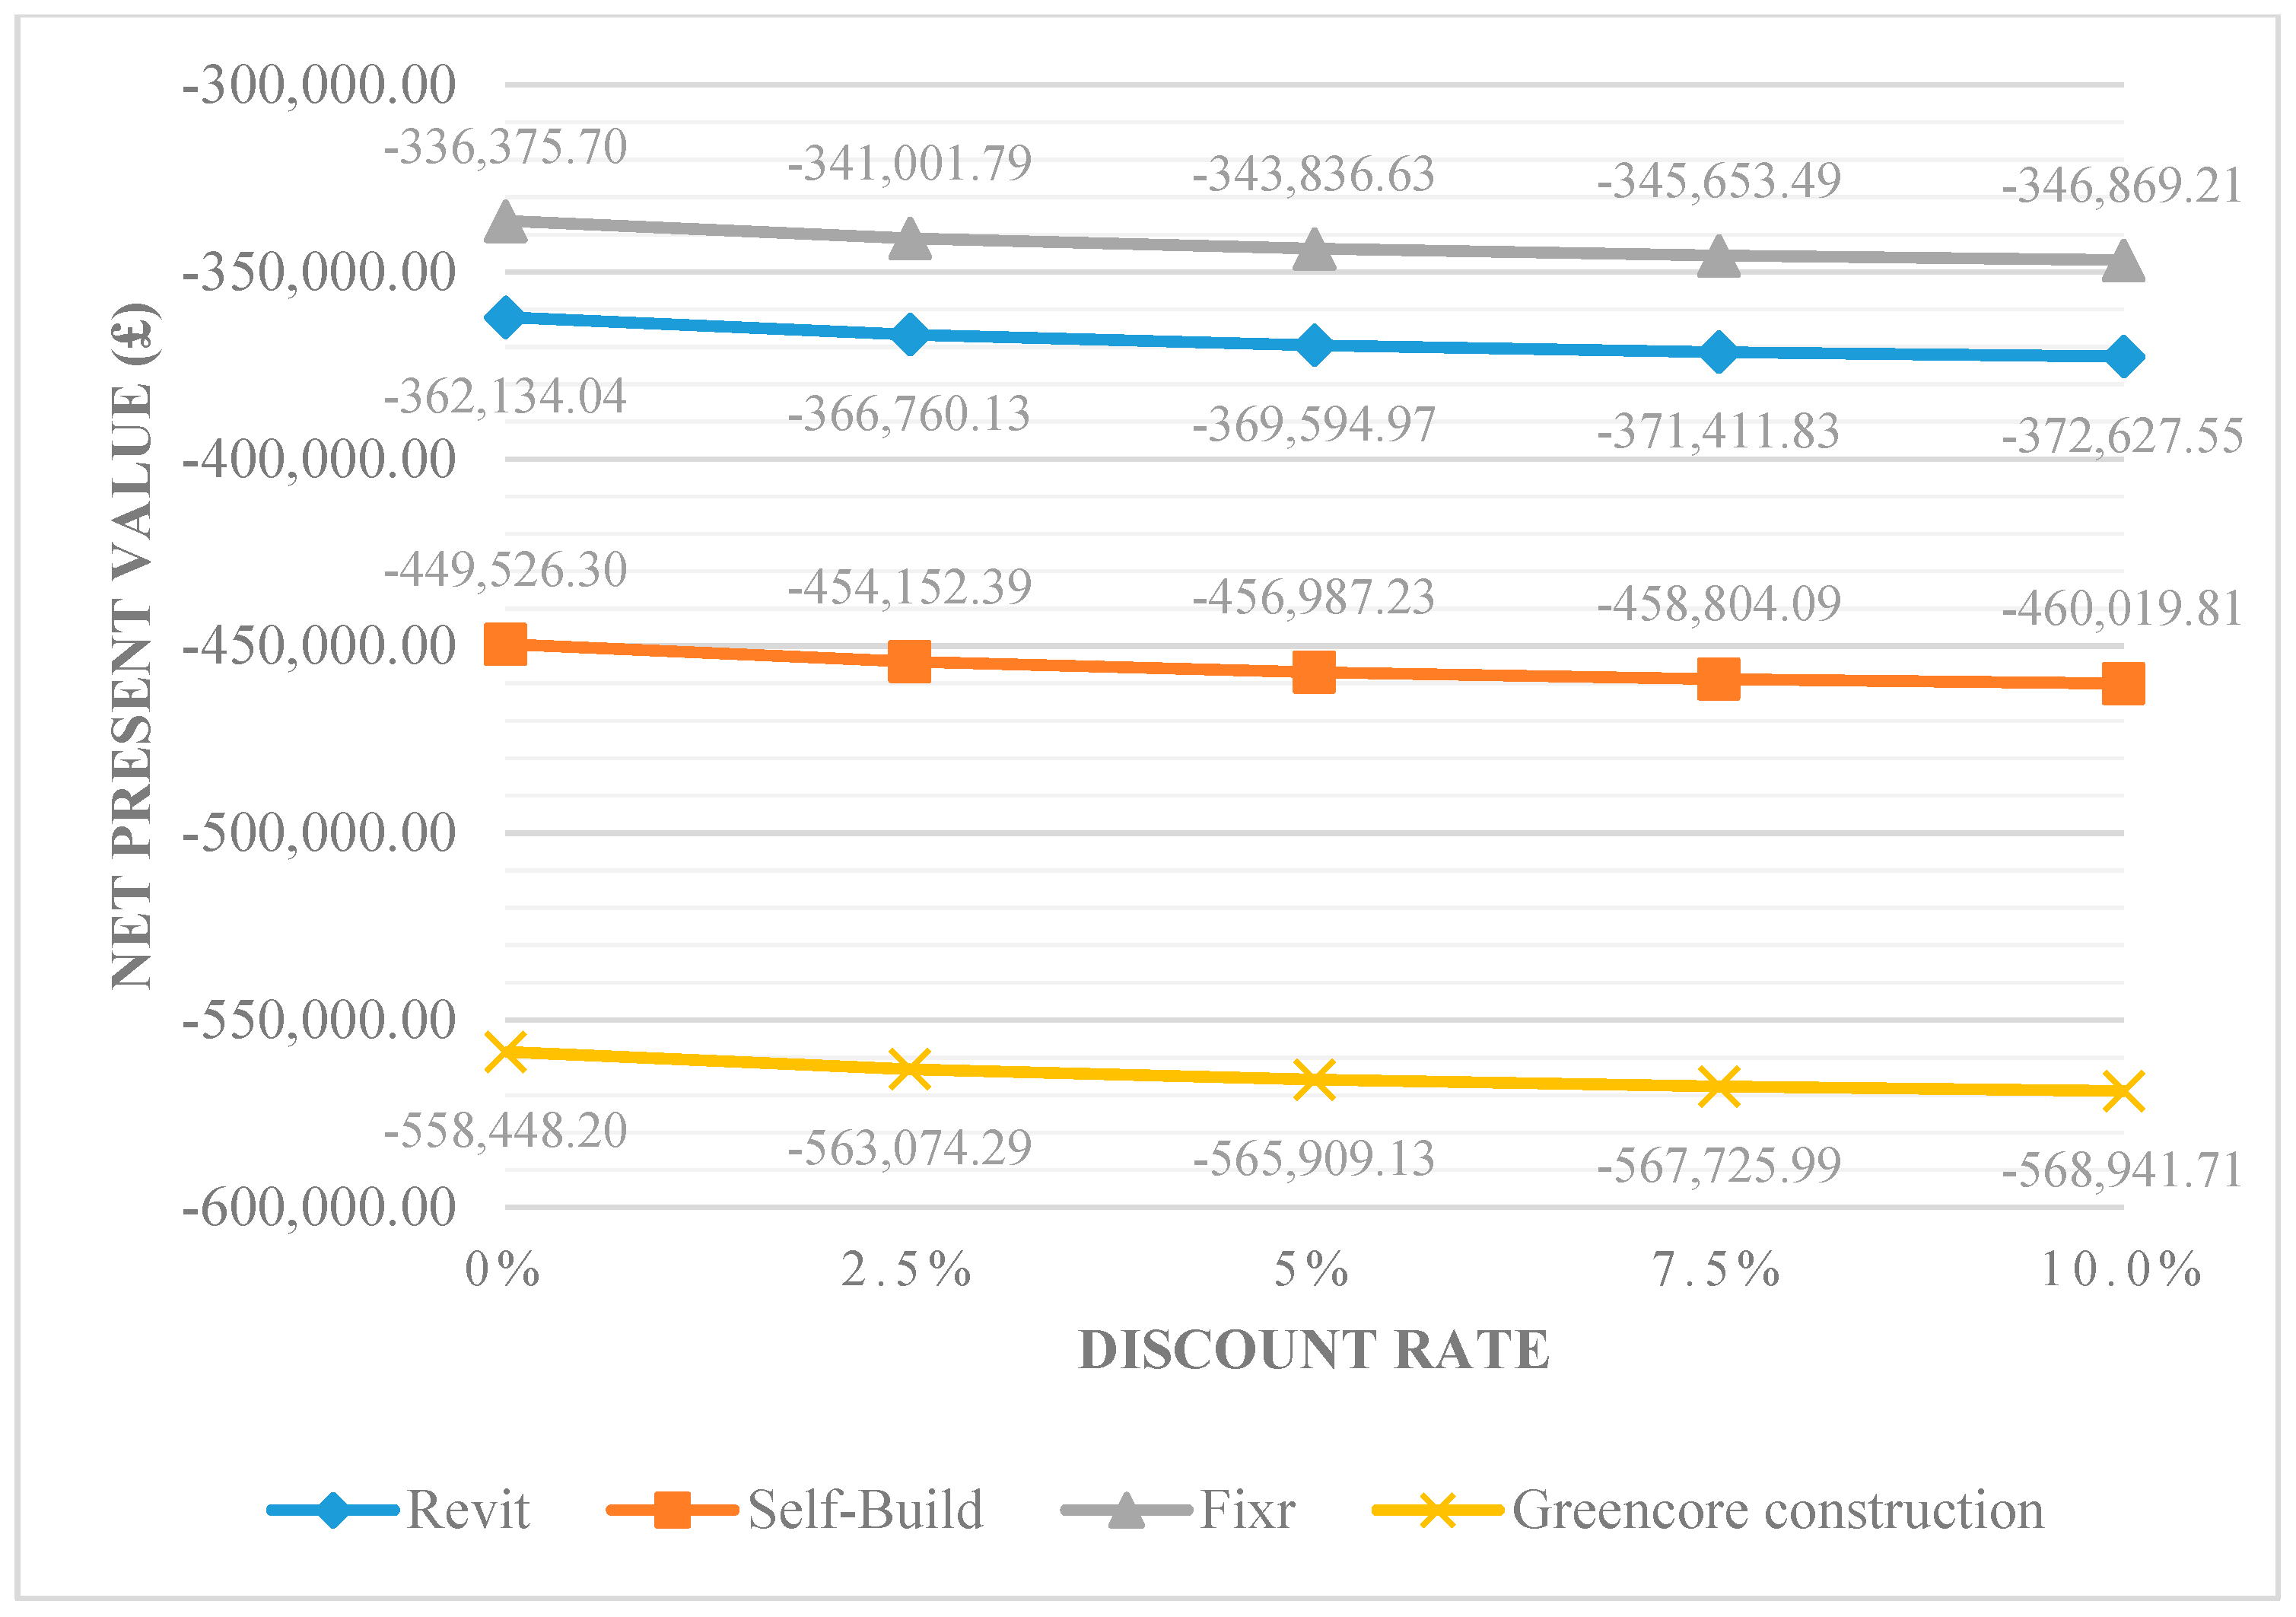
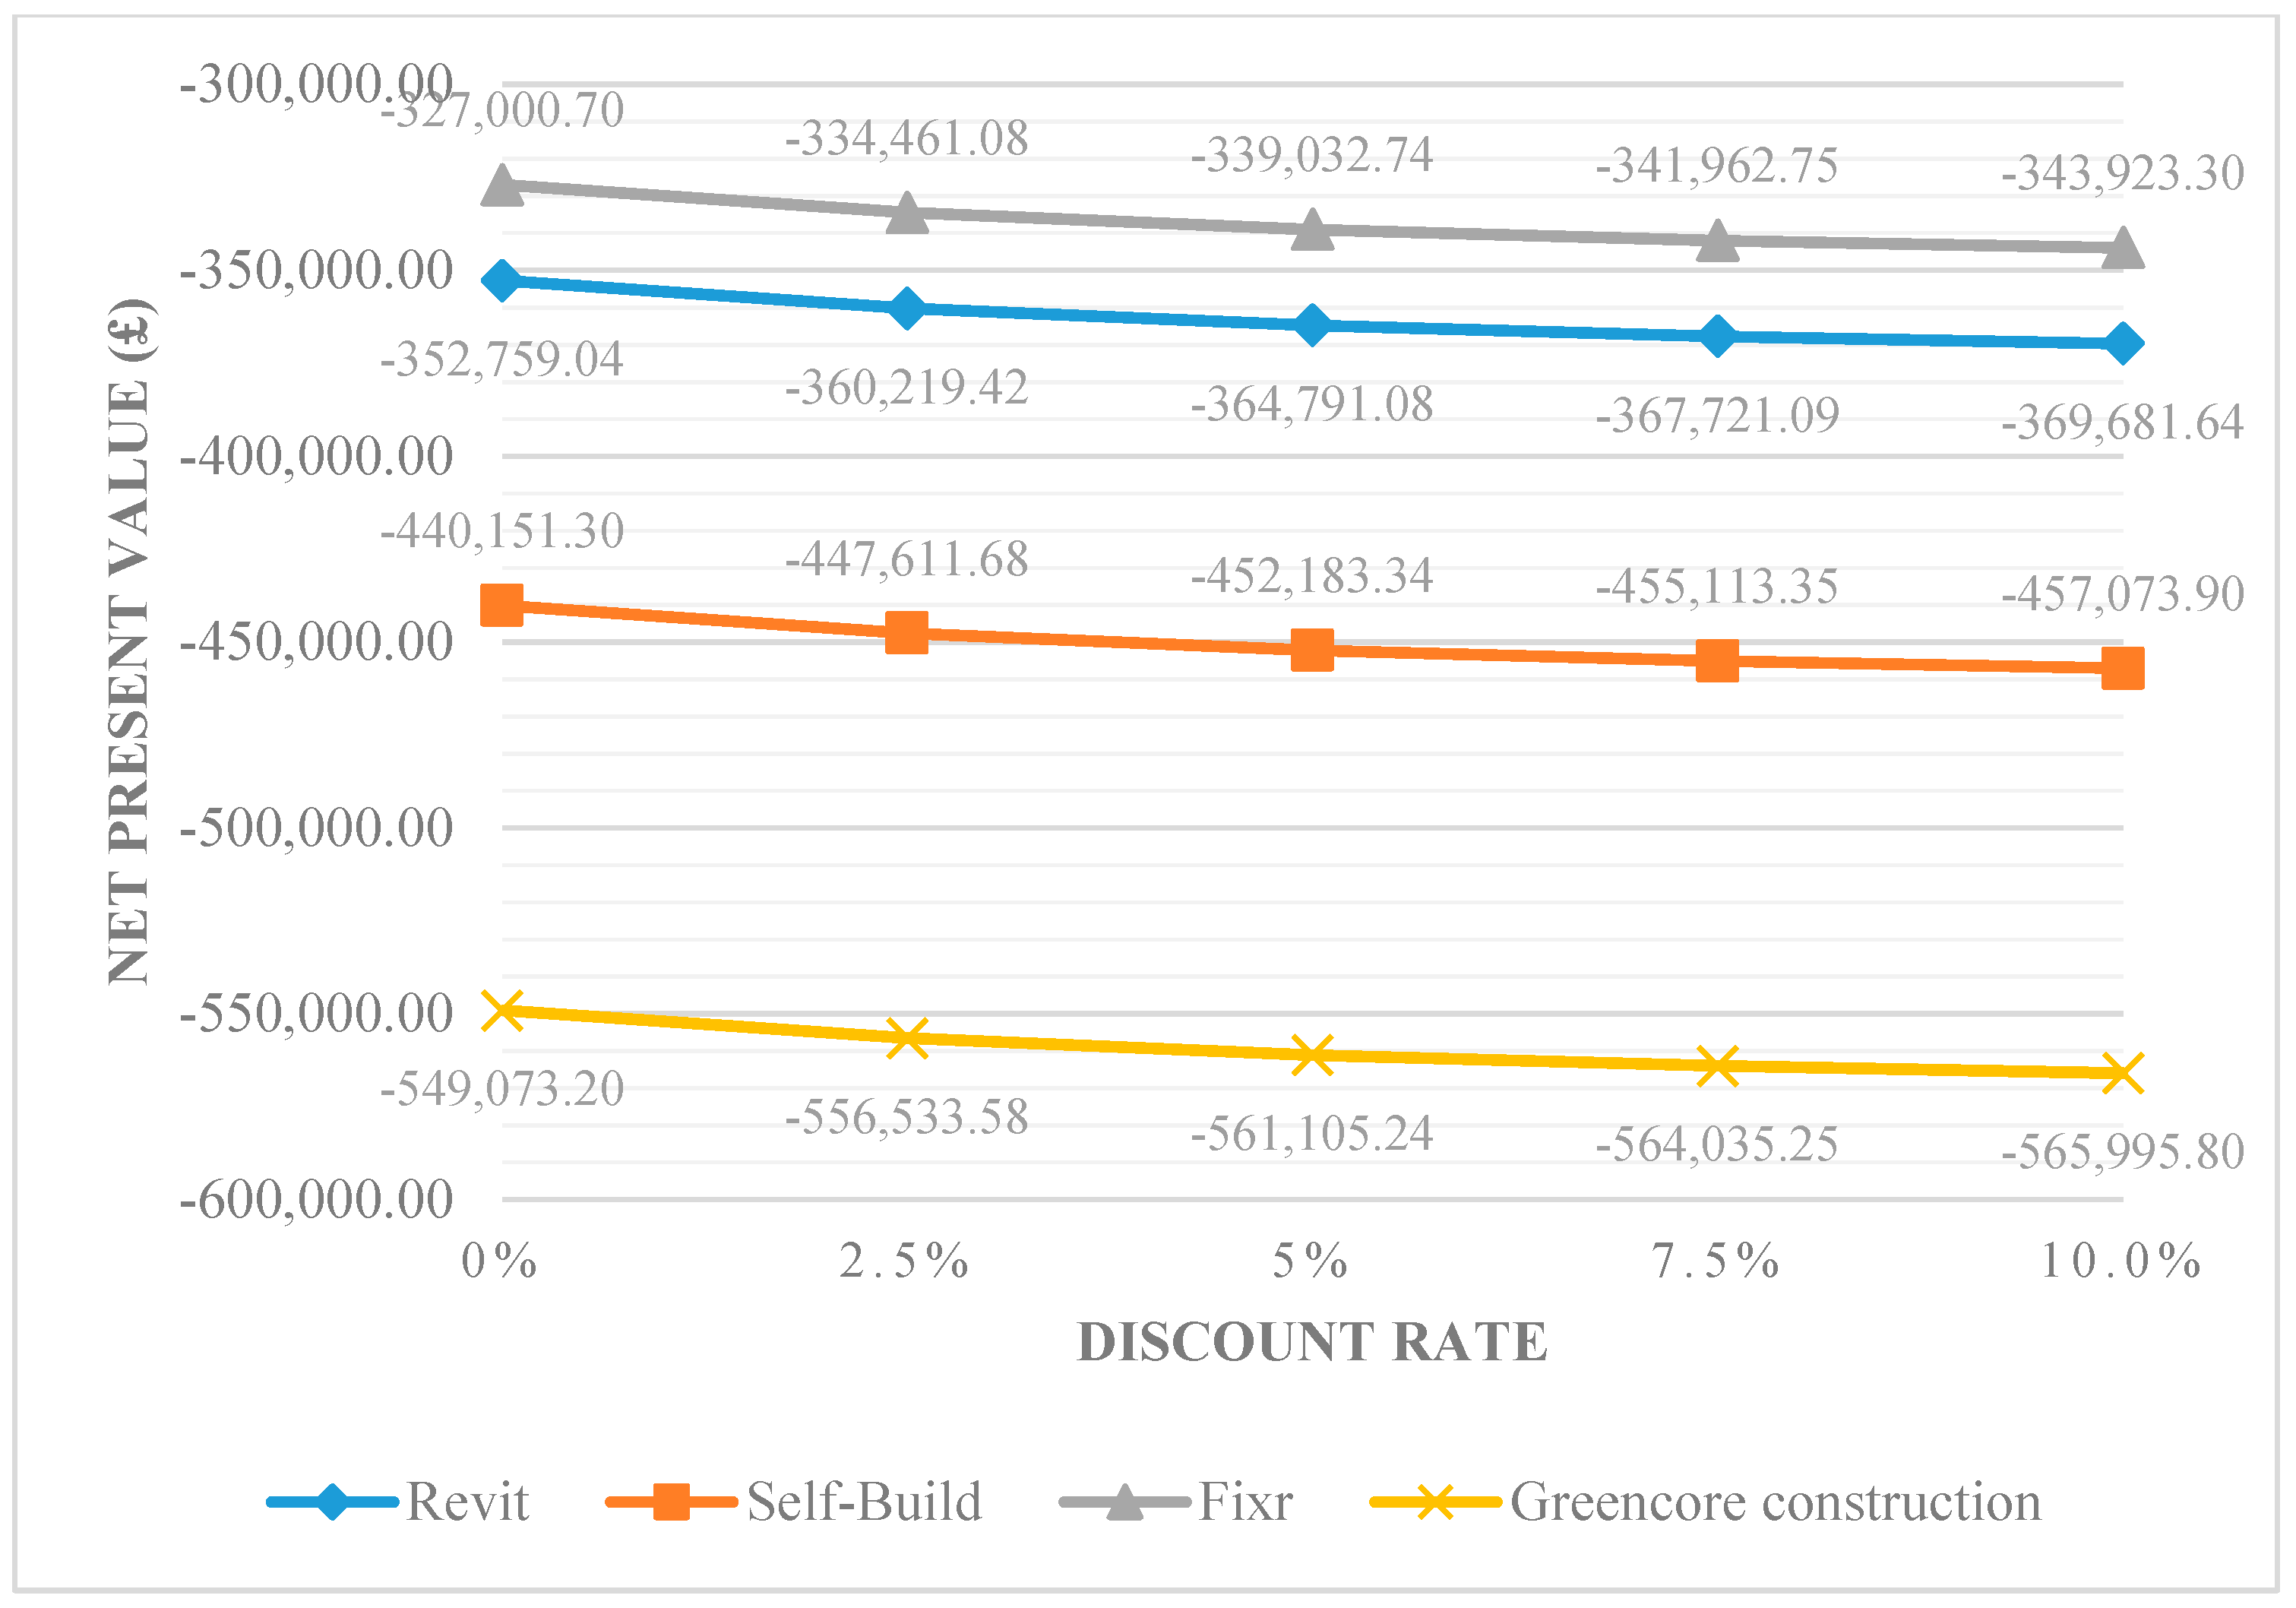
4.2. Cost of Reconstruction

Improvements to existing homes with greater energy efficiency may require many changes, which in addition to retrofitting may include whole building reconstruction. Choosing partial demolition of existing buildings may cost more than total demolition because contractors need to take the existing structures into account [35]. The cost of building construction depends on a variety of factors. In this study, there are four methods for calculating the cost of retrofitting and reconstruction—cost analysis in Revit software, cost estimation from Self-Build website, cost estimation from FIXR website, and cost estimation by Greencore construction.

4.2.1. Revit

From the models that are simulated in the Revit program, it is possible to know the detailed area of various elements of the building. In this study, the Revit program is used to calculate the cost of various elements, which in this case only mentioned the cost of reconstruction for the building envelope, but the total cost of all elements was assumed. The installation cost of the brick and block cavity walling varies between £105–180/m2 including materials and labour cost, making the total wall cost of this townhouse equal to £63,617.66. The roof installation cost varies between £40–300/m2 for different types of flat roof according to the Home Advice Guide [36], making the total roof cost of this townhouse equal to £11,315.30, including materials and labour cost. The installation cost for door will depend on the types of doors that are chosen, which vary between £60–146/m2 for the external doors and £250–450 per door for the internal doors [37]. The total cost of doors for this townhouse is approximately £8926. The cost of windows for the townhouse depends on the types of glazing that are used [38], that the triple glazed windows are chosen to use for this project. A triple glazed window costs £500 per piece including 75% materials cost and 25% labour cost [39], which means the total window cost of this townhouse is around £10,500. The total cost of the reconstruction of the building envelope is £94,358.96. Due to the limitations of the Revit program, it is not possible to calculate all details of the construction costs of all elements in this program, so information from Holmes M. [37] in order to estimate the full cost of this building. Holmes M. [37] used a pie chart that shows a breakdown of the costs including foundation, floor structure, superstructure, roof structure and cover, drainage, electrics, plumbing, heating internal carpentry include kitchen, plastering, decoration, tiling, flooring, and landscaping. The pie chart shows that 25–30% of the cost is from the superstructure, which can be assumed from the total of the building. This helps us to estimate that the total cost of this townhouse is approximately £377,435.84.

4.2.2. Self-Build Calculator

Self-Build is a website that provides a cost calculator for a house by filling in the details of the building, such as floor space, materials and design choice, interior fit-out and external works, and building route. After a calculation, the Self-Build [40] website estimated the total cost of this townhouse is £464,828.10.

4.2.3. FIXR Cost Guide

FIXR is a website that provides services a cost guide for several types of buildings. The cost of building a townhouse with two units, which includes material cost, labour cost, machine cost, and others, is approximately $125 USD/ft2 [41]. Based on an approximate estimate, this townhouse will have a new construction cost of $428,875 USD or around £351,677.5.

4.2.4. Greencore Construction

Pritchett, L. [42], who is Managing Director of Greencore Construction, provided the estimated cost of building a greenhouse including £100/m2 of pre-construction, £120/m2 of sub-structure, £450/m2 of superstructure, £280/m2 of external finishes, £500/m2 of services and fit-out, £100/m2 of external works, £170/m2 of prelims and £80/m2 of contingency. This made the total cost of greenhouse £1,800/m2 which translated to £573,750 for the townhouse using Pritchett’s [42] method.
Please be noted that the estimated costs from the previous four models are different because each estimates the cost by different assumption and background. For example, Revit does quantity take-off and calculates the cost by filling unit cost of the material, while Greencore construction estimates the cost by cost/area principle which is rougher. Moreover, the platforms that provide the cost estimation service have different background. For example, the Self-Build calculator and Greencore construction are based in the UK, but FIXR cost guide is based in the US, where the construction technology and related cost are different. Therefore, the estimated cost from these platforms are different. Moreover, the outcome costs from each model have different currency units. Although unit conversion can be done by the exchange rate, it will be more beneficial to demonstrate the original currency units because the exchange rate can change over time.
Net Present Value with 0–10% discount rates of four different methods to calculate cost of reconstruction are presented in Figure 3, Figure 4, and Figure 5 using the improved thermal efficiency townhouse rate, improved thermal efficiency (with increased thickness insulation) rate, and switchable window rate, respectively. The present values are calculated at 30 years with reduced energy cost £510.06, £635.56, and £822.56 per year respectively from the three rates mentioned before. The summarised Net Present Value which was calculated from reconstruction cost and reduced energy cost of each option can be shown as follows:

4.3. Renewable Energy Technology

4.3.1. Solar Panels

Roof-mounted solar panels, which would be able to provide energy consumption of 42,033.75 kWh/year or around 3500 kWh/month for this townhouse, is 30,195 Watt (30 kW) roof-mounted PV power systems (the produced amount is based on five sun hours per day, which Washington, DC is able to provide, except in winter). Unfortunately, this townhouse has 66.52 m2 of roof space, which does not have enough space for the 30,195 Watt (30KW) PV power systems, which require over 168 m2 of roof space [43], meaning other options such as ground-mounted solar panels are necessary. Therefore, a 30,000 Watt (30 kW) ground-mounted solar panel needs to be considered, which can produce 2400–4200 kWh per month, was chosen for this project, and the price of this technology is $41,695 USD, or around £33,356 [44].

4.3.2. Wind Turbine

Domestic wind turbines that are suitable for energy production of 42,033.75 kWh for this townhouse have a system size of 10 kW such as Ecovo 10 kW which produces 9.6 kW of rated power [45]. This wind turbine can support the cut-in wind speed of 2.5 m/s and the rated wind speed of 11 m/s or 5.6 mph and 24.6 mph, respectively. The average wind speed in Washington, DC ranges from 5.9 mph in August to 9.8 mph in February. The wind turbine 10 kW system generated an annual output of 21,500 kWh [46], which for this townhouse would require two turbines. The Renewable Energy Hub [46] provided £45,000 of system cost with 14 years and 11 months payback period and a 20-year income of £60,006.40.

5. Discussion

The first question this study sought to determine was the ways to manipulate an existing building to minimise the energy use intensity by changing building elements. This paper provided three models and an option of smart window technology. As mentioned in the literature review, a strong relationship between the thermal property of construction materials and energy use intensity has been reported. The previous research from Kaewunruen, Rungskunroch, and Welsh [3] showed that energy use and cost of improved thermal efficiency house can be reduced by 6.34% from standard house. In comparison with this paper, energy use and cost of an improved thermal efficiency townhouse can be reduced by 8.16% from original townhouse. This report illustrated the reduced energy use and cost as being slightly higher than in previous studies. Minor changes caused by the materials which were used for construction limited in thermal conductivity, which resulted in the overall EUI not being drastically reduced. This research also provided a third townhouse model that showed improving thermal efficiency concept and increasing thickness of the wall together can reduce annual energy use and cost by up to 10.16% from the original townhouse model. In addition to the townhouse simulation in the Revit software, this study also shows the possible decline of the annual energy use and cost due to the application of smart switchable windows for this building, which can reduce annual energy use and cost up to 14.65% from the original townhouse model.
The second question in this research was cost of reconstruction for the townhouse. This paper showed cost of reconstruction that is equal to £377,435.84, £464,828.10, £351,677.50, and £573,750 from four different methods. This paper also presented net present values with different discount rates and different cost of reconstruction, which have shown that the benefits from energy cost saving can cover only some part of the reconstruction cost. Although the net present value of every option is negative, the environmental impact benefits are not included in this study. Therefore, the overall net present value is improved. Moreover, renewable energy technologies are continuously being developed, which result in lower costs and better efficiency.
With respect to the third research question about renewable energy production, the previous research from Kaewunruen, Rungskunroch, and Welsh [3] considered three renewable energy technologies: photovoltaic panels, wind power, and biomass. However, Kaewunruen’s research found that the biomass system came with high costs for the building. Therefore, this paper only considers two approaches—the photovoltaic system (solar cell) and wind system (wind turbine). From the results of the use of renewable energy, this paper found that there have been some limitations for making the existing building into an NZEB. The main limitation for existing buildings is space, which may not be able to support on-site renewable technologies. However, the location of off-site renewable technologies should be nearby or not too far from the reference building, and it is necessary to calculate the energy loss that occurs during the route as well.

6. Conclusions

The aim of this study was to investigate the factors that can improve existing building performance. This paper presented three models with two solutions and one alternative option to improve energy efficiency and reduce the energy consumption of the townhouse. The three models were improving thermal efficiency, increasing the wall thickness, and installing smart windows (switchable windows). Those solutions can reduce energy and cost by approximately 8.16%, 10.16%, and 14.65%, respectively, from the original townhouse. From the values, it can be seen that increasing the wall thickness can improve the energy saving by 2.00%. At the same time, using switchable windows can reduce more energy by 1.66–4.99% from the improved thermal efficiency with increased thickness insulation. Although the better energy efficiency can reduce energy consumption and energy costs, the cost of reconstruction needs to be considered as well. Moreover, energy consumption will vary depending on the environment and use of the building. This study assumes that the building type is multi-family, so if the type of the building changes, energy consumption will also change, and recalculation is required. The results of this research support the idea that energy efficiency solutions can reduce energy demand of this townhouse, and the remaining energy is supplied by renewable energy technologies to achieve the Net Zero Energy Building goal.
The methods used for this townhouse may be applied to other existing townhouses or existing buildings. However, since the study was limited to the creation of a model, it is possible a new building models need to be created on a case-by-case basis to improve energy efficiency of each building, but they can still use the same concepts and methods to achieve the Net Zero Energy Building goal.
In order to achieve NZEB goal, energy supply must be equal of higher than energy demand. Although energy demand can be reduced by improving energy efficiency such as better building envelope or application of smart window, a renewable energy system needs to generate energy to supply the building. This is a crucial issue because different areas have different potential of renewable energy. Some areas may have limitations such as low intensity or low sunshine duration. Therefore, to achieve the NZEB goal, renewable technologies must be selected appropriately.
The recommended areas for further studies are as follows. First, in future investigations, it might be possible to add different functions of renewable technologies into the existing models and provide more financial analysis. Second, a simulation of new innovations or additional functions from existing models will help the analysis for the development approach to be more accurate. After that, to develop a full picture of a Net Zero Energy Building, additional studies will be needed on the integration of the building information model by calculating specific values in each specific program and integrating the data to make the results more accurate. Finally, further research should be undertaken to investigate Net Zero Energy Buildings that are larger or more complex. This may produce interesting results and could create benefits for the future urban planning, such as high-rise buildings, hospitals, schools, shopping centres, and transport hubs.

Author Contributions

Conceptualization, S.K. and L.K.; methodology, L.K.; software, L.K.; validation, L.K.; formal analysis, L.K.; investigation, L.K.; resources, S.K.; data curation, L.K. and J.S.; writing—original draft preparation, L.K.; writing—review and editing, J.S.; visualization, L.K.; supervision, S.K.; project administration, S.K.

Funding

This research was funded by the European Commission for the financial sponsorship of the H2020-MSCA-RISE Project No. 691135 “RISEN: Rail Infrastructure Systems Engineering Network”, which enables a global research network that tackles the grand challenge in railway infrastructure resilience and advanced sensing. The APC is sponsored by the University of Birmingham’s Open Access Fund.

Acknowledgments

The first author is grateful to the Australian Academy of Science (AAS) and Japan Society for the Promotion of Sciences (JSPS) for his JSPS Invitation Fellowship for Research (Long-term), Grant No. JSPS-L15701, at the Railway Technical Research Institute (RTRI) and the University of Tokyo, Japan. The second author gratefully appreciates the Royal Thai Government for his PhD scholarship. The authors are sincerely grateful to the European Commission for the financial sponsorship of the H2020-MSCA-RISE Project No. 691135 “RISEN: Rail Infrastructure Systems Engineering Network”, which enables a global research network that tackles the grand challenge in railway infrastructure resilience and advanced sensing [47].

Conflicts of Interest

The authors declare no conflict of interest.

References

  1. United Stated Environmental Protection Agency (EPA). Inventory of U.S. Greenhouse Gas Emissions and Sinks: 1990–2017; EPA: Washington, DC, USA, 2019. [Google Scholar]
  2. Hermelink, A.; Schimschar, S.; Boermans, T.; Pagliano, L.; Zangheri, P.; Armani, R.; Musall, E. Towards Nearly Zero-Energy Buildings Definition of Common Principles under the EPBD—Final Report. In Proceedings of the 2013 European Council for an Energy Efficient Economy, Brussels, Belgium, 14 February 2013; Volume 17. [Google Scholar]
  3. Kaewunruen, S.; Rungskunroch, P.; Welsh, J. A Digital-Twin Evaluation of Net Zero Energy Building for Existing Buildings. Sustainability 2018, 11, 159. [Google Scholar] [CrossRef]
  4. Torcellini, P.; Pless, S.; Deru, M.; Crawley, D. Zero Energy Buildings: A Critical Look at the Definition; No. NREL/CP-550-39833; National Renewable Energy Lab. (NREL): Golden, CO, USA, 2006.
  5. Sartori, I.; Napolitano, A.; Voss, K. Net zero energy buildings: A consistent definition framework. Energy Build. 2012, 48, 220–232. [Google Scholar] [CrossRef]
  6. Pacheco, R.; Ordóñez, J.; Martínez, G. Energy efficient design of building: A review. Renew. Sustain. Energy Rev. 2012, 16, 3559–3573. [Google Scholar] [CrossRef]
  7. Akadiri, P.; Chinyio, E.; Olomolaiye, P. Design of a Sustainable Building: A Conceptual Framework for Implementing Sustainability in the Building Sector. Buildings 2012, 2, 126–152. [Google Scholar] [CrossRef]
  8. De Berardinis, P.; Rotilio, M.; Capannolo, L. Energy and Sustainable Strategies in the renovation of existing buildings: An Italian Case Study. Sustainability 2017, 9, 1472. [Google Scholar] [CrossRef]
  9. Sierra-Pérez, J.; Rodríguez-Soria, B.; Boschmonart-Rives, J.; Gabarrell, X. Integrated life cycle assessment and thermodynamic simulation of a public building’s envelope renovation: Conventional vs. Passivhaus proposal. Appl. Energy 2018, 212, 1510–1521. [Google Scholar] [CrossRef]
  10. Aksamija, A. Regenerative Design of Existing Buildings for Net-Zero Energy Use. Procedia Eng. 2015, 118, 72–80. [Google Scholar] [CrossRef]
  11. Roos, A.; Karlsson, B. Optical and thermal characterization of multiple glazed windows with low U-values. Sol. Energy 1994, 52, 315–325. [Google Scholar] [CrossRef]
  12. González-Julián, E.; Xamán, J.; Moraga, N.; Chávez, Y.; Zavala-Guillén, I.; Simá, E. Annual thermal evaluation of a double pane window using glazing available in the Mexican market. Appl. Therm. Eng. 2018, 143, 100–111. [Google Scholar] [CrossRef]
  13. Sadooghi, P.; Kherani, N. Thermal analysis of triple and quadruple windows using partitioning radiant energy veils™ with different physical and optical properties. Sol. Energy 2018, 174, 1163–1168. [Google Scholar] [CrossRef]
  14. My Job Quote. Cost of Triple Glazed Windows: Triple Glazing Costs and Benefits. Available online: https://www.myjobquote.co.uk/costs/triple-glazed-windows (accessed on 29 July 2019).
  15. Commercial Buildings Energy Consumption Survey (CBECS). Consumption and Gross Energy Intensity by Census Region for Sum of Major Fuels for Non-Mall Buildings, 2003: Energy Information Administration. 2006. Available online: https://www.eia.gov/consumption/commercial/data/2003/pdf/c5.pdf (accessed on 29 July 2019).
  16. Commercial Buildings Energy Consumption Survey (CBECS). Consumption and Gross Energy Intensity by Census Region for Sum of Major Fuels for Non-Mall Buildings, 2012: Energy Information Administration. 2016. Available online: https://www.eia.gov/consumption/commercial/data/2012/c&e/pdf/c5.pdf (accessed on 29 July 2019).
  17. Energy Star. U.S. Energy Use Intensity by Property Type. 2018. Available online: https://portfoliomanager.energystar.gov/pdf/reference/US%20National%20Median%20Table.pdf (accessed on 29 July 2019).
  18. American Institute of Architects (AIA). Baseline and Goal Energy Use Intensity (EUI) for Whole Building Projects: U.S. National Average Site EUI. Available online: https://2030ddx.aia.org/helps/National%20Avg%20EUI (accessed on 20 July 2019).
  19. American Institute of Architects (AIA). An Architect’s Guide to Integrating Energy Modeling in The Design Process. 2012. Available online: http://content.aia.org/sites/default/files/2016-04/Energy-Modeling-Design-Process-Guide.pdf (accessed on 20 July 2019).
  20. Marszal, A.; Heiselberg, P.; Bourrelle, J.; Musall, E.; Voss, K.; Sartori, I.; Napolitano, A. Zero Energy Building–A review of definitions and calculation methodologies. Energy Build. 2011, 43, 971–979. [Google Scholar] [CrossRef]
  21. Chang, J.Y.; Kuan, Y.D.; Liou, S.S. Integration of renewable energy technology in building. Appl. Mech. Mater. 2011, 71, 2336–2340. [Google Scholar] [CrossRef]
  22. Chua, K.J.; Yang, W.M.; Wong, T.Z.; Ho, C.A. Integrating renewable energy technologies to support building trigeneration–A multi-criteria analysis. Renew. Energy 2012, 41, 358–367. [Google Scholar] [CrossRef]
  23. Li, L.P.; Fan, S. Comprehensive use of renewable energy in building. Adv. Mater. Res. 2013, 734, 1671–1674. [Google Scholar] [CrossRef]
  24. Visa, I.; Moldovan, M.D.; Comsit, M.; Duta, A. Improving the renewable energy mix in a building toward the nearly zero energy status. Energy Build. 2014, 68, 72–78. [Google Scholar] [CrossRef]
  25. Drafting Services. Construction Drawings-Residential Townhouse Remodel. Available online: https://www.draftingservices.com/construction-drawings.html (accessed on 20 July 2019).
  26. Academy Archistar. The Advantages and Disadvantages of Revit: Everything You Need to Know About the Revit BIM Software: Academy Archistar. 2019. Available online: https://academy.archistar.ai/the-advantages-and-disadvantages-of-revit (accessed on 29 July 2019).
  27. Autodesk Knowledge Network. Advanced Energy Settings Academy: Autodesk. 2019. Available online: https://knowledge.autodesk.com/support/revit-products/learn-explore/caas/CloudHelp/cloudhelp/2019/ENU/Revit-Analyze/files/GUID-24528ACB-E82C-410F-BEB7-24BDBA6D0769-htm.html (accessed on 20 July 2019).
  28. North-West University. Energy Efficiency in Building Thermal Systems. 2018. Available online: https://www.coursehero.com/file/32105923/Building-Energy-Auditing-Module-9-Finalpdf/ (accessed on 20 July 2019).
  29. UK Power. Gas & Electricity Tariff Prices per kWh. 2018. Available online: https://www.ukpower.co.uk/home_energy/tariffs-per-unit-kwh (accessed on 1 August 2019).
  30. Karlsson, J. Control system and energy saving potential for switchable windows. In Proceedings of the Seventh International IBPSA Conference, Rio de Janeiro, Brazil, 13–15 August 2001; pp. 199–206. [Google Scholar]
  31. Custom Weather. Climate & Weather Averages in Washington DC, USA. Annual Weather Averages Near Washington DC. 2019. Available online: https://www.timeanddate.com/weather/usa/washington-dc/climate (accessed on 5 August 2019).
  32. Custom Weather. Climate & Weather Averages in Stockholm, Sweden. Annual Weather Averages Near Stockholm. 2019. Available online: https://www.timeanddate.com/weather/sweden/stockholm/climate (accessed on 5 August 2019).
  33. Custom Weather. Climate & Weather Averages in Denver, Colorado, USA. Annual Weather Averages Near Denver. 2019. Available online: https://www.timeanddate.com/weather/usa/denver/climate (accessed on 5 August 2019).
  34. Custom Weather. Climate & Weather Averages in Miami, Florida, USA. Annual Weather Averages Near Miami. 2019. Available online: https://www.timeanddate.com/weather/usa/miami/climate (accessed on 5 August 2019).
  35. Fixr. House Demolition Cost. 2016. Available online: https://www.fixr.com/costs/house-demolition (accessed on 1 August 2019).
  36. Home Advice Guide. Flat Roof Cost-Flat Roof Repairs and Replacement Price. 2019. Available online: http://www.homeadviceguide.com/flat-roof-prices-how-much-will-it-cost/ (accessed on 1 August 2019).
  37. Holmes, M. How Much Does It Cost to Build a House? Discover How to Accurately Estimate How Much It Will Cost to Build Your Own Home, and How Different Factors Can Affect the Outcome. 2019. Available online: https://www.homebuilding.co.uk/the-ultimate-build-cost-guide/ (accessed on 1 August 2019).
  38. Huang, J.; Lv, H.; Gao, T.; Feng, W.; Chen, Y.; Zhou, T. Thermal properties optimization of envelope in energy-saving renovation of existing public buildings. Energy Build. 2014, 75, 504–510. [Google Scholar] [CrossRef]
  39. Household Quotes. How Much Does Triple Glazing Cost? 2019. Available online: https://householdquotes.co.uk/how-much-does-triple-glazing-cost (accessed on 1 August 2019).
  40. Self-Build. Self-Build Cost Calculator–House. 2019. Available online: https://www.self-build.co.uk/build-cost-calculator/build-cost-calculator-house-page/?loggedin=true#top-of-page (accessed on 1 August 2019).
  41. Fixr. Build A Townhouse Cost. 2016. Available online: https://www.fixr.com/costs/build-townhouse (accessed on 1 August 2019).
  42. Pritchett, L. The True Cost of Building a House: An Honest Guide to the Cost of Building Your Own Home on Your Own Land. 2017. Available online: https://www.greencoreconstruction.co.uk/wp-content/uploads/greencore_the-true-cost-of-building-a-house.pdf (accessed on 1 August 2019).
  43. Go Green Solar. 30195 Watt (30 kW) DIY Solar Install Kit with Solar Edge Inverter. 2019. Available online: https://www.gogreensolar.com/products/30000-watt-30kw-diy-solar-install-kit-w-solaredge-inverter (accessed on 11 August 2019).
  44. Go Green Solar. 30 kW (30000 W) Solar Panel Ground Mount Installation Kit. 2019. Available online: https://www.gogreensolar.com/products/30000-watt-30kw-solar-panel-ground-mount-installation-kit (accessed on 11 August 2019).
  45. Wind Turbine Models. Evoco 10 kW. Available online: https://en.wind-turbine-models.com/turbines/1606-evoco-10kw#models (accessed on 11 August 2019).
  46. The Renewable Energy Hub. How Much is a Wind Turbine Likely to Make Me and over What Period; How Much Profit Will I Make from a Wind Turbine. 2018. Available online: https://www.renewableenergyhub.co.uk/main/wind-turbines/how-much-is-a-wind-turbine-likely-to-make-me-and-over-what-period/ (accessed on 11 August 2019).
  47. Kaewunruen, S.; Sussman, J.M.; Matsumoto, A. Grand challenges in transportation and transit systems. Front. Built. Environ. 2016, 2, 4. [Google Scholar] [CrossRef] [Green Version]
Figure 1. R (heat resistance coefficient) and U (heat transfer coefficient, inverse of R) coefficients of original townhouse and the improved model of townhouse with improved thermal efficiency.
Sustainability 11 06631 g001
Figure 2. Average temperature of Stockholm, Denver, Miami, and Washington, DC in 1985–2015.
Sustainability 11 06631 g002
Figure 3. Net present value in different discount rates using the improved thermal efficiency townhouse rate.
Sustainability 11 06631 g003
Figure 4. Net present value in different discount rates using improved thermal efficiency with the increased thickness of insulation townhouse rate.
Sustainability 11 06631 g004
Figure 5. Net present value in different discount rates using the townhouse with switchable windows rate.
Sustainability 11 06631 g005
Table 1. Remaining energy and reduced energy of three townhouse models.
Townhouse ModelsEUI (kWh/m2/year)Remaining Energy (kWh/year)Reduced Energy (kWh/year)
Original154.549,246.88
Improved thermal efficiency141.945,230.634016.25
Improved thermal efficiency with increased thickness insulation138.844,242.505004.38
Table 2. Remaining energy, annual energy cost, and annual reduced energy cost of three townhouse models.
Townhouse ModelsEUI (kWh/m2/year)Remaining Energy (kWh/year)Annual Energy Cost (£)Annual Reduced Energy Cost (£)
Original154.549,246.886254.35
Improved thermal efficiency141.945,230.635744.29510.06
Improved thermal efficiency with increased thickness insulation138.844,242.505618.80635.56
Table 3. Annual reduced energy and remaining energy using switchable windows.
OptionsSaving (kWh/m2/year)Annual Reduced Energy (kWh)Remaining Energy (kWh/year)
Switchable window25736.2543,506.25
Switchable window752208.7542,033.75
Table 4. Properties of smart windows [30].
Identityg (%)U (W/m2 K)CategoryPanesTvis (%)
Smart 144/151.612 + 150/15
Smart 236/121.112 + 150/15

