Modeling and Prediction of the Uniformity of Spray Liquid Coverage from Flat Fan Spray Nozzles


1
Department of Applied Mathematics and Computer Science, University of Life Sciences in Lublin, 20-612 Lublin, Poland
2
Department of Machinery Exploitation and Management of Production Processes, University of Life Sciences in Lublin, 20-612 Lublin, Poland
*
Author to whom correspondence should be addressed.
Sustainability 2019, 11(23), 6716; https://0-doi-org.brum.beds.ac.uk/10.3390/su11236716
Submission received: 31 October 2019
/
Revised: 21 November 2019
/
Accepted: 23 November 2019
/
Published: 27 November 2019
(This article belongs to the Special Issue Sustainable Production in Food and Agriculture Engineering)
Abstract
:The effectiveness and quality of agricultural spraying largely depends on the technical efficiency of the nozzles installed in agricultural sprayers. The uniform spraying of plants results in a decrease in the amount of pesticides used in agricultural production and affects environmental safety. Both newly developed sprayers and those currently in use need quality control as well as an assessment of the performance of the spraying process, especially its uniformity. However, the models applied presently do not ensure accurate estimates or predictions of the spray liquid coverage uniformity of the treated surface. Generally, the distribution of the atomized liquid quantity is symmetrical and leptokurtic, which means that it does not fit well to the commonly used standard distribution. Therefore, there is a need to develop and design new tools for the evaluation, modeling, and prediction of such a process. The research problem studied in the present work was to find a new model for the distribution of atomized liquid quantity that could provide capabilities better than have been available so far to assess and predict the spraying process results. The research problem was solved through the formulation of a new function for the probability density distribution of sprayed liquid accumulation on the surface of the preset dimension size. The development of the new model was based on the results from a series of water atomization tests with an appropriate measurement device design based on the widely applied flat fan nozzles (AZ-MM type).
1. Introduction
Spraying liquids is a technically and technologically important process in all areas of economy and everyday life. Particular importance is ascribed to the correctness of the process and the application thereof in agricultural production and the food industry, taking into account the effect of the sprayed liquids on the environment. A fundamental issue in these processes is their quality and efficiency. They determine the requirements for the structure and the use of technical equipment and the parameters of spraying liquids in practical terms. Hence, the uniformity and predictability of the distribution of the sprayed liquid are the basic characteristics.
The quality of agricultural spraying largely depends on the uniformity of the distribution of the sprayed liquid over the spraying surface. In field crops, currently slot nozzles are the most commonly used, which wear out during exploitation. A worn nozzle causes the amount of liquid flowing out to be greater and, thus, the uniformity of liquid distribution is disturbed. The current Directive 2009/128EC of the European Parliament and of the Control concerning the sustainable use of pesticides in agriculture contains guidelines regarding, among others, the testing of spray nozzles installed in agricultural sprayers [1]. In field sprayers, the even parameter is the even distribution of sprayed liquid on the sprayed surface. Specialized devices with a grooved table are used to measure the uniformity of spray distribution [2,3].
The stream of the sprayed liquid has the shape of a cone with characteristics depending on the design of the nozzle and the geometry of its working slot, which is subject to wear and can therefore change its shape due to mechanical damage or limescale deposition. Another consequence of nozzle wear is also the change in flow rate.
Field spraying is an example of the use of the liquid spraying process. One of the key issues in this process is the uniformity of the liquid amount distribution achieved from the spray boom.
The coefficient of variation is a measure of the process uniformity expressed (usually in percentages) as the ratio of the standard deviation to the arithmetic mean of the sample. This parameter is used most commonly for the comparison of the variation of a trait in two different distributions.
In the case of field spraying, its value should not exceed 10%, as specified by the EN ISO 16119-2 part 2 standard [4].
When the level defined in the standard is not exceeded, the spray uniformity is regarded to be correct. Its level is mainly determined by the shape of the distribution of the amount of liquid sprayed from a single nozzle, based on which spray boom is constructed. Distribution data from a single nozzle is replicated to simulate a complete virtual boom.
Manufacturers strive to improve the sprayer structure to ensure the best uniformity of surface coverage.
The field sprayer boom that will be equipped in such nozzles should provide the greatest uniformity of the treated surface spray, i.e., it should be characterized by the minimum value of the coefficient of variation for the sprayed liquid. To date, there has been no model ensuring a relatively low value of the coefficient of variation of liquid coverage from a virtual field boom containing all the same new nozzles and, hence, a very high uniformity of spraying. Similarly, there is no model that would satisfactorily determine the amounts of accumulated liquid allowing the achievement of the permissible value of the coefficient of variation defined by the standard.
Therefore, there is a need to propose a new model that will substantially increase the level of liquid spray uniformity from the spray boom, which will result in the improvement of the spray quality.
An analysis of liquid sprayed from a single nozzle and a sprayer in terms of the distribution characteristics has been carried out [5].
To ensure the most optimal spray, in [6,7,8], the impact of the sprayer and nozzle parameters on the spray distribution and on the coefficient of variation, which is a measure of the uniformity of treated surface coverage, was analyzed. Various types of nozzles have been tested in laboratory conditions to analyze this parameter [9].
The simulation of a virtual field boom illustrating the work of the sprayer with the analysis of spray uniformity has been carried out [10].
A review of various distribution patterns and spray coverage achieved by some nozzles has been presented [11].
Mathematical models describing the physical motion of a sprayed liquid particle [12] and presenting the wear of flat fan nozzles [13] have been developed. In [14], as well as [15], the impact of an external air stream simulating the wind with varied velocity on the distribution of sprayed liquid has been analyzed. It has compared the patterns of liquid distributions and the values of the coefficient of variation after the spraying process in experiments conducted on tables with 5 cm and 10 cm groove spacing [16].
The scope of the research in the present work is to find a new model for the distribution of atomized liquid quantity thanks to which better capabilities than have been available so far to assess and predict the spraying process results could be provided. Achieving this aim will help to increase environmental efficiency in agriculture.
2. Materials and Methods
2.1. Description of the Experiment
To obtain data for the development and verification of the new model, the experiments were conducted in the Laboratory of Techniques for Application of Agrochemicals, Department of Machinery Exploitation and Management of Production Processes, University of Life Sciences in Lublin.
It was assumed that mounting new nozzles of good quality to the spray boom would ensure the most uniform spray distribution.
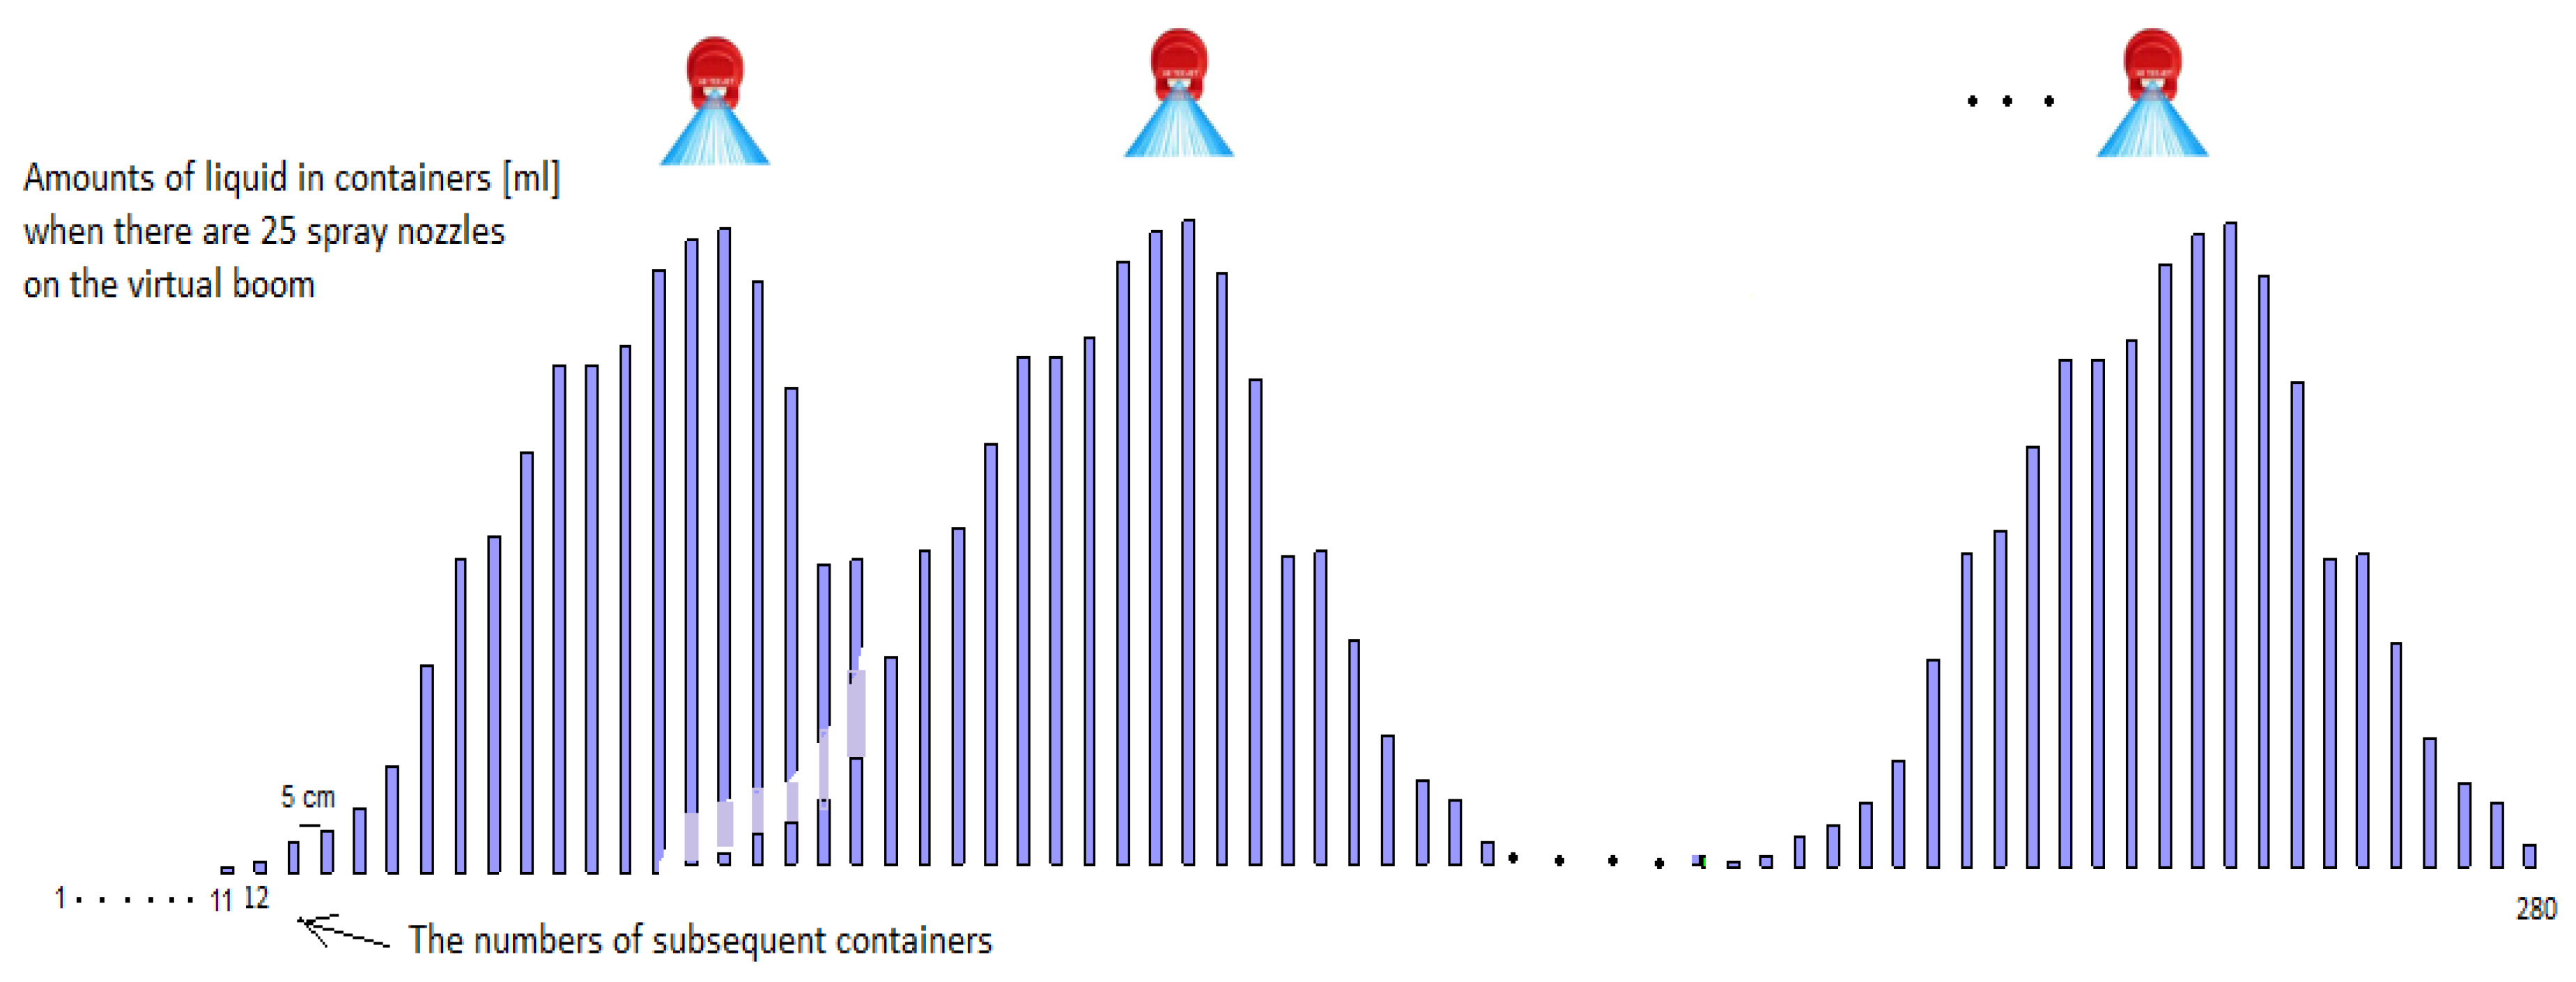
Typically, the working spray boom was located at a height of 0.5 m above the sprayed surface. The liquid outflow pressure was set at 0.3 MPa. The process time was preset to one minute. The spray angle of the flat fan nozzles was set at 110°. In this case, the width of the area sprayed with a single sprayer nozzle was approx. 1.5 m, and the surface coverage of all 25 nozzles mounted on the virtual boom was approx. 12.5 m.
The tests and measurements were carried out on grooved tables with a width corresponding to that of the virtual field boom. Two types of flat fan nozzles were included in the study. The results obtained from AZ-MM spray nozzles were used for the development of the model. The goodness of the fit of the model to the data was evaluated based on results obtained from RS-MM spray nozzles.
Fifty new nozzles were used in the experiment.
The tests were carried out using the blue nozzles, characterized by a liquid flow rate of 1.2 liters per minute.
Water was used as the test liquid, following the standard practice for this type of experiment conducted in laboratory conditions.
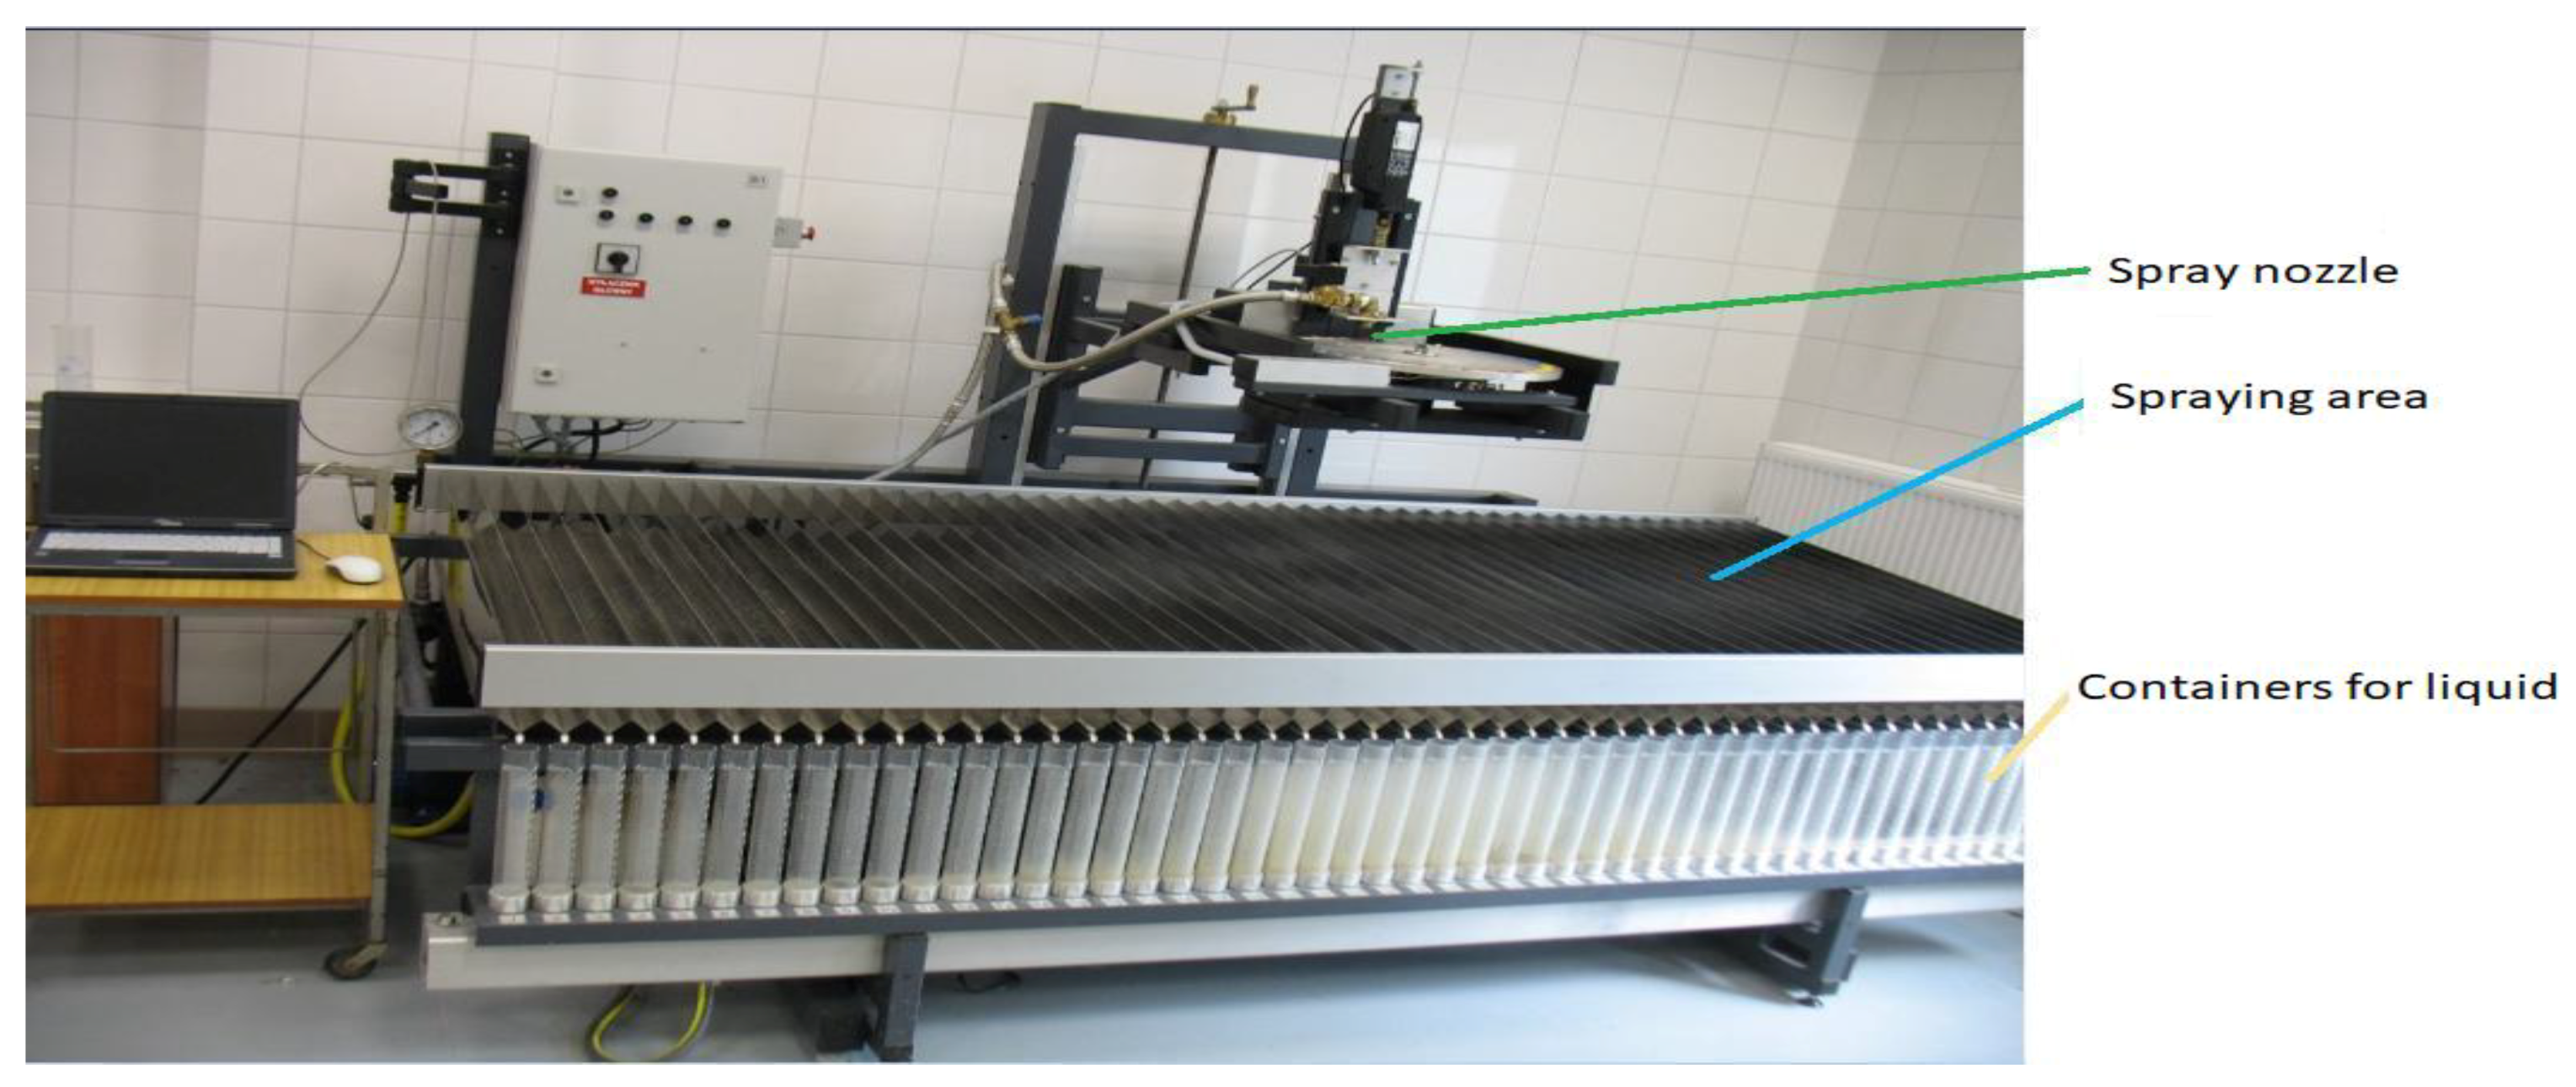
The experimental measurement stand shown in Figure 1 facilitated the analysis of the distribution of the atomized liquid sprayed from the nozzle. The results obtained in this design were used for the construction of a virtual field boom. The sprayed liquid reaches the table and falls along the grooves into 50 containers with the same volume arranged serially at equal distances from each other. Each measurement determines the amount of the liquid accumulated in the consecutive containers and is expressed in milliliters. The capacity of a single container is 250 ml. All experiments were carried out on the measurement stand with 5 cm groove spacing.
With the parameters determined during the experimental process, the spray spectrum for a single nozzle covered approximately 30 containers located in the center of the measurement table. Hence, 0 mL value was in the 10 containers located on the left-hand side and 0 mL value was in the 10 containers located on the right side of the analyzed spectrum area.
The data used in the experiment were the results provided by all 50 available nozzles (25 of each type used for the development and verification of the model) included in the measurement stand. This yielded 50 different data sets. Each of these sprays duplicated 25 times simulated the data generated by the virtual spray boom as described below.
The width of the sprayed area was scaled to an appropriate number of the consecutively numbered containers located at an identical distance as on the measurement table. Distribution data from a single nozzle was replicated to simulate a complete virtual boom.
- The nozzle was located on the extreme left of the virtual field boom;
- Next, another identical nozzle was placed on the boom on the right side of the first one at a distance of 0.5 m (i.e., at a distance covered by 10 containers to the right);
- By mounting successive identical nozzles on the boom, the 25th container was reached (Figure 2). The total range of measurements comprised 270 containers. The amounts of the liquid collected in each container served for the calculation of the coefficient of variation.
In 50 measurement series performed in the experiment, data from 50 virtual field sprayer booms, created from single nozzle distribution, were collected. Each boom was assigned the same number as that of each consecutive nozzle with a specified degree of wear.
Within the adopted scope of work, we carried out a comprehensive statistical analysis of the distribution of the liquid amounts determined for each simulated virtual field boom and for the real data from each single nozzle.
2.2. Distribution of Droplets after the Spraying Process
The first attempts to match the distribution of droplets to the real sprays provided by flat fan nozzles were undertaken [17,18]. The researchers considered a triangular pattern. The effect of changes in the sprayer nozzle angle on the symmetry and shift of spray distribution was emphasized [17]. The density function of the triangular distribution is described by an equation that combines the nozzle height, the set angle, and the distance between water-sensitive papers:
where:
- is the distance between water-sensitive papers [m];
- is the distance between the spray nozzle and the sprayed surface [m];
- is the distance between the ith water-sensitive paper and the nozzle [m];
- is the preset angle of the nozzle spray [°].
Another probability distribution that was analyzed in the description of spray was beta distribution [18]. It is defined by two shape parameters denoted as α and β, which are the exponents of a random variable in the formula and determine the shape of the distribution. The density function of this distribution is as follows:
where:
is a random variable specifying the distance between two water-sensitive papers [m];
are shape parameters estimated from the experimental data;
= is the special gamma function for .
Joint research was conducted on this distribution and found that it was sometimes more suitable for the description of spray than the normal distribution [5].
This most popular distribution mentioned above was fitted and applied in comprehensive investigations of spray [19]. The issue was divided by the researchers into two stages. The first stage consisted of the selection of an appropriate model and density function, whereas the second stage was focused on the estimation of parameters determining the spray quality, i.e., pressure and nozzle height and size. Given the basic fact that the function of spray distribution density is a symmetrical curve with an approximate bell shape, the distribution of sprayed liquid was effectively fitted to the doubly truncated normal distribution [19]. This indicates that the values of the random variable had upper and lower limits determined by a certain value. The form of the probability density function f(x) in this case is as follows:
where:
is a random variable specifying the distance between two water-sensitive papers [m];
is the expected value of the random variable;
is the standard deviation for normal distribution;
is the cumulative distribution function that complies with ;
are the lower and upper cut-off points of normal distribution, respectively.
After the development of the model presented above, a relationship was discovered between its parameters and factors that influence spraying [19]. By the application of the multiple regression equation, the researchers were able to express the standard deviation and spray width with the coefficients of determination of 0.98 and 0.976, respectively:
where:
is the standard deviation [cm];
is the spray width [cm];
is the nozzle height [cm];
is the spray pressure [105 Pa];
is the standard flow rate at a pressure of 0.2 MPa [l/min].
Another model [20] is the so-called mean distribution model. It consists of the calculation of the mean values for the parameters of the distribution of liquid amounts collected from several single nozzles. This approach generates highly precise results, but at the cost of a substantially greater number of measurements. Additionally, since different types of nozzles are often used, this will very likely be a random model.
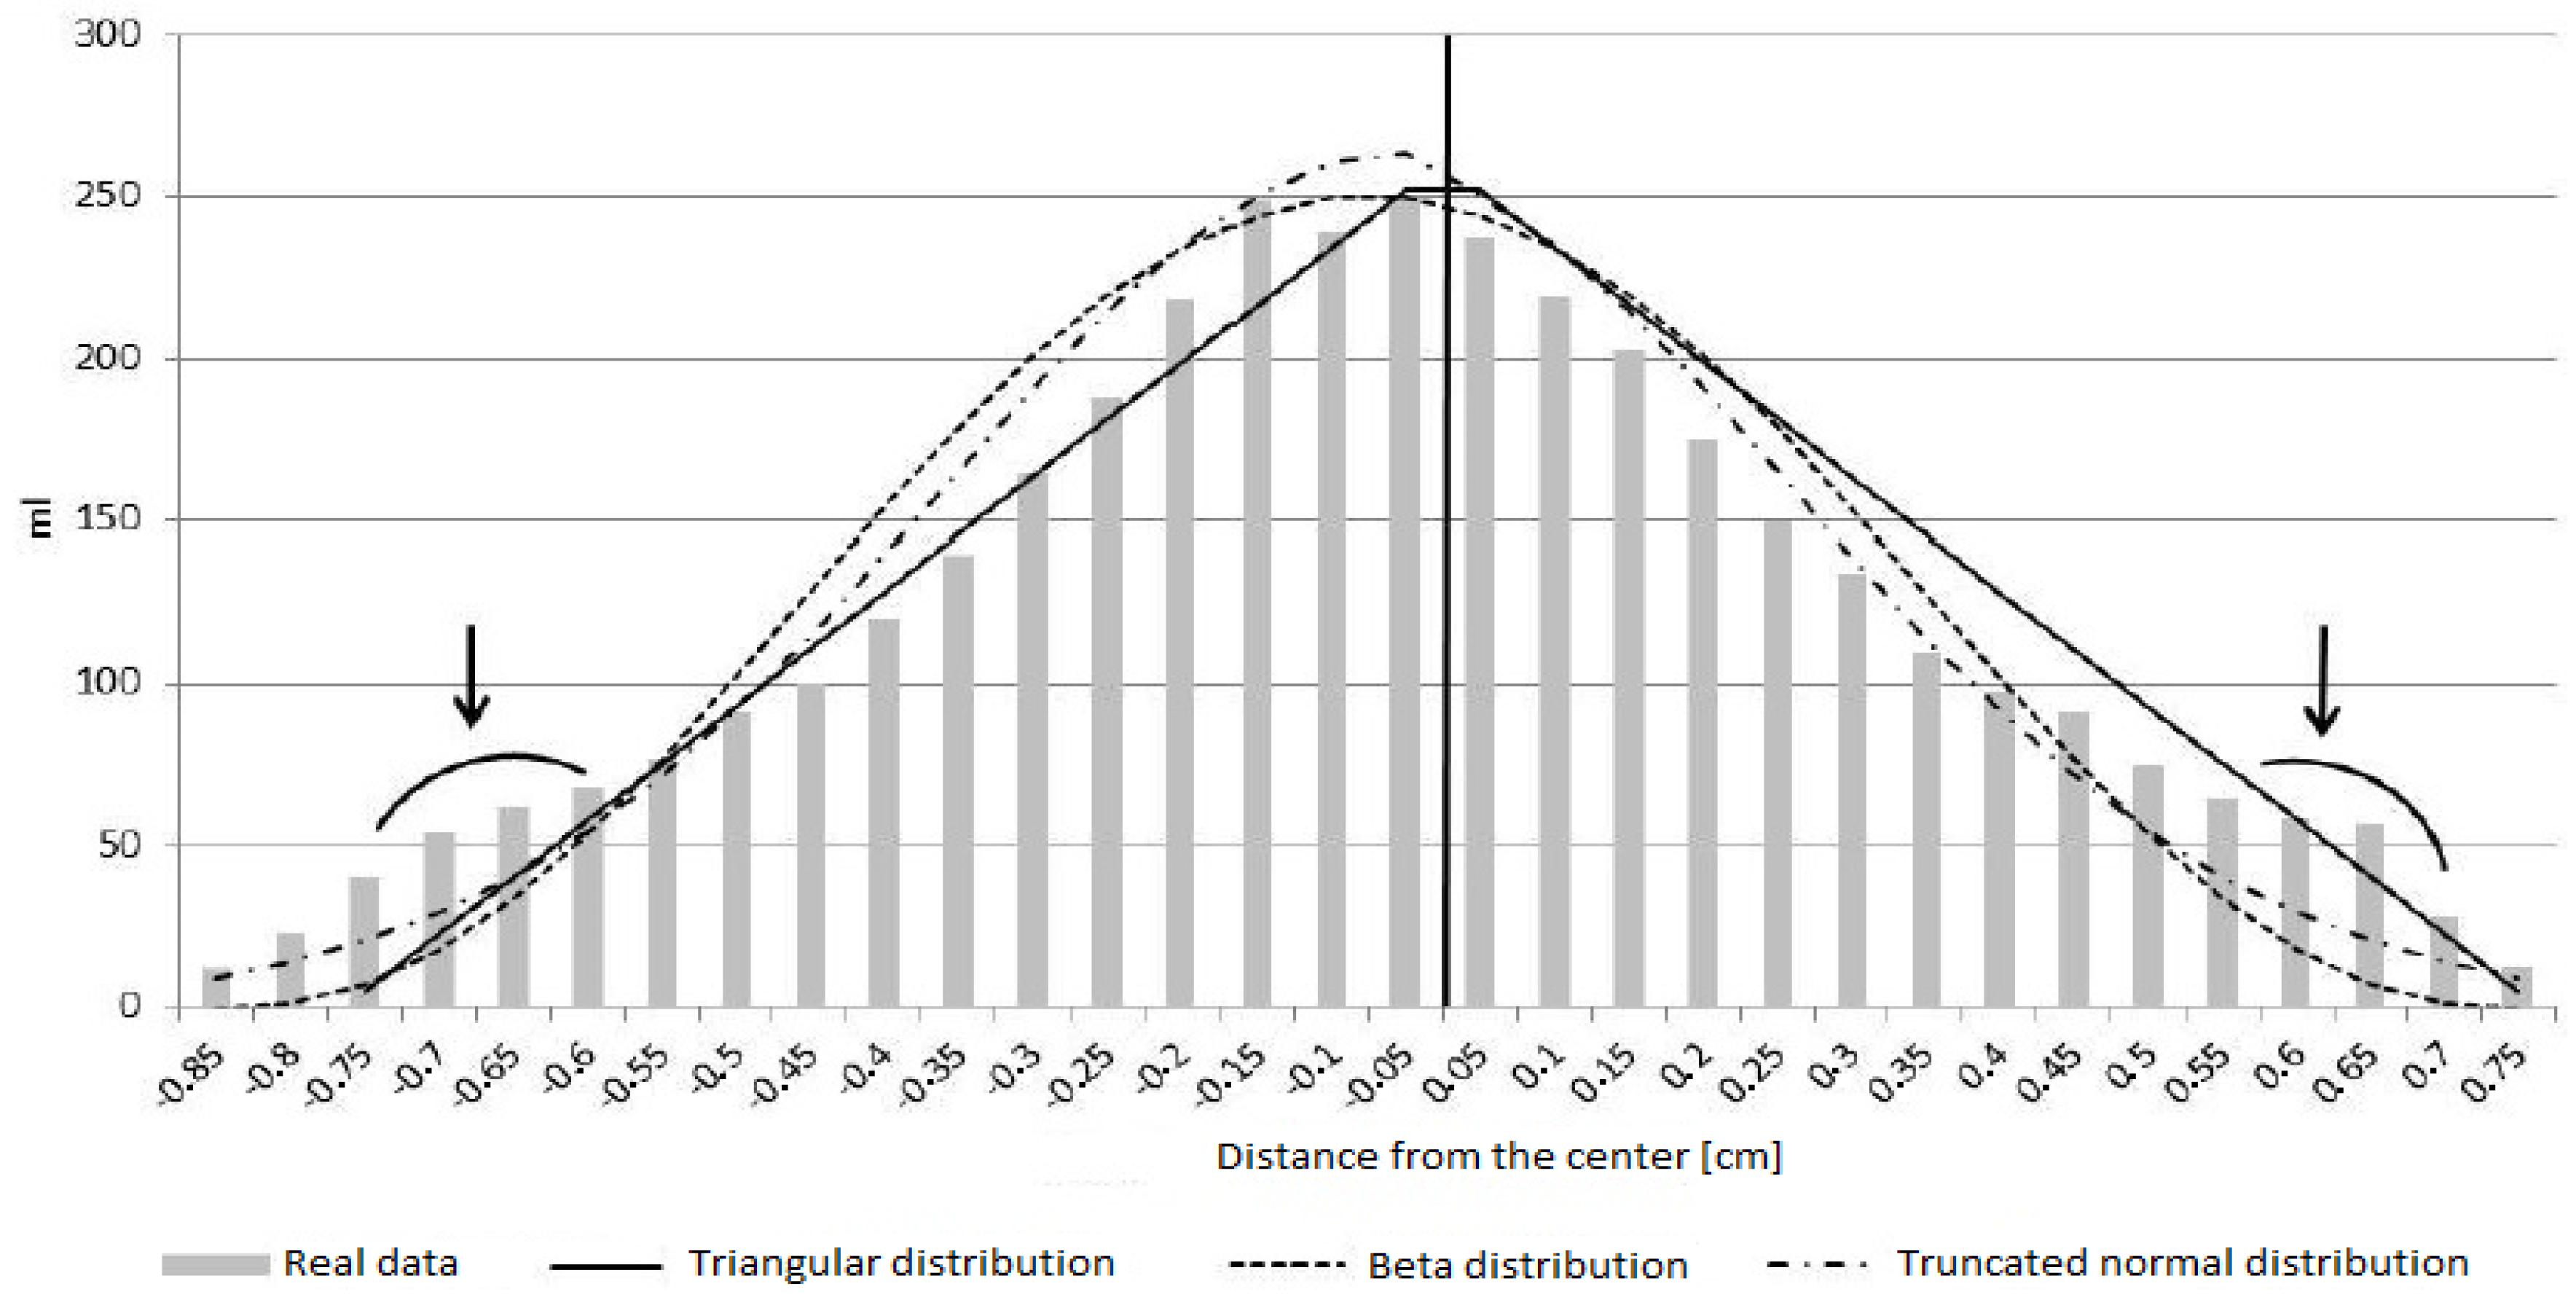
Figure 3 shows a comparison of the consistency of the data obtained from triangular, beta, and normal distributions with the measurement results generated by a Teejet 110 04 VS nozzle at a pressure of 0.2 MPa and a spray height of 0.5 m [21].
An evident conclusion prompted by the analysis of this figure is the fact that none of the characterized models generate results that match real data adequately.
2.3. Development of a New Model of Liquid amount Distribution
Based on the determinants and data presented in the previous subsection, an original density function of a new distribution model describing the accumulation of liquid amounts after the spraying process was defined for a single nozzle as follows:
where:
is the real variable with values from the spray range (0.5; 2) [m];
is a shape parameter;
is a shape parameter;
is a shift parameter;
are shape parameters ( = natural number, = even number)
By increasing the values of parameters a, p, or q, the shape of the density curve becomes leptokurtic (thin). Reversely, i.e., when the values of any of the three parameters decrease, the shape becomes more flattened.
The opposite is noted in the case of parameter b, i.e., the higher its value, the greater the flattening of the curve in an appropriate range.
The method for the construction of the density function presented above ensures symmetry of distribution. The new model is symmetrical and is a probability density function.
Using the optimization method, i.e., the Microsoft Excel Solvers tool, the shape of parameters , , and was selected in a way providing a properly set value of the coefficient of variation for the liquid amount after the spraying process.
After the determination of equations required for the correct determination of the probability distribution for a single nozzle, an original model was developed for the determination of the liquid distribution after simultaneous spraying with 25 nozzles in order to reflect the real work of the sprayer.
Therefore, based on the developed form of the density function, a function reflecting the amount of the liquid at any point in the spray area was defined:
The arguments of the function are points across the entire width of the sprayed area located at a distance of 0.05 m from each other.
The total width of the area sprayed by the boom is identical to that of all liquid-collecting containers aligned and assigned numbers from 1 to 290. According to ISO 16122-2: 2015 (E), the data range taken into account in the calculation of the coefficient of variation of the sprayed liquid distribution includes the amounts of liquid collected in containers located in the center of the spray area width for the second nozzle mounted on the boom to the center of the spray area width for the penultimate nozzle on the boom. Therefore, the sum range in Equation (6) corresponds to containers 36 to 256.
Based on the method of calculation of the coefficient of variation, the function dependent on all parameters a, b, c, p, and q is defined with the following formula:
where the following equations are valid for i representing natural numbers and denoting the consecutive numbers of the liquid-accumulating containers after the spraying process:
and and are the mean and standard deviation, respectively, for the values of function .
Next, all parameters of the probability distribution were selected for function V to reach the minimum, i.e., to simulate the work of a field boom equipped with the new (model) nozzles, thus providing the most uniform spray of the treated surface, assuming values of 5%, 7%, and 10%, and simulating the work of a field boom with nozzles characterized with an adequate wear degree.
The flow rate in all nozzles was fixed and the extension of the spray swath from virtual boom sprayer could be unlimited, because any number of nozzles may be added.
If we consider the case that the spacing of the grooves on the measurement table is 5 cm, then in the model we have, a = 15.352; b = −2.024; c = 1.23 for p = 3, q = 2, and V = 10%.
On the over hand, if we consider that the spacing of the grooves on the measurement table is 10 cm, then in the model we have, a = 14.87; b = −2.55; c = 1.259 for p = 3, q = 2, and V = 10%.
3. Results
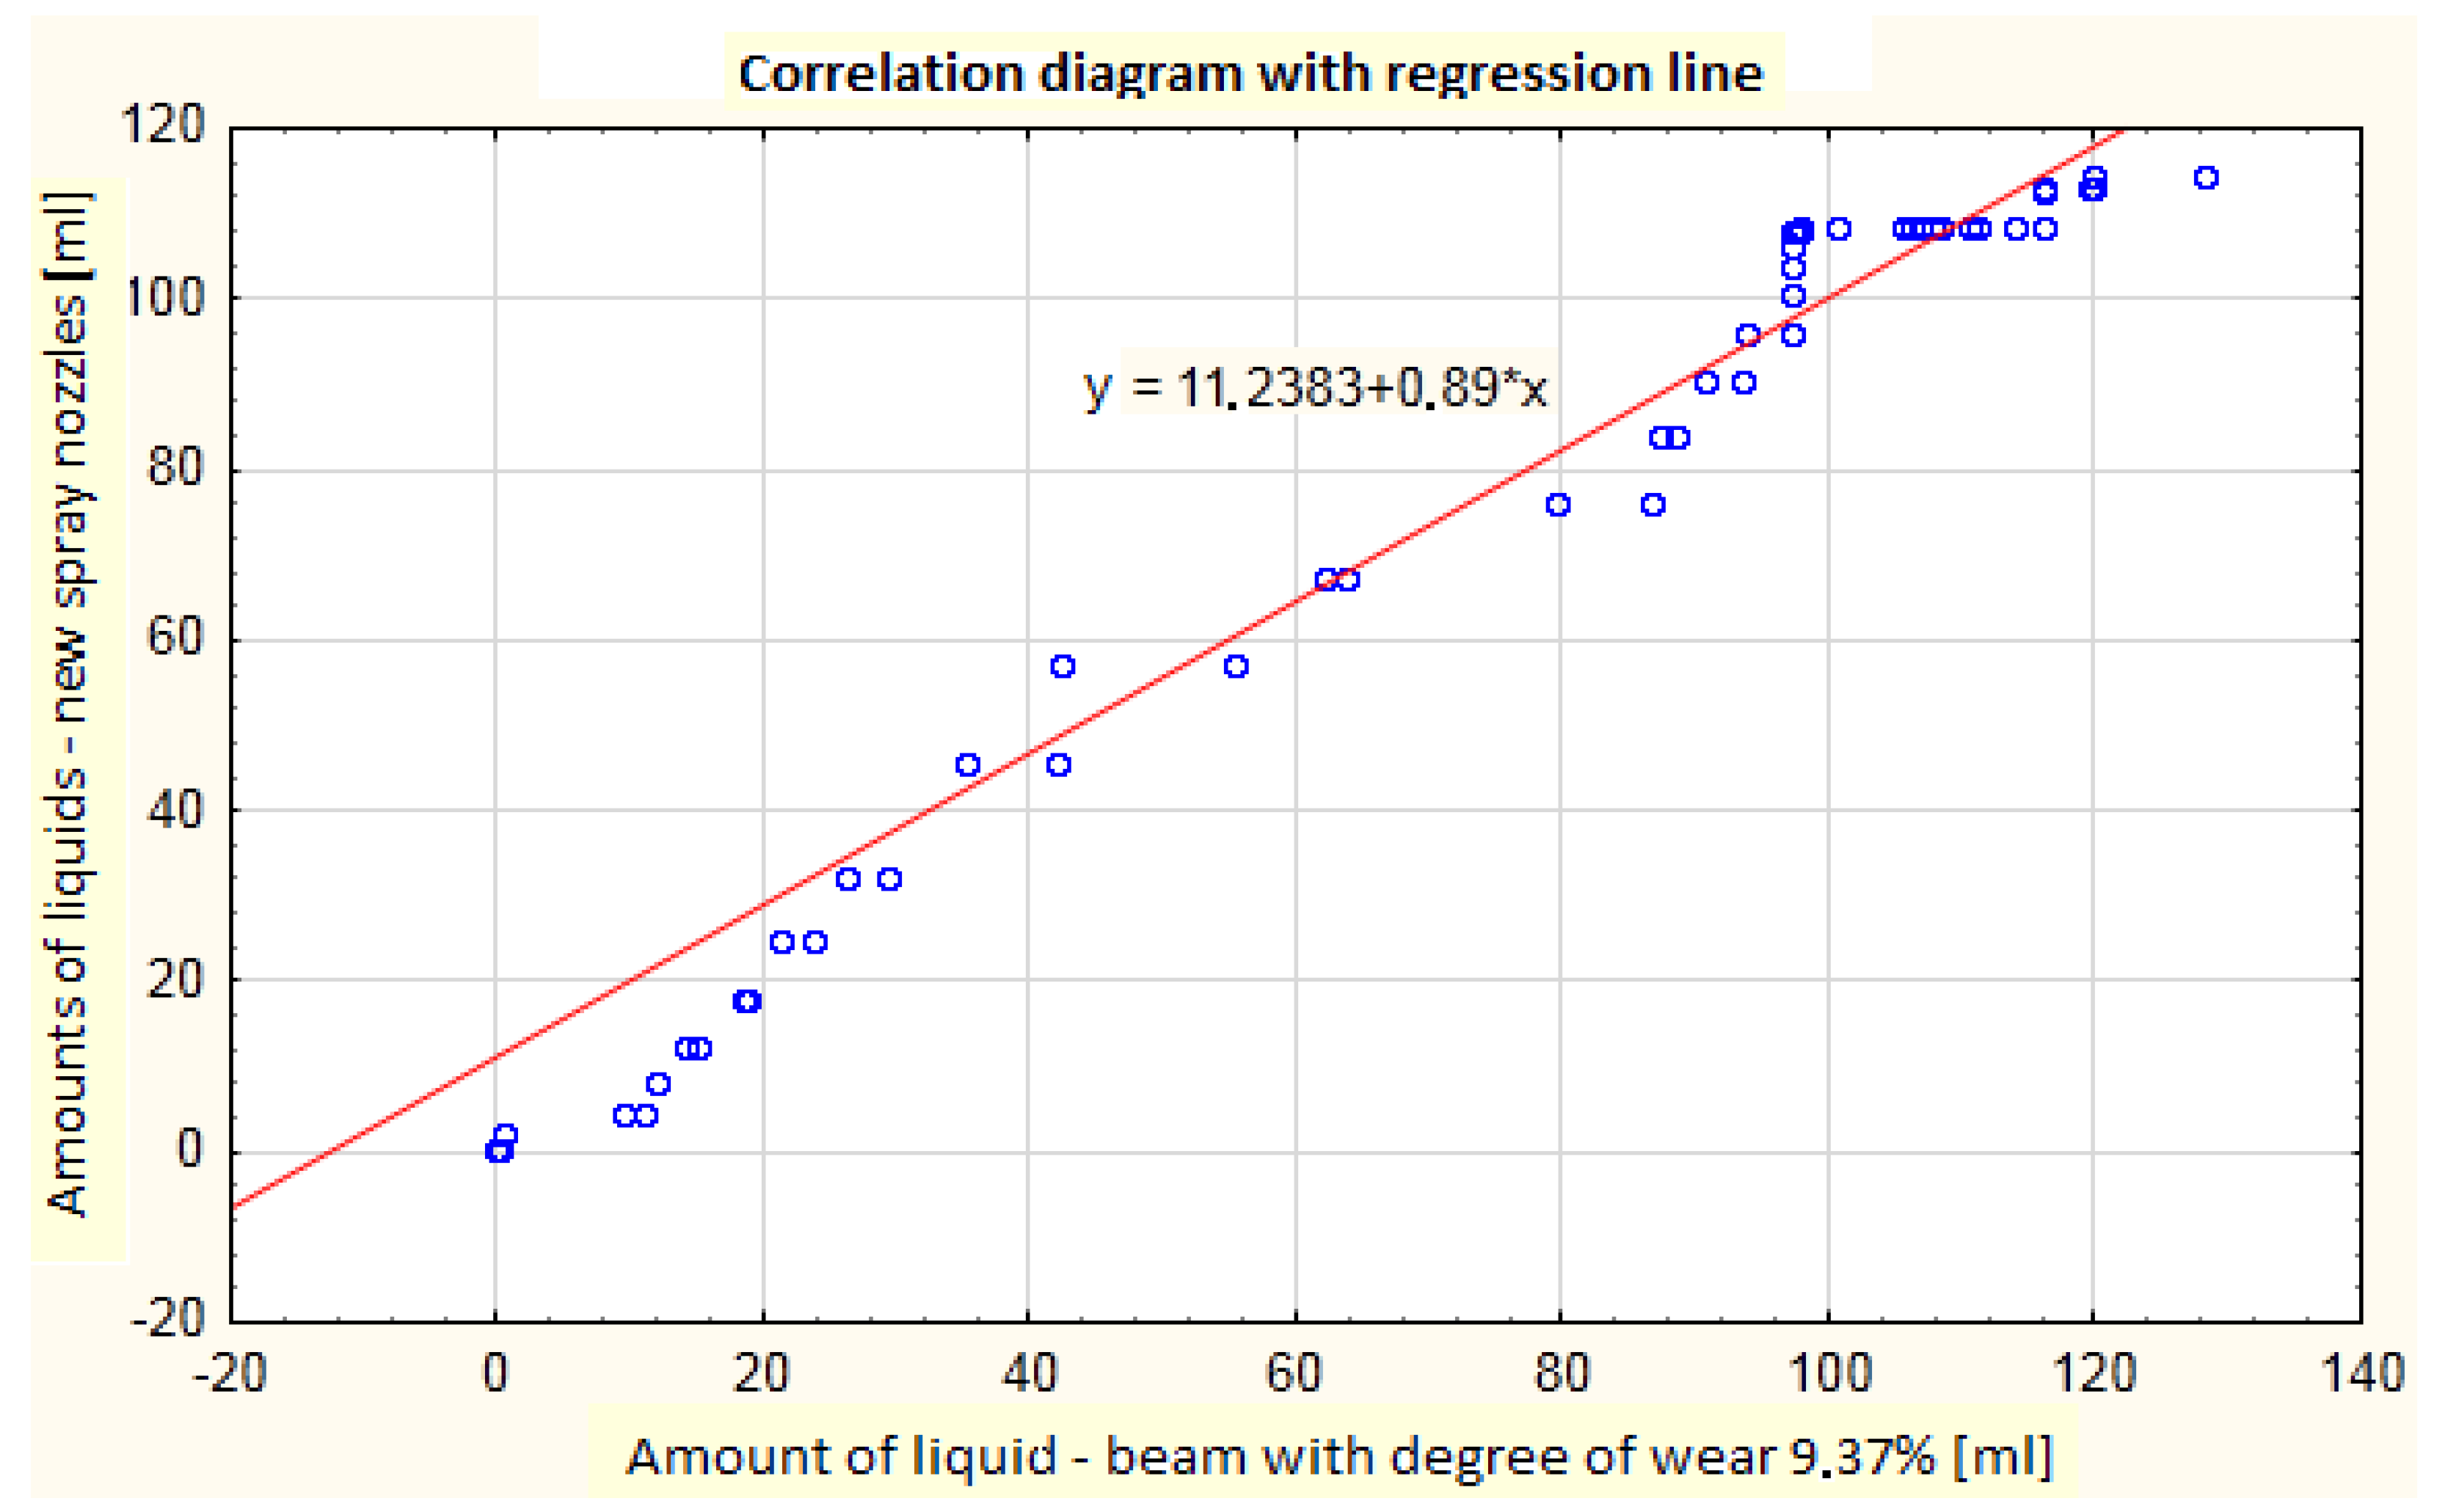
To check the goodness of the fit of the data obtained with the new model to real results, the RS-MM 110 03 nozzles were used in such a way that each of them multiplied 25 times formed a single virtual field boom. The STATISTICA 13 program, supported by the Statsoft company from Poland in 2013, was used to perform the linear regression analysis of data generated by the model in comparison with the measurements provided by the virtual field booms. Figure 4 shows an example of a correlation diagram of the amount of liquid after the spraying process from the boom equipped with the new nozzles (model generating V = 2.16%) and from a boom equipped with worn nozzles (generating V = 9.37% wear degree) with a fitted regression line.
We analyzed the values of coefficients of correlation and coefficients of determination from each regression analysis of the data generated by the model and those obtained with the use of virtual field booms equipped with worn nozzles.
The coefficients of correlation have a value of approximately 0.95 and higher, which indicates a strong correlation (dependence) between the model and experimental data.
The coefficients of determination, i.e., the measure of the fit of the model to the experimental data, are higher than 0.9, which indicates that the model efficiently explains the distribution of the experimental data.
Therefore, the developed model is characterized by a very high goodness of fit to the experimental data.
The new model can be used for the description of the distribution of the liquid amounts after the spraying process, even with a very low value of the coefficient of variation equal to 2.16%.
This result should be regarded by manufacturers of sprayers as a guarantee of high uniformity of surface coverage.
Additionally, to test the compatibility of the data from the new distribution with the experimental data, the chi-square test for observed and expected values was applied, besides regression analysis.
A null hypothesis of the compatibility of the examined distributions with an alternative hypothesis of the absence of compliance was adopted. The critical value for the chi-square distribution with 28 degrees of freedom was 41.333 at the significance level α = 0.05. The values of the test statistics for the results of each nozzle RS-MM 110 03 duplicated on the boom in relation to the data obtained with the new model. Experimental values from each RS-MM 110 03 nozzle correspond to an individual deposition in each groove of the distribution test bench. The higher the value of the test statistic is, the more the nozzle, which generates a virtual boom sprayer, is worn out and, in consequence, the higher the value of the coefficient of variation (CV) generated from the boom.
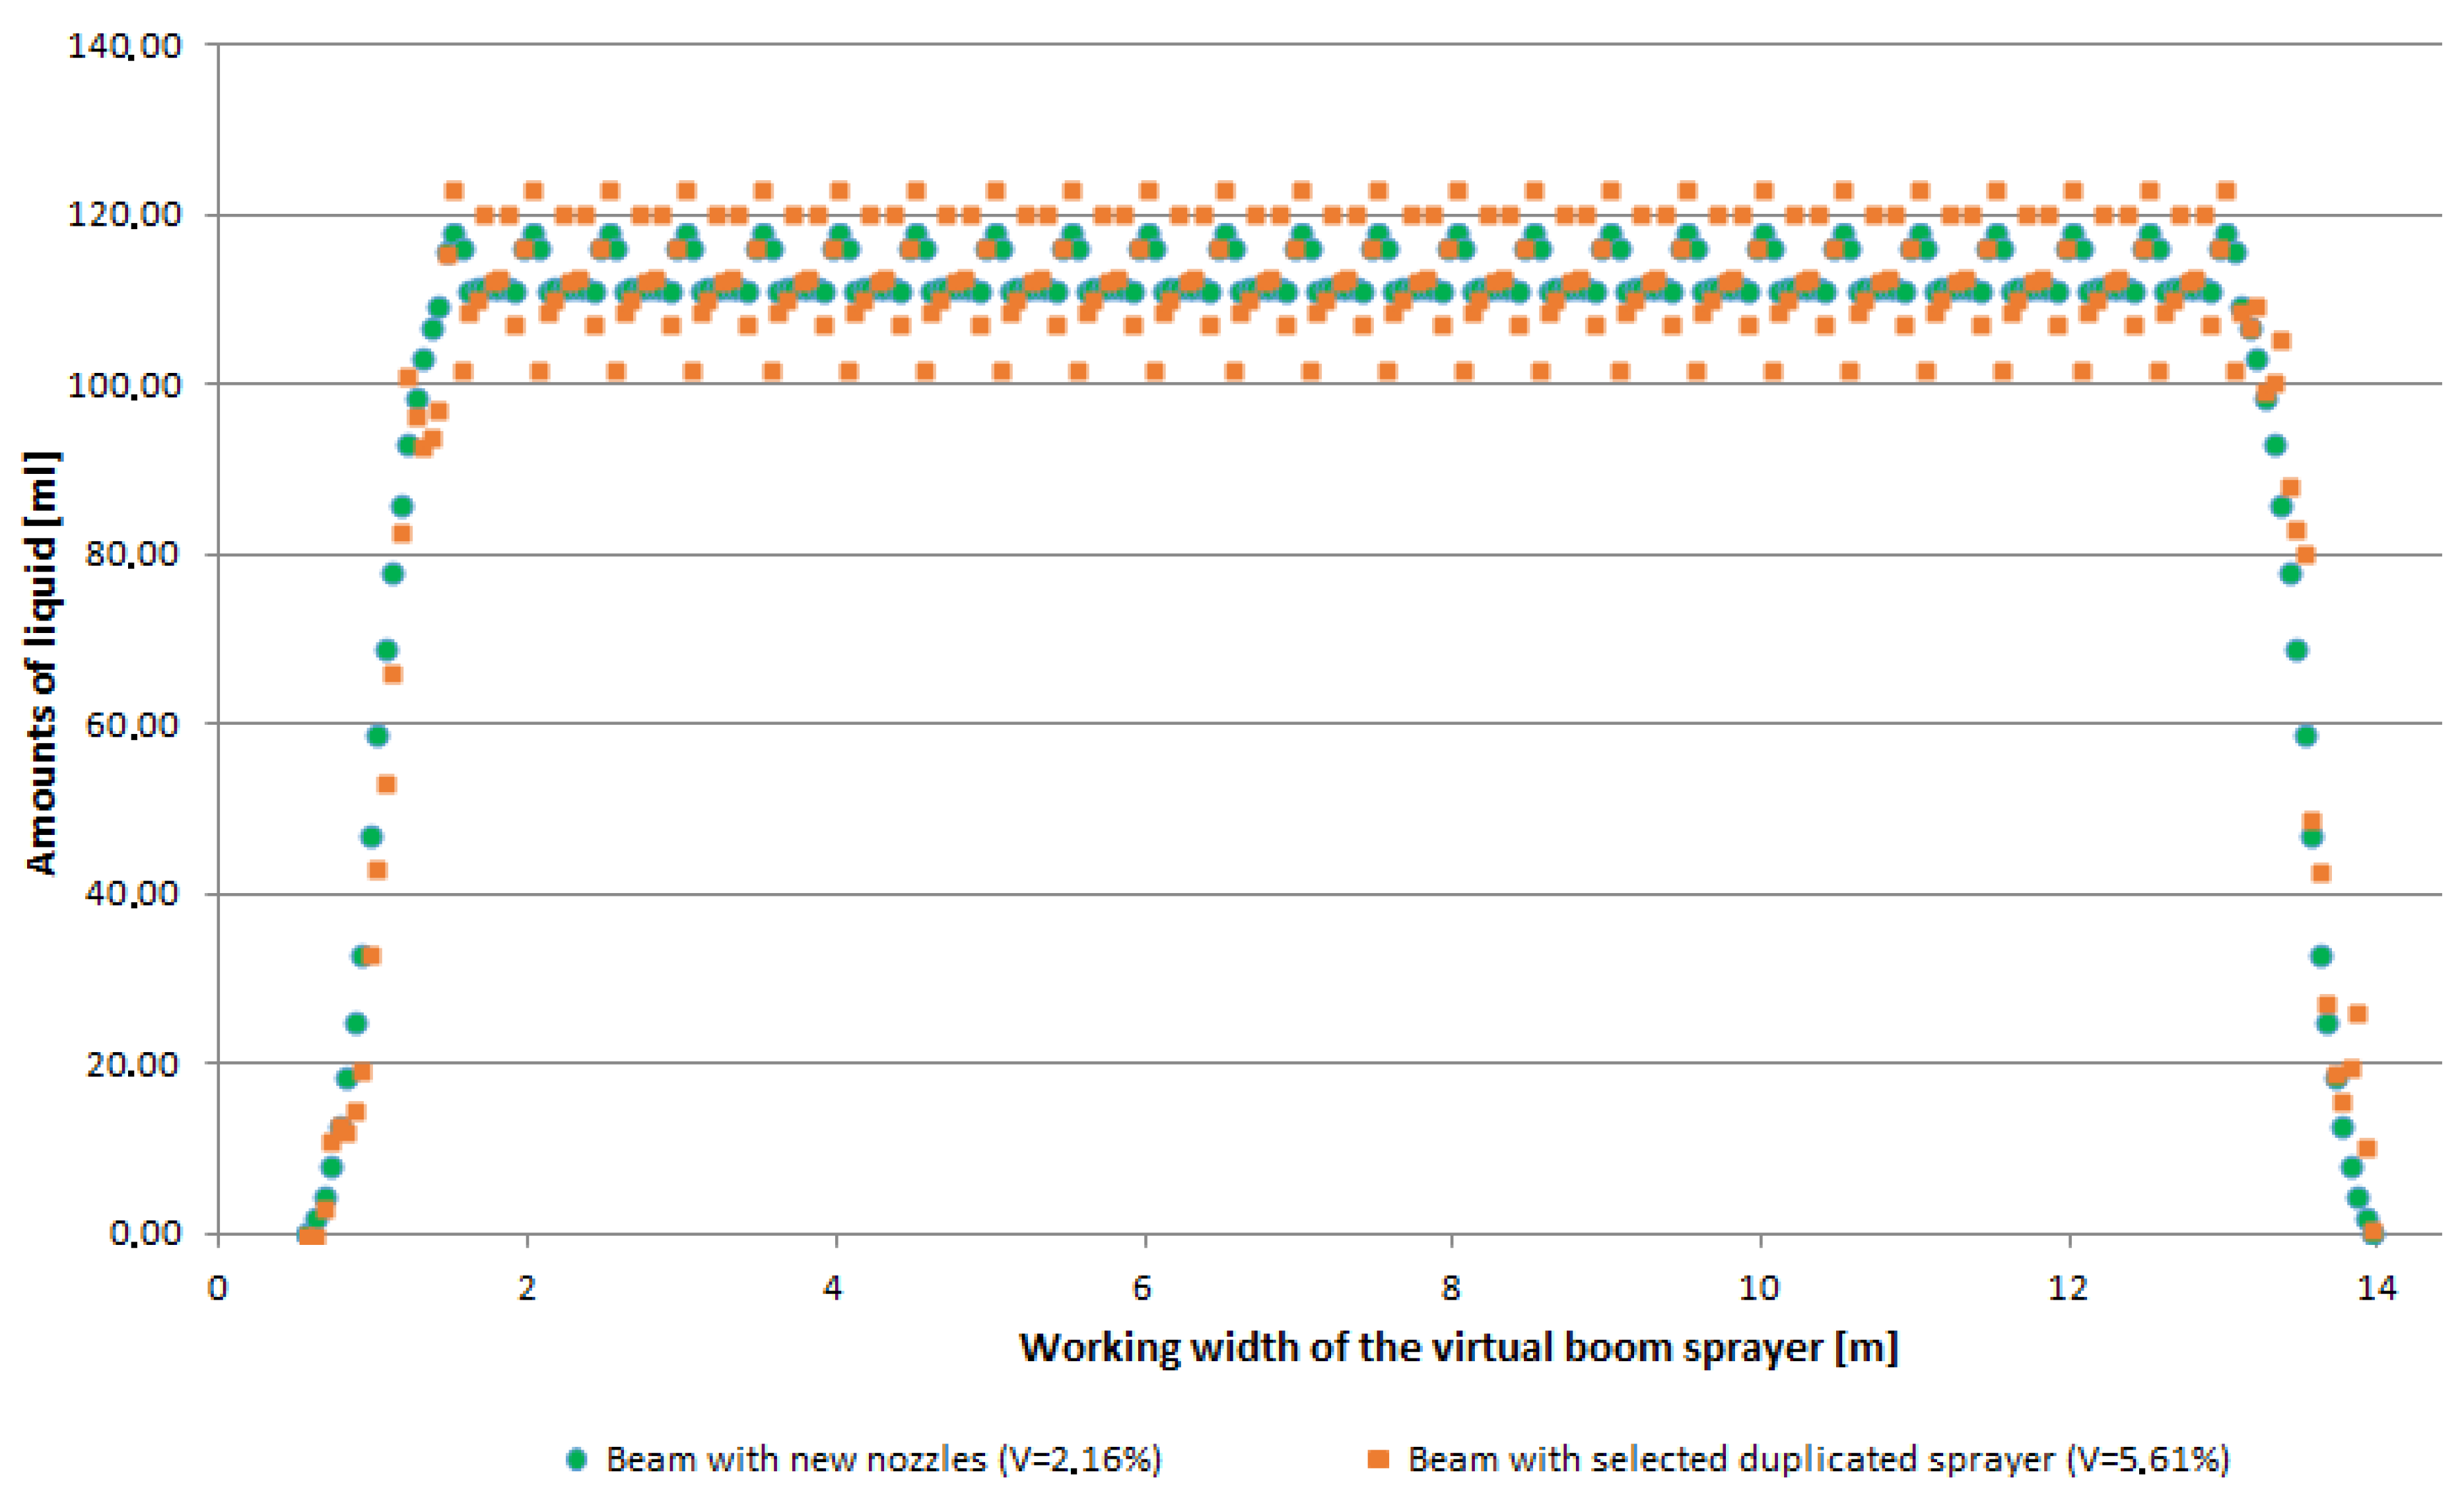
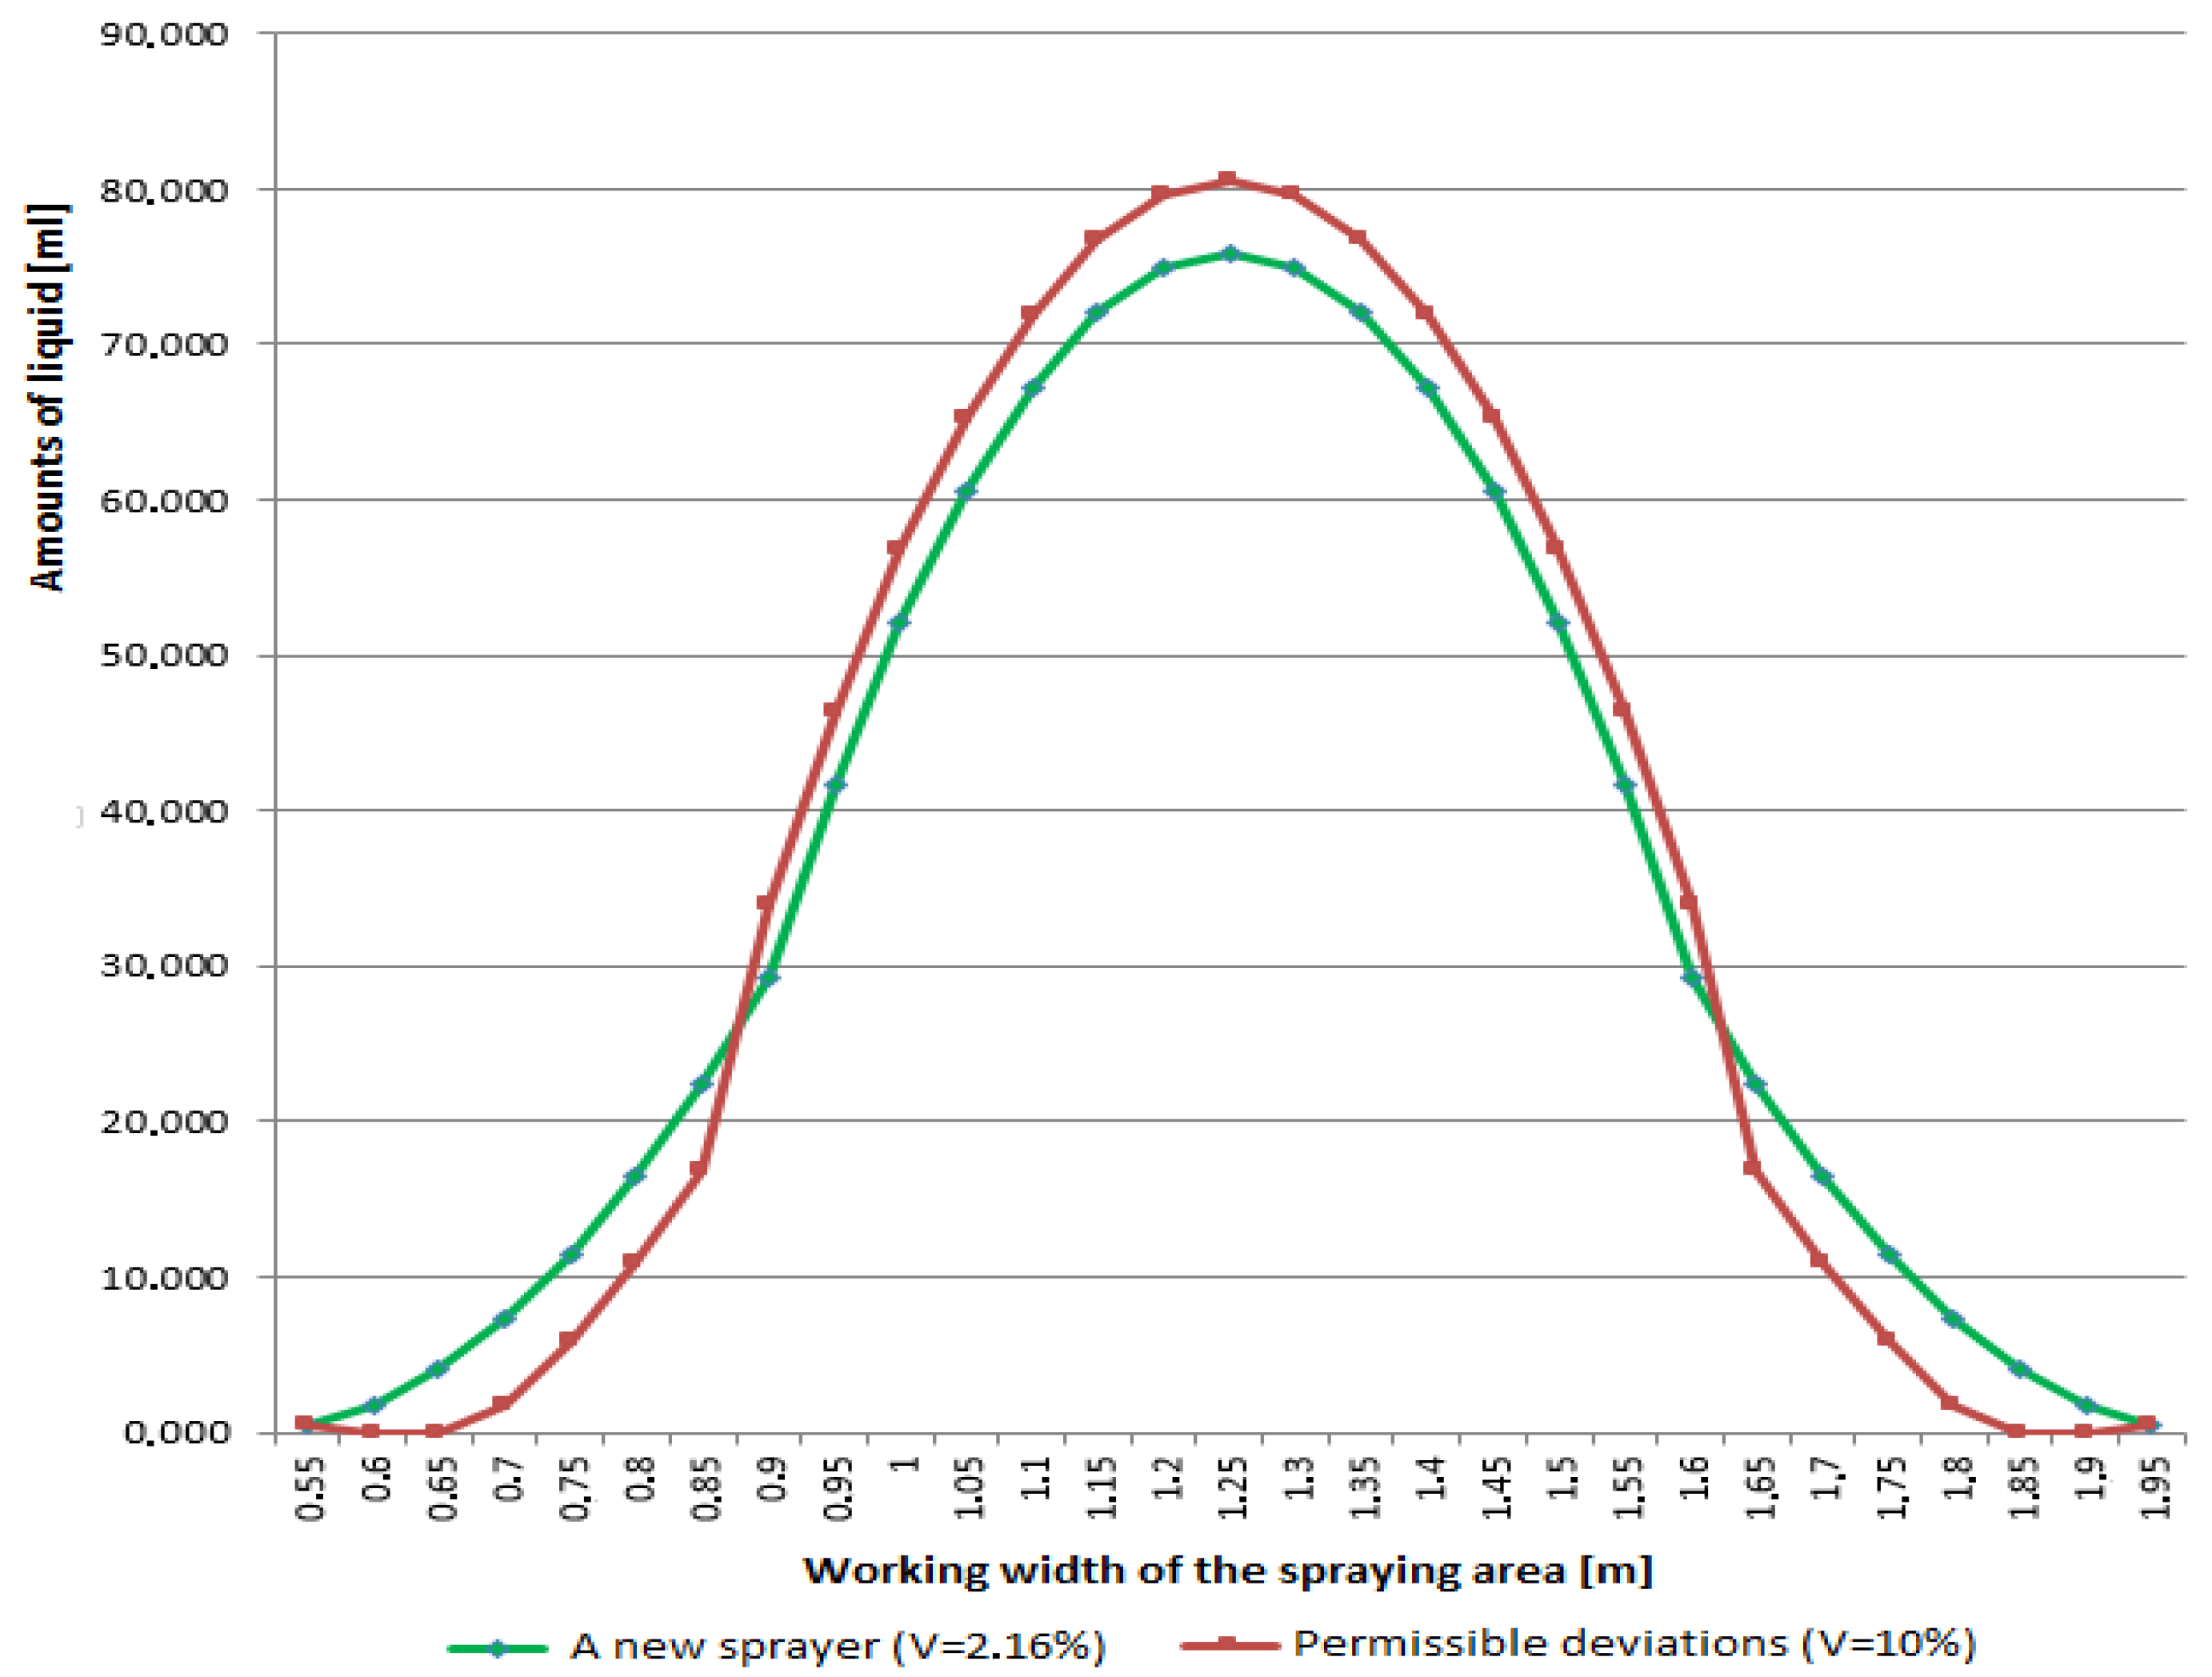
A critical area at the significance level α = 0.05 is the range <41.337; ). The analysis of all the results shown in Table 4 indicates that there is no ground for the rejection of the null hypothesis about the consistency of distributions at the significance level of 0.05. Hence, the tested distributions can be considered identical. For comparison, data generated by the model (for V = 2.16%) and data from measurements of RS-MM 110 03 spray nozzles constituting the virtual field booms are presented in a graph (Figure 5). The Figure shows the difference between the level of uniformity of model data simulating the work of the new nozzles and of the model provided by the data from the worn nozzles.
Additionally, we considered the fact that the total amounts of liquid accumulated along the entire booms are the same in both distributions.
These calculations conducted for the measurement table with a 10 cm spacing of grooves, reflecting conditions of nozzle tests and analyses performed by producers, were analogous, although with one exception. Every second value of variable , denoting the amount of liquid accumulated on the 55th centimeter, 65th centimeter, up to 13.95 meters of the length of the virtual field boom, was deleted from all values of the measurement table with grooves located 5 cm apart from each other.
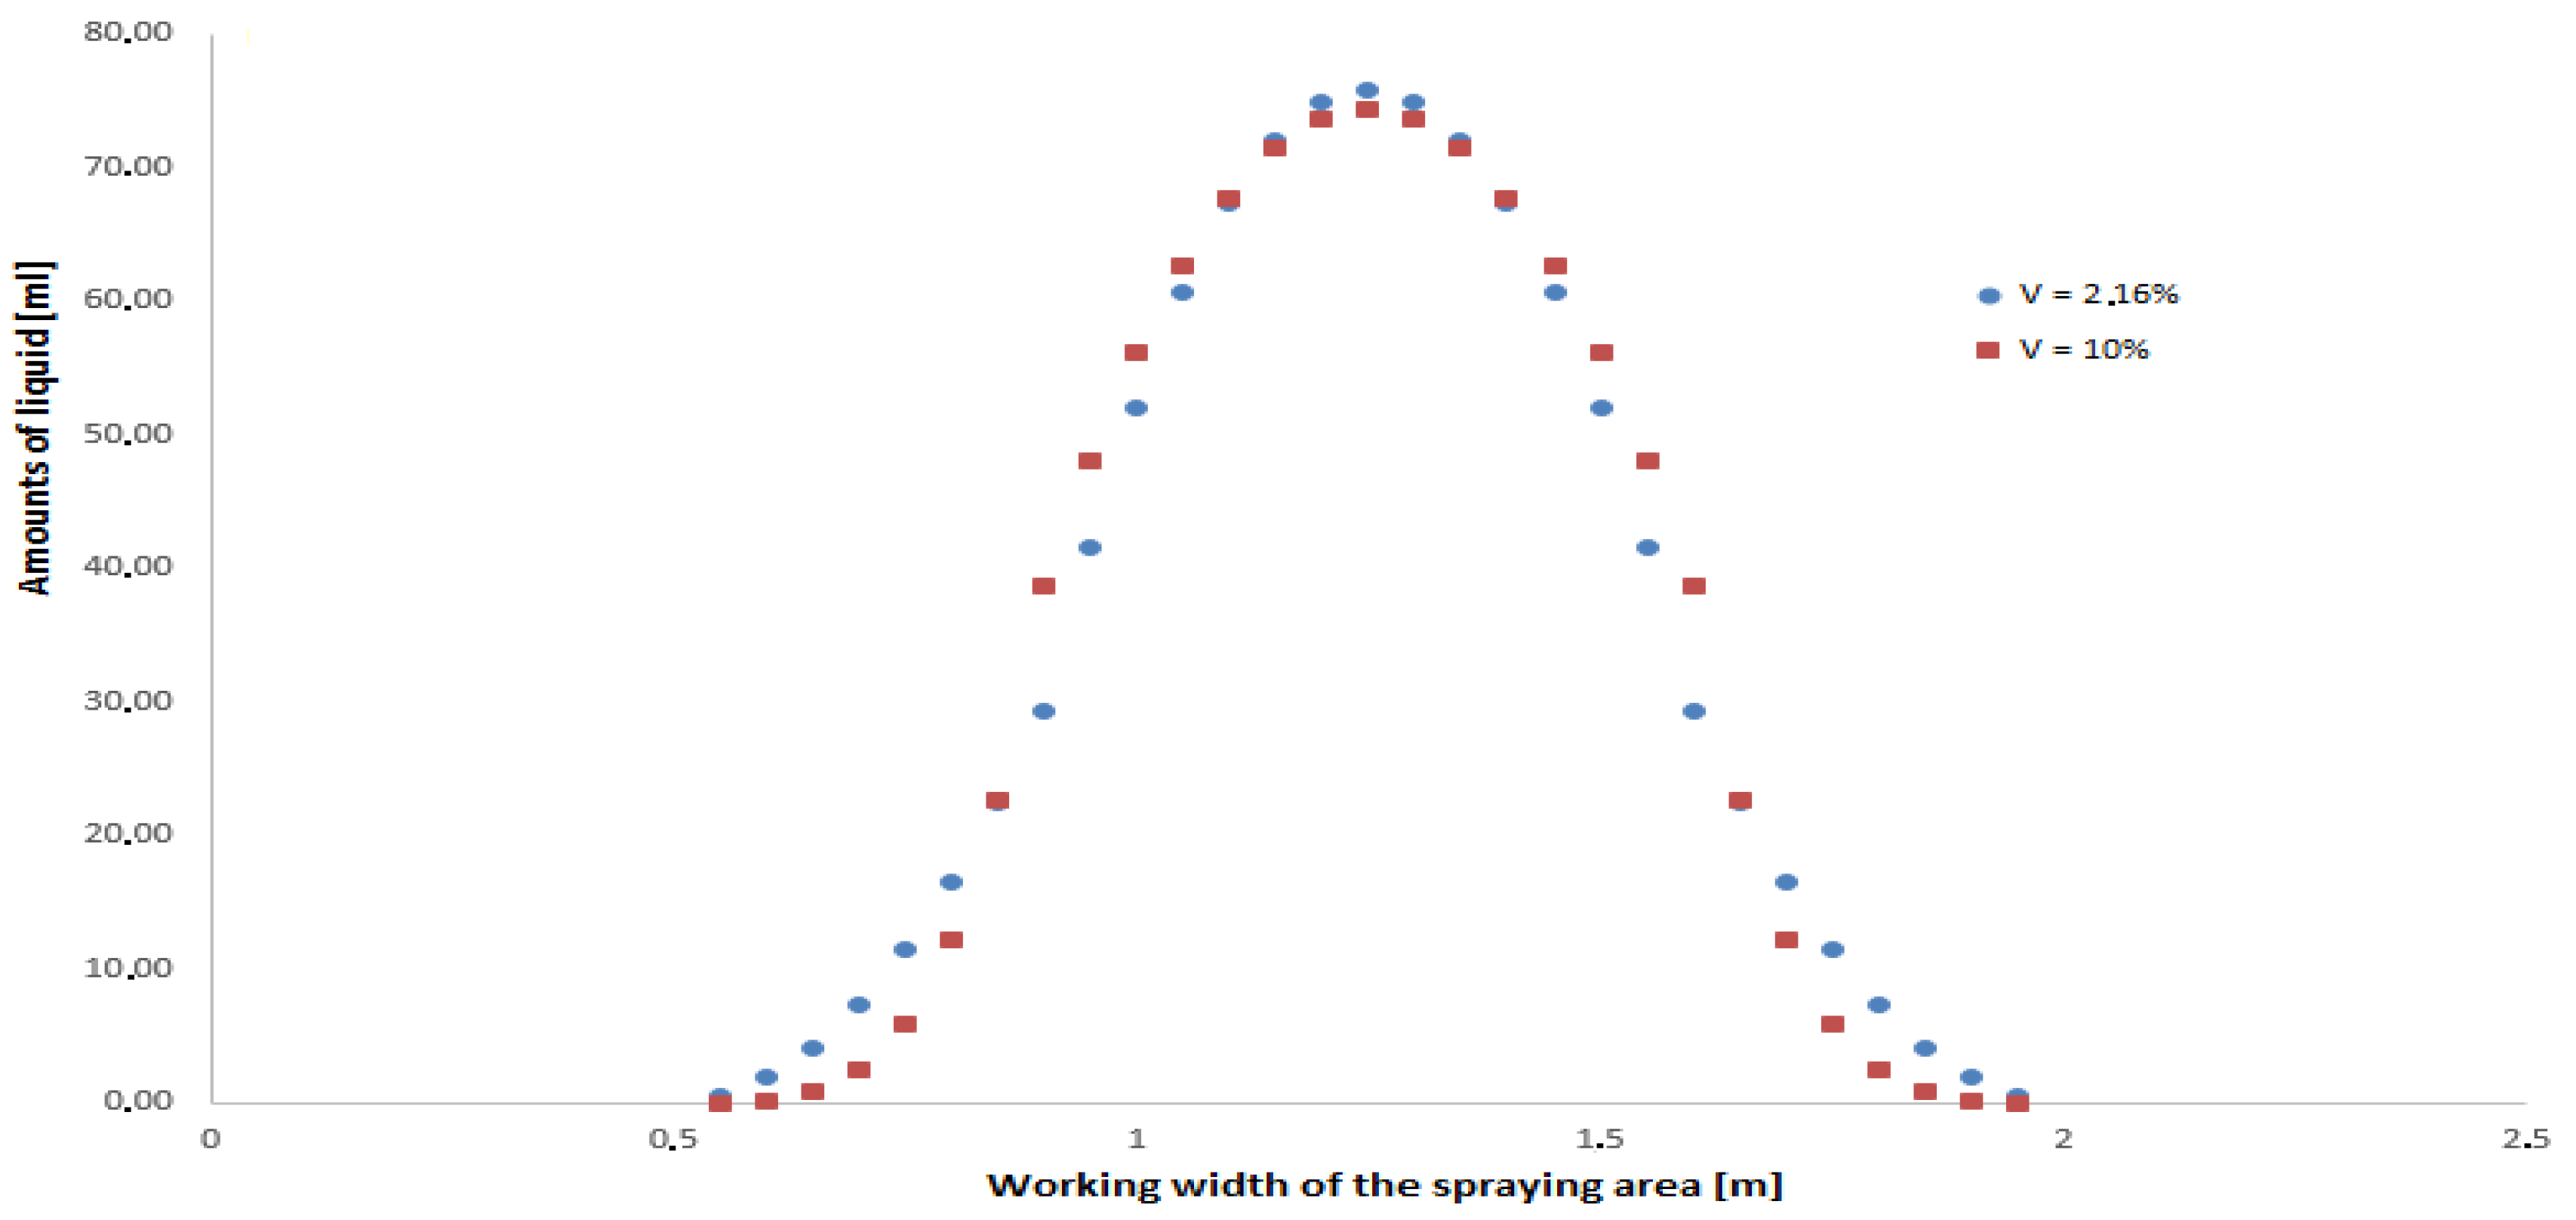
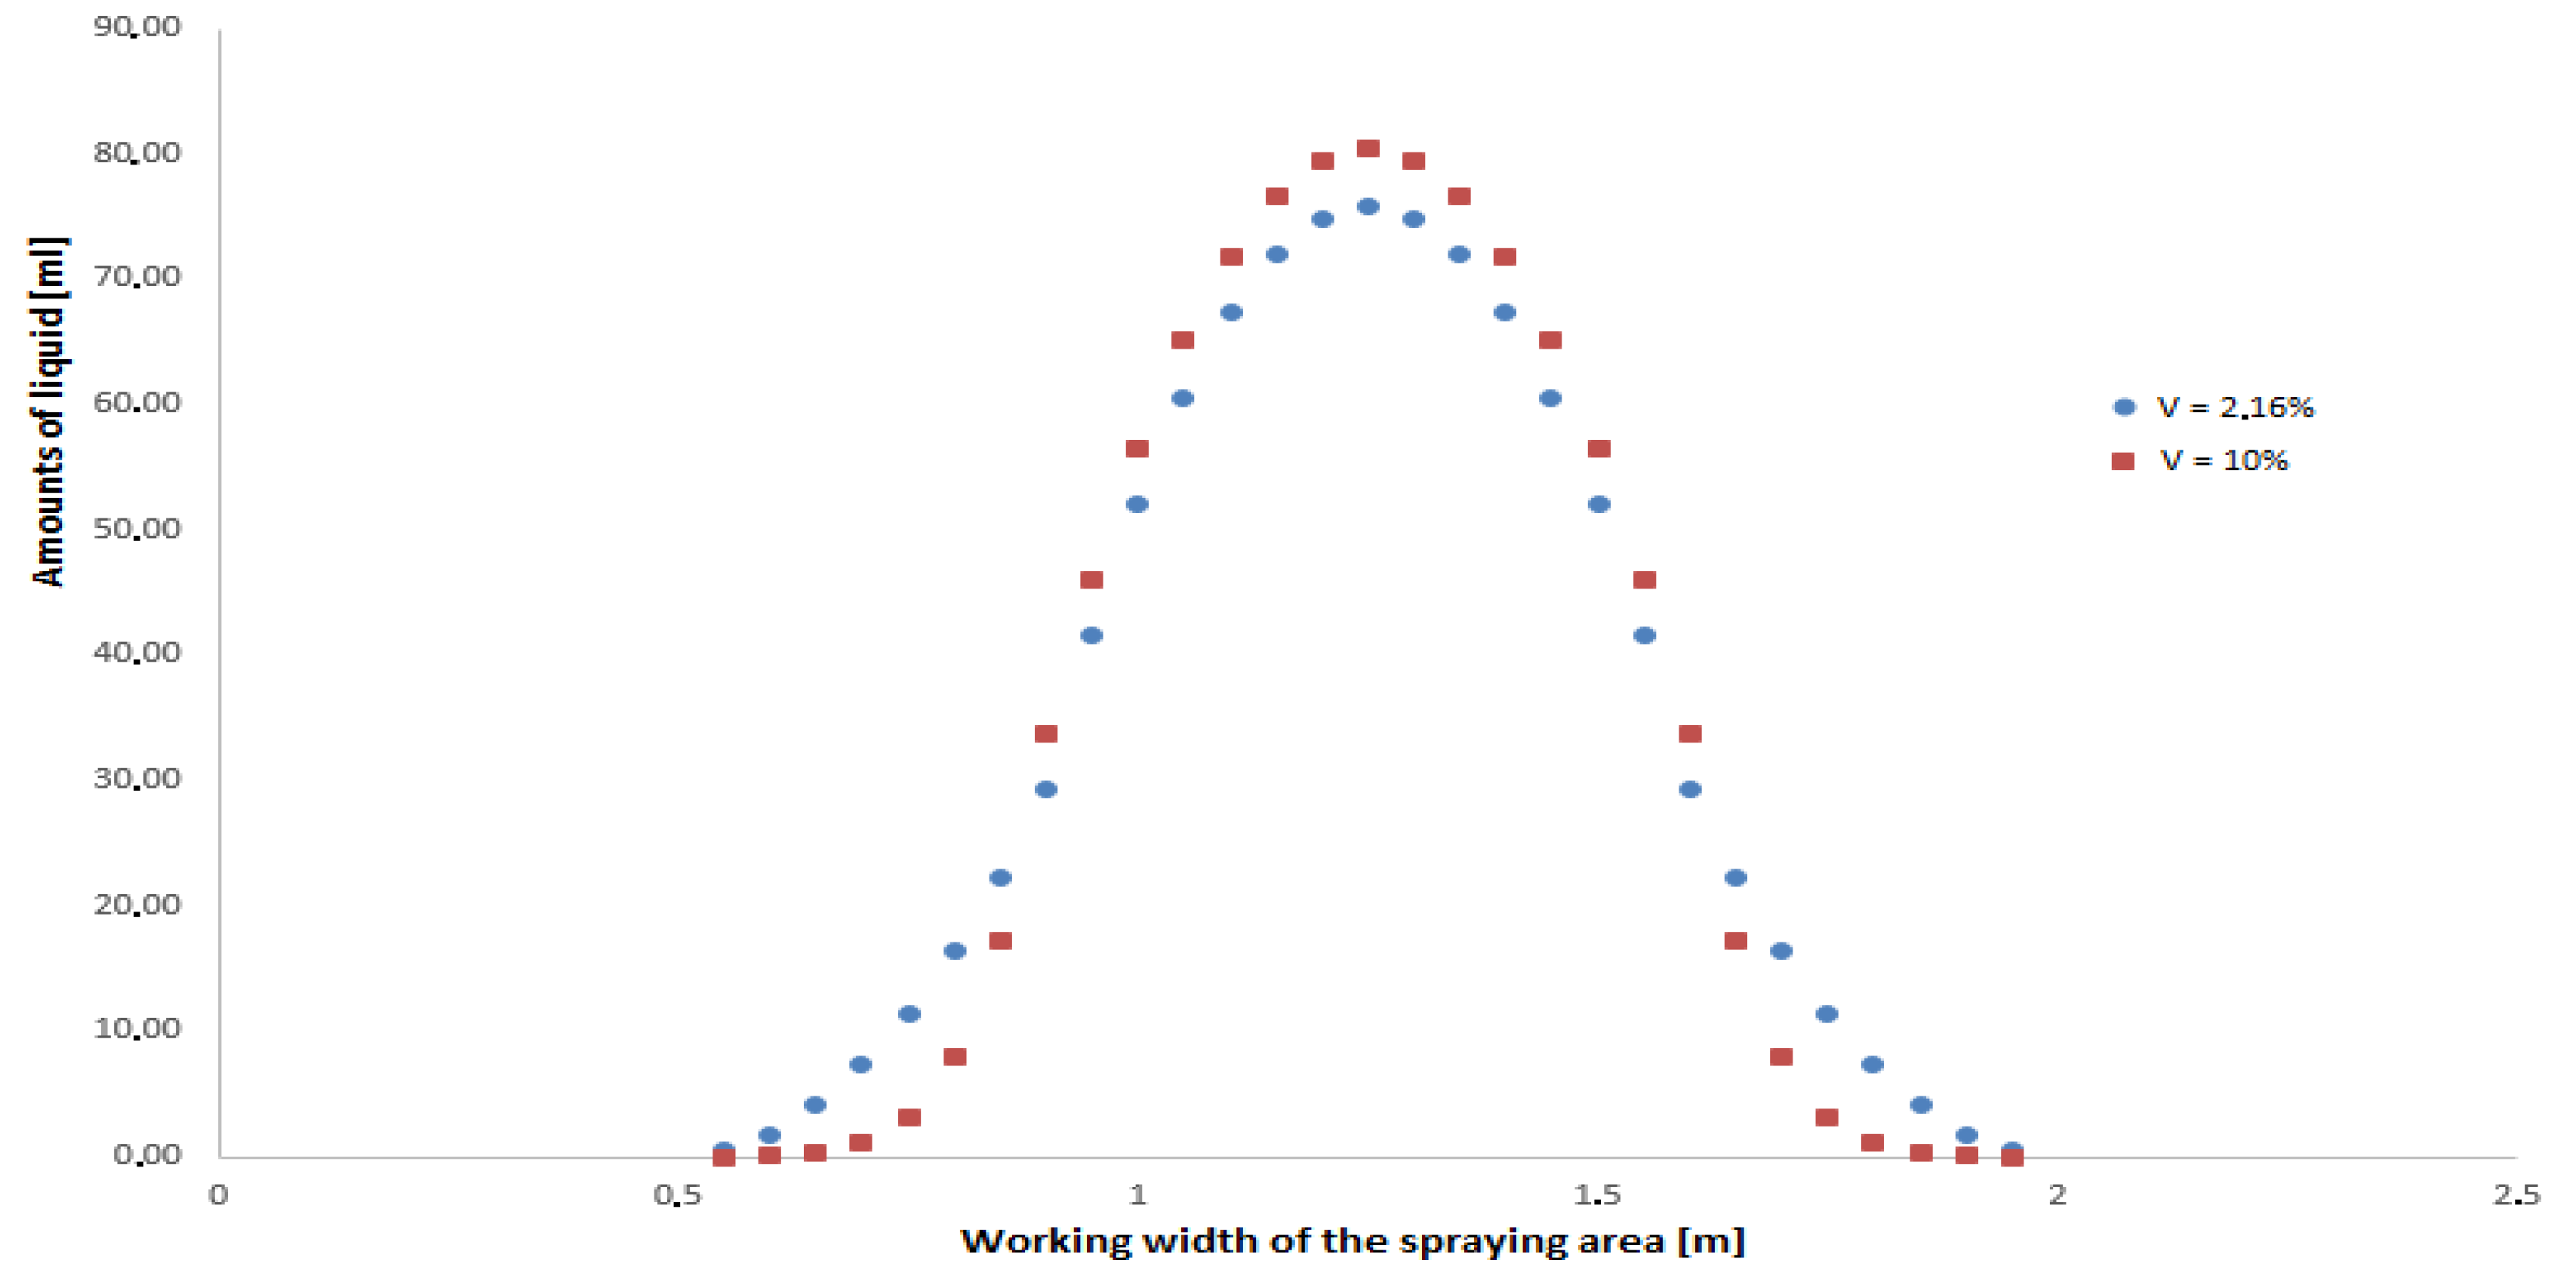
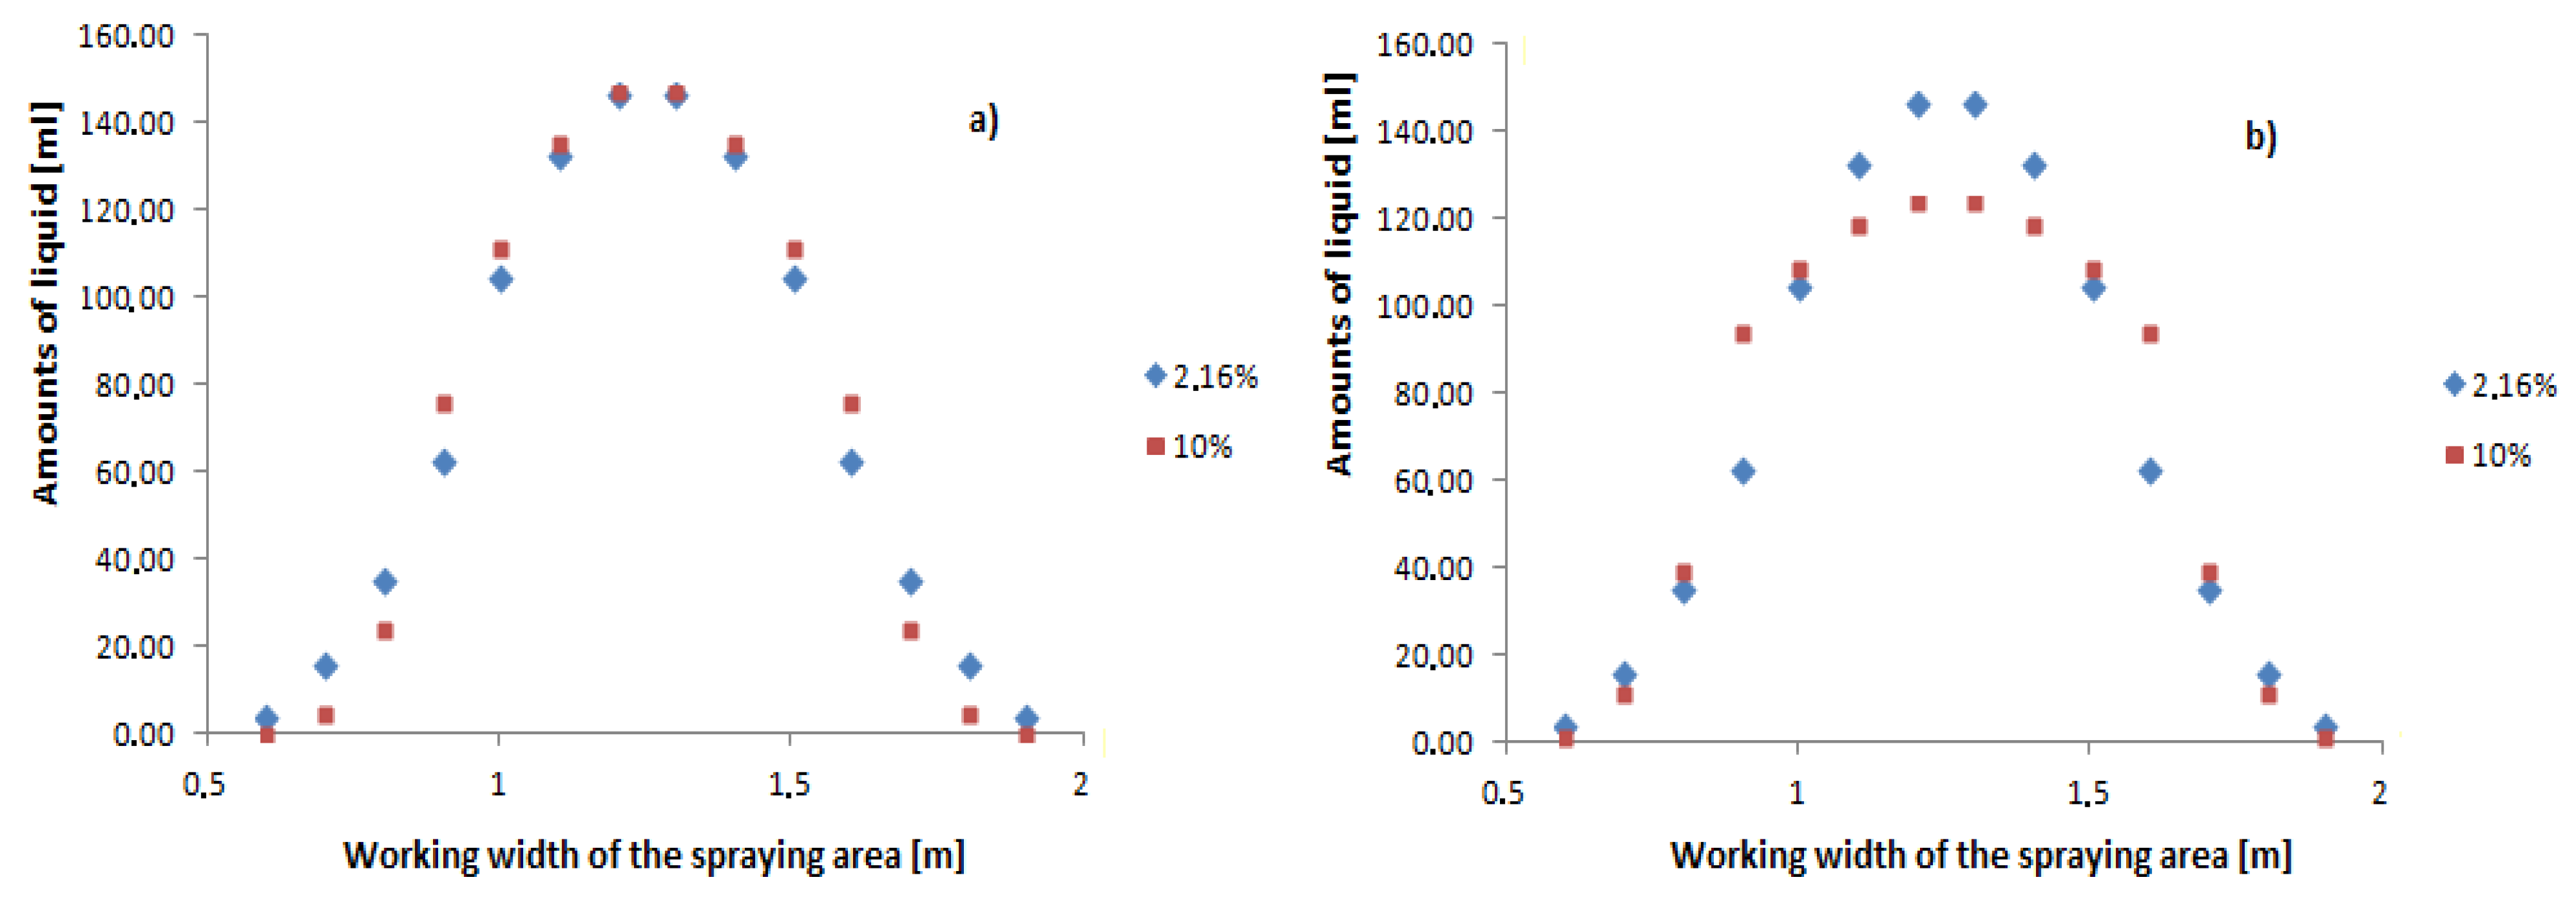
Data provided by the proposed model generating the values of the coefficient of variation of V = 2.16% and V = 10%, which simulated spraying performed with both a new nozzle and an adequately worn nozzle, were scaled to obtain the same total amounts of sprayed liquid. Figure 6 and Figure 7 present the amounts of liquid obtained at different values of model parameters for two nozzles with normalized flow rates (the new nozzle and another one with a moderate or permissible degree of wear).
The analysis of the data presented in the graphs revealed the mean ranges of deviations of the amounts of sprayed liquid (Table 1 and Table 2), which reflect the moderate or permissible wear of the new (model) nozzle.
In other words, the data in the tables facilitate observation and inference on the identification of the adequate nozzle wear.
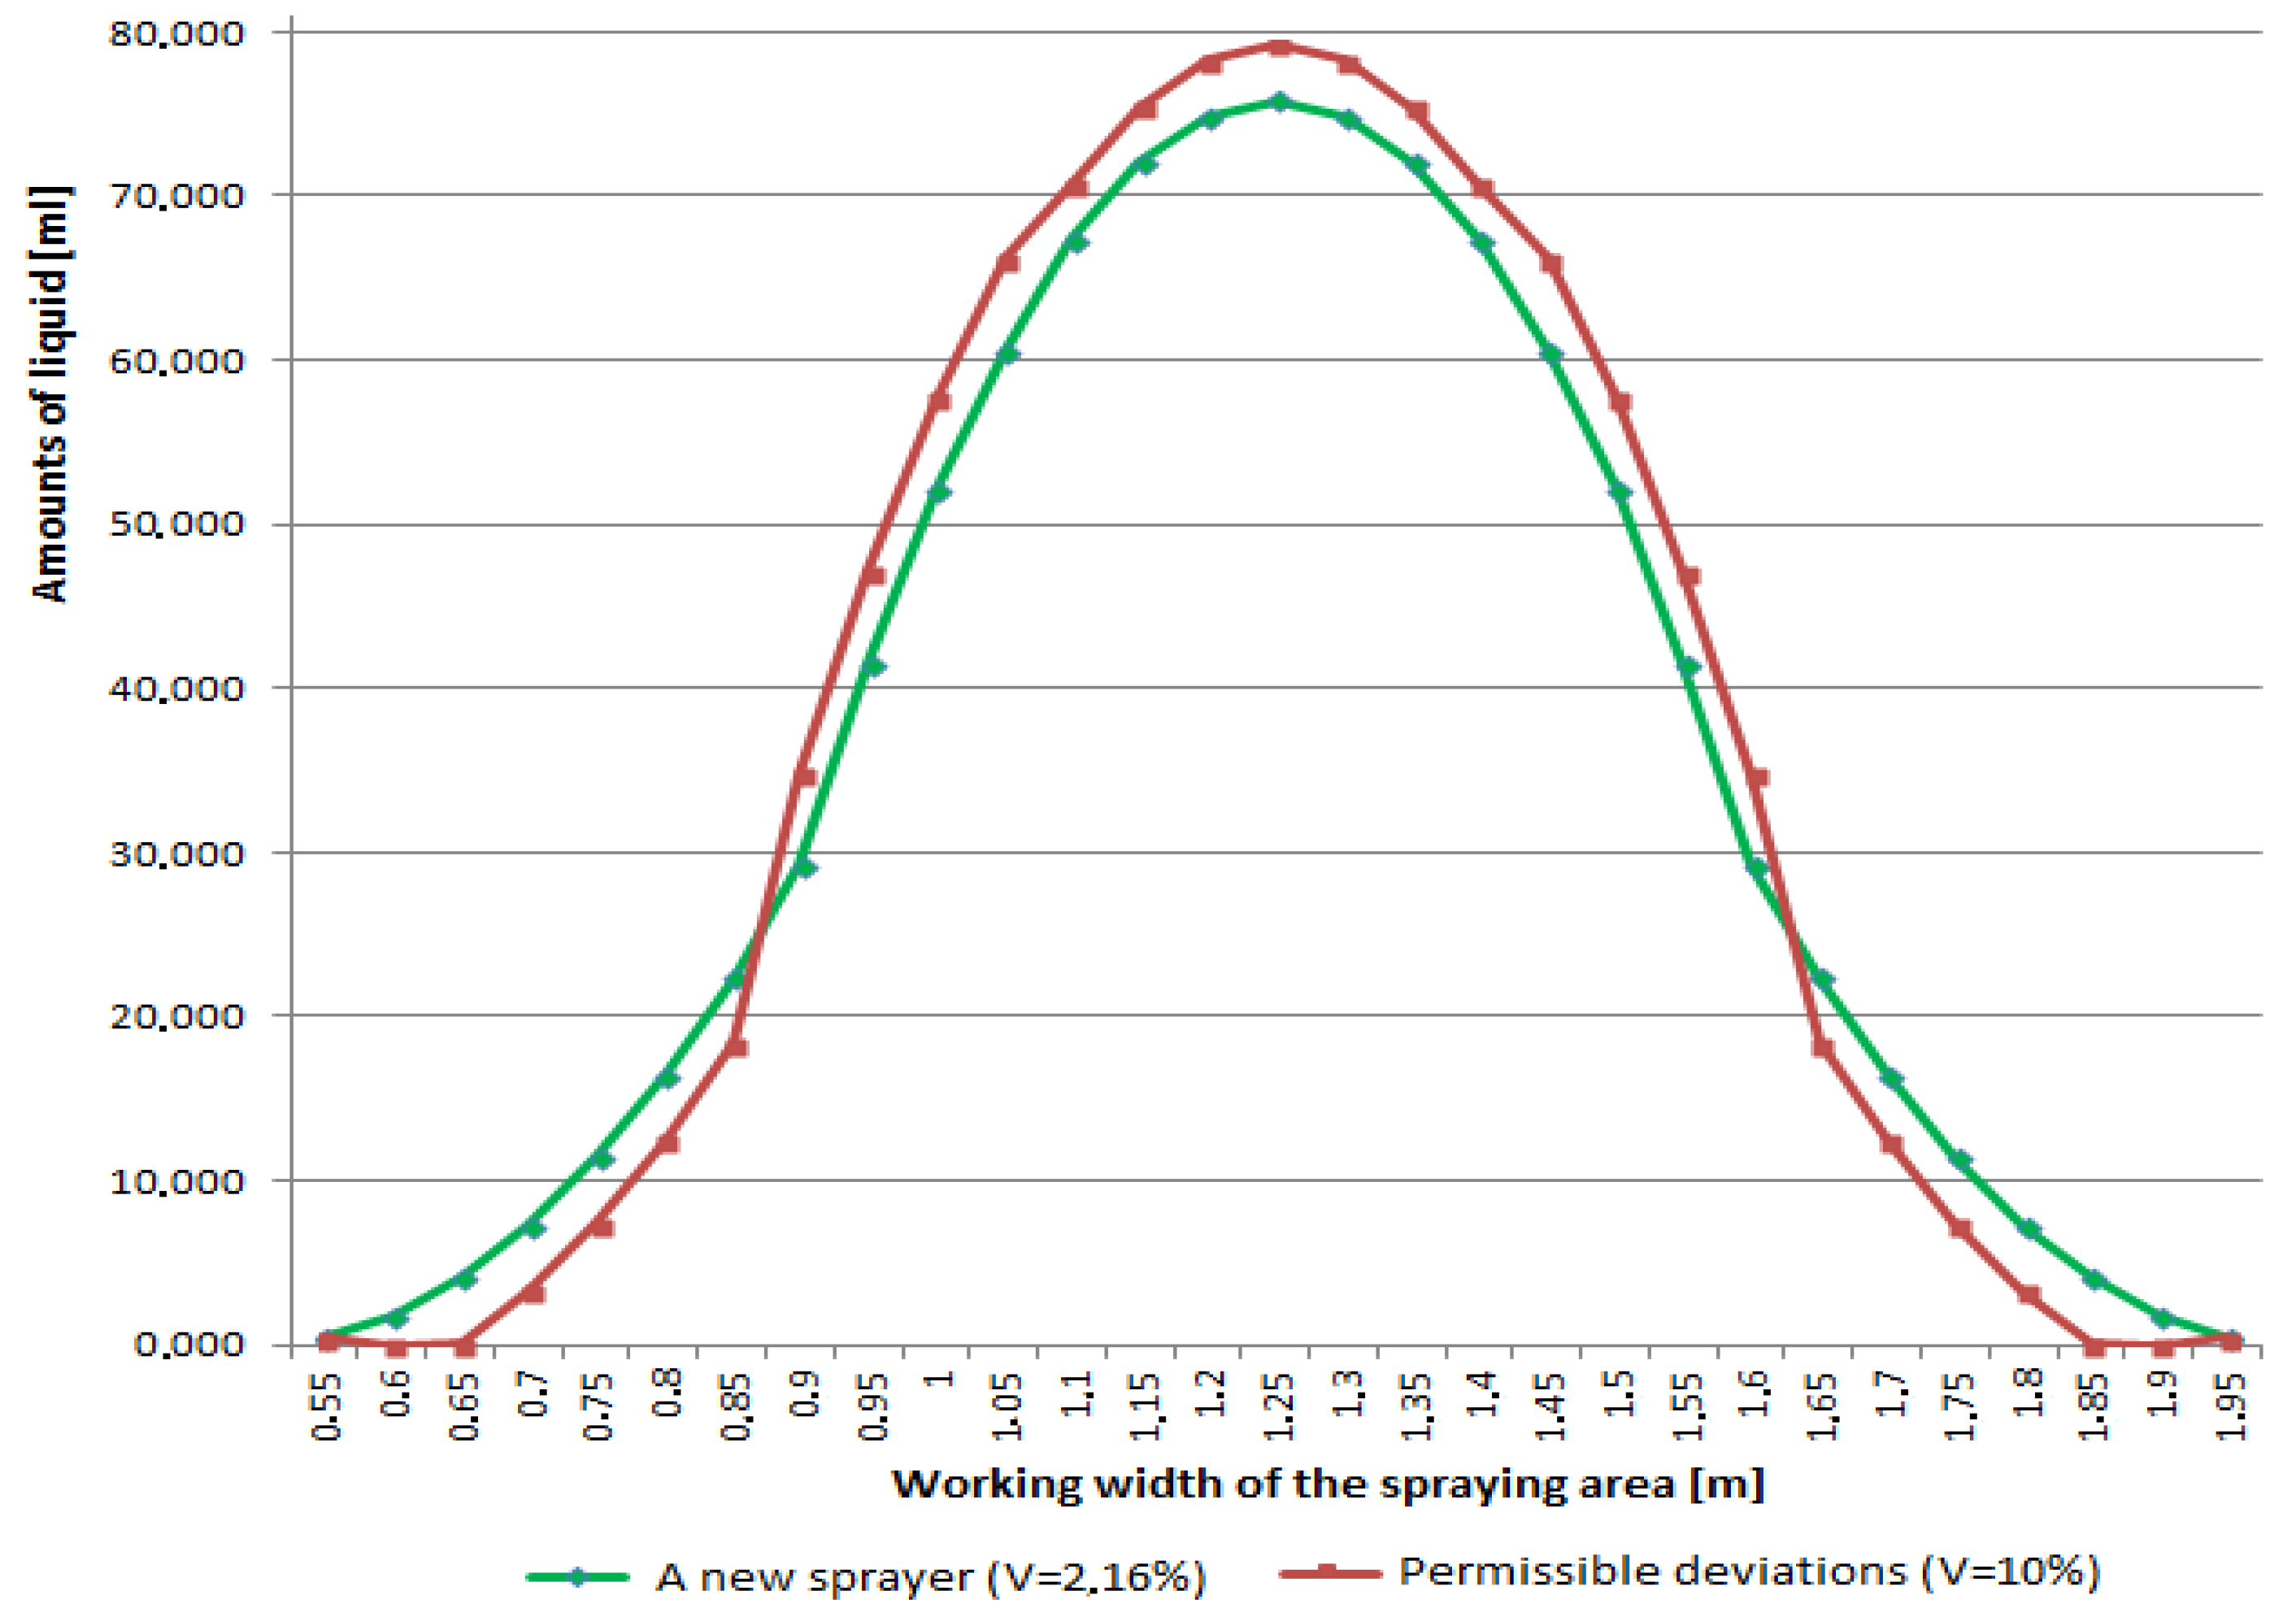
The tables and graphs presented above can be used for the development of a diagnostic model showing ranges of deviations in the amounts of liquid sprayed by the new nozzle that causes permissible wear, i.e., at the coefficient of variation of 10% (Figure 8 and Figure 9).
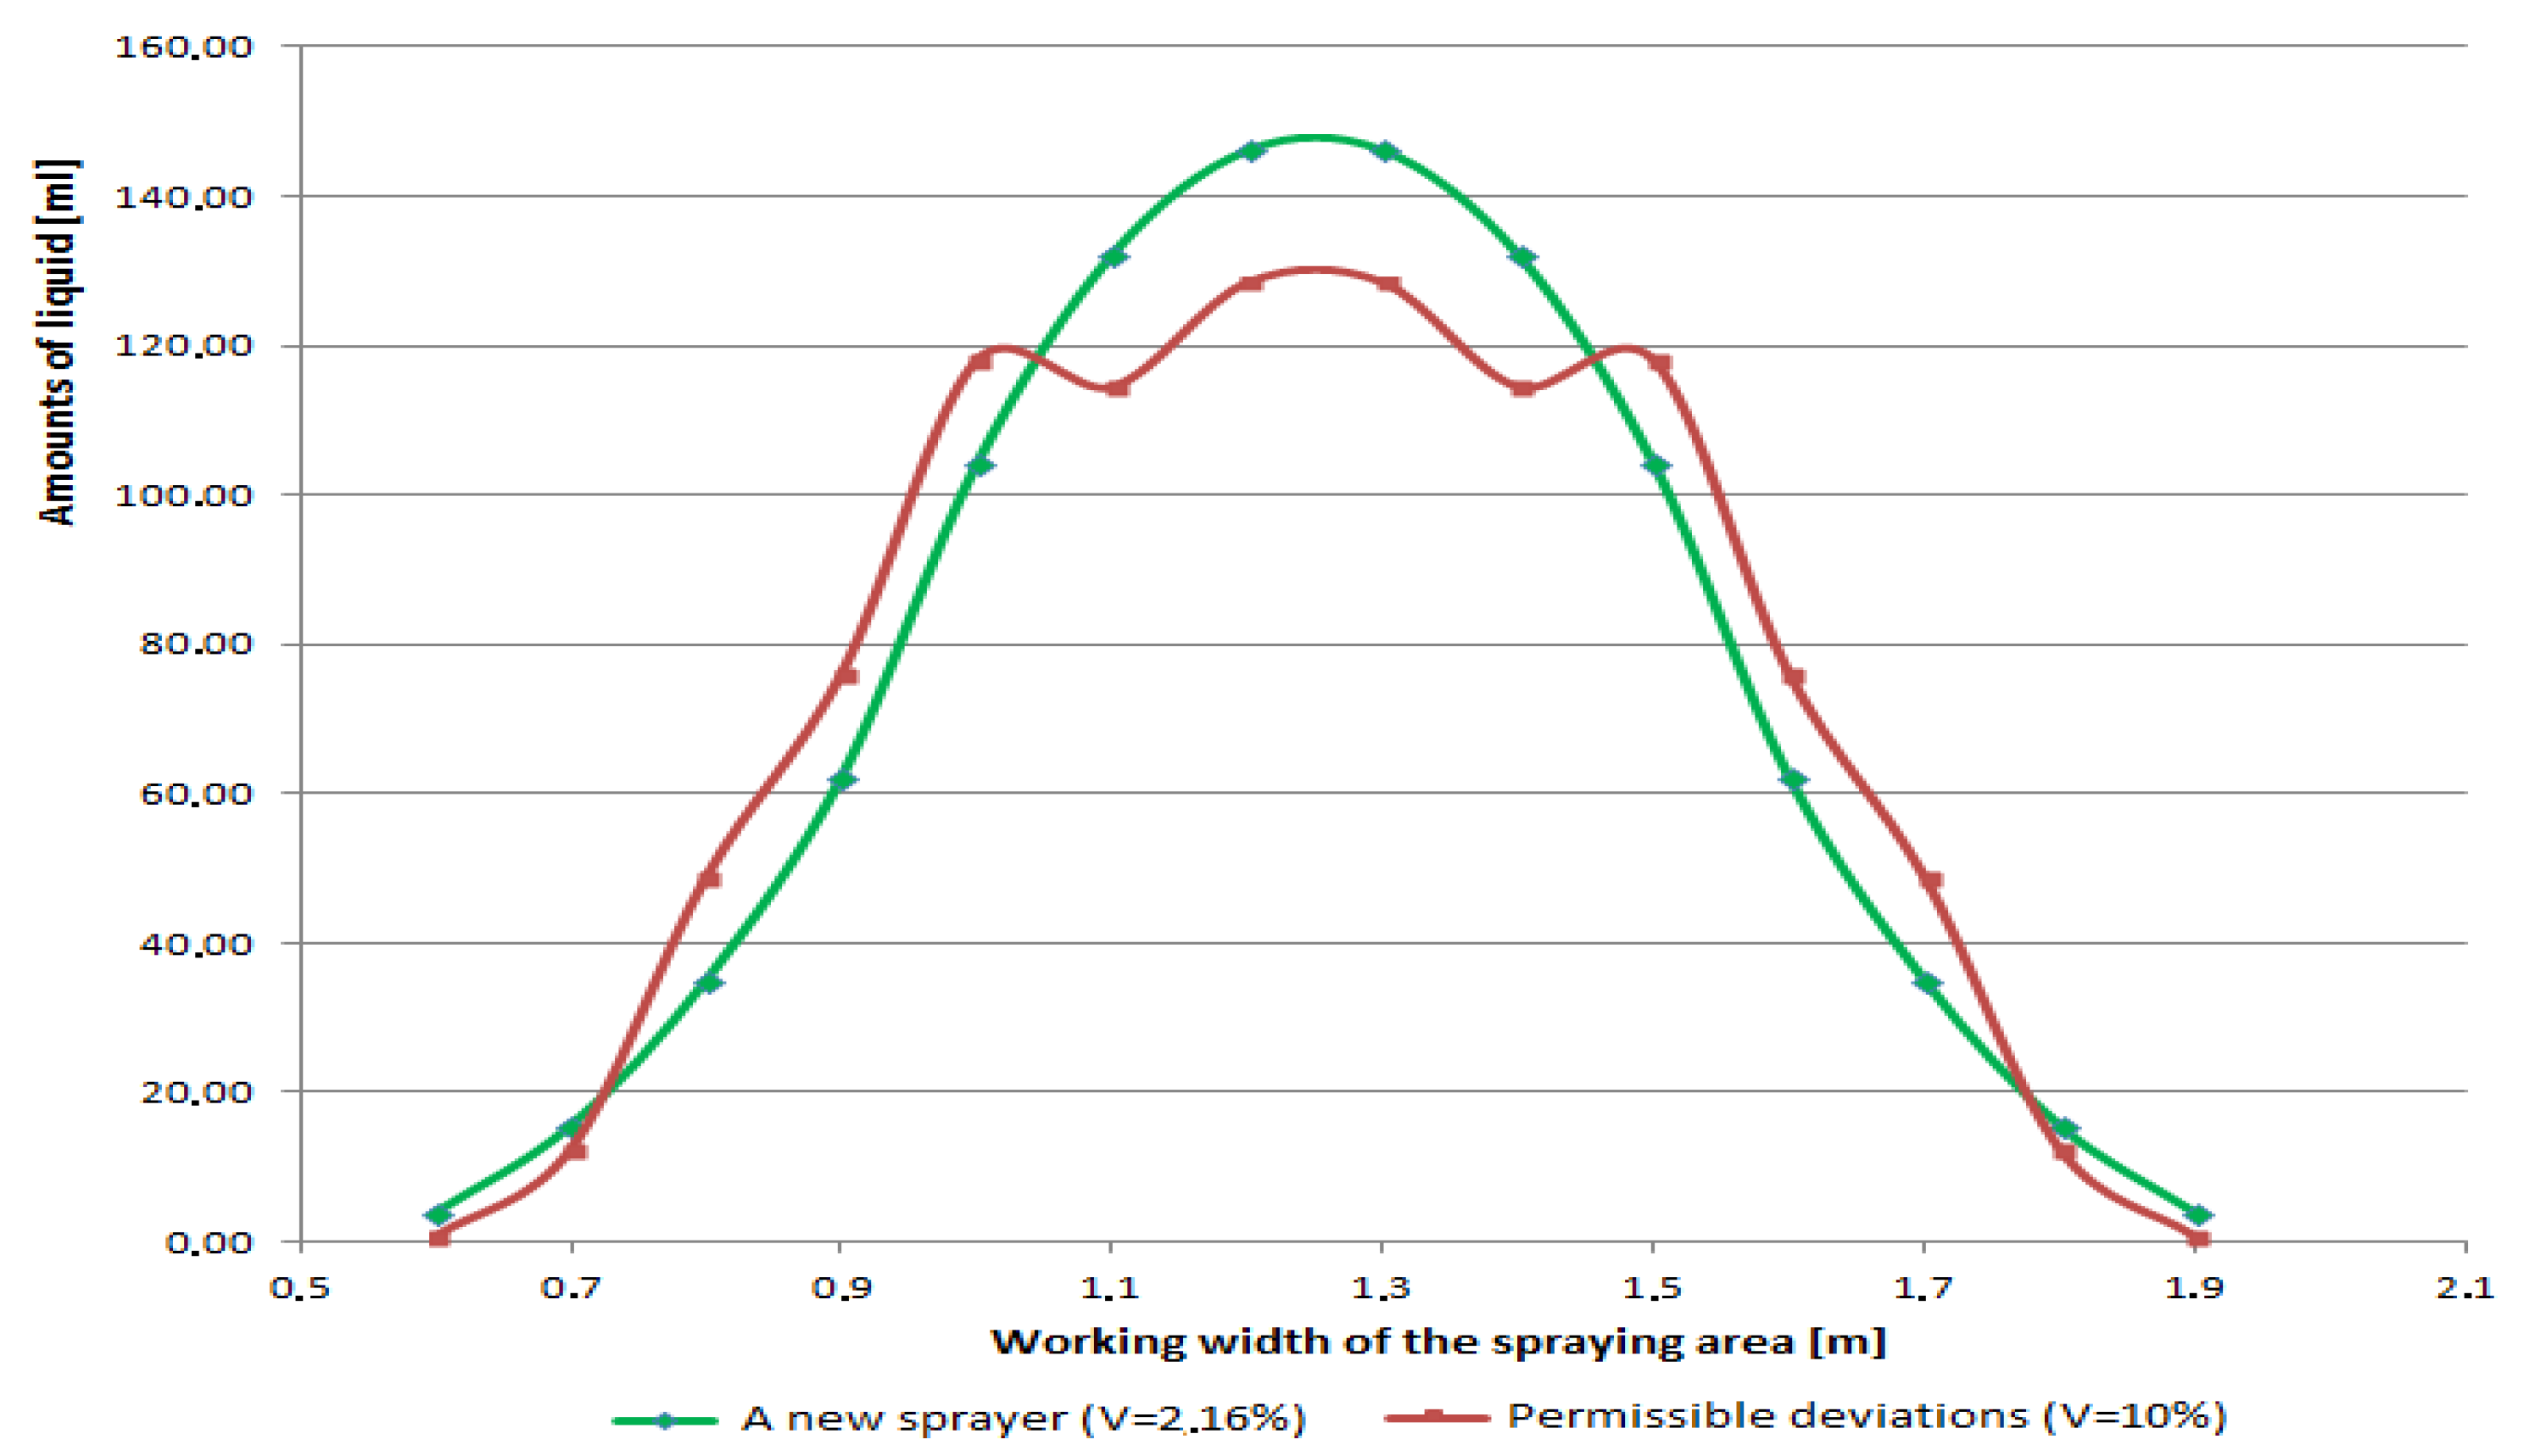
To present the conditions under which producers test new nozzles, a similar analysis of data was carried out for a model simulating measurements from the table with 10 cm groove spacing. The simulation amounts of liquids from the new nozzle were compared to those from the nozzle with 10% wear (Figure 10).
Next, following the results presented above, as in the case of the measurement table with 5 cm groove spacing, Table 3 and Table 4 were compiled to show the simulations of the moderate or permissible nozzle wear. Examples (Figure 11) were prepared to present the mean ranges of deviations indicating the wear of the analyzed nozzle in accordance with the adopted model.
The analysis of the results shown in Table 1, Table 2, Table 3 and Table 4 and in Figure 5, Figure 6, Figure 7, Figure 8, Figure 9, Figure 10 and Figure 11 allows the conclusion that the greater amounts of liquid in the central spray area and the lower amounts on its left and right side indicate the higher degree of nozzle wear. This facilitates the assessment of the degree of wear relative to the quality of the produced model.
Based directly on the data obtained without the application of the new model, the amounts of liquid from two adjacent containers were added, which yielded results that could be obtained at the 10 cm groove spacing. Hence, the spraying treatment exhibited greater uniformity, as the minimum value of the coefficient of variation was 1.85%, which was lower than in the initial case by ca. 0.3%.
Additionally, similarly lower values were obtained for each nozzle wear degree, which are summarized in Table 5.
These findings confirm the thesis that a greater distance between the grooves reduces the value of the coefficient of variability of data [22].
4. Discussion
The spraying process is applied in various areas, for example in fuel spraying [23], in the precipitation profiles of a fixed spray-plate sprinkler [24], in aerial spray application based on thermal imaging technology [25], and in evaluating irrigation system performance, which mainly depends on the uniformity of water application [26] or by using an unmanned aerial vehicle [27]. Another improvement introduced to examine the uniformity of spraying coverage was adding adjuvant to a liquid [28].
There are many factors that affect the uniformity of spray liquid coverage from spray nozzles, such as height of boom and nozzle pressure. The range of the coefficient of variation due to the height of the nozzle ranges from 8% to 17.6%, due to nozzle pressure from 7.6% to 20.3%, and for fixed height and nozzle pressure from 7.2% to 21.3% [29].
Coefficients of variation, in the case of repetitions performed with the same technique, were sometimes quite large, ranging from 7.5% to 24.0% [30], but we achieved with the same approach a value of this coefficient equal to 1.85%, as in Table 5.
When the technique of pulse width modulation is used, the coefficient of variation is around 10%. Increasing the signal means increasing the value of this factor [31]. In the same technique when for various kinds of nozzles the fixed pressure is equal to 207, 276, or 476 kPa, the values of the coefficient of variation range from 5.3% to 20.1% [32].
The best results of the uniformity were obtained in a wind tunnel and had values of CV from 0.5% to 7.6%, where 75% of all nozzle types tested had CV values below 4%. However, the use of water alone, like in our research, caused the largest differences in CV values [33]. In relation to the working width of the entire boom sprayer, the generated CV values were generally around 10% [34].
Considering the literature on the subject of the uniformity of field spraying and looking at the results achieved there, our model is the first one thanks to which we are able to forecast the permissible wear of the atomizer nozzle and then determine its usefulness.
5. Conclusions
The tools were designed and developed for the description and characterization of the distribution of the liquid amounts sprayed on an area with a specified size with the use of flat fan nozzles.
An original probability density function was proposed, which efficiently reflects the accumulation of the amounts of liquid sprayed from a single nozzle.
A new model of the distribution of the amounts of liquid after the spraying process was developed, yielding a minimum value of the coefficient of variation for the amount of liquid that ensures a very high uniformity of surface coverage.
The generation of the model of the distribution of sprayed liquid amounts simulating the operation of the new nozzle should help to maintain the accepted level of spraying uniformity as long as possible, which will allow the optimization of the process.
By the determination of the distribution of the spray ensured by the new nozzle with the use of the model, the level of nozzle wear can be assessed.
The application of the solution presented in this study will facilitate nozzle quality control consisting of the effective monitoring of wear degree and will contribute to the extension of nozzle service life, in compliance with accepted standards.
The results obtained from the model were standardized to the 10 cm spacing of the grooves on the measurement table, i.e., the distance for which manufacturers carry out tests and analyses of nozzles. This mode of presentation of the results will facilitate quality control aimed at the optimization of the field spraying process.
The solution of the research problem yielded a new diagnostic model as a tool for atomization and spray quality control and the assessment of nozzle wear. The model will have a positive effect on the quality, duration, and optimization of the field spraying process as well as the condition of the natural environment through the possibility of the application of an appropriate amount of sprayed agents.
Author Contributions
P.A.K. proposed the mathematical model and verified obtained data. I.K.-B. generally corrected the manuscript. S.P. provided data and formulated technical conclusions.
Funding
This research received no external funding.
Conflicts of Interest
The authors declare no conflict of interest.
References
- The European Parliament and the Council of the European Union. Directive 2009/128EC establishing a framework for Community action to achieve the sustainable use of pesticide. Off. J. EU 2009, 309, 71–86. [Google Scholar]
- Herbst, E.; Herbst, K. Ernst Herbst Pruftechnik e.K.-Plant protection equipment, test engineering, agricultural technology. Julius-Kühn-Archiv 2010, 426, 127. [Google Scholar]
- Lodwik, D.; Pietrzyk, J. Automated Test Station for Transverse Spray Non-Uniformity. J. Res. Appl. Agric. Eng. 2013, 58, 103–106. [Google Scholar]
- International Standarization Organization (ISO). ISO 16119. In Agriculture and Forest Machinery–Environmental Requirements for Sprayers—Part 2; ISO: Geneva, Switzerland, 2013. [Google Scholar]
- Mawer, C.J.; Miller, P.C.H. Effect of roll angle and nozzle spray pattern on the uniformity of spray volume distribution below a boom. Crop Prot. 1989, 8, 217–222. [Google Scholar] [CrossRef]
- Nowakowski, T. Interaction between selected spraying parameters on the variability coefficient of liquid transverse distribution. Agric. Eng. 2007, 3, 135–141. [Google Scholar]
- Nowakowski, T.; Chlebowski, J. The impact of liquid pressure and design of fan atomizers on spraying angle. Agric. Eng. 2008, 1, 319–323. [Google Scholar]
- Nuyttens, D.; Baetens, K.; De Schampheleire, M.; Sonck, B. Effect of nozzle type, size and pressure on spray droplet characteristics. Biosyst. Eng. 2007, 97, 333–345. [Google Scholar] [CrossRef]
- Parafiniuk, S.; Sawa, J.; Huyghebaert, B. The evaluation of the technical condition of the field toolbar of the spraying machine with the use of the method of survey of selected sprayers. Agric. Eng. 2011, 5, 207–215. [Google Scholar]
- Parafiniuk, S.; Tarasińska, J. Work simulation of the sprayer field boom with the use of R program. J. Cent. Eur. Agric. 2013, 14, 166–175. [Google Scholar] [CrossRef]
- Rojek, G. Analysis Of The Spray Distribution And Coverage In Variable Working Conditions of Selected Nozzles. Ph.D. Thesis, University of Life Sciences in Wroclaw, Wroclaw, Poland, 2013. [Google Scholar]
- Szewczyk, A.; Wilczok, G. Theoretical and actual liquid distribution for selected atomizer setting parameters. Agric. Eng. 2007, 8, 265–271. [Google Scholar]
- Zhu, H.; Rowland, D.L.; Dorner, J.W.; Derksen, R.C.; Sorensen, R.B. Influence of Plant Structure, Orifice Size, and Nozzle Inclination on Spray Penetration into Peanut Canopy. Trans. ASAE 2002, 45, 1295–1301. [Google Scholar]
- Szewczyk, A.; Wilczok, G. Theoretical description of sprayed liquid distribution in conditions of frontal air stream operation. Agric. Eng. 2008, 5, 292–299. [Google Scholar]
- Wilczok, G. Analysis of Spray Liquid Distribution during Spraying in Variable Working Conditions of Sprayers. Ph.D. Thesis, University of Life Sciences in Wroclaw, Wroclaw, Poland, 2008. [Google Scholar]
- Świechowski, W.; Hołownicki, R.; Doruchowski, G.; Godyń, A. Comparison of the methods evaluating flat spraying nozzles. Probl. Agric. Eng. 2006, 4, 5–12. [Google Scholar]
- Nation, H.J. Spray nozzle performance and effects of boom height on distribution. In Departmental Note n° DN/S/777/1925; National Institute of Agricultural Engineering Silsoe: Wrest Park, Silsoe, Bedford, UK, 1976; unpublished. [Google Scholar]
- Mawer, C.J. The Effect of Nozzle Characteristics and Boom Attitude on the Volume Distribution below a Boom; Div. Note DN 1462; AFRC Institute of Engineering Research: Silsoe, Bedford, UK, 1988. [Google Scholar]
- Leunda, P.; Debouche, C.; Caussin, R. Predicting the transverse volume distribution under an agricultural spray boom. Crop Prot. 1990, 9, 111–114. [Google Scholar]
- Sinfort, N.; Bellon, V.; Sevila, F. Image analysis for in-flow measurement of particle size. Food Control 1992, 3, 84–90. [Google Scholar] [CrossRef]
- Huyghebaert, B. Verification of Measurement Methods of Flat Fan Nozzles Working Parameters Used in Agriculture. Ph.D. Thesis, University of Life Sciences in Lublin, Lublin, Poland, 2015. [Google Scholar]
- Sawa, J.; Kubacki, K.; Huyghebaert, B. Equivalence of the criteria of assessing results of tests in legalizing crop sprayers. Agric. Eng. 2001, 4, 1. [Google Scholar]
- Li, T.; Nishida, K.; Hiroyasu, H. Droplet size distribution and evaporation characteristics of fuel spray by a swirl type atomizer. Fuel 2011, 90, 2367–2376. [Google Scholar] [CrossRef]
- Sayyadi, H.; Nazemi, A.H.; Sadraddini, A.A. Characterising droplets and precipitation profiles of a fixed spray-plate sprinkler. Biosyst. Eng. 2014, 119, 13–24. [Google Scholar] [CrossRef]
- Jiao, L.; Dong, D.; Feng, H.; Zhao, X.; Chen, L. Monitoring spray drift in aerial spray application based on infrared thermal imaging technology. Comput. Electron. Agric. 2016, 121, 135–140. [Google Scholar] [CrossRef]
- Irmak, S.; Odhiambo, L.O.; Kranz, W.L.; Eisenhauer, D.E. Irrigation Efficiency and Uniformity, and Crop Water Use Efficiency. Biol. Syst. Eng. Pap. Publ. 2011, 451, 1–8. [Google Scholar]
- Xue, X.; Lan, Y.; Sun, Z.; Chang, C.; Hoffmann, W.C. Develop an unmanned aerial vehicle based automatic aerial spraying system. Comput. Electron. Agric. 2016, 128, 58–66. [Google Scholar] [CrossRef]
- Griesang, F.; Decaro, R.A.; dos Santos, C.A.M.; Souza Santos, E.; de Lima Roque, N.H.; da Costa Ferreira, M. How Much Do Adjuvant and Nozzles Models Reduce the Spraying Drift? Drift in Agricultural Spraying. Am. J. Plant Sci. 2017, 8, 2785–2794. [Google Scholar] [CrossRef]
- Sehsah, E.M.E.; Kleisinger, S. Study of some parameters affecting spray distribution uniformity pattern. MJ Agric. Eng. 2009, 26, 69–93. [Google Scholar]
- Nuyttens, D.; Zwertvaegher, I.K.A.; Dekeyser, D. Spray drift assessment of different application techniques using a drift test bench and comparison with other assessment methods. Biosyst. Eng. 2017, 154, 14–24. [Google Scholar] [CrossRef]
- Mangus, D.L.; Sharda, A.; Engelhardt, A.; Flippo, D.; Strasser, R.; Luck, J.D.; Griffin, T. Analyzing the nozzle spray fan pattern of an agriculture sprayer using puls width modulation technology to generate an on-ground coverage map. Trans. ASABE 2017, 60, 315–325. [Google Scholar] [CrossRef]
- Butts, T.R.; Luck, J.D.; Fritz, B.K.; Hofmann, W.C.; Kruger, G.R. Evaluation of spray pattern uniformity using three unique analyses as impacted by nozzle, pressure, and pulse-width modulation duty cycle. Pest. Manag. Sci. 2019, 75, 1875–1886. [Google Scholar] [CrossRef] [PubMed]
- Ferguson, J.C.; O’Donnel, C.C.; Chauhan, B.S.; Adkins, S.W.; Kruger, G.R.; Wang, R.; Ferreira, P.H.U.; Hewitt, A.J. Determining the uniformity and consistency of droplet size across spray drift reducing nozzles in a wind tunnel. Crop Prot. 2015, 76, 1–6. [Google Scholar] [CrossRef]
- Balsari, P.; Gil, E.; Marucco, P.; van de Zande, J.C.; Nuyttens, D.; Herbst, A.; Gallart, M. Field-crop-sprayer potential drift measured using test bench: Effects of boom height and nozzle type. Biosyst. Eng. 2017, 154, 3–13. [Google Scholar] [CrossRef] [Green Version]
Figure 1.
Measurement table (Department of Machinery Exploitation and Management of Production Processes, University of Life Sciences in Lublin).
Figure 1.
Measurement table (Department of Machinery Exploitation and Management of Production Processes, University of Life Sciences in Lublin).

Figure 2.
Data collection scheme (final stage 3).

Figure 3.
Example of the fit of results in selected models to real spray data [21].
Figure 3.
Example of the fit of results in selected models to real spray data [21].

Figure 4.
Correlation diagram of the amounts of liquid after the spray from a boom characterized by a 9.37% wear degree (axis OX) and from a boom equipped with the new spray nozzles (axis OY).
Figure 4.
Correlation diagram of the amounts of liquid after the spray from a boom characterized by a 9.37% wear degree (axis OX) and from a boom equipped with the new spray nozzles (axis OY).

Figure 5.
Liquid amounts from the boom equipped with the new nozzles and from the selected virtual boom.
Figure 5.
Liquid amounts from the boom equipped with the new nozzles and from the selected virtual boom.

Figure 6.
Amounts of liquid sprayed with one nozzle generating V = 2.16% (new) and V = 10% (p = 4, q = 2).
Figure 6.
Amounts of liquid sprayed with one nozzle generating V = 2.16% (new) and V = 10% (p = 4, q = 2).

Figure 7.
Amounts of liquid sprayed with one nozzle generating V = 2.16% (new) and V = 10% (p = 3, q = 2).
Figure 7.
Amounts of liquid sprayed with one nozzle generating V = 2.16% (new) and V = 10% (p = 3, q = 2).

Figure 8.
Permissible average ranges of deviations of the amounts of liquid sprayed by the new nozzle (p = 4, q = 2).
Figure 8.
Permissible average ranges of deviations of the amounts of liquid sprayed by the new nozzle (p = 4, q = 2).

Figure 9.
Permissible average ranges of deviations of the amounts of liquid sprayed by the new nozzle (p = 3, q = 2).
Figure 9.
Permissible average ranges of deviations of the amounts of liquid sprayed by the new nozzle (p = 3, q = 2).

Figure 10.
Amounts of liquid sprayed with one nozzle generating a value of the coefficient of variation of V = 2.16% and V = 10% on the boom: (a): p = 4, q = 2; (b): p = 3, q = 2.
Figure 10.
Amounts of liquid sprayed with one nozzle generating a value of the coefficient of variation of V = 2.16% and V = 10% on the boom: (a): p = 4, q = 2; (b): p = 3, q = 2.

Figure 11.
Permissible mean ranges of deviations for the amounts of liquid sprayed by the new nozzle (p = 3, q = 2).
Figure 11.
Permissible mean ranges of deviations for the amounts of liquid sprayed by the new nozzle (p = 3, q = 2).


Table 1.
Changes in the amounts of liquid sprayed by the new nozzle yielding the relevant values of the coefficient of variation (p = 4, q = 2).
Table 1.
Changes in the amounts of liquid sprayed by the new nozzle yielding the relevant values of the coefficient of variation (p = 4, q = 2).
| Range [m] | No. of Containers | Mean Change [mL] | Coefficient of Variation |
|---|---|---|---|
| <0.6; 0.85> | 12–17 | −4 | 10% |
| <0.9; 1.6> | 18–32 | +3.4 | |
| <1.65; 1.9> | 33–38 | −4 |
Table 2.
Changes in the amounts of liquid sprayed by the new nozzle yielding the relevant values of the coefficient of variation (p = 3, q = 2).
Table 2.
Changes in the amounts of liquid sprayed by the new nozzle yielding the relevant values of the coefficient of variation (p = 3, q = 2).
| Range [m] | No. of Containers | Mean Change [mL] | Coefficient of Variation |
|---|---|---|---|
| <0.6; 0.85> | 12–17 | −5.6 | 10% |
| <0.9; 1.6> | 18–32 | +4.7 | |
| <1.65; 1.9> | 33–38 | −5.6 |
Table 3.
Changes in the amounts of liquid sprayed by the new nozzle yielding the relevant values of the coefficient of variation (p = 4, q = 2).
Table 3.
Changes in the amounts of liquid sprayed by the new nozzle yielding the relevant values of the coefficient of variation (p = 4, q = 2).
| Range [m] | No. of Containers | Mean Change [mL] | Coefficient of Variation |
|---|---|---|---|
| <0.6; 0.9> | 6–9 | −9.8 | 10% |
| <1; 1.5> | 10–15 | +3.8 | |
| <1.6; 1.9> | 16–19 | −9.8 |
Table 4.
Changes in the amounts of liquid sprayed by the new nozzle yielding the relevant values of the coefficient of variation (p = 3, q = 2).
Table 4.
Changes in the amounts of liquid sprayed by the new nozzle yielding the relevant values of the coefficient of variation (p = 3, q = 2).
| Range [m] | No. of Containers | Mean Change [mL] | Coefficient of Variation |
|---|---|---|---|
| <0.6; 0.7> | 6–8 | −3.1 | 10% |
| <0.8; 1> | 9–10 | +13.9 | |
| <1.1; 1.4> | 11–14 | −17.7 | |
| <1.5; 1.7> | 15–16 | +13.9 | |
| <1.8; 1.9> | 17–19 | −3.1 |
Table 5.
Comparison of the coefficients of variation for different nozzle wear degrees at the 5 cm and 10 cm groove spacing.
Table 5.
Comparison of the coefficients of variation for different nozzle wear degrees at the 5 cm and 10 cm groove spacing.
| Mean Wear | Permissible Wear | ||||
|---|---|---|---|---|---|
| p | 2 | 3 | 4 | 3 | 4 |
| q | 2 | 2 | 2 | 2 | 2 |
| V10cm | 1.85% | 4.74% | 4.61% | 9.43% | 9.52% |
| V5cm | 2.16% | 5% | 5% | 10% | 10% |
© 2019 by the authors. Licensee MDPI, Basel, Switzerland. This article is an open access article distributed under the terms and conditions of the Creative Commons Attribution (CC BY) license (http://creativecommons.org/licenses/by/4.0/).
Share and Cite
MDPI and ACS Style
Kluza, P.A.; Kuna-Broniowska, I.; Parafiniuk, S. Modeling and Prediction of the Uniformity of Spray Liquid Coverage from Flat Fan Spray Nozzles. Sustainability 2019, 11, 6716. https://0-doi-org.brum.beds.ac.uk/10.3390/su11236716
AMA Style
Kluza PA, Kuna-Broniowska I, Parafiniuk S. Modeling and Prediction of the Uniformity of Spray Liquid Coverage from Flat Fan Spray Nozzles. Sustainability. 2019; 11(23):6716. https://0-doi-org.brum.beds.ac.uk/10.3390/su11236716
Chicago/Turabian StyleKluza, Paweł A., Izabela Kuna-Broniowska, and Stanisław Parafiniuk. 2019. "Modeling and Prediction of the Uniformity of Spray Liquid Coverage from Flat Fan Spray Nozzles" Sustainability 11, no. 23: 6716. https://0-doi-org.brum.beds.ac.uk/10.3390/su11236716
Note that from the first issue of 2016, this journal uses article numbers instead of page numbers. See further details here.