Article

Proposing a Value Field Model for Predicting Homebuyers’ Purchasing Behavior of Green Residential Buildings: A Case Study in China

1
College of Economy and Management, Nanjing Institute of Technology, Nanjing 211167, China
2
College of Civil Engineering, Southeast University, Nanjing 211189, China
3
School of Civil Engineering, Nanjing University of Technology, Nanjing 211816, China
*
Authors to whom correspondence should be addressed.
Sustainability 2019, 11(23), 6877; https://0-doi-org.brum.beds.ac.uk/10.3390/su11236877
Submission received: 23 September 2019 / Revised: 19 November 2019 / Accepted: 19 November 2019 / Published: 3 December 2019

Abstract

:
Understanding the motivations that stimulate homebuyers’ green purchasing behavior can increase market demand for green products, especially considering the comparably low market share of green products worldwide. In this context, various studies have been conducted examining consumers’ intentions to pay for green products. Nevertheless, there is still limited research on evaluating homebuyers’ purchasing behavior toward green residential buildings. This study argues that the value of green residential buildings (GRBs) affects their adoption, and thus exerts an invisible force on homebuyers’ purchasing behavior. It also finds that field theory provides a scientific perspective on this phenomenon. Thus, this paper proposes a value field model for evaluating homebuyers’ GRB purchasing behavior based on physical field theory and psychology field theory. In particular, physical field theory provides the measurement formula, while psychological field theory explains the effect of the force stimulating homebuyers’ purchasing intention, and ultimately influencing their purchasing behavior. The initial model consisted of a field source (green perceived value), target charge (GRB demand), distance (psychological distance), and value field factor. As the value field factor was calculated to be approximately equal to 1, the final model is a composite of a field source (green perceived value), target charge (GRB demand), and distance (psychological distance). The results validate the construction of the value field model on the basis of field theory. This research contributes to the body of knowledge by analyzing GRB value and provides a clearer understanding of how GRBs and the environment combine to fulfill homebuyers’ requirements and influence their GRB purchasing behavior.

1. Introduction

The construction industry is one of the largest emitters of greenhouse gases and the energy consumed by this industry accounts for 40% of energy consumption worldwide [1,2]. The increased awareness of the built environment crisis is substantially changing the construction industry. Green building (GB) is one of the measures that have been put forward to mitigate the significant impacts of the building stock on the environment, society, and the economy. Despite many different definitions of GB, it is generally accepted as the design, construction, and operation of buildings with a maximum conservation of resources, protection of the environment, reduction of pollution, and healthy living environment [3]. Green building promotion in China has a profound global influence because of the construction boom as part of the rapid urbanization. Thus, promoting green buildings has become critical to sustainable development, especially in China [3]. The Chinese government has formulated GB codes and regulations and provides financial and nonfinancial incentives. For instance, the Chinese Ministry of Housing and Urban-Rural Development established databases for GB technologies, products, and materials named the “Technical Guidance for Green Building Promotion.”
Green residential buildings (GRBs) are the result of green practices in the residential sector, which are especially important in China due to the high proportion of residential buildings. However, promoting GRBs faces greater challenges than commercial buildings [4]. Developers of green commercial buildings hold and operate buildings by themselves, thus evaluate the net benefit from the whole life-cycle perspective. On the contrary, GRBs are always sold to households after completion, making homebuyers’ payment the only source of developers’ rewards from green practice [5]. As most homebuyers lack the ability to calculate life-cycle benefits, the future benefits of green housing may not be fully understood in the transaction prices [6]. Such risks lead to the low market demand for GRBs, which hindered developers wanting to build green [3]. This potential market failure makes analyzing homebuyers’ purchasing behavior of GRBs especially important in the Chinese green housing sector [4].
Research has indicated that a GRB’s value can be defined as a measurement that represents the significance and importance of green properties in satisfying homebuyers’ value requirements, which is a key explanatory factor in the decision to adopt a GRB [7,8]. However, current studies about green buildings mainly focus on environmental assessment tools and methods [9,10], technology and energy research [11,12], incentive measures and developmental policy [13,14], and local case studies [15]. Few researchers have paid adequate attention to the theoretical and empirical study of GRB value [16]. Additionally, although various empirical studies analyzed the drivers of homebuyers’ acceptance of GRBs based on questionnaire surveys, case studies, and interviews [16], only a few studies had been conducted until very recently, and most of them were conducted on the purchasing behavior toward GRBs in developed nations [4,17]. Such research is lacking for developing nations, such as China, where the lack of broad acceptance of GRBs has become a major barrier to the GRB movement. Besides the factors that have been well documented by these studies (e.g., appeal and emotions, psychological influence, beliefs), this paper further examines how these factors work together to influence homebuyers’ acceptance of GRBs.
The main theoretical contribution of the present research is the analysis of the driving force of homebuyers’ purchasing behavior of GRBs based on the GRB value and field theory, which stress the relationship within the construct involving various factors. The purpose of this paper is to identify the prominent drivers of homebuyers’ GRB purchasing behavior by answering the following research questions:
  • What are the actual indicators that influence GRB purchasing behavior?
  • What is the invisible driving force influencing homebuyers’ GRB purchasing behavior?
  • How can the invisible driving force with respect to the above factors be expressed?
To answer these questions, this paper proposes a value field model based on a literature review and further study using structural equation modeling. Furthermore, fuzzy synthetic evaluation was applied to gain further understanding of the proposed model. The model sheds light on how well GRBs function and affect the homebuyers. Moreover, we expect that the study’s results will provide clear directives for housing developers and policymakers regarding what approaches will be more effective in motivating the market demand for GRBs.
The academic literature has employed terms such as “GRB purchasing,” “adoption or acceptance of GRBs,” and “GRBs acquisition” to express consumers’ GRB purchasing behavior. In this paper, adoption or acceptance of GRBs will be utilized. The remainder of this paper is organized as follows: Section 2 presents the research background, Section 3 discusses the value field model, Section 4 describes the research methodology (including data collection, data analysis, and case study), Section 5 describes the results and discussions, and Section 6 provides concluding remarks.

2. Background

2.1. Green Purchasing Behavior

Green purchasing behavior generally includes buying environmentally-friendly products, supporting green organizations, and adopting sustainable consumption practices [18]. In seeking to explain green purchasing behavior, earlier research focused on the structure of ecological concerns, the underlying influencing indicators (demographic, personality, knowledge, values, attitude), and the relationship between ecological concerns and green purchasing behavior [19]. The theory of reasoned action (TRA) [20] and the theory of planned behavior (TPB) [21] are the two prominent theories followed by most of the studies. However, studies have found that environmental attitudes do not always affect purchasing behavior and this phenomenon is generally referred to as the attitude–behavioral gap [22]. Green purchasing behavior is complex and is influenced by a multitude of factors, especially for GRBs. For example, consumer GRB purchasing behavior may be affected by peer opinion [23]. Such behavior could be also influenced by the promotion by governments and green organizations. Yu et al. [24] argued that if governments and green corporations provide subsidies or promotions, consumers will be inclined to “go green”. The features of green products (e.g., low pollution, recycled materials) may also arouse consumers’ feeling of doing something good for the environment [25]. Additionally, the overall environment for the development of GBs, such as the economy and social attitudes, also plays an important role in affecting consumers’ green purchasing behavior [26]. Nevertheless, the above studies have neither considered all the aspects of the influencing factors comprehensively nor analyzed how these factors work together to affect consumers’ green purchasing behavior.

2.2. Green Residential Building Value
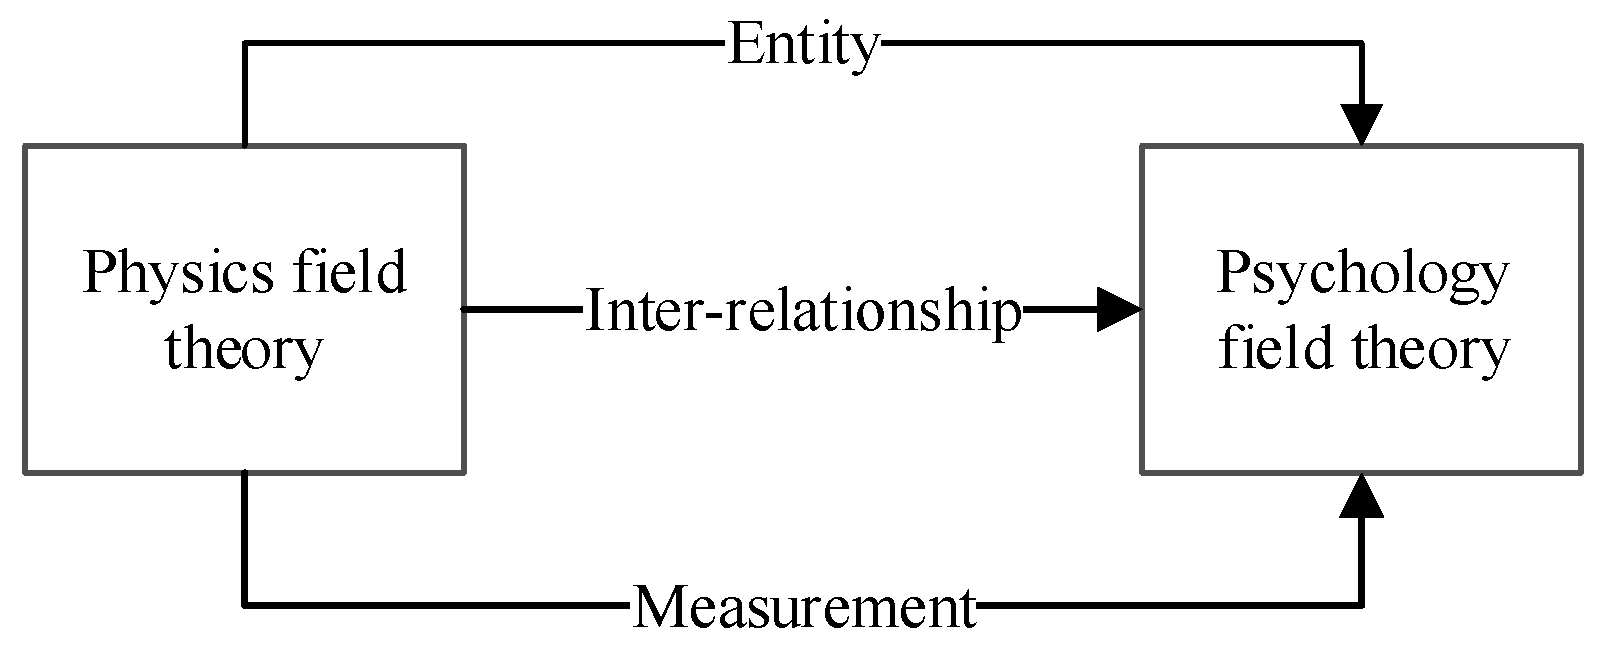
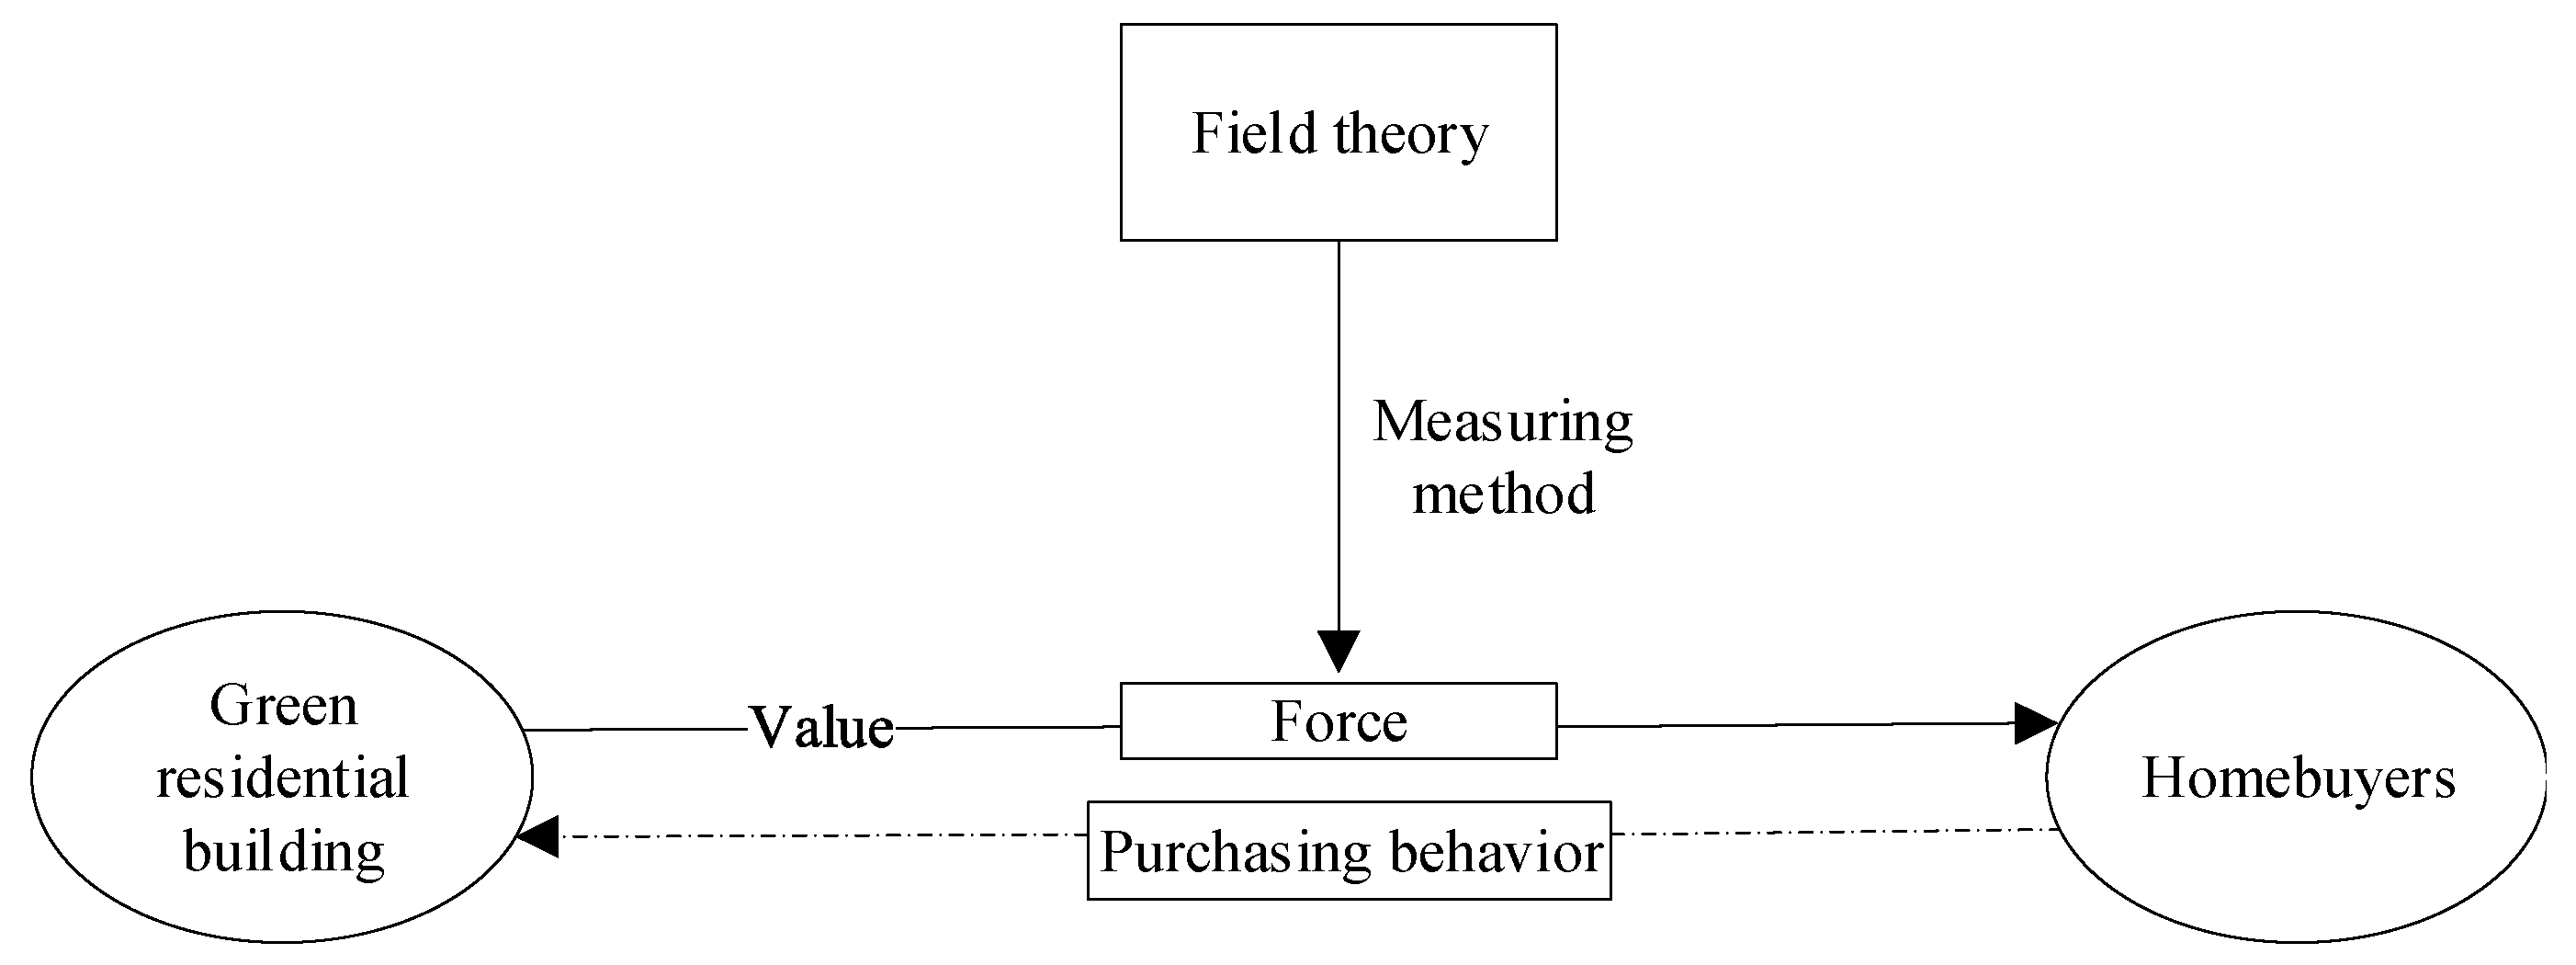
Value is a complex concept that carries a wide variety of meanings depending on the values and requirements of the homebuyers, the context in which value exists, and the type of value being discussed [27]. A dilemma that early value theorists and researchers faced was whether value (noun) should be investigated from the perspective of the entity being evaluated (e.g., “How much value does the entity have?”) or from the perspective of the person doing the valuing (beliefs).
The fundamental objective of any infrastructure, including GRBs, is to deliver value to humans [28]. Value delivered by a specific construction project influences society in a broad sense and provides benefits for future generations. Moreover, value delivered by particular projects also affects those judgments concerning future projects and contributes to the long-term improvement of the construction sector’s performance [29]. Thus, it is meaningful to understand GRB value from the perspective of homebuyers in an effort to understand the underlying motivations shaping people’s attitudes and behaviors toward their environment. However, there is still no clarity or consensus about the definition of GRB value. Womack et al. pointed out that the definition of value can be meaningful only when it is defined from the consumers’ perspective [30]. Hence, in construction projects, value can be viewed from the homebuyer’s or end-user’s perspective. Based on past research [31], GRB value can be defined as a measure that represents the significance and importance of green properties in satisfying end-users’ value requirements. It has been regarded as a key exploratory factor in explaining decision-making [8]. In this sense, GRB value serves as a connecting link between GRBs and homebuyers.
Research on GB value has focused on different aspects between Western countries and China. In developed countries, studies about GB value mainly focused on its price. For example, Georg Fröch pointed out that a sustainable project’s value is the combination of the market value and the sustainable features [32]. Aizenman and Jinjarak stated that green building’s value is associated with economic benefits [33]. Thus, the related research on the valuation of green buildings are also price-focused [34]. Only a few researchers focused on the utility value of green buildings including two aspects, namely the green building’s properties and consumers’ features. Generally, transportation [35], the natural environment [36], and the humanity environment [37] are important contributors to a green building’s value. As for the aspect of consumers’ features regarding their views toward green buildings, salary and family life-cycle stage were two critical factors [38]. However, most of these studies have only considered a single factor, instead of the interaction of multiple variables, including individual, green building, and the environment. There are also limited studies on the linking role of GRB value between GRBs and homebuyers.
Research has also indicated that one of the major factors in the performance gap of GRBs is homebuyers’ purchasing behavior [38]. Homebuyers are essential to understanding the value of buildings and facilitating value-sensitive decision-making in order to maximize the collective value of buildings. To narrow the performance gap and increase the GRB value, there is a need to construct a model that can state what affects purchasing behavior and how GB value contributes to such behavior.

2.3. Field Theory

Field theory originates in the physical sciences and continues to develop in the social sciences and other disciplines. This theory asserts that there exists an invisible force between matter and matter, just as in the case of a magnetic field, electromagnetic field, or gravitational field [39]. In physics, a field is a physical quantity that has a value for each point in space and time [40]. Physics field theory can be measured with Equation (1):
F = K   P Q R 2
where F is the field force, K is the dielectric constant, P is the electric quantity of field source, Q is the the electric quantity of target charge, and R is the distance between P and Q.
The field concept was first applied by Lewin in 1939 [41] to consider relationships in an attempt to concern the individual’s behavioral transactions with their internal and external environment in psychology. One of the fundamental statements of psychological field theory can be stated as follows: any behavior or any other change in a psychological field depends only on the psychological field at that time [41]. Lewin’s field theory can be expressed using Equation (2):
B = f ( p , e )
where B represents the behavior, p represents the person, and e represents the environment [42]. “Person” refers to an individual’s needs, beliefs, values, and abilities, as well as his perception of his relations to the environment [43]. The “environment,” it should be noted, is a person’s conscious and unconscious environment [43].
Although physics field theory and psychology field theory are different in terms of equations, physics field theory has connections with psychology field theory (Figure 1). First, the entity emphasized in physics field theory is also the basis of psychology field theory. Second, the inter-relationship studied in physics field theory explains the interaction between the person and their environment in psychology field theory. Third, Equation (2) suggests that behavior is the result of the individual interacting with their environment, which is actually shaped by the forces within the field, as measured by Equation (1).
The increasing trend where field theory has been applied in various disciplines in recent years makes the clarification of field theory only the more important. The clear clarification of field theory is conducive to its better application in new aspects. However, the scholars who have been advancing this field for many years have not successfully made the essence of this theory clear. In fact, physics and philosophy do not seem to have done much analytical work concerning the meaning of field. Specifically, if one proceeds in physics from a special law or theory (such as the law of the free-falling body) to more general theories (such as the Newtonian laws) or still more general theories (such as the equations of Maxwell), one does not finally come to field theory. In other words, “field” theory is not a theory in the usual sense. Essentially, field theorists in the non-physical subjects have attempted to consider field theory as the set of factors that are conceived as mutually interdependent [42]. That is to say, “field” as it is employed in the social and psychological sciences does not refer to theories about physical phenomena, for example, gravitational or electromagnetic phenomena; rather it refers to a method focusing on the relations of the components in a system and building scientific constructs [44].

3. Value Field Model

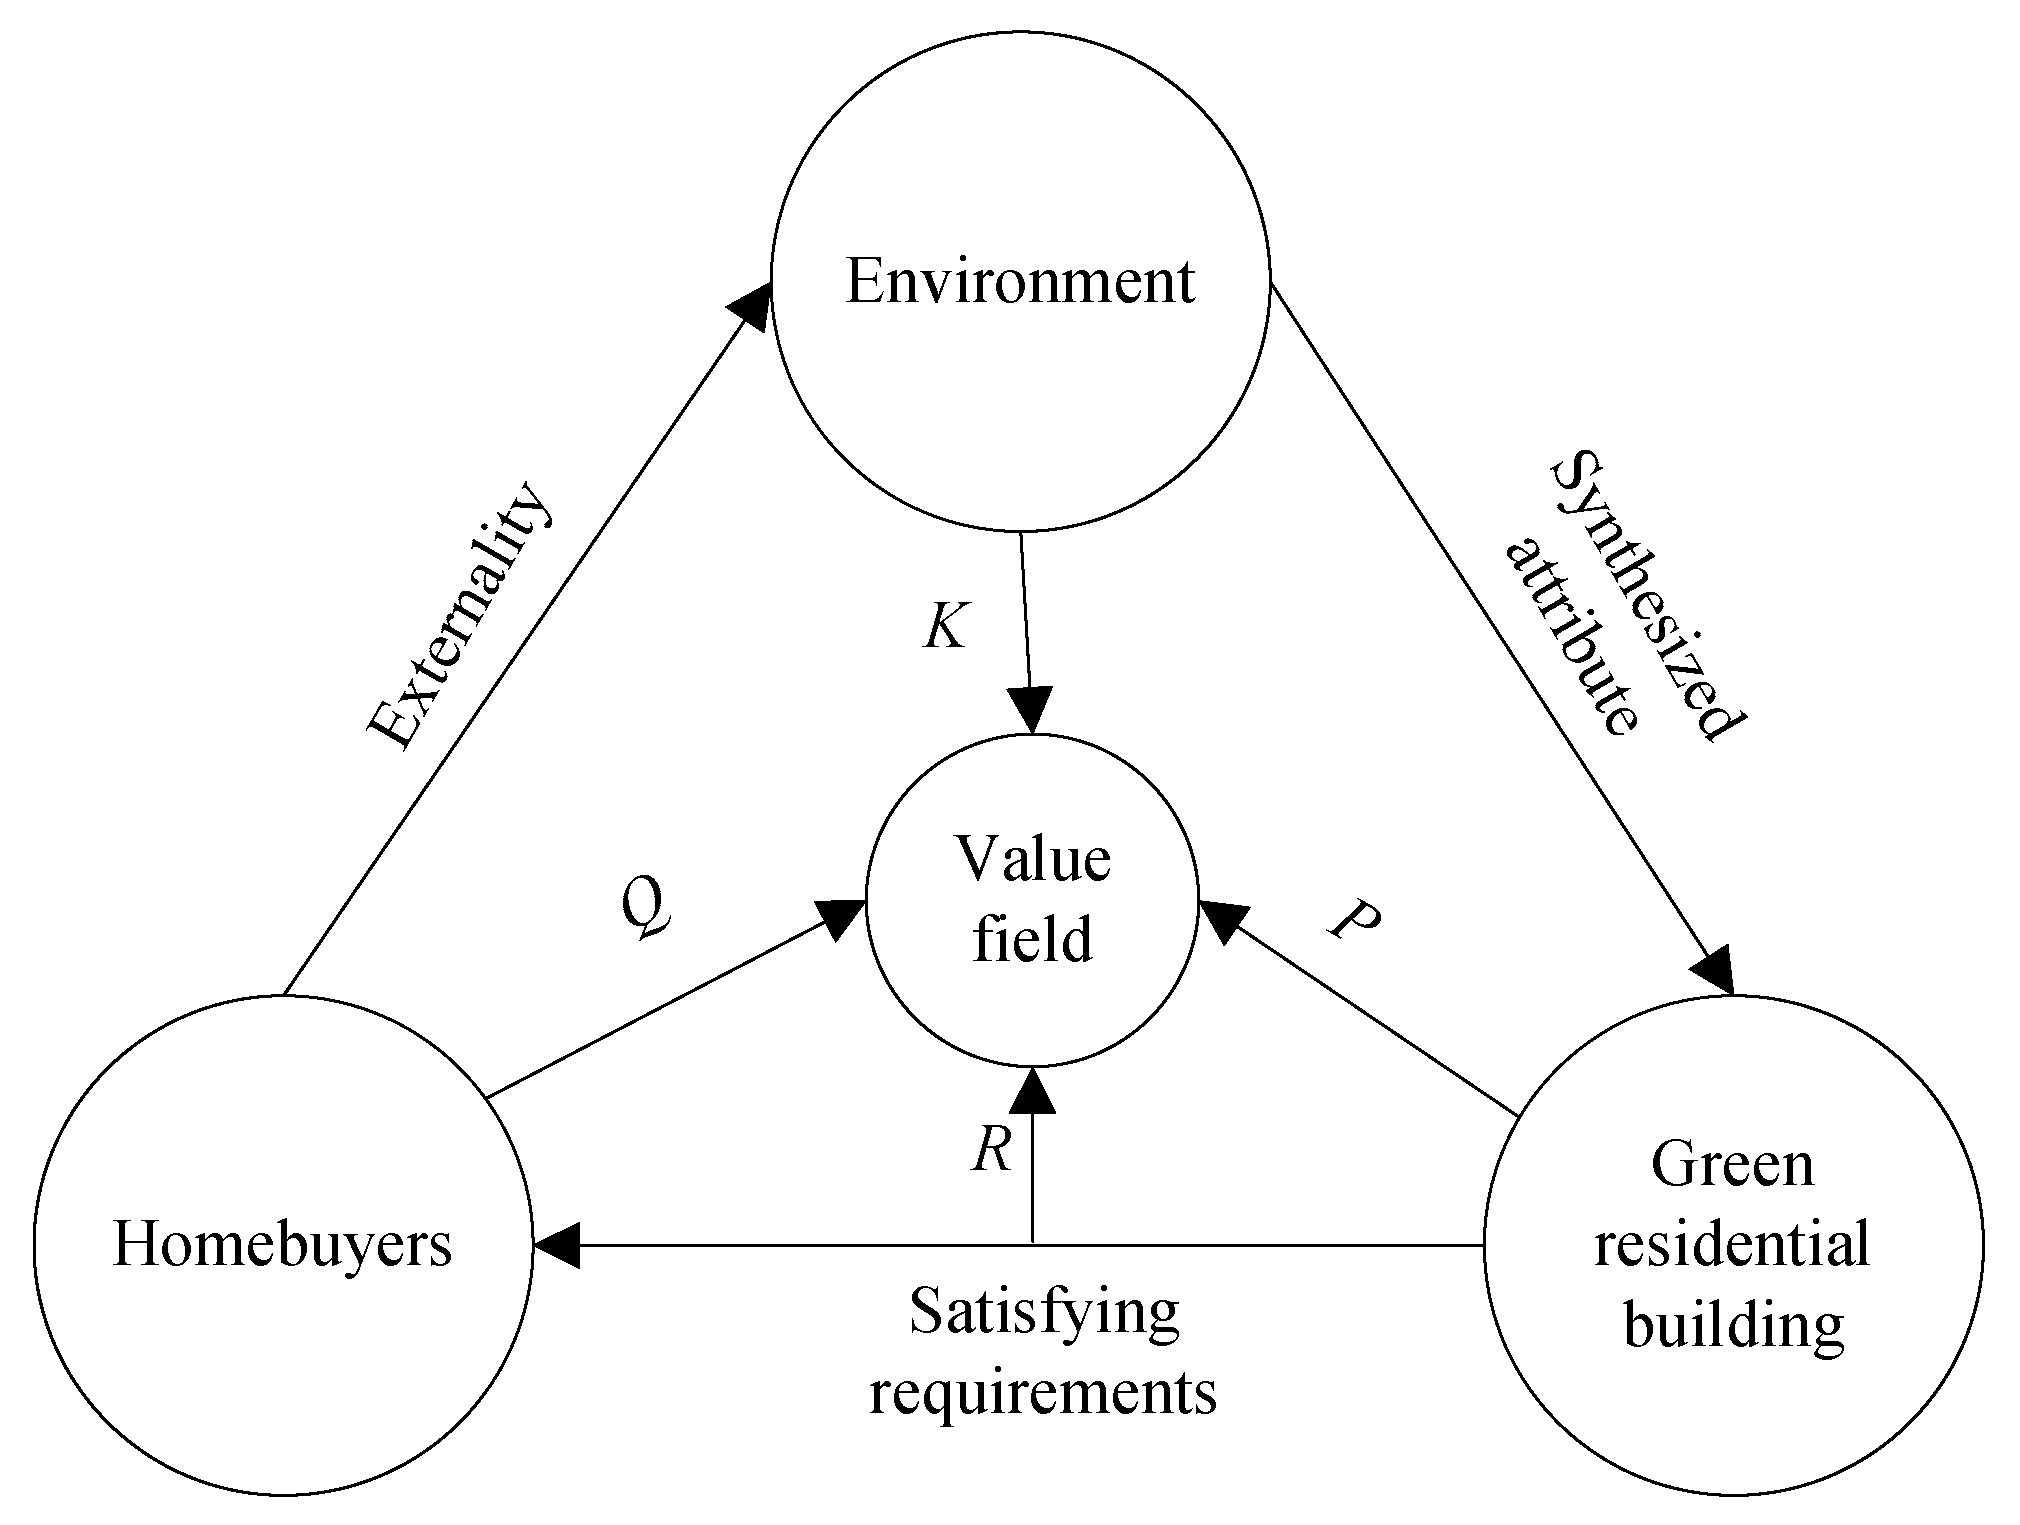
3.1. Understanding the Value Field

The statement that the field focuses on the relations among the components within a system suggests that “field” pertains to the invisible force between matter and matter. GRB value also exerts a force on homebuyers. Thus, the introduction of the term “value field” (VF) provides a scientific perspective for explaining the relations between GRBs and homebuyers. Having knowledge and a clear understanding of a value field is an initial step in constructing the model. As such, there are reasonable grounds for the introduction of the term.
Recent research points to a shift from focusing on the building itself to the interaction between buildings and homebuyers. VF is proposed under such a research trend in the construction industry, where there is a need for holistic and comprehensive tools, skills, and techniques for analyzing the relationship between GBs and homebuyers. Based on the principles of psychology field theory, GRB value acts as the connection between GRBs and homebuyers, affecting homebuyers’ adoption of GRBs. It can be measured using the force formula in Equation (1). The relationships among field theory, GRB, and homebuyers can be illustrated with Figure 2. A GRB consists of the building and its influencing environment. As shown in the figure, the value acts as the relation variable between GRBs and homebuyers. It exerts a force on homebuyers, encouraging them to purchase GRBs. Field theory provides a measuring method to find the strength of this force.
It should be clear that the environment brings together organizations, disciplines, and stakeholders with divergent value systems and influences. Thus, GRBs, the environment, and homebuyers constitute a system (see Figure 3). As shown in Figure 3, the environment (e.g., more convenient traffic and living facilities) is the synthesized attribute of GRB value besides the buildings’ own characteristics, which are represented by a value field factor (K). A GRB affects homebuyers’ green building purchasing behavior by satisfying the homebuyers’ requirements. It is represented by attribute P in Equation (1). Moreover, homebuyers’ GRB purchasing behavior has an external effect on the environment and homebuyers’ demand for GRB, which are represented by attribute Q in Equation (1). The distance between homebuyers and GRBs is represented by attribute R of the value field.
Based on the above analysis, the concept of a value field can be stated as a method that is used to calculate the effect between a human and a GRB with the system of GRBs, homebuyers, and environment.
The value field has the following merits: (1) entirety: GRBs, humans, and environment are viewed as an entity; (2) interactivity: GRB, being a platform, has multi-dimensional interactions with humans and the environment; (3) concreteness: being an invisible hand, the effect of GRBs on homebuyers can be expressed using field theory; (4) reasonability: the value of GRBs refers to a measure of the degree to which GRBs satisfy homebuyers’ requirements, which can be regarded as the effect of green buildings on homebuyers. It plays the same role as the field, acting as an invisible hand, which suggests the rationality of term “value field.”

3.2. Components of the GRB Value Field Model

A GRB value field is an application of a field in the building context. In physics, a field force is used to describe the influence of the field source on a target charge. Similarly, a value field force (F) expresses the interaction force between GRBs and homebuyers. As described in the physical Equation (1), a field force is determined by the electric quantity of the field source (P), the electric quantity of the target charge (Q), the distance (R), and dielectric constant (K). The data to find the dielectric constant (K) is selected objectively from official reports and statistical yearbooks about national economic and social development. Thus, the dielectric constant (K) must be calculated first in order to ascertain the overall environment for GRB development.
(1) Dielectric Constant (K)
Specifically, the dielectric constant (K) in the GRB value field refers to the synthesized attributes in the living environment contributing to the GRB value field and can be referred to as the value field factor. The selection of the items represented by the value field factor (K) arises from a study of the logistics field factor. Jin explained the logistics field factor as representing the attributes of the regional economy and logistics industrial environment [44]. It consists of five indicators, namely infrastructure, economic development level, logistics demand, industrial scale, and informatization level. The items represented by the value field factor can be constructed based on the building field factor introduced by Li [45], consisting of the transportation development level, economic development level, society development level, and housing demand. As shown in Table 1, 12 indicators of these four items were adapted to assess the living environment condition.
Six cities in China with a high development of GBs were selected: Beijing, Shanghai, Guangzhou, Shenzhen, Nanjing, and Tianjin. The original data used to find the value field factor was obtained from official reports, statistical yearbooks about national economic and social development, and related academic studies, as shown in Appendix A. For the convenience of comparison and calculation, the non-dimensionality of indicators are required to eliminate the influence of the dimension. The calculated equation and dimensionless variables of the value field factor are shown in Appendix A.
In order to avoid the interference of a subjective factor, this study applied the variation coefficient method to obtain the objective weight of the index. The weights of the indicators of K can be found in Appendix A. Based on the weights, the comprehensive evaluation value of K (Table 2) can be calculated using the following equation:
K = y = 1 Y B y ( x = 1 X C x y S x y ) ,
where B y is the weight of K y , C x y are the weights of K x y , and S x y are the dimensionless variables of the original data.
As shown in Table 2, the comprehensive evaluation value of K was approximately 1 in the selected cities. The value of K reflects the building development environment. For example, the value of K was equal to 0.9641 in Nanjing, which suggests that the building development environment in Nanjing is desirable.
(2) Hypotheses Development
As the value of the dielectric constant (K) was approximately 1, the value field model was modified to include the field source (P), electric quantity of target charge (Q), and distance (R).
It should be noted that the value field is based on physics field theory and psychology field theory, where physics field theory provides the understanding of the relationships among the elements of the value field, psychology field theory illustrates the effect of value field, and GRBs are the research object. Thus, the selection of the GRB value field components should focus on homebuyers’ requirements and the perceptions of GRBs.
  ① P—Green Perceived Value (GPV)
Customer perceived value has been applied as an important way of analyzing service quality, customer satisfaction, and consumer behavior. Many researchers have contributed to the development of customer perceived value from a green perspective [46,47]. For example, Chen and Chang introduced the concept of green perceived value (GPV) [47], which is the consumer’s evaluation as influenced by their green expectations and needs. It has been shown to contribute to the development of the relationship between consumers and green products through green satisfaction [47]. Therefore, GPV is suitable for examining homebuyers’ GRB purchasing behavior. In the value field, the “electric quantity” of the field source (GRB) acts as a positive element of the field force (i.e., the driving force of homebuyers’ purchasing behavior). Hence, GPV is appropriate for representing the “electric quantity” of the field source (GRB)
Ashton et al. [48] and Ariffin et al. [49] defined the GPV of a GRB as the set of attributes related to the consciousness of the GRB value. However, it is a subjective and ambiguous concept, so there is inconsistency in its measurement. In this sense, measurement of the GPV is constructed on the basis of customer perceived value (CPV) measurements and existing GPV measurements. Yieh et al. argued that it is necessary to measure CPV from a multidimensional perspective by encompassing the meaning of objects and the feelings of customers [50]. Sweeney and Soutar adopted a social value scale and emotional value scale as measurements of the CPV [51]. Moreover, Zeithaml emphasized the economic dimension of the CPV [52], while Hartmann et al. highlighted the functional and emotional benefits in understanding the GPV [53]. GRBs play a vital role in achieving environmental benefits. Therefore, the environment value should also be considered as a measure of the GPV. This study adapted five items from the above studies, namely functional value (P1), economic value (P2), emotional value (P3), environmental value (P4), and social value (P5). The factors of each dimension are presented in Table 3.
Functional value (P1) considers that the GRB quality and performance are desirable [54]. Economic value (P2) refers to the homebuyers’ perceived financial benefits [54]. Emotional value (P3) refers to the perceived GRB capability to arouse homebuyers’ feelings [55]. Environmental value (P4) represents the homebuyers’ perceptions of the utility of GRBs based on the perceived positive impact on the environment [56]. Social value (P5) stresses the benefits of the social image of GRB [57]. Therefore, the following hypotheses were formed:
Hypothesis 1 (H1).
The value field force is positively related to GPV.
Hypothesis 2 (H2).
GPV, as a field source, can be analyzed in terms of functional value, economic value, emotional value, environmental value, and social value.
  ② Q—GRB Demand
The “electric quantity” of homebuyers is reflected by homebuyers’ demand, which is the initial factor influencing GRB development. This item is influenced by personal characteristics, including education, household size, age, and household annual income. Life attitude, environmental consciousness, and environmental behavior are also important factors of GRB demand. Thus, the following hypotheses were formed:
Hypothesis 3 (H3).
The value field force is positively related to GRB demand.
Hypothesis 4 (H4).
GRB demand, as target charge, can be analyzed in terms of education, household size, age, household annual income, life attitude, environmental consciousness, and environmental behavior.
  ③ R—Psychological Distance
Construal level theory (CLT) proposes that people mentally construe the same object or event at different levels of abstraction and mental representations, which in turn influences their understanding of the world [58]. CLT further posits that the construal level is a function of psychological distance. More specifically, CLT establishes that psychologically distant objects are construed in a more abstract and decontextualized manner; in contrast, psychologically proximate events are conceived in a more concrete and detailed way [58]. Agerström and Björklund argued that selfish motives and hedonic considerations are expressed at a more concrete construal level with a proximate psychological distance [59]. As homebuyers aimed at personal interests when purchasing a GRB, their GRB purchasing behavior can be classified as a behavior arising from selfish motives, and thus is associated with a proximate psychological distance. In other words, when objects or events are psychologically proximal to people, they are perceived in terms of a concrete construal, thus boosting purchasing behavior [60]. For example, if GRBs were psychologically proximal to homebuyers, homebuyers would be familiar with the GRB’s image and the benefits GRBs bring to them. The GRBs would be a concrete object rather than an abstract one. In this context, homebuyers tend to purchase GRBs. Therefore, psychological distance was adopted to describe factors inhibiting consumers from purchasing GRBs. The items were adapted from existing studies [60,61,62] and also consider the characteristics of GRBs, i.e., cognitive distance, social distance, and spatial distance. Therefore, the following hypotheses were proposed:
Hypothesis 5 (H5).
The value field force is negatively related to psychological distance.
Hypothesis 6 (H6).
Psychological distance, as distance between homebuyers and GRBs, can be illustrated in terms of cognitive distance, social distance, and spatial distance.
Overall, the factors of these elements were selected based on psychology field theory, where the GPV and psychological distance represent homebuyers’ conscious environment, the value field factor refers to homebuyers’ unconscious environment, and the GRB demand refers to a person’s need for GRBs. Although there are correlations among these variables, they do not conflict when assessing homebuyers’ purchasing behavior, which is measured by the field force.

4. Research Methodology

There were three steps in this empirical study: data collection, data analysis, and case study. In step 1, data collection was done using a questionnaire survey. In step 2, data analysis involved two tasks, namely reliability analysis and factor analysis. In step 3, a case study is presented.

4.1. Data Collection

The present study used quantitative research to verify the proposed value field model. A questionnaire survey method was used, which mainly included homebuyers of Nanjing in Jiangsu province. Jiangsu accounts for nearly 30% of all GBs in China. The development of GBs in Jiangsu province reflects the polarity between the rapid development in southern Jiangsu and the lagging development in northern Jiangsu. Nanjing, as Jiangsu’s provincial capital, has outstanding GB performance, in keeping with the rapid development of southern Jiangsu and as reflected by the comprehensive value of K. In this context, this study designed a measurement scale for the proposed value field model. The survey questionnaire was divided into four parts (as outlined below) with 48 items. In psychology field theory, an individual’s behavior is the result of the force between the person and the environment. Thus, the contributors to the force can be selected from influencing factors of an individual’s behavior, which are also the items of the questionnaire (Appendix B).
(1)
Part 1 investigated the respondents’ demographic characteristics, such as gender, age, and annual household income.
(2)
Part 2 solicited a GPV factor scale with 15 items.
(3)
Part 3 solicited a green life attitude factor scale including residential attitude, environmental attitude, and environmental habits.
(4)
Part 4 solicited a psychological distance scale including social distance, cognitive distance, and spatial distance.
A preliminary investigation was conducted to check content validity. In total, six experts from real-estate companies and six academics for universities in the area of green building were invited to provide feedback. Based on their feedback, modifications were made to ensure content validity and consistency of the questionnaire. The survey was conducted using an online interface with several selected respondents who possess experience with GRBs, and with occupations ranging from university instructors to developers, contractors, and government officials. These participants were all considered to be potential consumers and homebuyers of GRBs. The results of the survey were found to verify the accuracy of the data. According to the statement that value can be meaningful only when it is defined from the consumers’ perspective [32], these survey participants were the best positioned to assess GRB value.
The online surveys were carried out in WJX.cn, an online questionnaire survey platform in which respondents were independent and did not interfere with one another, thus ensuring the objectivity and reliability of the survey. Participants were invited to indicate their degree of agreement with statements pertaining to the presented scales using a five-point Likert scale. From a total of 300 questionnaires distributed online, 279 questionnaires were completed. After omitting questionnaires with incomplete answers and from other cities, the total number of valid questionnaires obtained was 223 (80.5%), which is suitable for social science research [63]. Out of the total sample of 223 respondents, 65.34% were male and 34.66% were female. The majority of respondents (87.73%) were from the age group between 28 and 39. A total of 54.87% had an undergraduate degree, while 38.63% had a postgraduate degree. The majority of respondents had an annual household income ranging between 100,000 CNY and 500,000 CNY.

4.2. Data Analysis

4.2.1. Reliability Analysis

As shown in Table 4, the Cronbach’s alpha values for scales were all found to be higher than 0.7, which is the threshold value recommended in Umay’s guideline [63]. Hence, all scales had a high reliability and could therefore be considered to be a solid foundation for further studies. Umay has also suggested that any indicator with a corrected item-total correlation (CITC) value less than 0.4 should be omitted in order to enhance the overall reliability of the scale [63]. As shown in Table 4, the CITC value of A3 was less than 0.4 and the resulting Cronbach’s alpha value when omitting A3 was 0.958 (exceeding the original scale’s Cronbach’s alpha). Thus, indicators B1, B2, B3, B4, B17, and C4 were also omitted due to the low CITC value, which were in bold in the table.

4.2.2. Exploratory Factor Analysis

Exploratory factor analysis (EFA) was conducted before proceeding to the confirmatory factor analysis (CFA) [64]. The objective of an EFA is to identify a set of underlying dimensions [65]. The ratio of the sample size to the number of variables was found to be 5.44, exceeding the acceptable ratio of 5.00 [66]. This suggested that the sample size was large enough to conduct EFA. Prior to the factor analysis, the Kaiser–Meyer–Olkin (KMO) index and Bartlett’s sphericity were calculated in order to test the suitability of the data for factor analysis. As shown in Table 5, the KMO value was found to be 0.911, exceeding the acceptable level (0.5), suggesting that the common variance among the indicators was high. The Bartlett’s sphericity value, meanwhile, was found to be 8044.256 with a significance level of 0.000, indicating that the population correlation matrix was not all the same. Therefore, the collected data were suitable for exploratory factor analysis.
EFA was conducted with principal component analysis to identify the underlying dimensions. The varimax orthogonal rotation method was used to obtain the factor loading value, which explained the contribution of individual indicators to each underlying dimension. Considering the recommendation of many studies that factor loadings should be greater than 0.5 to ensure better results [68], there were three conditions under which indicators were omitted:
(1)
Factor loadings of all the common factors were less than 0.5 [68];
(2)
Factor loadings greater than 0.5 occurred for more than two common factors;
(3)
Factor loadings of more than two common factors had small differences from each other.
In scale 1, two dimensions were obtained with eigenvalues greater than 1, with 14 indicators remaining (Table 6). Based on the above conditions for factor omission, indicator A6 in scale 1 was omitted since its factor loadings on the two dimensions were all found to be greater than 0.5. The redefined dimensions—“perceived value of benefit” and “perceived value of cost, comprising 13 indicators, could explain 73.346% of the data. In scale 2, four dimensions, with eigenvalues greater than 1 were obtained, which could explain 77.325% of the data. They were redefined as “eco-friendliness”, “environmental awareness”, “energy conservation” and “environmental protection behavior.” In scale 3, three dimensions (i.e., “cognitive distance”, “social distance”, and “spatial distance”) were obtained with eigenvalues greater than 1, explaining 73.392% of the data.
Table 6 contains the details of the three scales and the initial statistics of the 40 indicators. The total variance explained by each indicator is listed in the factor loading column. The percentage of variance and the cumulative percentage of variance are also indicated in Table 6.

4.2.3. Validation of the Proposed Model

Structural equation modelling (SEM) was then applied to validate the proposed model, which consists of a measurement model and a structural model. In this study, the measurement model captures the relationships among nine dimensions and three scales, while the structural model shows the potential relationships between the three scales and value field force. EFA (Exploratory factor analysis) and CFA (confirmatory factor analysis) contain the measurement component, while path analysis solves the structural aspect.
In this regard, validity analysis was first required to test whether a given measurement was well-founded. Validity measures were of two main types: content validity and construct validity. The measurement scales were constructed mainly based on previous studies. The items were discussed and adjusted by academics and professional experts, and they were considered appropriate. Thus, it could be deduced that the scales had enough content validity [69]. The construct validity of the survey instrument was examined by means of factor analysis.
CFA was then conducted to test whether the observed variables fit the measurement model [70]. In EFA, three scales were identified as latent variables, which would be confirmed using CFA. A CFA-based measurement was run through LISREL 8.7 (This software is developed by Scientific Software International Inc, Lincolnwood, IL 60712, United States.) using several goodness-of-fit statistics, including goodness-of-fit index (GFI), chi-square degrees of freedom (χ2/DOF), comparative fit index (CFI), adjusted GFI (AGFI), and root-mean-square error of approximation (RMSEA). As seen in Table 7, the actual observed data met the requirement of each measuring criteria threshold, which meant the model was reasonable. Accordingly, the nine groupings identified can be regarded as observed variables in the SEM.
The software LISREL 8.7 was utilized to estimate the degree of accuracy of the model. In Figure 4, the arrows and path coefficients show the contributions of the dimensions and the observed variables (dimensions) to the value field force (F). The figure includes both the measurement and structural components, showing the relationships between F, the three scales, and the observed variables (nine groupings). Overall, the model was found to have a good fit, with the fit indices as follows: χ2/DOF = 2.2, GFI = 0.90, CFI = 0.92, AGFI = 0.91, and RMSEA = 0.048. Moreover, all the pathways were found to be significant. Based on the analysis, the correlations between the three scales and the observed variables were verified using the empirical data. The model was thus shown to be suitable for assessing GRB value.

4.3. A Case Study in China

In order to further understand how a value field model could be applied to evaluate homebuyers’ GRB purchasing behavior, a case study was conducted in Nanjing, China. The method utilized in the case study was a fuzzy synthetic evaluation. A fuzzy synthetic evaluation is commonly used to make an overall evaluation of complex systems with factors that are difficult to quantify, and it permits the incorporation of various parameters into the evaluation process [76]. The main procedures are the following five steps:
(1) Establishment of the Factor Set
The factor set, indicated by U, is a collection of terms affecting the evaluation object:
U = { u 1 ,   u 2 , , u m } ,
where m is the number of influencing terms.
A comprehensive evaluation of homebuyers’ purchasing behavior toward GRB was set as the target level, comprising three scales with nine dimensions and 40 secondary indicators. Table 8 shows the comprehensive index evaluation system for the value assessment problems. The factor set in each scale, including the indices in Table 8, can be expressed as:
U 1 1 = { U 10 1 ,   U 11 1 ,   U 12 1 ,   U 13 1 ,   U 14 1 , U 15 1 , U 16 1 , U 17 1 , U 18 1 , U 19 1 , U 19 + 1 } , U 2 1 = { U 20 1 ,   U 21 1 } , U 1 2 = { U 10 2 ,   U 11 2 ,   U 12 2 ,   U 13 2 ,   U 14 2 } , U 2 2 = { U 20 2 ,   U 21 2 ,   U 22 2 ,   U 23 2 } , U 3 2 = { U 30 2 ,   U 31 2 ,   U 32 2 } , U 4 2 = { U 40 2 ,   U 41 2 ,   U 42 2 } , U 1 3 = { U 10 3 ,   U 11 3 ,   U 12 3 ,   U 13 3 ,   U 14 3 , U 15 3 } , U 2 3 = { U 20 3 ,   U 21 3 ,   U 22 3 ,   U 23 3 } , U 3 3 = { U 30 3 ,   U 31 3 } .
(2) Establishment of the Assessment Set
The assessment set, indicated by V, is a collection of the assessment results of the evaluated object:
V = { v 1 ,   v 2 , , v n } ,
where v n is the level of assessment standard.
Then the assessment standard is given a value according to:
S = { s 1 ,   s 2 , , s n } .
According to the Likert scale, the assessment set could be regarded as having five levels. Thus, the value of the assessment sets were expressed as:
S = { 1 ,   2 ,   3 ,   4 ,   5 } .
(3) Fuzzy Evaluation of a Single Factor
A fuzzy matrix, indicated by L, is a collection in which each factor is assessed to determine the membership grade in the assessment set:
L = ( l i j ) m n = [ l 11 l 1 n l m 1 l m n ] ,
where l i j is the membership degree of u i in v j , reflected by a number between 0 and 1.
l i j can be calculated by means of a fuzzy statistical method using:
l i j = w i j n ,
where w i j is the number of evaluators who grade the u i as v j , and n is the total number of evaluators.
To determine the level of the evaluation factors in the assessment set, the membership function should be calculated for all factors in all three dimensions using Equations (7) and (8). In this study, ten experts were invited to assess the factors. Thus, in the U 1 scale, the membership functions of U 1 1 and U 2 1 were calculated as follows:
L U 1 1 = { 0 0 0.1 0.65 0.25 0 0 0.1 0.45 0.45 0 0.05 0.25 0.55 0.15 0 0 0.15 0.5 0.35 0 0 0.15 0.65 0.2 0 0 0.15 0.55 0.3 0 0 0.15 0.5 0.35 0 0 0.1 0.5 0.4 0 0 0.35 0.6 0.05 0 0 0.15 0.55 0.3 0 0 0.15 0.55 0.3 } ,   L U 2 1 = { 0.05 0.2 0.4 0.1 0.25 0 0.3 0.3 0.3 0.1 } .
In the U 2 scale, the membership functions of U 1 2 , U 2 2 , U 3 2 , and U 4 2 were calculated to be:
L U 1 2 = { 0 0 0.15 0.55 0.3 0 0 0.15 0.5 0.35 0 0 0.1 0.7 0.2 0 0 0.1 0.6 0.3 0 0 0.1 0.7 0.2 } ,   L U 2 2 = { 0 0 0.3 0.55 0.15 0 0.05 0.3 0.55 0.1 0 0.05 0.05 0.7 0.2 0 0.05 0.15 0.6 0.2 } ,
R L U 3 2 = { 0 0 0.2 0.5 0.3 0 0 0.1 0.65 0.25 0 0 0.05 0.55 0.4 } ,   L U 4 2 = { 0 0 0.05 0.5 0.45 0 0 0.15 0.6 0.25 0 0 0.15 0.65 0.2 } .
In the U 3 scale, the membership functions of U 1 3 , U 2 3 , and U 3 3 were calculated to be:
L U 1 3 = { 0 0 0.35 0.5 0.15 0 0 0.15 0.6 0.25 0 0 0.2 0.6 0.2 0 0 0.2 0.55 0.25 0 0 0.15 0.6 0.25 0 0.05 0.5 0.35 0.1 } ,   L U 2 3 = { 0 0.05 0.55 0.4 0 0 0.2 0.35 0.45 0 0 0.05 0.25 0.7 0 0 0 0.5 0.45 0.05 } ,
L U 3 3 = { 0 0.05 0.45 0.35 0.15 0 0 0.5 0.35 0.15 } .
(4) Establishment of the Weight
Weight is an important factor in fuzzy synthetic evaluations since they indicate the influence of the terms on the evaluation object. The common factor variance contribution rate has been proven to be an objective tool for acquiring the weights of different indices [77]. The method can be illustrated as follows:
a U j p = c j j = 1 n c j ,
where a U 1 n is the weight of the common factor j (first level) in scale p, c j is the variance contribution rate of the common factor j, and n is the number of common factors. Furthermore:
a p j = c j j = 1 m c j
where a p j is the weight of the indicator of the common factors in scale p and c j is the contribution rates of the indices in the result of factor analysis score coefficient matrix.
Weights for the evaluation factors of first level and second level are shown in Table 8.
(5) Fuzzy Evaluation of Three Scales
The fuzzy evaluation matrix comprehensively reflects the overall influences of all the indices. The fuzzy synthetic evaluation matrix can be obtained using:
B = A · R = ( a 1 , a 2 , , a n ) [ r 11 r 1 n r m 1 r m n ] ,
where B is the evaluation result.
For either combustion condition, a real assessment value is obtained following the fuzzy synthetic evaluation:
Z = B · S T = ( r 1 r 2 r 3 r 4 r 5 ) · ( s 1 s 2 s 3 s 4 s 5 ) ,
where Z is the evaluation score, which reflects the evaluation of the actual case. More details on Equations (4)–(12) have been stated by Zadeh [78]. According to the factor sets and the weight of each factor presented in Table 8, a comprehensive evaluation of the value of GRBs in Nanjing was conducted, and the evaluation sequence was performed proceeding from low-level to high-level.
The first-level index was assessed using the measured weights ( W U i n = { W U i 0 n , W U i 1 n , , W U i m n } ) to calculate the U i n fuzzy matrix as follows:
B U i n = W U i n · R U i n = { W U i 0 n , W U i 1 n , , W U i m n } · { r 11 r 1 n r m 1 r m n } = ( B U 1 n , B U 2 n , , B U m n ) ,
where U i n is the first-level index, n is the number of dimensions, and m is the number of indicators in the first-level index. For example, the evaluation of the fuzzy matrix for the perceived value of benefit in the GPV dimension was:
B U 1 1 = W U 1 1 · R U 1 1 = ( 0.043 ,   0.062 ,   0.066 ,   0.089 ,   0.087 ,   0.099 ,   0.127 ,   0.088 ,   0.101 ,   0.117 ,   0.120 )   ×   { 0 0 0.1 0.65 0.25 0 0 0.1 0.45 0.45 0 0.05 0.25 0.55 0.15 0 0 0.15 0.5 0.35 0 0 0.15 0.65 0.2 0 0 0.15 0.55 0.3 0 0 0.15 0.5 0.35 0 0 0.1 0.5 0.4 0 0 0.35 0.6 0.05 0 0 0.15 0.55 0.3 0 0 0.15 0.55 0.3 } = ( 0 ,   0.003 ,   0.167 ,   0.546 ,   0.283 ) .
Following the same method, the results of other first-level indices were assessed to be:
B U 2 1 = ( 0.025 ,   0.250 ,   0.350 ,   0.201 ,   0.174 ) ,
B U 1 2 = ( 0 ,   0 ,   0.118 ,   0.613 ,   0.269 ) ,
B U 2 2 = ( 0 ,   0.360 ,   0.221 ,   0.588 ,   0.156 ) ,
B U 3 2 = ( 0 ,   0 ,   0.119 ,   0.569 ,   0.313 ) ,
B U 4 2 = ( 0 ,   0 ,   0.112 ,   0.580 ,   0.309 ) ,
B U 1 3 = ( 0 ,   0.007 ,   0.300 ,   0.664 ,   0.250 ) ,
B U 2 3 = ( 0 ,   0.075 ,   0.424 ,   0.488 ,   0.014 ) ,
B U 3 3 = ( 0 ,   0.025 ,   0.475 ,   0.35 ,   0.15 ) .
After the evaluation of the fuzzy matrix for the first-level indices, for the evaluation of the overall level in each dimension, the fuzzy matrix B U i was calculated using:
B U i = { B U 1 i B U 2 i B U m i } ,
where B U m i is the evaluation results of first-level index m in dimension i.
Therefore:
B U 1 = ( 0 0.003 0.167 0.546 0.283 0.025 0.250 0.350 0.201 0.174 ) ,
B U 2 = ( 0 0 0.118 0.613 0.269 0 0.360 0.221 0.588 0.156 0 0 0.119 0.569 0.313 0 0 0.112 0.580 0.309 ) ,
B U 3 = ( 0 0.007 0.300 0.664 0.250 0 0.075 0.424 0.488 0.014 0 0.025 0.475 0.35 0.15 ) ,
where B U 1 ,   B U 2 , and B U 3 are the evaluation results of the first-level index for the GPV, GRB demand, and distance dimensions, respectively.
The weight of the first-level indices in each dimension must be used for the calculation of the overall value level in each dimension. The weights were calculated to be W U i = { W U 1 i , W U 2 i , , W U m i } ( i = n ), and the fuzzy matrix B U i ¯ was defined as B U i ¯ = W U i · B U i .
Thus, the fuzzy matrices of all dimensions were calculated to be:
B U 1 ¯ = ( 0.003 ,   0.030 ,   0.187 ,   0.509 ,   0.051 ) ,
B U 2 ¯ = ( 0 ,   0.048 ,   0.131 ,   0.602 ,   0.262 ) ,
B U 3 ¯ = ( 0 ,   0.028 ,   0.358 ,   0.572 ,   0.172 ) .
These were then multiplied by the numerical value of the assessment standard in order to measure the overall assessment results of the three dimensions:
Z U 1 = B U 1 * S T = 2.915 ,
Z U 2 = B U 2 * S T = 4.207 ,
Z U 3 = B U 3 * S T = 4.278 .

5. Results and Discussions

This section presents the findings of: (1) the measurement component of the model, (2) the structural component of the model, and (3) a comprehensive evaluation of case study. Each series of findings is followed by detailed discussions that present the implications of the findings for research and practice.

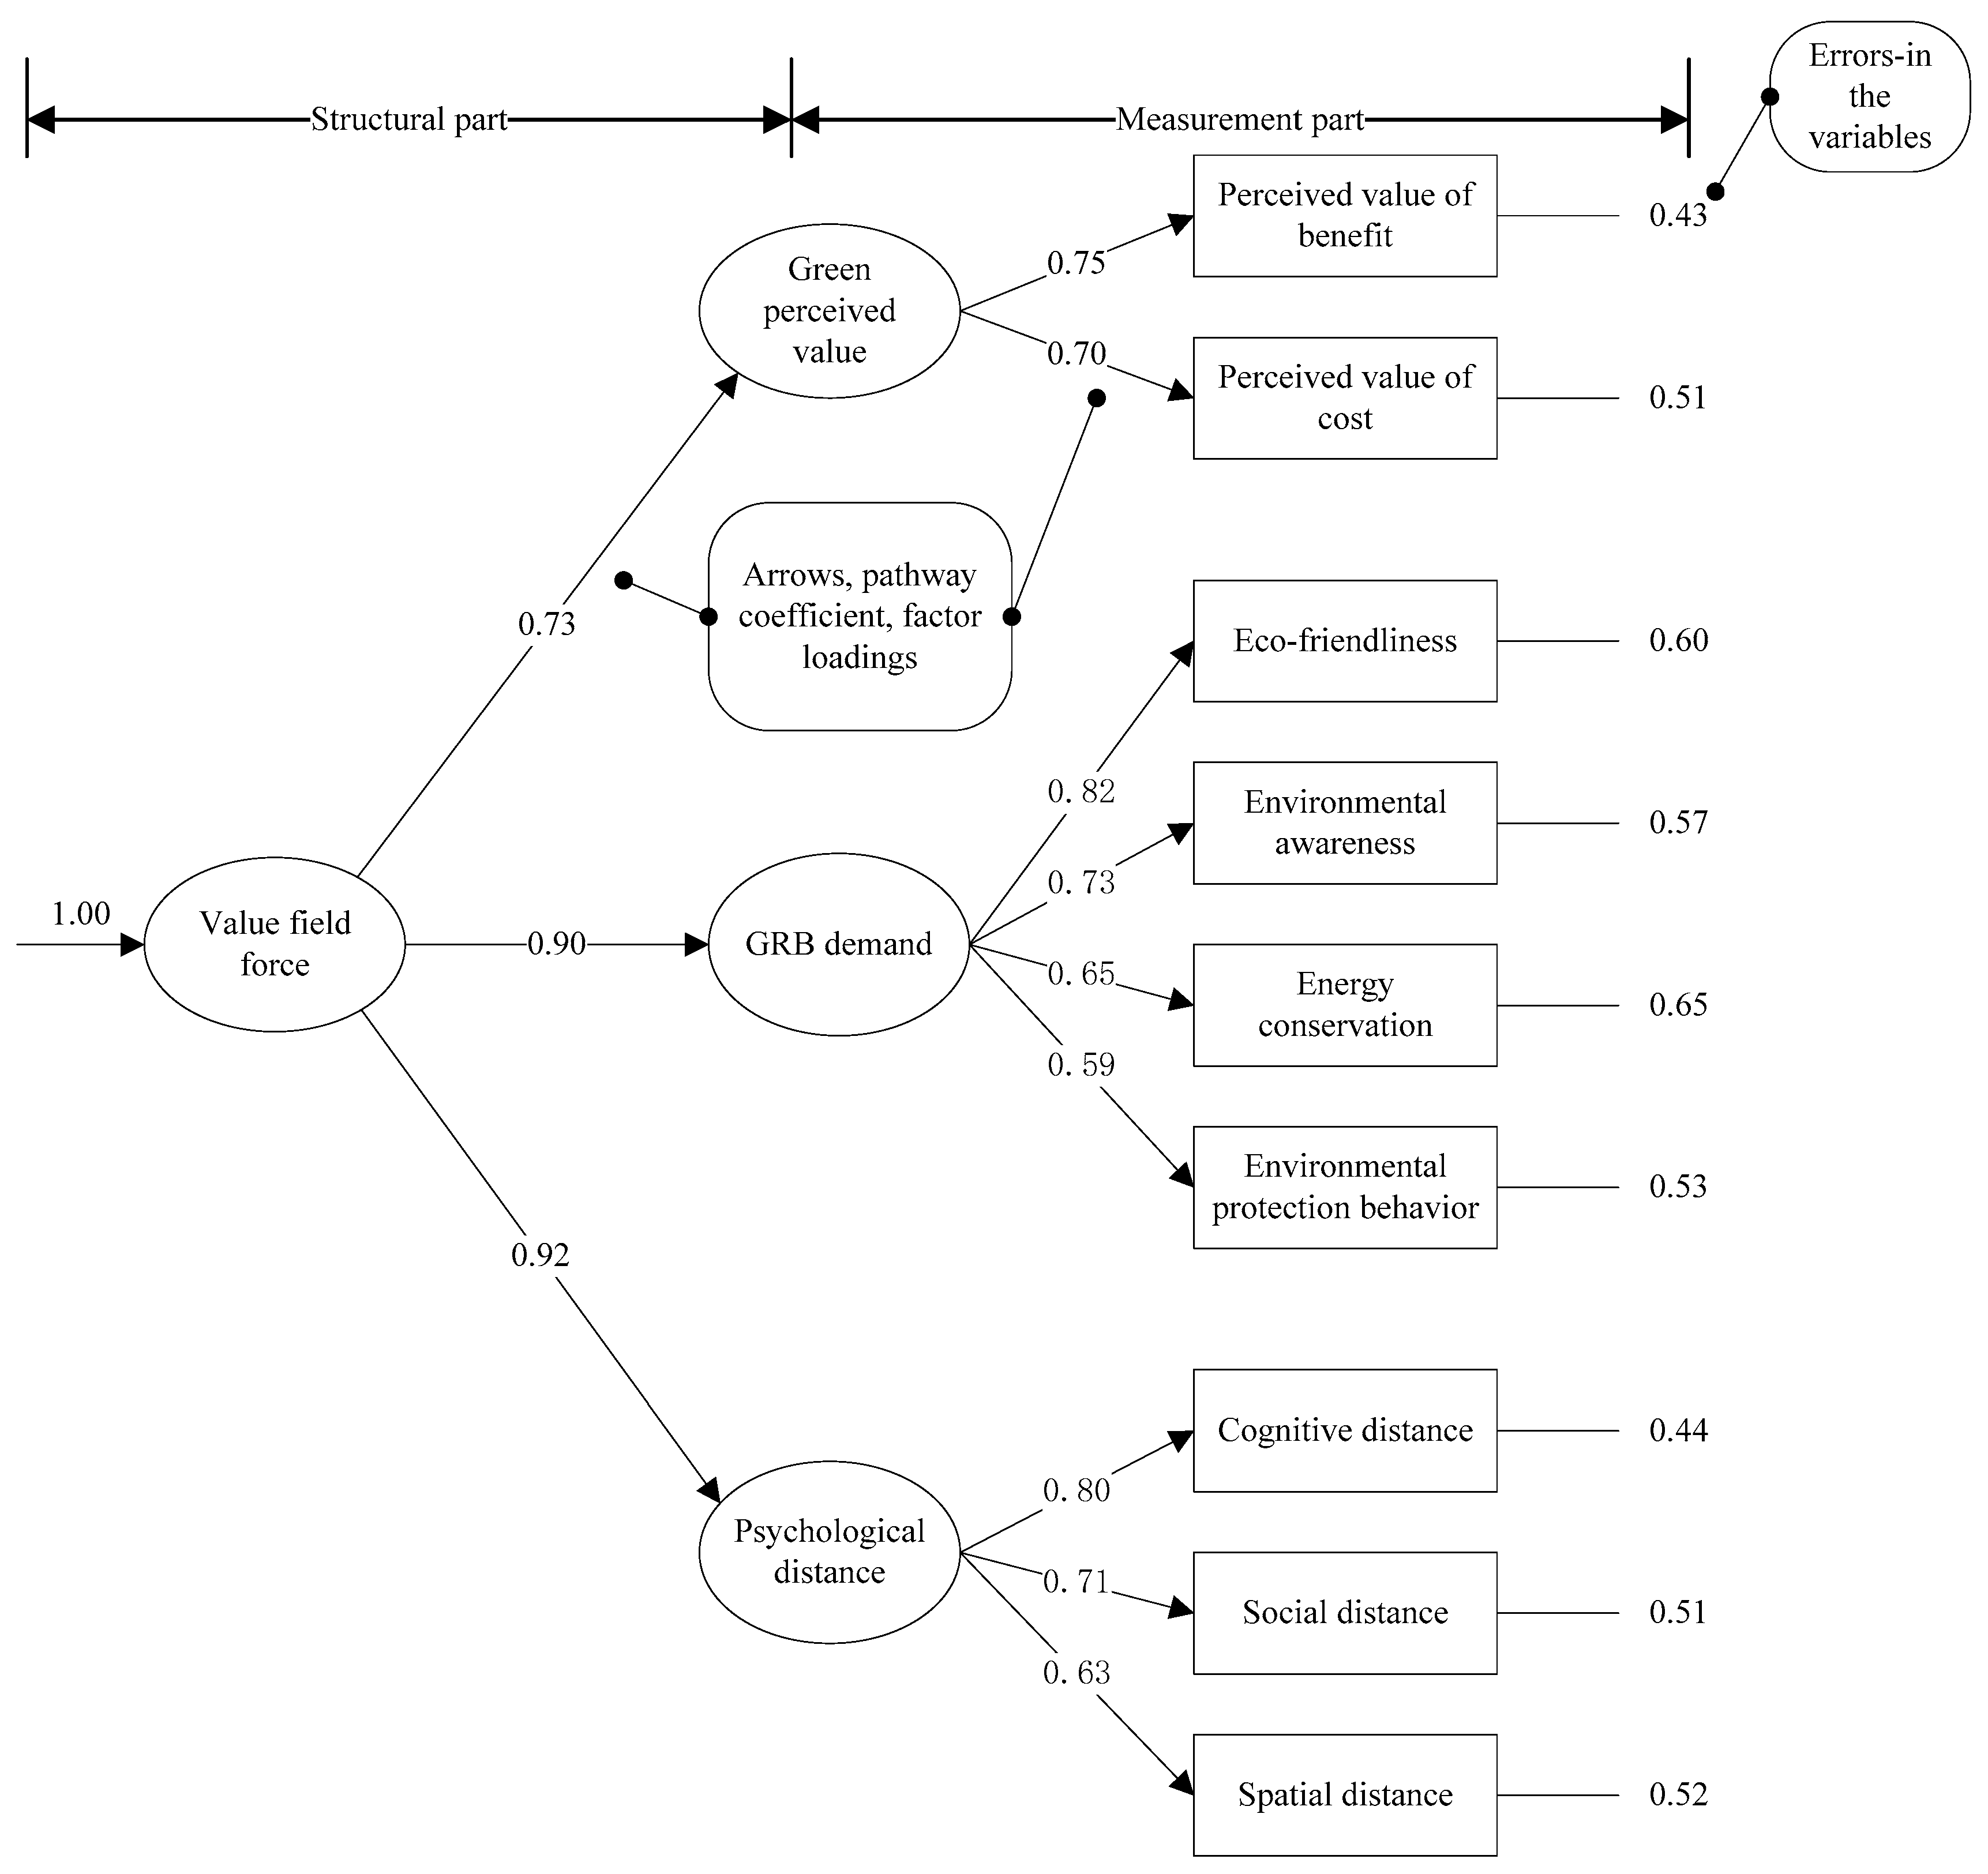
5.1. Measurement Component of the Model

The latent variable describing the GPV scale was measured using D1 and D2. The greater influence resulted from perceived value of benefit (D1 (0.75)). It indicated that consumers’ overall evaluation of GRB shed light on their motivation to adopt GRBs, supported by previous studies [79,80]. For instance, Wang et al. suggested that perceived value significantly influences consumers’ intention to adopt bicycle sharing [80]. The findings fully supported the role of the perceived value of benefit in determining homebuyers’ purchasing behavior insofar as it affects consumer trust [81]. Among all the value dimensions in the perceived value of benefit, green value (A10, A11) was found to have the greatest effect, followed by the social and emotional values, while functional value was found to have the least influence. Green value, it should be noted, was the most attractive feature of a GRB. It revealed that today’s homebuyers are keenly aware of the current environmental problems and thus desire to become involved in the green building movement [52,82]. Furthermore, the internal motivation is a predominant factor for promoting GRB [83,84], due to the features of social value and emotional value. However, the influence of functional value (A1, A2) was found to be not as large as green value, social value, or emotional value. It suggested that homebuyers were more tolerant of a GRB’s undesirable quality and performance. On the other hand, the other motivation underlying homebuyers’ desire for GRB was cost savings for energy and water.
The latent variable representing the GRB-demand scale was measured using D3–D6. The most significant factors were D3 (0.82) and D4 (0.73). Eco-friendliness (D3) denoted homebuyers’ demand for GRB environmentally friendly features. It suggested that homebuyers who pay more attention to a GRB’s eco-friendly technologies, such as ventilation, noise barriers, and green materials, have a stronger preference for GRBs. Improving the greenness of GRBs served as an important method to attract homebuyers’ attention for GRBs. Moreover, individual consciousness about environmental protection is another important factor affecting homebuyers’ purchasing behavior of GRBs. This was confirmed by the attitude–behavior correspondence [85], in which the environmental attitude can guide pro-environmental intention and behavior [86]. It implied that effective measures can be taken to increase consumers’ environmental awareness and to advocate environmental protection habits.
The latent variable describing the psychological distance scale was measured using D7–D9. The most significant variable was cognitive distance (D7 (0.80)). It stressed the important role of the knowledge of sustainability in shaping homebuyers’ intention to adopt GRBs. In the context of GRBs, the more knowledge homebuyers possessed, the smaller the recognition distance was. Furthermore, social distance (D8 (0.71)) ranked the second place in fostering homebuyers’ acceptance of GRB. The social distance between consumers and GRBs represents the influence from the majority and the authoritative parties (e.g., developers and government). This can be explained by social trust and has been defined as the willingness to rely on those who are within homebuyers’ social circles or have the expertise and responsibility to make decisions [87]. Usually, people do not have sufficient knowledge of GRBs to make decisions and take actions accordingly. In this circumstance, individuals tend to make decisions based on professional judgments or familiar opinions based on social trust.

5.2. Structural Component of the Model

The structural component of the model is presented in Figure 4. The three scales were verified to be significant in the proposed model. Based on the analysis of the model, the most significant influence on the homebuyers’ purchasing behavior of GRBs was the psychological distance scale because the path coefficient referred to the importance of one factor on another factor. This signifies a highly significant level of the critical factor and the priority of scale 2 over the key factors of GRB purchasing behavior. The scale shows that GRB-demand had a similar importance degree with the psychological distance scale. It emphasized the leading position of homebuyers’ demand in affecting their purchasing behavior toward GRBs. Obviously, demand is the driving force for the market development. As the important role of homebuyers in growing the GRB movement, their attitude toward GRBs and purchasing intention will in turn influence GRB value, which can be externalized through homebuyers’ acceptance of GRBs. Therefore, resident-oriented thinking is urgently needed.

5.3. Comprehensive Evaluation of the Case Study

The value field force (F) is defined as the invisible driving force influencing homebuyers’ GRB purchasing behavior, which presents the level of preference. Using the certified model, the driving force of purchasing GRB in Nanjing was calculated to be: F = 0.9641 × 2.915 × 4.207 4.278 = 2.764.
The degree of driving force is classified according to the score of field force, taking the following steps:
The values of GPV, GRB-demand, and psychological distance were determined to be integers ranging from 1 to 5 (1, 2, 3, 4, 5).
The value field factor reflects the housing market environment, and was found to be approximately 1 according to the calculation in Section 3.
Based on Equation (1) and the statements above, there were found to be 125 possible field force scores for the GRB value.
All field force scores of the value field were ranked in order from smallest to largest.
All values were graded according to scoring frequency from one to five. Therefore, every 25 values were in the same internal, namely [0.2, 1], (1, 2], (2, 3.33], (3.33, 6], and (6, 25]. Grades corresponding to the five intervals are shown in Table 9.
It shows that the driving force influencing homebuyers’ GRB purchasing behavior in Nanjing was on the upper-medium level.
The market for GRBs in Nanjing was reflective of the current state of GRBs in China. Although national and provincial strategies promoting GBs have been proposed, including legislation, regulation, and technological innovations [88], few measures have been implemented to enhance homebuyers’ willingness to purchase GBs. This may be due to a failure on the part of government and other stakeholders (e.g., developers, experts) to understand that desirable performance and benefits are sufficient to convince homebuyers to adopt GBs. In this context, the present study has focused on the homebuyers of GRBs.
From a methodological perspective, this study may provide impetus for the application of field theory in other contexts. The findings can also inform efforts by policy-makers to develop resident-oriented policies and by developers to promote the GRB movement. While the study’s setting is China, the findings may also provide valuable implications for other developing countries.
Despite the theoretical and practical implications of this research, it is also important to recognize its limitations. First, the data collected from the questionnaire survey was subjective since individuals’ knowledge of GRBs varies due to educational background, occupation, socio-economic status, etc. Second, the impact level of the factors identified in this study may differ in different regions and countries. Thus, future research should explore the importance of the identified factors in multi-regional contexts. In addition, comparative studies using the field force concept could be conducted in different regions.

6. Conclusions

The increasingly urgent environmental situation and low market demand for GBs has prompted an increased focus on homebuyers’ GB consumption. To address this gap, theoretical and empirical research was conducted for the purpose of developing a value field model for evaluating a homebuyer’s GRB purchasing behavior. The proposed model of the GRB value field was based on field theory and analyzed the force of GRBs on homebuyers in terms of the GRB value. In the process of constructing the proposed model, a scale referred to as the value field factor (K) was analyzed based on the existing logistic field factor and was calculated to be approximately 1. Thus, the proposed model incorporated “green perceived value”, “GRB-demand”, and “psychological distance” with 40 indicators identified through a questionnaire survey and statistical analysis. The results showed that the GRB value exerts an invisible driving force on homebuyers’ GRB purchasing behavior, named as a value field force. Overall, the psychological distance had the most significant influence on homebuyers’ GRB purchasing behavior, followed by the GRB demand, and lastly, the green perceived value. The scale of psychological distance was comprised of three dimensions, “cognitive distance,” “social distance,” and “spatial distance”. These dimensions negatively influenced homebuyers’ purchasing behavior regarding GRBs according to the SEM results. It also indicated that eco-friendliness, environmental awareness, energy conservation, and environmental protection behavior in the GRB-demand scale positively affected homebuyers’ behavior. Furthermore, the perceived value of benefit and perceived value of cost comprised the scale “green perceived value.” Among the above factors, cognitive distance, eco-friendliness, and perceived value of benefit were the three most significant ones to motivate homebuyers to adopt GRBs.
The findings suggest that resident-oriented policies should be developed to motivate homebuyers’ purchasing behavior. Resident-oriented policies should focus on the GRB demand determinants. GRB demand relies on consumers’ environmental awareness and environmental protection habits. Thus, to enhance homebuyers’ environmental protection awareness, communication and education regarding environmental problems and the importance of environmental protection should be established and directed toward homebuyers, and policies targeting psychological distance determinants (cognitive distance and social distance) are also needed. Cognitive distance refers to knowledge of GRBs, which has been regarded as an efficient method of increasing homebuyers’ acceptance of GRBs, considering that in the current situation, homebuyers care more about price and location of the residence. In fact, many homebuyers do not know whether their housing has a green building label or not. Educating them with knowledge of GRBs makes the green building label become a selling point. Given that social distance is associated with social trust, social distance can be reduced by enhancing social trust. When knowledge of GRBs is low, a high degree of social trust can convince homebuyers to adopt GRBs. Several measures should thus be implemented for improving social trust. The aforementioned methods regarding homebuyers’ education and communication can also be effective in fostering trust among homebuyers. The education and communication may make GRB popular among the public, and homebuyers may thus be affected by the positive GRB market atmosphere. Moreover, active information-sharing increases the credibility of the government and related organizations, which can affect homebuyers’ attitudes toward GRBs. In addition, the findings imply that developers of GRBs need to improve their marketing strategies to meet consumer demand. They can investigate their targeted consumers’ psychological and social factors and gain a clear understanding of the degree to which consumers have a positive attitude towards GRBs. For people who exhibit little or no interest in GBs, marketers should ascertain the amount they are willing to pay under the win-win principle. For ecologically concerned consumers, developers could offer more information about GRBs as an effective strategy to improve the GPV.

Author Contributions

Manuscript writing: Y.Z.; Word editing and funding project holder: J.Y.; Word editing: L.L.; Coordination: H.C.

Funding

The paper was found by National Natural Science Foundation of China (NSFC, 71372199, 71671042)

Acknowledgments

The authors would like to express their appreciation to all interviewees and reviewers of the paper.

Conflicts of Interest

The authors declare no conflict of interest.

Data Availability

The data used to support the findings of this study are included within the article.

Appendix A

Table A1. Transportation development level (2017).
Indicators (Unit)BeijingShanghaiGuangzhouShenzhenNanjingTianjin
Number of civilian vehicles per capita (vehicle/thousand people)0.02880.01560.01890.03110.02990.0222
Number of buses per capita (vehicle/ten thousand people)1171014148
Total rail mileage (km)684.4731.4357.9298.2364.9175.3
Table A2. Economic development level (2017).
Indicators (Unit)BeijingShanghaiGuangzhouShenzhenNanjingTianjin
Disposable income per capita (yuan) 57,23058,98855,40052,93848,10437,022
GDP (billion yuan)28,000.430,133.8621,503.1522,438.3911,715.1018,595.38
GDP growth rate (%)6.76.978.88.13.6
Table A3. Society development level (2017).
Indicators (Unit)BeijingShanghaiGuangzhouShenzhenNanjingTianjin
Engel coefficient 21.53532.132.540.430.6
Unemployment rate (%)1.54.12.352.4543.5
Homebuyers population (ten thousand people)2170.72418.331449.841252.83833.501556.87
Table A4. Housing demand (2017).
Indicators (Unit)BeijingShanghaiGuangzhouShenzhenNanjingTianjin
Residential sales price (yuan/m2)24,55024,86618,00056,80016,64015,812
Residential sales area (ten thousand m2)1133.91691.61232.51417.93710.431168.25
living space per capita (m2 per capita)32.3835.33524.4736.530
Table A5. Dimensionless variables of the value field factor of GRBs.
BeijingShanghaiGuangzhouShenzhenNanjingTianjin
K111.17950.63890.77411.27371.22460.9092
K121.03130.65630.93751.31251.31250.75
K131.57211.68000.82210.68500.83820.4027
K211.26901.36570.97461.01700.53100.8428
K220.97811.00731.02191.28471.18250.5255
K231.10881.14291.07341.02570.93200.7173
k310.67151.09321.00261.01511.26180.9558
K320.50281.37430.78770.82121.34081.1732
K331.34521.49860.89850.77640.51650.9648
K410.94020.95230.68942.17530.63730.6056
K421.07061.59721.16370.39460.67081.1031
K431.00331.09371.08440.75821.13090.9295
Note: x i j * = x i j x ˜ , where x i j is the original data, x ˜ is the the average of the original data, and x i j * are the dimensionless variables.
Table A6. Weights of the indicators of K.
Variable σ i x ¯ i V i W i
K1 (0.47)K110.24 1.0000 0.24 0.25
K120.25 1.0000 0.25 0.26
K130.47 1.0000 0.47 0.49
K2 (0.21)K210.27 1.0000 0.274 0.30
K220.31 0.6250 0.502 0.55
K230.14 1.0000 0.143 0.16
K3 (0.14)K310.18 1.0000 0.18 0.21
K320.32 1.0000 0.32 0.39
K330.33 1.0000 0.33 0.40
K4 (0.18)K410.54 1.0000 0.54 0.52
K420.38 1.0000 0.38 0.36
K430.13 1.0000 0.13 0.12
Note: (1) V i = σ i x ¯ i , where V i is the coefficient of the variation index, σ i is the standard deviation, x ¯ i is the average of the original data; (2) W i = V i i = 1 n V i , where W i is the weight of the variation coefficient.

Appendix B. Questionnaire about How Green Residential Building Value Affects Homebuyers’ Purchasing Behavior

Dear Sir/Madam:
I am a PhD student from Southeast University. The questionnaire is about how green residential building values affects occupants. Please answer the following questions based on your real understanding and feeling about green residential buildings. The questionnaire survey is absolutely anonymous. Thanks for your help.
Part one—personal information
  • Gender
    Male
    Female
  • Age
    20–29 year old
    30–39 year old
    40–49 year old
    50–59 year old
    60 year old and above
  • Education
    Junior school and below
    High School
    Junior College
    Undergraduate
    Postgraduate
  • Total annual household income
    ≤¥100,000
    ¥100,000–¥300,000
    ¥300,000–¥500,000
    ¥500,000–¥1,000,000
    >¥1,000,000
  • Occupation
    Civil servants
    Technician
    Officer
    Teacher
    Student
    Worker
    Freelance
    Private owner
    Others
  • Family member
    Single
    A family of two
    A family of three
    A family of four
    A family of five and above
  • Working address
    Gulou District
    Xuanwu District
    Qinhuai District
    Jianye District
    Yuhuatai District
    Qixia District
    Jiangning District
    Pukou District
    Luhe District
    Gaochun District
    Lishui District
    Other cities ()
  • Residence address
    Gulou District
    Xuanwu District
    Qinhuai District
    Jianye District
    Yuhuatai District
    Qixia District
    Jiangning District
    Pukou District
    Luhe District
    Gaochun District
    Lishui District
    Other cities ()
  • Is agreen residential building your first choice when you plan a building purchase?
    Yes
    No
Green Perceived Value
                Strongly disagree Fisagree Uncertainty Agree Totally agree
Do you think GRBs are of high quality?
Do you think a green building is good for health?
Will you abandon GRBs because of the high price?
Will you purchase a GRB because of low maintenance cost?
Will you purchase a GRB because of low cost of water, electricity, and gas?
Do you think GRBs stimulate your desire to buy a GRB?
Do you feel comfortable when purchasing a GRB?
Do you think purchasing a GRB can bring you a sense of harmony with nature?
Do you think purchasing a GRB can reflect your lifestyle and attitude?
Do you think purchasing a GRB can improve the ecological environment?
Do you think purchasing a GRB can improve individual’s environmental protection awareness?
Do you think a GRB is good for the sustainable development of society?
Do you think purchasing a GRB can win more praise?
Do you think purchasing a GRB can help you establish a healthy image?
Do you think purchasing a GRB can provide a sense of social responsibility?
Green life attitude (GRB demand): Living attitude (LA), environmental protection attitude (EA), environmental protection habit (EH)
Living attitude
           Totally unimportant Unimportant General Important Very important
Do you think it is important to use green energy in residential buildings?
Do you think it is important to use water-saving appliances?
Do you think it is important to reasonably select and optimize a heating and air conditioning system to effectively reduce energy consumption?
Do you think it is important to have natural ventilation in your house?
Do you think it is important to apply sound insulation building material to effectively block noise from outside the house?
Do you think it is important to have a green residence community?
Do you think it is important to use green materials?
Do you think it is important for a residential building to cause less pollution and impact on the environment in use?
Environmental protection attitude
               Strongly disagree Disagree Uncertainty Agree Totally agree
Are you willing to change your lifestyle to protect the environment?
Do you often pay attention to various environment issues and take the initiative to understand various environmental information?
Are you worried about the environmental pollution you meet?
Are you willing to actively participate in environmental protection activities?
Environmental protection habit
                     Totally not Seldom General Many times Always
Do you usually use disposable products (e.g., plastic bags, paper, towels, etc.)?
Do you save resources in ordinary life?
Are you inclined to buy energy-saving household appliances?
Do you usually buy non-toxic and non-phosphorous laundry powder, soap, and detergent?
Psychological Distance: Social distance (SOD), cognitive distance (CD), and spatial distance (SPD)
Social distance
                Strongly disagree Disagree Uncertainty Agree Totally agree
Will you be influenced by people around you when choosing a residence?
Developers’ publicity and promotion will affect your choice of green residential building
Government’s incentive policies will encourage you to purchase a GRB
Families’ suggestions will affect your choice of GRB
Suggestions from friends and colleagues will affect your choice of GRB
Cognitive distance
                Unknown Don’t know much Unsure Know Know well
Do you know about GRBs?
Do you know that GRBs can save resources?
Do you know that GRBs can improve residential comfort?
Do you know that GRB can protect the environment?
Do you know that the price of GRB is higher than an ordinary residential building in the same condition?
Do you know that the operating cost of a GRB is lower than an ordinary residential building in the same condition?
Spatial distance
                Strongly disagree Disagree Uncertainty Agree Totally agree
The road around a GRB is more accessible
A GRB has perfect public transport
If you have any other suggestions for this questionnaire, please list them below:

References

  1. Li, Q.W.; Long, R.Y.; Chen, H. Differences and influencing factors for Chinese urban resident willingness to pay for green housings: Evidence from five first-tier cities in China. Appl. Energy 2018, 229, 299–313. [Google Scholar] [CrossRef]
  2. Zhu, J.J.; David, A.S.C.; Sainan, L.; Wu, W.W. Optimization method for building envelope design to minimize carbon emissions of building operational energy consumption using orthogonal experimental design (OED). Habitat Int. 2013, 37, 148–154. [Google Scholar] [CrossRef]
  3. Deng, Y.H.; Wu, J. Economic returns to residential green building investment: The developers’ perspective. Reg. Sci. Urban Econ. 2014, 47, 35–44. [Google Scholar] [CrossRef]
  4. Zhang, L.; Wu, J.; Liu, H. Policies to enhance the drivers of green housing development in China. Energy Policy 2018, 121, 225–235. [Google Scholar] [CrossRef]
  5. Zhang, L.; Liu, H.; Wu, J. The price premium for green-labelled housing: Evidence from China. Urban Stud. 2017, 54, 3524–3541. [Google Scholar] [CrossRef]
  6. Allcott, H.; Taubinsky, D. The lightbulb paradox: Evidence from two randomized experiments. NBER Work. Pap. 2015, 19713, 1–70. [Google Scholar]
  7. Kim, S.; Lim, B.T.H.; Kim, J. Green Features, Symbolic Values and Rental Premium: Systematic Review and Meta-analysis. Procedia Eng. 2017, 180, 41–48. [Google Scholar] [CrossRef]
  8. Cheng, A.; Fleischmann, K.R. Developing a meta-inventory of human values. In Proceedings of the American Society for Information Science and Technology, Pittsburgh, PA, USA, 22–27 October 2010. [Google Scholar]
  9. Hossaini, N.; Hewage, K.; Sadiq, R. Spatial life cycle sustainability assessment: A conceptual framework for net-zero buildings. Clean Technol. Envir. Policy 2015, 17, 2243–2253. [Google Scholar] [CrossRef]
  10. Al-Ghamdi, S.G.; Bilec, M.M. Green Building Rating Systems and Whole-Building Life Cycle Assessment: Comparative Study of the Existing Assessment Tools. J. Archit. Eng. 2017, 23, 04016015. [Google Scholar] [CrossRef]
  11. Dwaikat, L.; Ali, K. Measuring the Actual Energy Cost Performance of Green Buildings: A Test of the Earned Value Management Approach. Energies 2016, 9, 188. [Google Scholar] [CrossRef] [Green Version]
  12. Coffie, G.H.; Aigbavboa, C.O.; Thwala, W.D. Modelling construction completion cost in Ghana public sector building projects. Asian J. Civ. Eng. 2019, 20, 1063–1070. [Google Scholar] [CrossRef]
  13. Bond, S.A.; Devine, A. Incentivizing Green Single-Family Construction: Identifying Effective Government Policies and Their Features. J. Real. Estate Financ. Econ. 2016, 52, 383–407. [Google Scholar] [CrossRef]
  14. Chen, W.; Hong, X. Design of effective subsidy policy to develop green buildings: From the perspective of policy benefit. Clean Technol. Environ. Policy 2015, 17, 1029–1038. [Google Scholar] [CrossRef]
  15. Dippold, T.; Mutl, J.; Zietz, J. Opting for a green certificate: The impact of local attitudes and economic conditions. J. Real Estate Res. 2014, 36, 435–473. [Google Scholar]
  16. Lu, Y.J.; Cui, Q.B.; Le, Y. Modeling Green Value Creation in A Construction Company. In Proceedings of the International Conference on Sustainable Design, Engineering, and Construction, Fort Worth, TX, USA, 7–9 November 2012. [Google Scholar]
  17. Cidell, J.; Cope, M.A. Factors explaining the adoption and impact of LEED-based green building policies at the municipal level. J. Environ. Plan. Manag. 2014, 57, 1763–1781. [Google Scholar] [CrossRef]
  18. Kumar, P.; Ghodeswar, B. Factors affecting consumers’ green product purchase decisions. Market. Intell. Plan. 2015, 33, 330–347. [Google Scholar] [CrossRef]
  19. Paul, J.; Modi, A.; Patel, J. Predicting green product consumption using theory of planned behavior and reasoned action. J. Retail. Consum. Serv. 2016, 19, 123–134. [Google Scholar] [CrossRef]
  20. Alzahrani, K.; Hall-Phillips, A.; Zeng, A.Z. Applying the theory of reasoned action to understanding consumers’ intention to adopt hybrid electric vehicles in Saudi Arabia. Transportation 2019, 46, 199–215. [Google Scholar] [CrossRef]
  21. Rich, A.; Brandes, K.; Mullan, B. Theory of planned behavior and adherence in chronic illness: A meta-analysis. J. Behav. Med. 2015, 38, 673–688. [Google Scholar] [CrossRef] [Green Version]
  22. Yadav, R.; Pathak, G.S. Determinants of Consumers’ Green Purchase Behavior in a Developing Nation: Applying and Extending the Theory of Planned Behavior. Ecol. Econ. 2017, 134, 114–122. [Google Scholar] [CrossRef]
  23. Afonso, C.; Gavilan, D.; García-Madariaga, J.; Gonçalves, H.M. Green Consumer Segmentation: Managerial and Environmental Implications from the Perspective of Business Strategies and Practices. In Sustainability in Innovation and Entrepreneurship; Leal-Millan, A., Peris-Ortiz, M., Leal-Rodríguez, A., Eds.; Innovation, Technology, and Knowledge Management; Springer: Cham, Switzerland, 2018; pp. 137–151. [Google Scholar]
  24. Yu, T.K.; Chang, Y.J.; Chang, I.C. A pro-environmental behavior model for investigating the roles of social norm, risk perception, and place attachment on adaptation strategies of climate change. Environ. Sci. Pollut. Res. Int. 2019, 26, 25178–25189. [Google Scholar] [CrossRef] [PubMed]
  25. Arvola, A.; Vassallo, M.; Dean, M.E.A. Predicting intentions to purchase organic food: The role of affective and moral attitudes in the theory of planned behavior. Appetite 2008, 50, 443–454. [Google Scholar] [CrossRef] [PubMed]
  26. Portnov, B.A.; Trop, T.; Svechkina, A.; Ofek, S.; Akron, S.; Ghermandi, A. Factors affecting homebuyers’ willingness to pay green building price premium: Evidence from a nationwide survey in Israel. Build. Environ. 2018, 137, 280–291. [Google Scholar] [CrossRef]
  27. Barima, O. Examination of the best, analogous, competing terms to describe value in construction projects. Int. J. Proj. Manag. 2009, 28, 195–200. [Google Scholar] [CrossRef]
  28. VALiD (Value in Design). VALiD Principles. Available online: https://www.dmi.org/page/DesignValue (accessed on 2 July 2017).
  29. Salvatierra-garrido, J. Conceptualising Value for Construction: Experience from Social Housing Projects in Chile. Ph.D. Thesis, Loughborough University, Loughborough, UK, 2011. [Google Scholar]
  30. Womack, J.P.; Jones, D.T. Lean Thinking; Simon & Schuster: New York, NY, USA, 1998. [Google Scholar]
  31. Zhang, M.; Wu, Z.Y. Constructing and inspection of residential customer perceived value scale. Jiangxi Soc. Sci. 2015, 4, 231–235. [Google Scholar]
  32. Fröch, G. Sustainability issues in the valuation process of project developments. Energy Build. 2015, 100, 2–9. [Google Scholar] [CrossRef]
  33. Aizenman, J.; Jinjarak, Y. Real estate valuation, current account and credit growth patterns, before and after the 2008–2009 crisis. J. Int. Money Financ. 2014, 48, 249–270. [Google Scholar] [CrossRef] [Green Version]
  34. Zhang, L.; Wu, J.; Liu, H. Turning green into gold: A review on the economics of green buildings. J. Clean. Prod. 2018, 172, 2234–2245. [Google Scholar] [CrossRef]
  35. Debrezion, G.; Pels, E.; Rietveld, P. The impact of railway stations on residential and commercial property value. J. Real Estate Financ. 2007, 2, 161–180. [Google Scholar] [CrossRef] [Green Version]
  36. Juan, Y.; Hsu, Y.; Xie, X. Identifying customer behavioral factors and price premiums of green building purchasing. Ind. Mark. Manag. 2017, 64, 36–43. [Google Scholar] [CrossRef]
  37. John, R.; Tsur, S. School Quality and Residential Property Values: Evidence from Vancouver Rezoning. Rev. Econ. Stat. 2010, 92, 928–944. [Google Scholar]
  38. Chu, A.M. Understanding the Performance Gap: An Evaluation of the Energy Efficiency of Three High-performance Building in British Columbia. Master’s Thesis, University of Britich Columbia, Vancouver, BC, Canada, 2016. [Google Scholar]
  39. Lewin, K. Field Theory and Experiment in Social Psychology: Concepts and Methods. Am. J. Sociol. 1939, 44, 868–896. [Google Scholar] [CrossRef]
  40. McMullin, E. The origins of the field concept in physics. Phys. Perspect. 2012, 4, 13–39. [Google Scholar] [CrossRef]
  41. Deutsch, M. Field Theory in Social Psychology. In Handbook of Social Psychology, 2nd ed.; Lindzey, G., Aronson, E.E., Eds.; Wiley: Hoboken, NJ, USA, 1954; pp. 412–487. [Google Scholar]
  42. Martin, J.L. What is field theory. Am. J. Sociol. 2003, 109, 1–49. [Google Scholar] [CrossRef]
  43. Burnes, B.; Cooke, B. Kurt Lewin’s Field Theory: A review and re-evaluation. Int. J. Manag. Rev. 2013, 15, 408–425. [Google Scholar] [CrossRef]
  44. Jin, F.; Li, Q.; Sun, P. Assessment and cluster analysis of regional logistics based on field theory. Econ. Geogr. 2010, 30, 1138–1143. [Google Scholar]
  45. Li, Y. Research of Urban Housing Regeneration Based on Architectural Field. Ph.D. Thesis, Huazhong University of Science & Technology, Wuhan, China, 2012. [Google Scholar]
  46. Koller, M.; Floh, A.; Zauner, A. Further insights into perceived value and consumer loyalty: A “green” perspective. Psychol. Mark. 2011, 28, 1154–1176. [Google Scholar] [CrossRef]
  47. Chen, Y.S.; Chang, C.H. Enhance green purchase intentions. Manag. Decis. 2012, 50, 502–520. [Google Scholar] [CrossRef]
  48. Ashton, A.S.; Scott, N.; Solnet, D.; Breakey, N. Hotel restaurant dining: The relationship between perceived value and intention to purchase. Tour. Hosp. Res. 2010, 10, 206–218. [Google Scholar] [CrossRef]
  49. Ariffin, S.; Yusof, J.; Putit, L.; Shaha, M. Factors influencing perceived quality and repurchase intention towards green products. Procedia Econ. Financ. 2016, 37, 391–396. [Google Scholar] [CrossRef] [Green Version]
  50. Yieh, K.; Chen, J.; Wei, M.B. The effects of technology readiness on customer perceived value: An empirical analysis. J. Fam. Econ. Iss. 2012, 33, 177–183. [Google Scholar] [CrossRef]
  51. Sweeney, J.C.; Soutar, G.N. Consumer perceived value: The development of a multiple item scale. J. Retail. 2001, 77, 203–220. [Google Scholar] [CrossRef]
  52. Zeithaml, V.A. Consumer perceptions of price, quality and value: A means-end model and synthesis of evidence. J. Mark. 1988, 52, 2–22. [Google Scholar] [CrossRef]
  53. Hartmann, P.; Apaolaza Ibáñez, V.; Forcada Sainz, F.J. Green branding effects on attitude: Functional versus emotional positioning strategies. Mark. Intell. Plan. 2005, 23, 9–29. [Google Scholar] [CrossRef]
  54. Feng, Z.Y. Study on the Value Chain and Value Creation of Real Estate Based on Customer Values. Ph.D. Thesis, Jinlin University, Jilin, China, 2009. [Google Scholar]
  55. Makransky, G.; Lilleholt, L. A structural equation modeling investigation of the emotional value of immersive virtual reality in education. Educ. Technol. Res. Dev. 2018, 66, 1141–1164. [Google Scholar] [CrossRef]
  56. Lu, H.; Liu, X.; Chen, H.; Long, R. Employee–Organization Pro-environmental Values Fit and Pro-environmental Behavior: The Role of Supervisors’ Personal Values. Sci. Eng. Ethics. 2019, 25, 519–557. [Google Scholar] [CrossRef]
  57. Wang, P.; Tan, C.H. Correction to: The Effects of Social Class on Individuals’ Decision-Making Tendencies in a Prestige-Money Game: Social Value or Instrumental Value? J. Gambl. Stud. 2019. [Google Scholar] [CrossRef] [Green Version]
  58. Ein-Gar, D.; Levontin, L. Giving from a distance: Putting the charitable organization at the center of the donation appeal. J. Consum. Psychol. 2013, 23, 197–211. [Google Scholar] [CrossRef]
  59. Agerström, J.; Björklund, F. Moral concerns are greater for temporally distant events and are moderated by value strength. Soc. Cogn. 2009, 27, 261–282. [Google Scholar] [CrossRef]
  60. Liviatan, I.; Trope, Y.; Liberman, N. Interpersonal similarity as a social distance dimension implications for perception of others’ actions. J. Exp. Soc. Psychol. 2008, 44, 1256–1269. [Google Scholar] [CrossRef] [Green Version]
  61. Danziger, S.; Montal, R.; Barkan, R. Idealistic advice and pragmatic choice: A psychological distance account. J. Pers. Soc. Psychol. 2012, 102, 1105–1117. [Google Scholar] [CrossRef] [PubMed] [Green Version]
  62. Babbie, E. The Practice of Social Research, 13th ed.; Wadsworth Publishing: Wadsworth, OH, USA, 2013. [Google Scholar]
  63. Umay, E.; Eyigor, S.; Karahan, A.Y.; Gezer, I.A.; Kurkcu, A.; Keskin, D.; Karaca, G.; Unlu, Z.; Tıkız, C.; Vural, M.; et al. The GUSS test as a good indicator to evaluate dysphagia in healthy older people: A multicenter reliability and validity study. Eur. Geriatr. Med. 2019, 10, 879–887. [Google Scholar] [CrossRef]
  64. Zhao, X.; Hwang, B.G.; Low, S.P. Critical success factors for enterprise risk management in Chinese construction companies. Constr. Manag. Econ. 2013, 31, 1199–1214. [Google Scholar] [CrossRef]
  65. Norris, M.; Lecavalier, L. Evaluating the use of exploratory factor analysis in developmental disability psychological research. J. Autism. Dev. Disord. 2010, 40, 8–20. [Google Scholar] [CrossRef]
  66. Aljandali, A. Quantitative Analysis and IBM® SPSS® Statistics; Springer: Cham, Switzerland, 2016. [Google Scholar]
  67. Kazakis, N.; Mattas, C.; Pavlou, A.; Patrikaki, O.; Voudouris, K. Multivariate statistical analysis for the assessment of groundwater quality under different hydrogeological regimes. Environ. Earth Sci. 2017, 76, 349. [Google Scholar] [CrossRef]
  68. Awang, Z. Validating the Measurement Model: CFA. In SEM Made Simple: The Gentle Approach in Learning Structural Equation Modeling; Awang, Z., Ed.; Malaysian Postgraduate Workshop Series (MPWS): Kajang, Malaysis, 2015; pp. 54–74. [Google Scholar]
  69. Gebhardt, G.F.; Carrillat, F.A.; Riggle, R.J.; Locander, W.B. A Market-Based Procedure for Assessing and Improving Content Validity. Cust. Needs Solut. 2019, 8, 1–23. [Google Scholar] [CrossRef]
  70. Zhao, X.; Zhang, W.; He, W.; Huang, C. Research on customer purchase behaviors in online take-out platforms based on semantic fuzziness and deep web crawler. J. Ambient Intell. Hum. Comput. 2019, 10, 1–15. [Google Scholar] [CrossRef]
  71. Pesämaa, O.; Eriksson, P.E.; Hair, J.F. Validating a model of cooperative procurement in the construction industry. Int. J. Proj. Manag. 2009, 27, 552–559. [Google Scholar] [CrossRef]
  72. Hooper, D.; Coughlan, J.; Mullen, M.R. Structural equation modelling: Guidelines for determining model fit. Electron. J. Bus. Res. 2008, 6, 53–60. [Google Scholar]
  73. Hu, L.T.; Bentler, P.M. Cut off criteria for fit indexes in covariance structure analysis: Conventional criteria versus new alternatives. Struct. Equ. Model. 1999, 6, 1–55. [Google Scholar] [CrossRef]
  74. Marsh, H.W.; Hau, K.T. Assessing goodness of fit: Is parsimony always desirable. J. Exp. Educ. 1996, 64, 364–390. [Google Scholar] [CrossRef]
  75. Gefen, D. E-commerce: The role of familiarity and trust. Omega 2000, 28, 725–737. [Google Scholar] [CrossRef] [Green Version]
  76. Gottwaldov, S. An early approach toward graded identity and graded membership in set theory. Fuzzy Set Syst. 2010, 161, 2369–2379. [Google Scholar] [CrossRef]
  77. Han, H.H. Research on Supervision Intensity Model of Pre-sale Capital of Commercial Housing Based on Field Theory; Chongqing University: Chongqing, China, 2016. [Google Scholar]
  78. Zadeh, L.A. Fuzzy Sets and Fuzzy Information-Granulation Theory: Key Selected Papers; Beijing Normal University Press: Beijing, China, 2005. [Google Scholar]
  79. Jahsni, H.; Ei-Gohary, N. Value-sensitive construction: Value discovery in building projects. In Proceedings of the Construction Research Congress 2012, West Lafayette, India, 21–23 May 2012; pp. 797–807. [Google Scholar]
  80. Wang, Y.; Douglas, M.A.; Hazen, B.T.; Dresner, M. Be green and clearly be seen: How consumer values and attitudes affect adoption of bicycle sharing. Transp. Res. Part F Traffic Psychol. Behav. 2018, 58, 730–742. [Google Scholar] [CrossRef]
  81. Kim, C.; Zhao, W.; Yang, K.H. An empirical study on the integrated framework of E-CRM in online shopping: Evaluating the relationships among perceived value, satisfaction, and trust based on customers’ perspectives. J. Electron. Commer. Res. 2008, 6, 1–19. [Google Scholar] [CrossRef] [Green Version]
  82. DeMedeiros, J.F.; Ribeiro, J.L.D.; Cortimiglia, M.N. Influence of perceived value on purchasing decisions of green products. J. Clean. Prod. 2016, 110, 158–169. [Google Scholar] [CrossRef]
  83. Murtagh, N.; Roberts, A.; Hind, R. The relationship between motivations of architectural designers and environmentally sustainable construction design. Constr. Manag. Econ. 2016, 34, 61–75. [Google Scholar] [CrossRef] [Green Version]
  84. Cheung, L.T.O.; Chow, A.S.Y.; Fok, L.Y.K.M.; Chou, K.L. The effect of self-determined motivation on household energy consumption behavior in a metropolitan area in southern China. Energy Effic. 2017, 10, 549–561. [Google Scholar] [CrossRef]
  85. Shaw, D.; McMaster, R.; Newholm, T. Care and Commitment in Ethical Consumption: An Exploration of the ‘Attitude–Behavior Gap’. J Bus. Ethics 2016, 136, 251–265. [Google Scholar] [CrossRef]
  86. Liu, Y.; Hong, Z.; Zhu, J.; Yan, J.; Qi, J.; Liu, P. Promoting green residential buildings: Residents’ environmental attitude, subjective knowledge and social trust matter. Energy Policy 2016, 112, 152–161. [Google Scholar] [CrossRef]
  87. Mathias, K.; Kermode, M.; Goicolea, I.; Seefeldt, L.; Shidhaye, R.; San, S.M. Social Distance and Community Attitudes Towards People with Psycho-Social Disabilities in Uttarakhand, India. Community Ment. Health J. 2018, 54, 343–353. [Google Scholar] [CrossRef] [PubMed]
  88. Li, Y.; Yang, L.; He, B.; Zhao, D. Green building in China: Needs great promotion. Sustain. Cities Soc. 2014, 11, 1–6. [Google Scholar] [CrossRef]
Figure 1. Connection between physics field theory and psychology field theory.
Sustainability 11 06877 g001
Figure 2. Relationship among field theory, green residential building (GRB), and homebuyers.
Sustainability 11 06877 g002
Figure 3. The system of green residential buildings, environment, and individual.
Sustainability 11 06877 g003
Figure 4. Loading estimates in the structural equation modelling (SEM).
Sustainability 11 06877 g004
Table 1. Value field factor.
ItemsIndicators
Transportation development levelNumber of civilian vehicles per capita (K11), number of buses per capita (K12), total rail mileage (K13)
Economic development levelDisposable income per capita (K21), GDP (K22), GDP growth rate (K23)
Society development levelEngel coefficient (K31), unemployment rate (K32), homebuyer population (K33)
Housing demandResidential sales price (K41), residential sales area (K42), living space per capita (K43)
Table 2. Comprehensive evaluation value of K.
BeijingShanghaiGuangzhouShenzhenNanjingTianjin
K1.15561.18640.89491.07620.96410.7230
Table 3. The factors of GPV dimensions.
Initial DimensionsFactors
Functional valueA1 (High quality), A2 (Physical and mental health)
Economic valueA3 (Abandoning GRB because of the high price), A4 (GRB preference due to low maintenance cost), A5 (GRB preference due to low utilization cost)
Emotional valueA6 (Stimulation of purchase desire), A7 (Be relieved), A8 (Be in harmony with nature), A9 (Lifestyle and attitude reflection)
Green valueA10 (Ecological environment improvement), A11 (Environmental awareness promotion)
Social valueA12 (Sustainable development), A13 (Winning more praise), A14 (Creating a healthy image), A15 (Reflection of social responsibility sense)
Table 4. Reliability analysis of the scale.
ScaleIndicatorDescription of IndicatorFinal IndicatorCITCCronbach’s Alpha
Scale after Deleting the IndicatorOriginal ScaleWhole Model
Green perceived value (P—the electric quantity of field source)A1High qualityA10.6420.9450.9470.941
A2Physical and mental healthA20.6560.945
A3Abandoning GRB because of the high price 0.0930.958
A4GRB preference due to low maintenance costA40.6740.945
A5GRB preference due to low utilization costA50.6630.945
A6Stimulation of purchase desire 0.7980.942
A7Be relievedA70.8220.941
A8Be in harmony with natureA80.8510.941
A9Lifestyle and attitude reflectionA90.8200.941
A10Ecological environment improvementA100.8160.941
A11Environmental awareness promotionA110.8420.941
A12Sustainable developmentA120.7890.942
A13Winning more praiseA130.8130.941
A14Creating a healthy imageA140.7910.942
A15Reflection of social responsibility senseA150.7720.942
GRB-demand (Q—the electric quantity of target charge)B1Education 0.1090.8690.864
B2Households 0.0410.879
B3Age −0.0200.873
B4Household annual income 0.0420.874
B5Green energyB50.6020.851
B6Water saving apparatusB60.6770.848
B7Energy reductionB70.7090.847
B8VentilationB80.7070.848
B9Noise barrierB90.6950.849
B10GreenB100.6030.853
B11Green materialB110.6850.850
B12Less environmental pollutionB120.7410.847
B13Changing lifestyleB130.6570.850
B14Active access to environmental informationB140.5780.853
B15Worried about environmental pollutionB150.7570.847
B16Active participation in environmental protection activityB160.6650.850
B17Utilities of disposable products −0.0250.877
B18Resource savingsB180.3950.860
B19Purchase energy conservation appliancesB190.5640.854
B20Purchase environmental detergentB200.4130.859
Psychological distance (R)C1Influenced by people aroundC10.4680.8680.872
C2Influenced by developersC20.5380.864
C3Influenced by the governmentC30.3940.871
C4Influenced by families’ suggestions 0.2430.878
C5Influenced by friends’ suggestionsC50.5160.865
C6Realization of GRBC60.5510.863
C7Realization of resource savings C70.6430.858
C8Realization of living comfortC80.7030.854
C9Realization of environmental protectionC90.6590.857
C10Realization of the high priceC100.6350.858
C11Realization of low utilization costC110.6670.856
C12Road accessC120.5030.866
C13Improved public transportC130.5590.863
Table 5. KMO and Bartlett’s test [67].
Kaiser–Meyer–Olkin Measure0.911
Bartlett’s test of sphericityApprox. chi-square8044.256
df820
Sig.0.000
Table 6. Factor structure and principal factor extraction and varimax rotation on value field scales.
Number ItemFactor LoadingPercentage of Variance ExplainedCumulative Percentage of Variance Explained
Scale 1 Green Perceived Value (GPV)
D1 perceived value of benefit 65.43965.439
A10.563
A20.600
A70.741
A80.815
A90.794
A100.813
A110.883
A120.781
A130.811
A140.832
A150.823
D2 perceived value of cost 7.90773.346
A40.909
A50.908
Scale 2 Green Residential Building-demand (GRB-d)
D3 eco-friendliness 50.87250.872
B80.762
B90.793
B100.852
B110.862
B120.744
D4 environmental awareness 10.26761.139
B130.822
B140.843
B150.666
B160.776
D5 energy conservation 8.51669.656
B50.819
B60.863
B70.805
D6 environmental protection habit 7.66977.325
B180.816
B190.641
B200.792
Scale 3 Psychological Distance (PD)
D7 cognitive distance 44.15244.152
C60.854
C70.898
C80.903
C90.833
C100.847
C110.738
D8 social distance 20.20264.354
C10.808
C20.810
C30.677
C50.845
D9 spatial distance 10.71875.073
C120.920
C130.906
Table 7. Confirmatory factor analysis results.
IndicesAcceptable LevelSourceGreen Perceived ValueGRB DemandPsychological Distance
χ2/DOF<5.0[71]0.280.341.97
GFI≥0.9[72]0.941.000.91
CFI≥0.95[73]0.931.000.95
p-Value≥0.05[74]1.001.001.00
AGFI≥0.8[75]0.920.990.92
RMSEA≤0.05[74]0.0490.000.075
Table 8. Factor set in each scale, including the indices.
ScaleFirst-Level (Factor Set, Weight)Second-LevelWeight
GPV ( U 1 )Perceived value of benefits ( U 1 1 , 0.892)High quality ( U 10 1 )0.043
Physical and mental health ( U 11 1 )0.062
Be relieved ( U 12 1 )0.066
Be in harmony with nature ( U 13 1 )0.089
Lifestyle and attitude reflection ( U 14 1 )0.087
Ecological environment improvement ( U 15 1 )0.099
Environmental awareness promotion ( U 16 1 )0.127
Sustainable development ( U 17 1 )0.088
Winning more praise ( U 18 1 )0.101
Creating a healthy image ( U 19 1 )0.117
Reflection of social responsibility sense ( U 19 + 1 )0.120
Perceived value of cost ( U 2 1 , 0.108)GRB preference due to low maintenance cost ( U 20 1 )0.496
GRB preference due to low utilization cost ( U 21 1 )0.504
GRB-demand ( U 2 )Eco-friendliness ( U 1 2 , 0.658)Ventilation ( U 10 2 )0.172
Noise barrier ( U 11 2 )0.192
Green ( U 12 2 )0.249
Green material ( U 13 2 )0.230
Less environmental pollution ( U 14 2 )0.157
Environmental awareness ( U 2 2 , 0.133)Changing lifestyle ( U 20 2 )0.280
Active access to environmental information ( U 21 2 )0.304
Worried about environmental pollution ( U 22 2 )0.170
Active participation in environmental protection activity ( U 23 2 )0.246
Energy conservation ( U 3 2 ,0.110)Green energy ( U 30 2 )0.339
Water saving apparatus ( U 31 2 )0.354
Energy reduction ( U 32 2 )0.308
Environmental protection behavior ( U 4 2 ,0.099)Resource savings ( U 40 2 )0.383
Purchase energy conservation appliances ( U 41 2 )0.256
Purchase environmental detergent ( U 42 2 )0.361
Psychological Distance ( U 3 )Cognitive distance ( U 1 3 , 0.588)Realization of GRB ( U 10 3 )0.223
Realization of resource savings ( U 11 3 )0.223
Realization of living comfort ( U 12 3 )0.217
Realization of environmental protection ( U 13 3 )0.2
Realization of the high price ( U 14 3 )0.212
Realization of low utilization cost ( U 15 3 )0.147
Social distance ( U 2 3 , 0.269)Influenced by people around ( U 20 3 )0.267
Influenced by developers ( U 21 3 )0.256
Influenced by the government ( U 22 3 )0.204
Influenced by friends’ suggestion ( U 23 3 )0.273
Spatial distance ( U 3 3 , 0.143)Road access ( U 30 3 )0.507
Improved public transport ( U 31 3 )0.493
Table 9. Grades corresponding to the five intervals.
GradeVery LowRelatively LowMediumRelatively HighVery High
Internal[0.2, 1](1, 2](2, 3.33](3.33, 6](6, 25]

