Is Seoul Walkable? Assessing a Walkability Score and Examining Its Relationship with Pedestrian Satisfaction in Seoul, Korea


1
Department of Urban Planning, Keimyung University, 1095 Dalgubeol-daero, Dalseo-gu, Daegu 42601, Korea
2
Department of Real Estate, Graduate School of Tourism, Kyung Hee University, 26 Kyungheedae-ro, Dongdaemun-gu, Seoul 02447, Korea
*
Author to whom correspondence should be addressed.
Sustainability 2019, 11(24), 6915; https://0-doi-org.brum.beds.ac.uk/10.3390/su11246915
Submission received: 22 October 2019
/
Revised: 22 November 2019
/
Accepted: 30 November 2019
/
Published: 4 December 2019
(This article belongs to the Special Issue Walkable living environments)
Abstract
:Studies have assessed neighborhood walkability responding to increasing interest in academics, practitioners, and policy makers. While Walk Score is a well-operationalized and efficient measure of neighborhood walkability, it is not supported in the Asian context. We thus developed a “Walkability Score” for use in Seoul, South Korea, following the Walk Score algorithm and then conducted a logistic regression for a satisfied versus dissatisfied binary outcome in order to conduct an empirical test. Results showed a significant association between Walkability Score and pedestrian satisfaction. We also explored sample locations and found some discrepancies between Walkability Score and the degree of pedestrian satisfaction. While some sample locations near parks, and rivers and waterfront spaces (but without destinations for walking trips such as banking or shopping) revealed low Walkability Scores, the degree of pedestrian satisfaction was relatively high in these areas. Some samples located in residential areas with well-designed sidewalks and greenery revealed relatively high pedestrian satisfaction, but Walkability Scores were insufficient. This study’s Walkability Score was somewhat valid for approaching the issue, but further research is needed to complete this measure, especially in high-density areas with well-equipped pedestrian infrastructures (e.g., crosswalks, pedestrian streets).
1. Introduction
Neighborhood walkability has been a highly important policy implementation for ensuring better community outcomes. Beyond the normative view, empirical studies have revealed improved social, environmental, economic, and health outcomes in areas with walkable neighborhoods [1,2,3,4,5,6,7,8,9,10,11,12,13,14]. For example, neighborhood walkability is associated with enhanced social capital via resident interaction [1,2,3], improved air quality through reduced traffic congestion [4,5,6], increased housing prices [7,8,9], improved overall health [10,11,12,13], and economic resilience effects [14].
While there are many promising benefits to improving neighborhood walkability, there is still some debate over how such a walkable environment is built. Here, specific measurements are needed to objectively determine this achievement. An increasing number of studies are implementing Geographic Information Systems (GISs) technology to provide a more objective approach to operationalizing neighborhood walkability. Some have already identified built-environment measures, including population density, residential density, mixed land usage, street connectivity, and destination accessibility [15,16,17,18,19]. Most of these studies have suggested that more compact, connected, and mixed neighborhoods are conducive to walking. However, there have also been unexpected findings based on some of the individual measurements [20,21,22]. Lack of measurement consistency and clarity was noted as a possible explanation for the inconsistent results across the literature [20,21,22]. These inconsistent results have created the need for a more generalized measurement tool [20,23].
Rather than using various individual measurements to determine walkability, some researchers have attempted to combine these factors into a single conceptual index. This is advantageous for estimating the walkability effect while reducing multicollinearity concerns [18]. Frank et al. (2009) suggested the implementation of a walkability index based on normalized scores for the elements of residential density, mixed land usage, street connectivity, and the floor-area ratios (FARs) of commercial properties [18]. Kuzmyak et al. (2006) suggested a walk opportunities index based on the gravity model approach [24].
Walk Score is also a popular composite index for representing the degree of environmental walkability [25]. It is based on measures of destination accessibility (e.g., coffee shops, libraries, and restaurants), block length, and street connectivity within a predetermined network-distance boundary [26]. Previous studies have validated Walk Score for use in US and Canadian locations. The studies have significantly associated Walk Score with objective environmental measures [27,28,29]. Walk Score uses a patented system to evaluate walkability at a given location using various data sources from Education.com, Open Street Map, Google, and the US Census [25]. It is provided on their website (walkscore.com) as the calculated score ranging from 0 to 100, which can be classified into five degrees of the walkability level, such as “car-dependent (0–24),” “somewhat car-dependent (25–49),” “somewhat walkable (50–69),” “very walkable (70–89),” and “walker’s paradise (90–100).” Therefore, Walk Score is regarded as a well-operationalized and efficient measure in terms of usage and interpretation [25]. With these reasons, a variety of studies in several other fields have increasingly used Walk Score as it is associated with health outcomes (e.g., overall mental health and depression) [30,31], healthy behavior [30,32,33,34], low crime [35], and premium housing prices [8,9]. Some recent studies have also employed Walk Score to examine the association between neighborhood walkability and lower levels of foreclosure [36] and mortgage defaulting [37].
While Walk Score is attractive as a walkability measure, it has only been provided in the US, Canada, Australia, and New Zealand [38]. A growing number of studies are focusing on the effects of walkability in Asian locations, but few have attempted to do so using a neighborhood walkability index. Koohsari et al. (2018) examined the validity of Walk Score among 1072 residential addresses in Tokyo, Japan [39]. The researchers specifically tested the validity of Walk Score according to five GIS-based environmental elements (also indicators used to calculate Walk Score) and conducted correlation analyses between Walk Score and environmental attributes. Results showed some significant correlations of Walk Score with intersection density and the number of local destinations. However, although Walk Score is provided in Asian locations, the accuracy and application of Walk Score still need to be verified because data sources used for calculating Walk Score are not available in Asian locations. A recent study by Zhang et al. (2019) assessed neighborhood walkability in Futian District, Shenzhen, China, following the Walk Score approach [40], but their focus was to examine its association with property value.
This study implements the Walk Score algorithm to measure a neighborhood walkability index (hereafter, Walkability Score) and further explores its potential for application in the high-dense urban context of Asian cities, like Seoul. This requires several steps. We first determine Seoul’s Walkability Score following the Walk Score methodology. We then use survey data retrieved by the Seoul city government to examine how Walkability Score is associated with pedestrian satisfaction. We also obtain Walk Scores (using the official website, walkscore.com) for sample locations in Seoul to compare them with Walkability Scores at the same locations. We then conduct a comprehensive analysis of these samples to determine any discrepancies between Walkability Score and pedestrian satisfaction.
2. Materials and Methods
2.1. Study Area
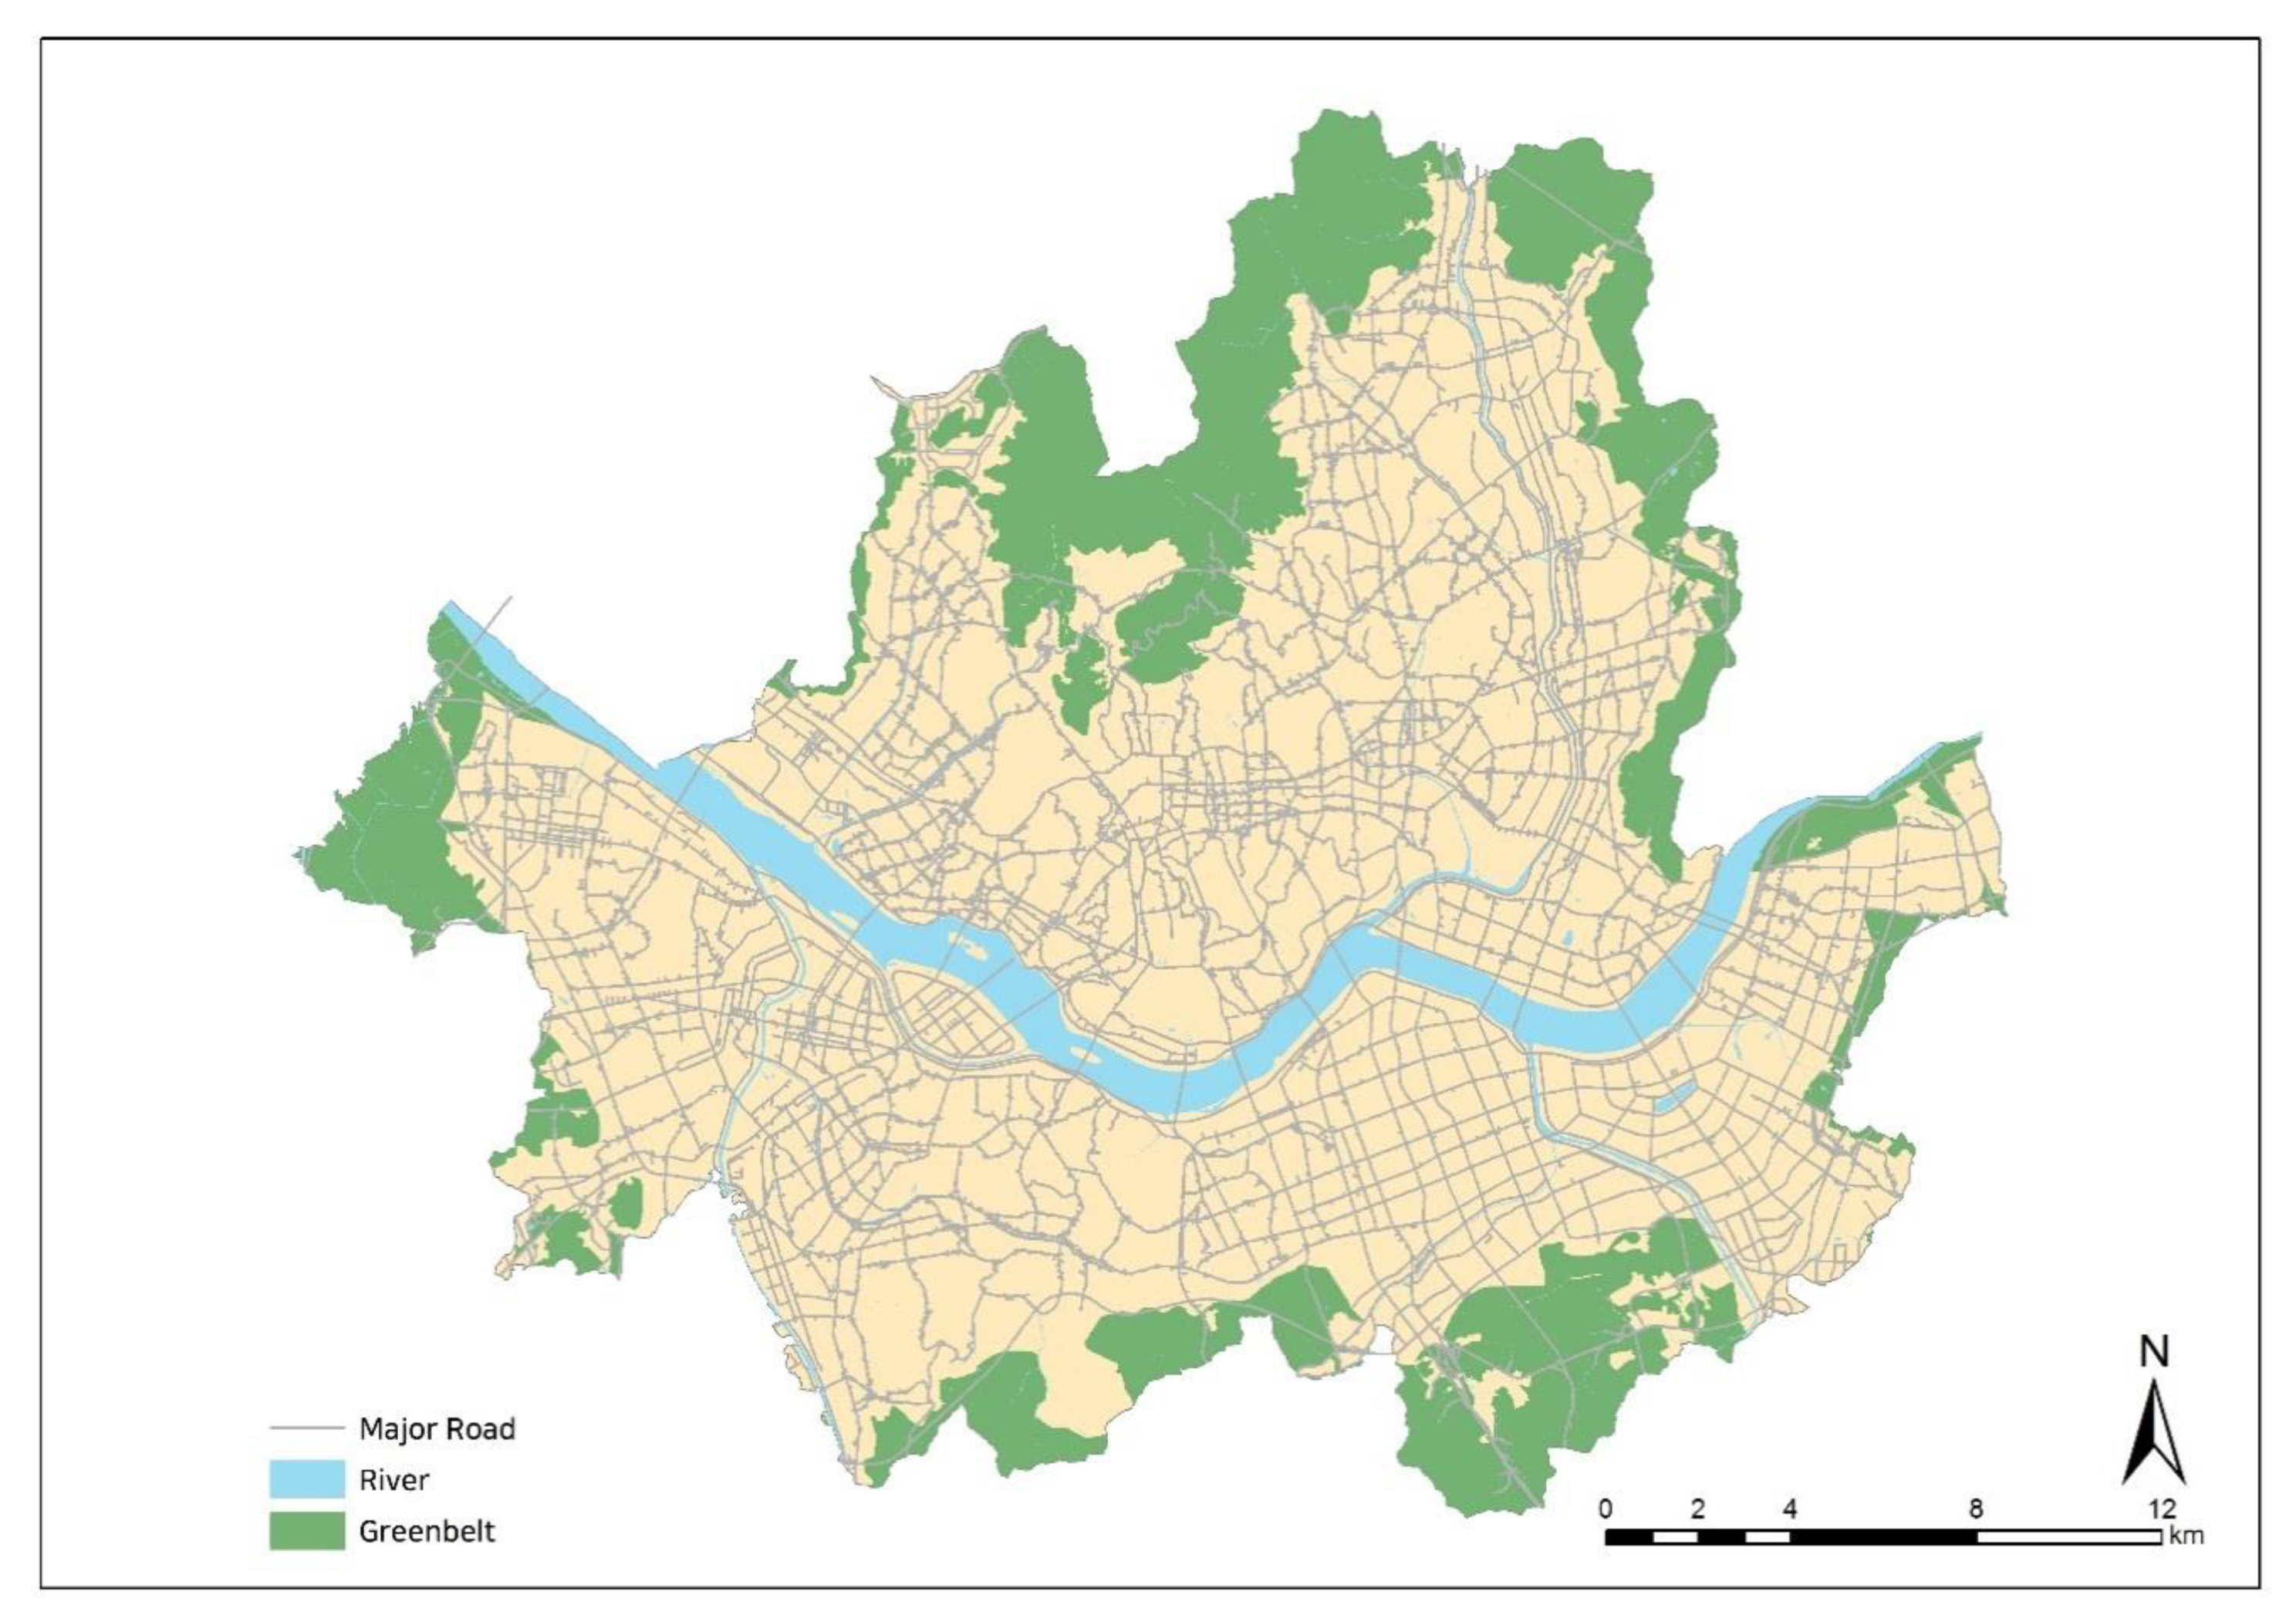
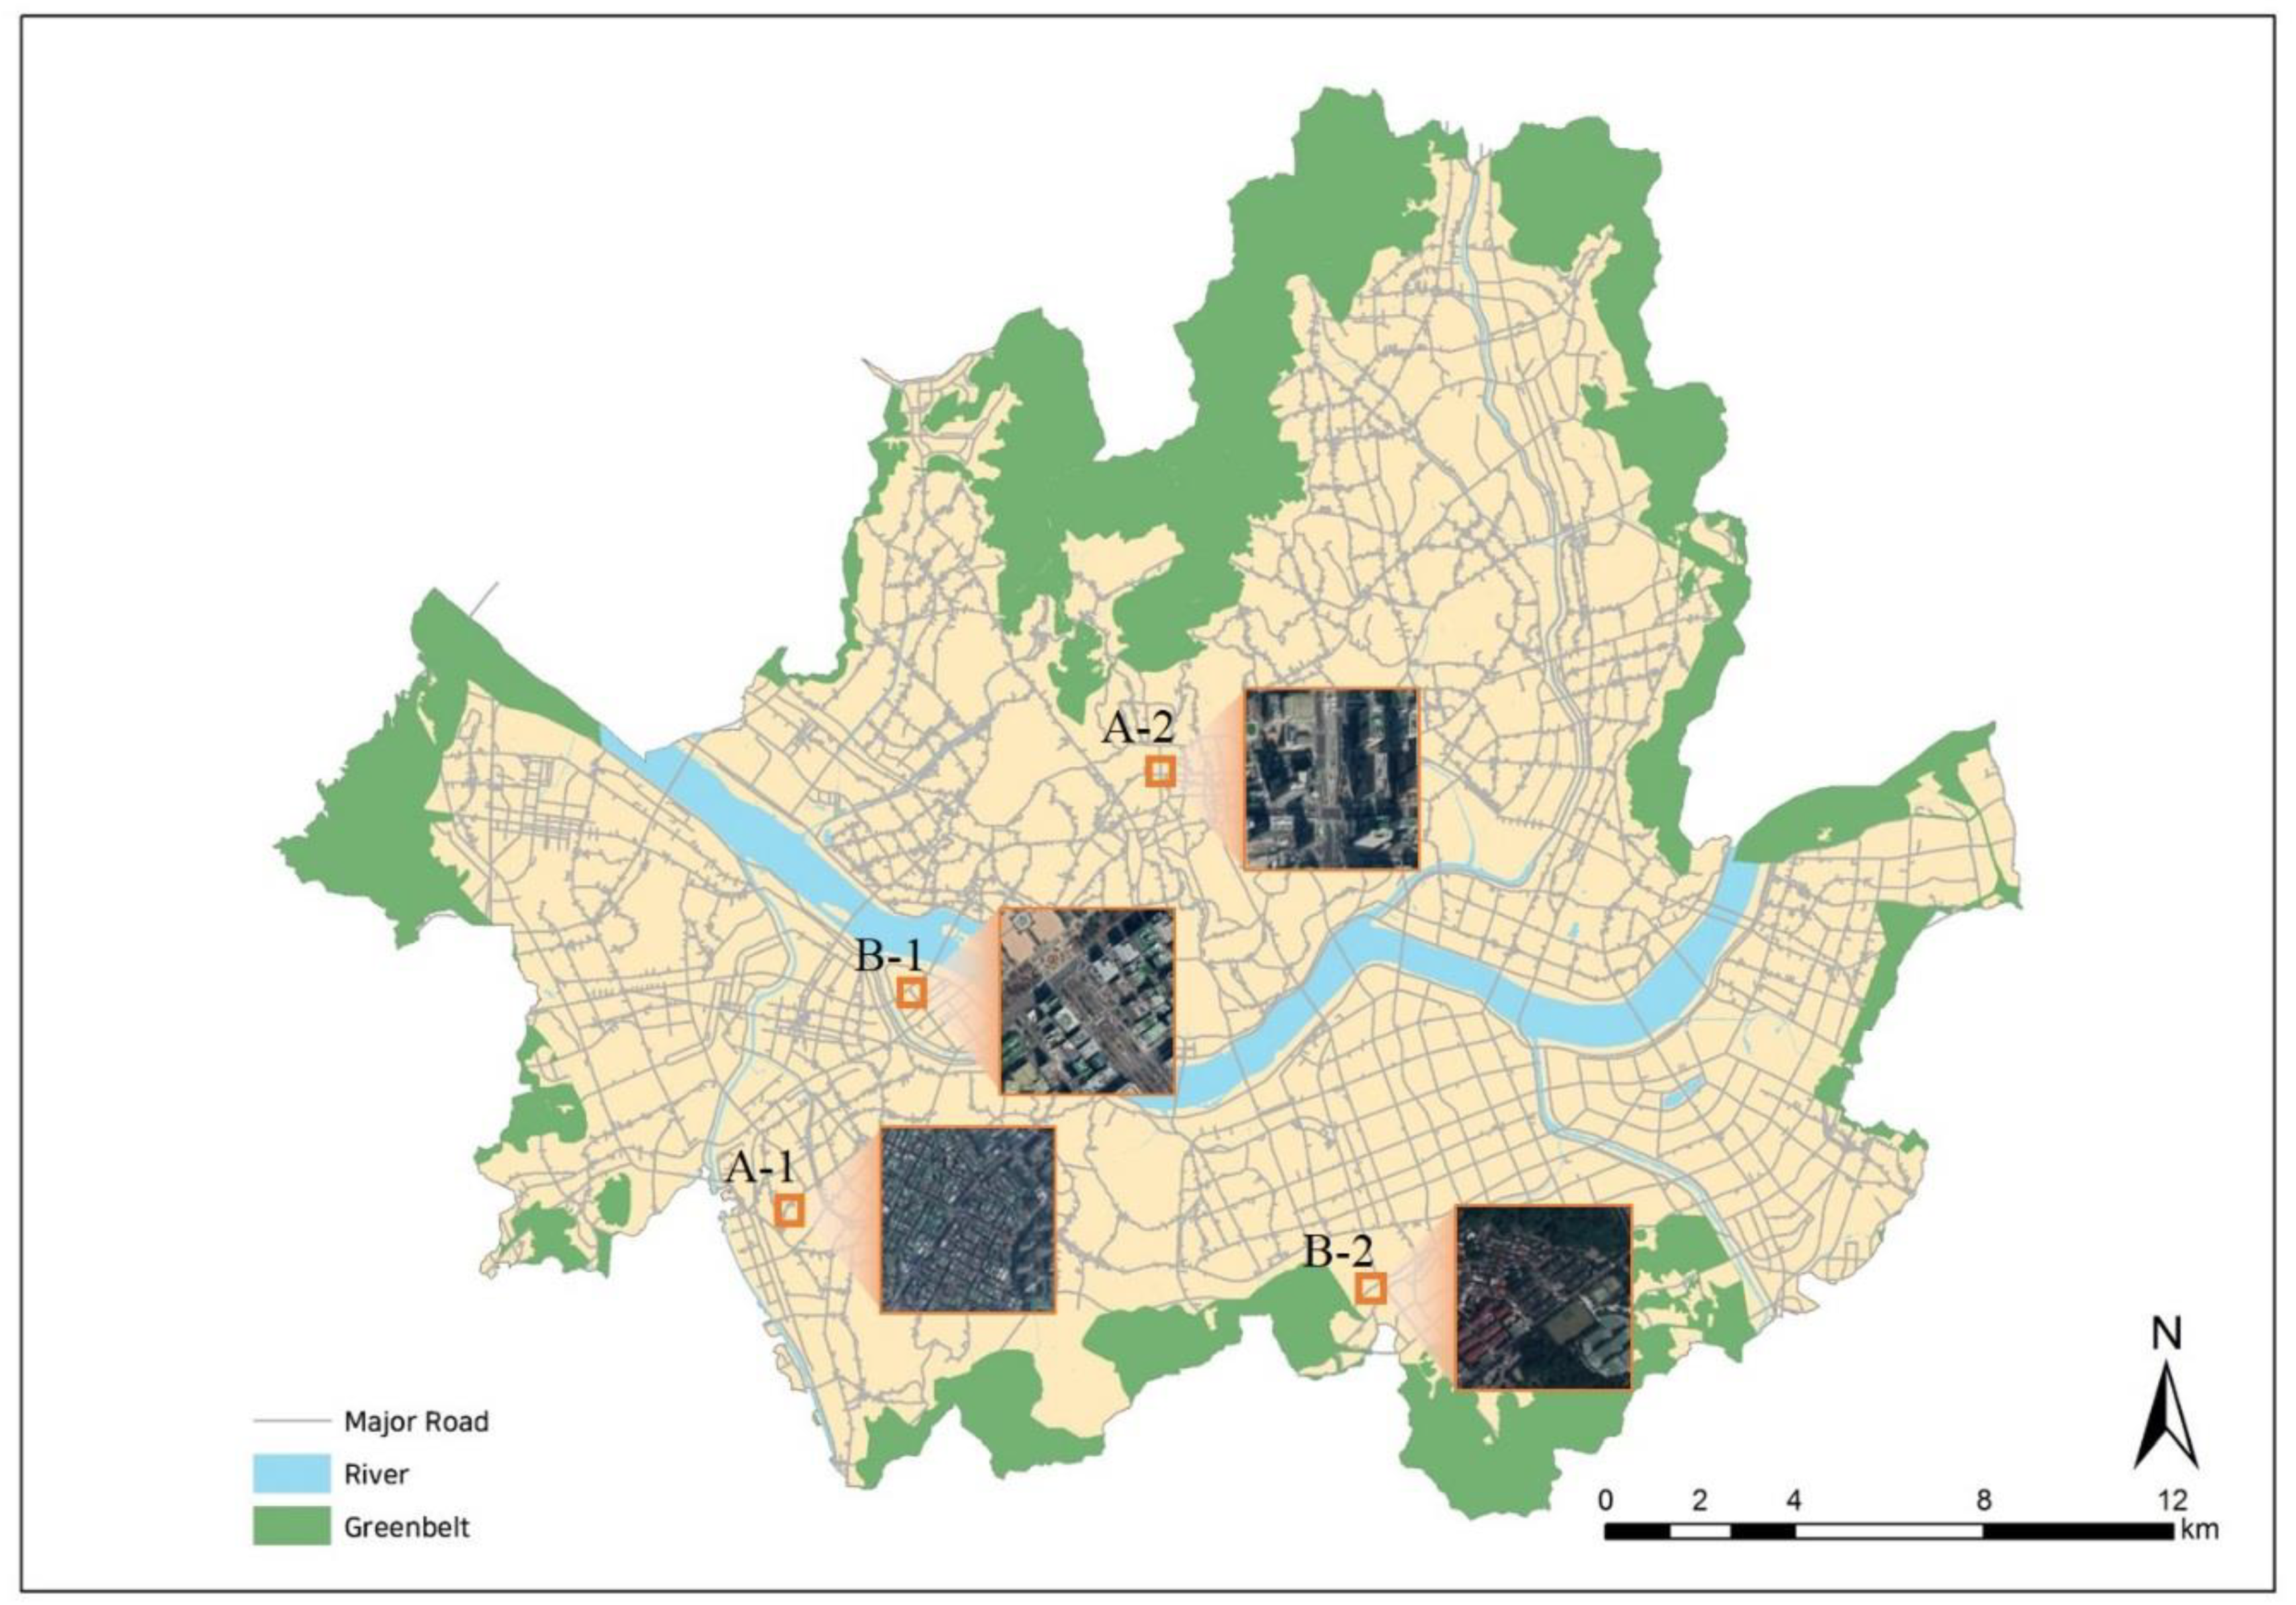
This study was conducted in Seoul, the largest and most urbanized city in South Korea. While Seoul only comprises 0.6% (605.2 km2) of the total land area in South Korea, it contains approximately 20% (9,857,426 individuals) of the total national population as of 2017 [41]. While smaller in land area, its population is larger than New York City’s (approximately 8,398,000 individuals throughout 782 km2) [42]. As shown in Figure 1, the Han River runs through Seoul from east to west. It accounts for 6.3% of Seoul’s total area. Further, approximately 25% of the city is designated as a greenbelt (mostly near the borders) [41].
2.2. Calculating the Walkability Score
2.2.1. Applying the Walk Score Methodology
Other studies have thoroughly described the Walk Score methodology [26,38,43]. As such, it is briefly summarized here. The original Walk Score is calculated on the basis of accessibility to nearby amenities that are within walkable distance, scores are then adjusted for intersection density and block length. In this context, amenities comprise nine destination categories (i.e., groceries, restaurants, shopping, coffee shops, banks, parks, schools, libraries, and entertainment). The closest amenities are used to create scores for each category. Here, full points are given for those within 0.25 miles. A distance decay function is then adapted for amenities between 0.25 and 1.5 mile distances. Multiple amenities are counted in the categories where various types and options can be considered, such as restaurant, shopping, and coffee shop categories, while only one destination is counted in the other six categories, such as grocery, bank, park, school, and entertainment. For example, people usually use the closest retail from home when choosing a retail, but we also need to consider various types of retail, such as shoes, food stores, and clothing. The categories of grocery, restaurant, shopping, and coffee shop are weighted because they are regarded as destinations that generate additional walking trips. For example, grocery stores are three times as important as parks. While the Walk Score counts the nearest grocery store as a fully weighted 3, it differently weights the 10 closest restaurants. Intersection density and average block length are included as the key measures of pedestrian friendliness promoting walking. Poor intersection density and average block length are considered penalty elements. For example, areas with over 200 intersections per square miles and 120 m of average block length do not receive any losing points, but areas with poor intersection density and long average block length receive penalties equivalent to up to 5% of the total score.
We closely followed the Walk Score algorithm to calculate our Walkability Score. We thus obtained geospatial data sources published in 2017 from government websites, including the Seoul Open Data Plaza [44], Road Name Address [45], National Spatial Data Infrastructure Portal [46], and Open Data Portal [47], in addition to three private cinema companies [48,49,50]. See Table 1 for details.
2.2.2. Modifying the Walk Score Methodology
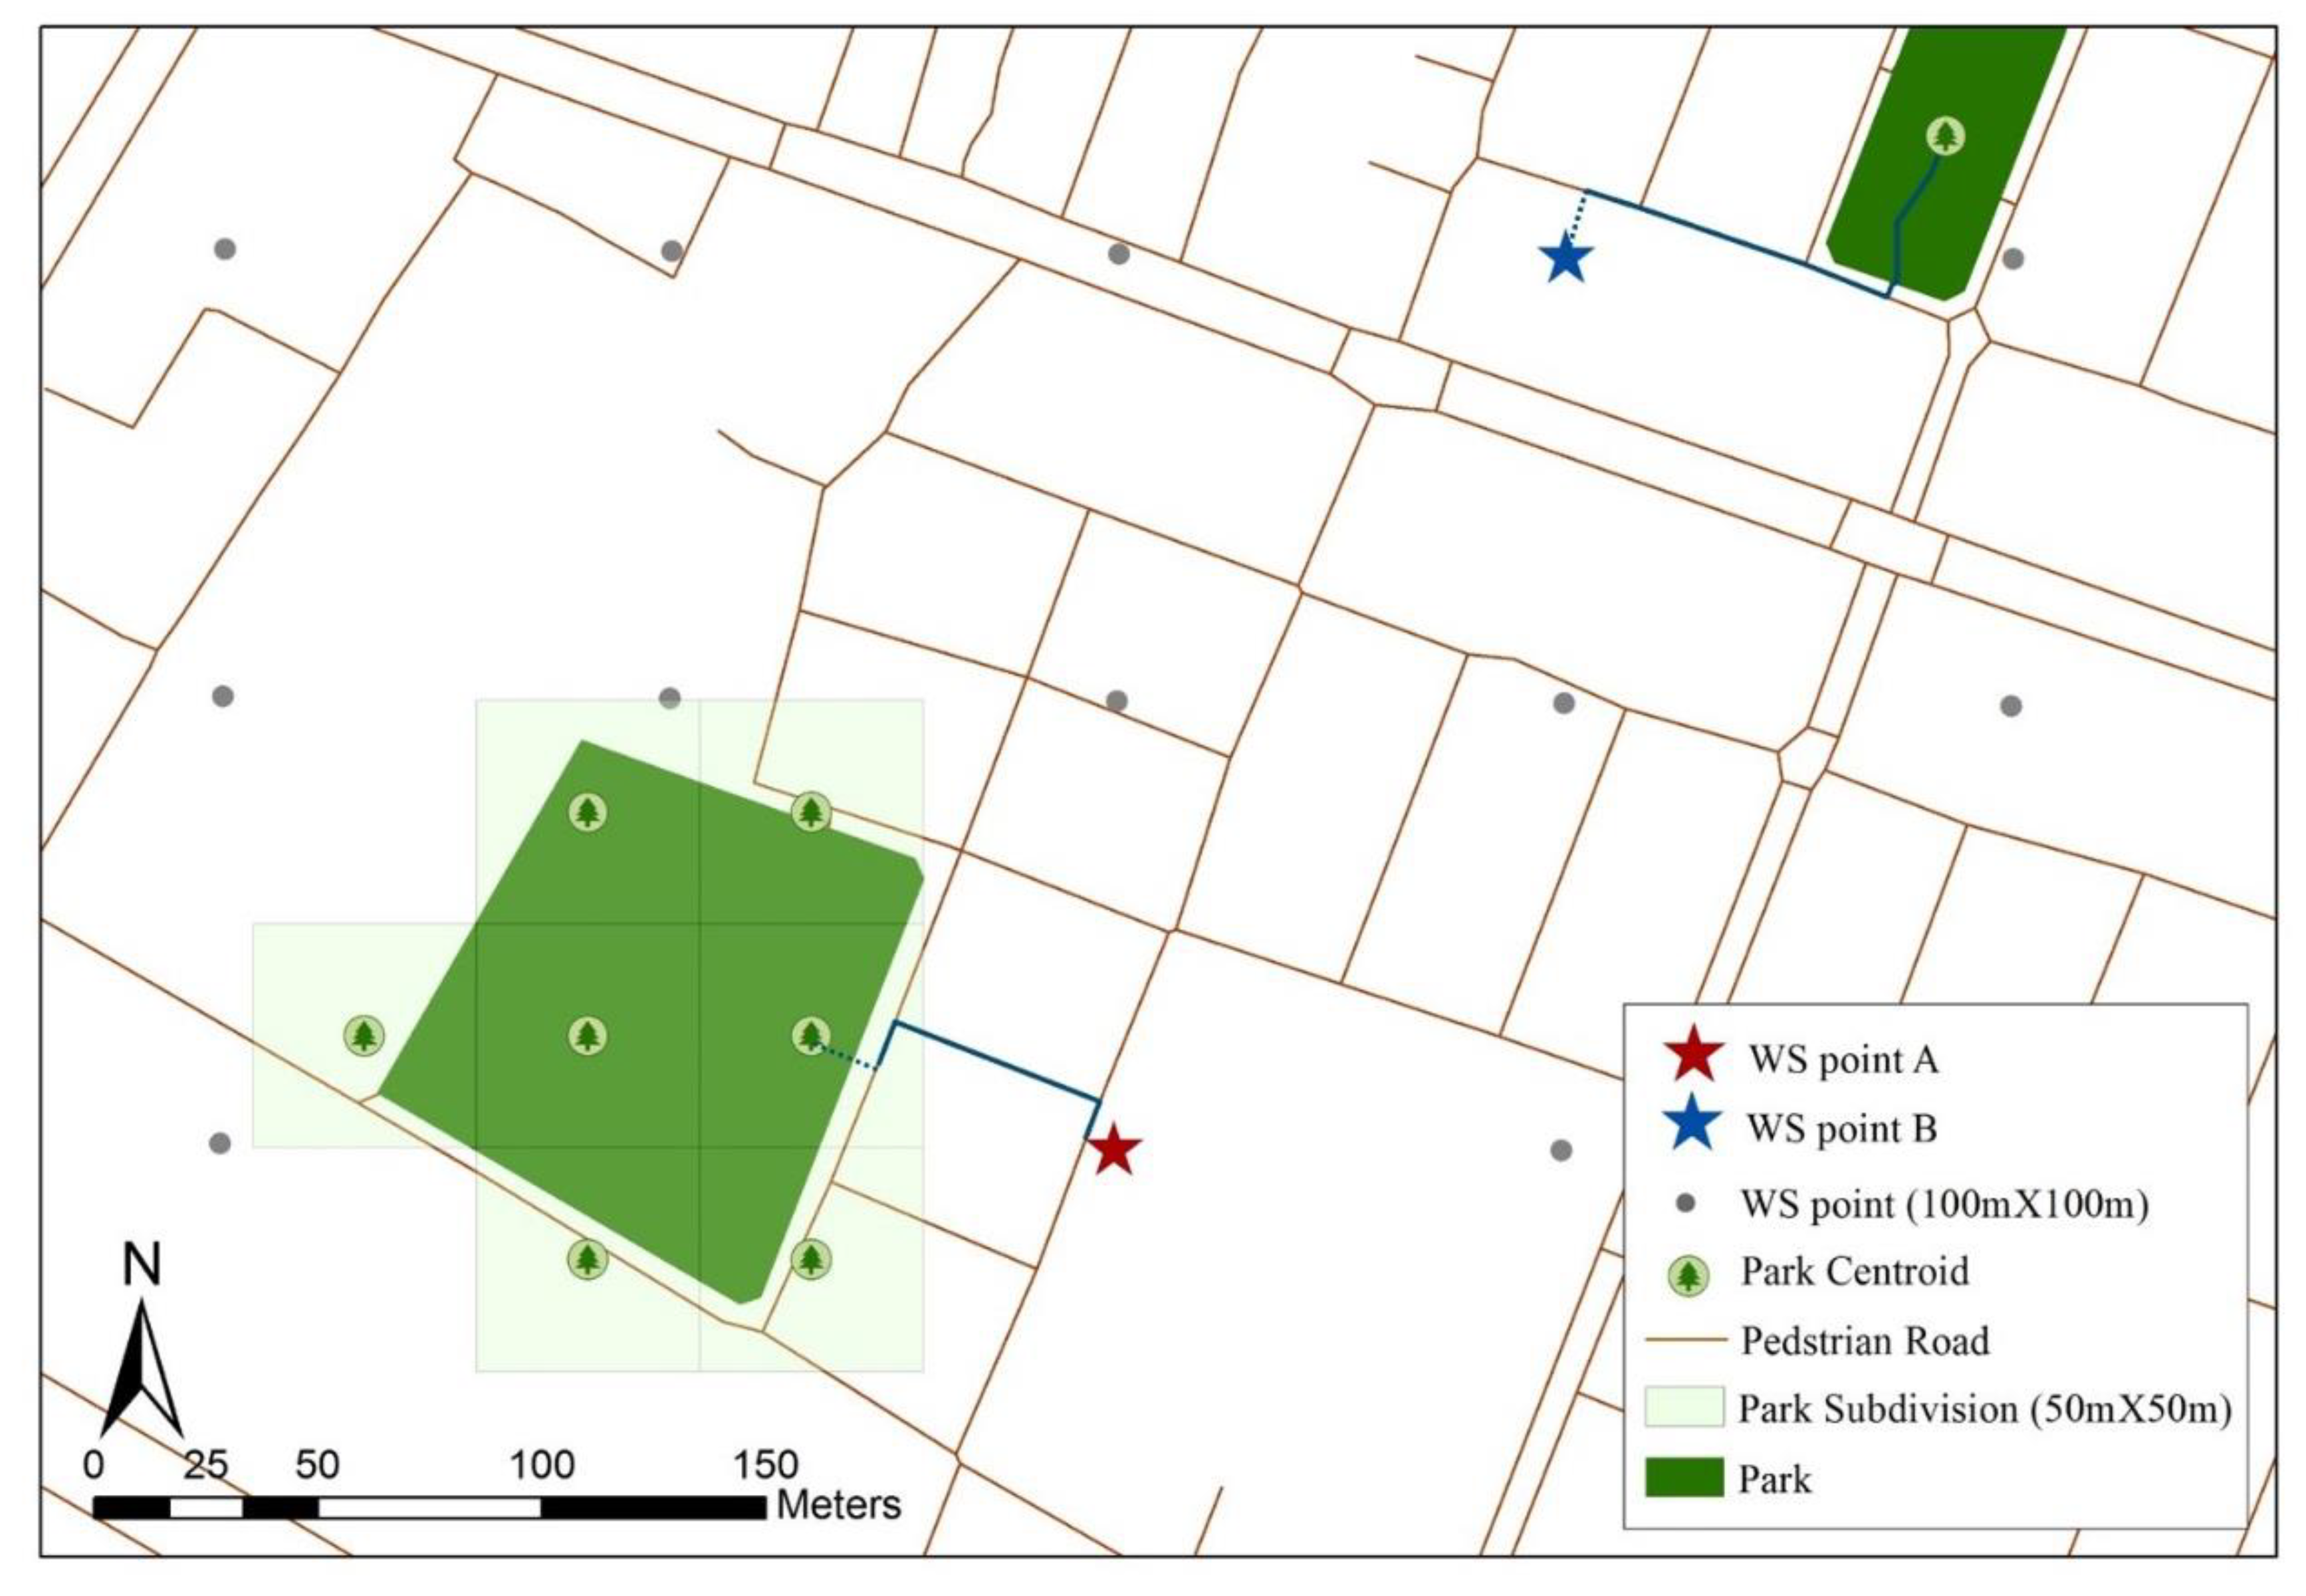
We modified the Walk Score methodology to include the following two parts: (1) distance to park and (2) distance decay function. For distance to park, the Walk Score measures the distance to the park centroid rather than to the entrance or the nearest boundary. However, this approach may increase measurement errors as park sizes increase. Further, our data did not include information about main entrance points and it was difficult to find the nearest boundary point to measure distance. Thus, if a park size was greater than 2500 m2, we divided it into 50 m × 50 m grid cells and calculated the distance to the park from the centroid of the nearest grid cell. If a park size was less than 2500 m2, then the distance to the park was calculated from the park centroid in the same way as done to achieve a Walk Score. Figure 2 shows an example of how we measured the distance to a park. As the park on the left side of the figure is over 2500 m2, the nearest centroid of grid cells was used to measure the network distance to the park. We used Create Fishnet Xtools Pro of ArcGIS to create a net of rectangular cells that subdivided the park based on the given length of rows and columns. Then, we created a centroid of each cell and calculated the distance from WS point A to the nearest centroid. The park on the right side of the figure is less than 2500 m2, and thus the centroid of the park was used.
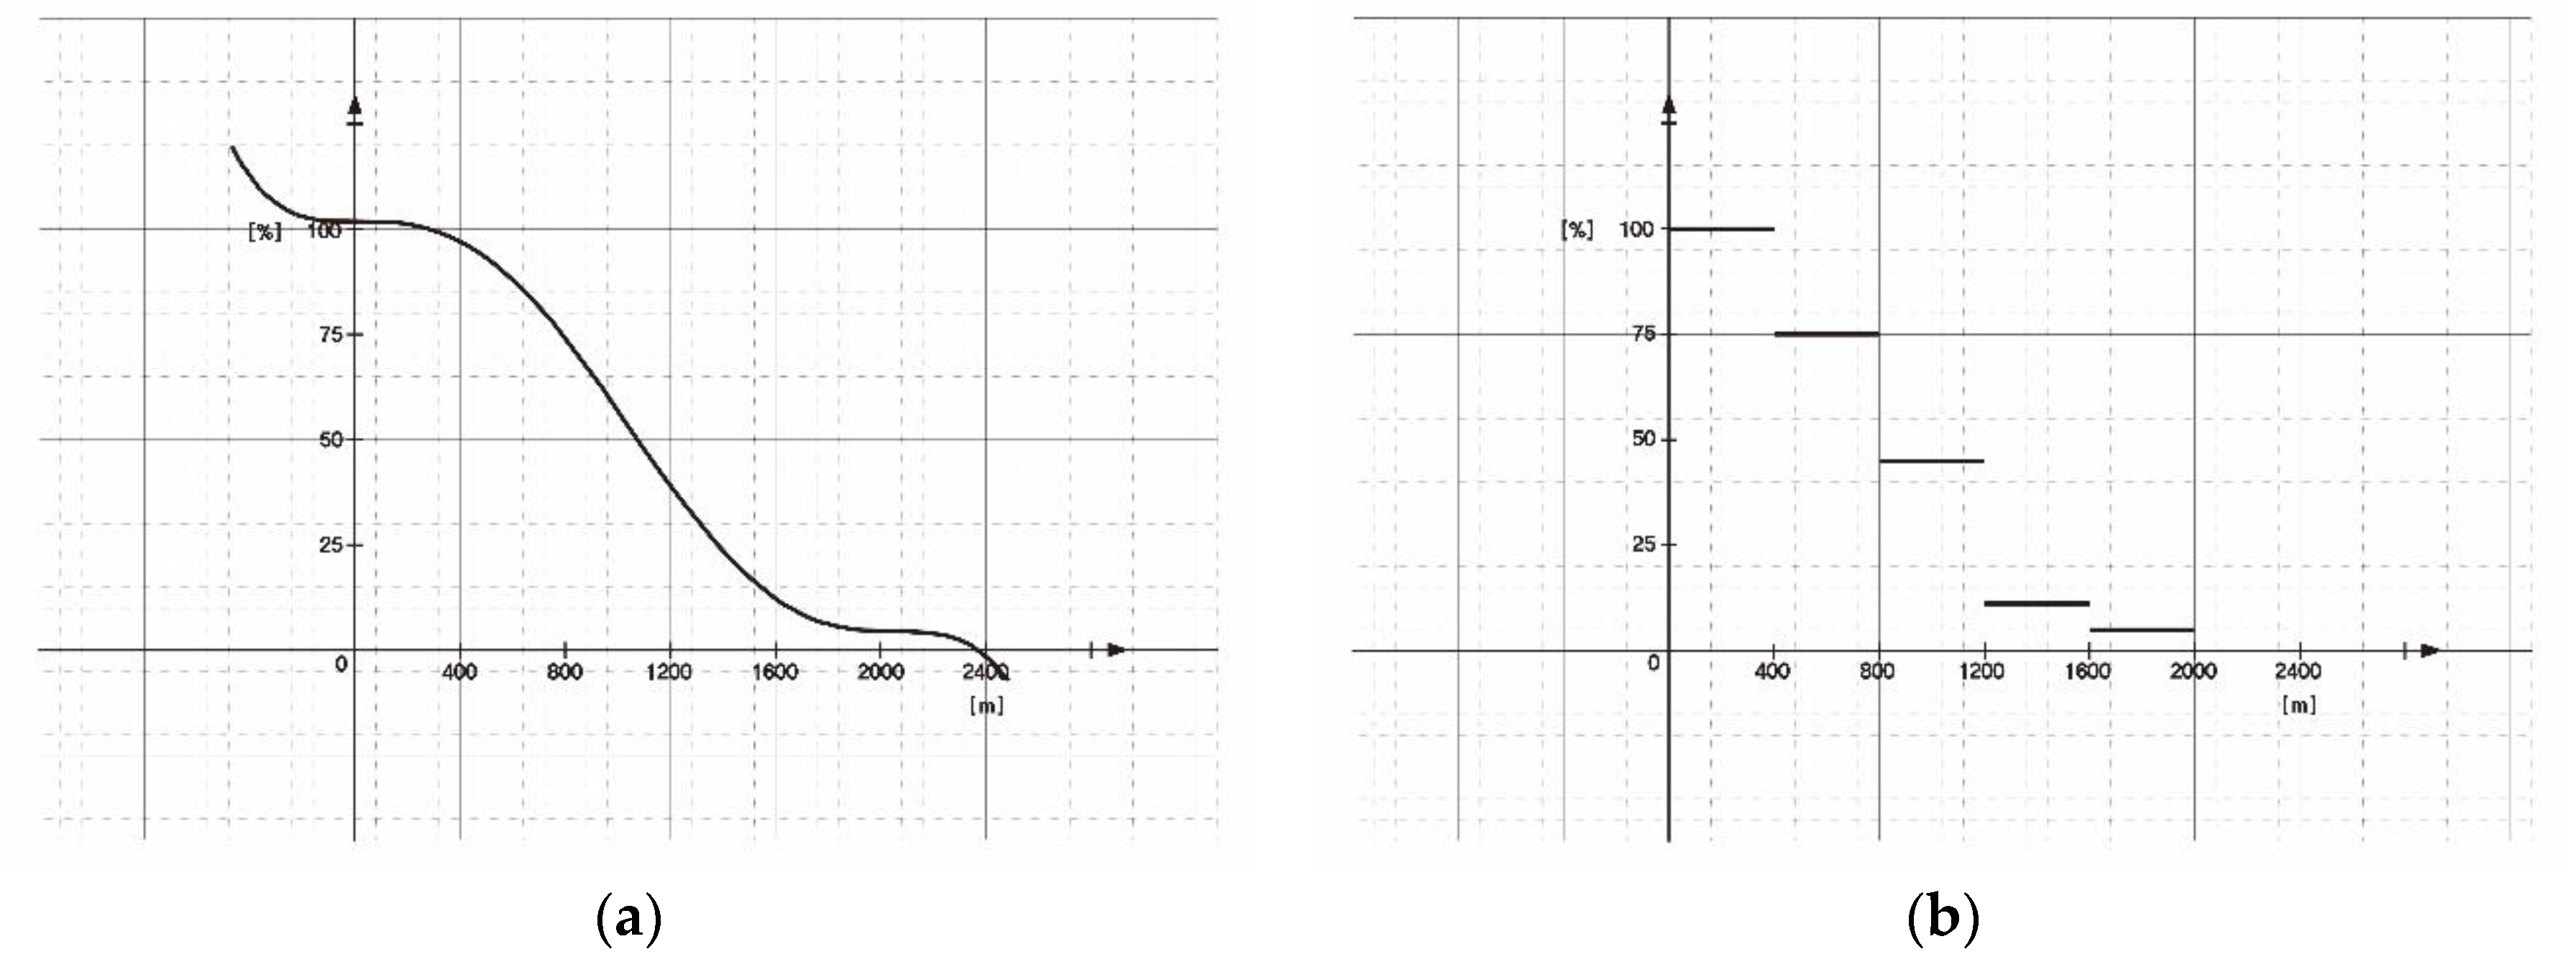
According to the Walk Score methodology, nearby amenities between 0.25 and 1.5 mile distances are weighted according to the distance decay function (Figure 3a). However, due to the limitation of GIS tools, it is technically difficult to compute a continuous decay function. We therefore simplified this into distance, following the approach used in previous studies [17,40]. We also note that using the simplified adaption might help to measure the scores consistently across an area like Seoul where various urban contexts and structures exist. As shown in Figure 3b, weights were given on the basis of distance bands within a search radius with a 2 km maximum network buffer. For example, full scores were given for destinations within 400 m (i.e., 0.25 miles or a 5 min walk) of a given location, while 0.75 points were given for those within 800 m (i.e., 0.5 miles or a 10 min walk), 0.4 were given for those within 1.2 km (i.e., 0.75 miles or a 15 min walk), 0.125 were given for those within 1.6 km (i.e., 1 mile or a 20 min walk), and 0.05 were given for those within 2 km (i.e., 1.25 miles or a 25 min walk).
2.2.3. Applying the Walkability Score in Seoul
We computed a Walkability Score for the entirety of Seoul by dividing the study area into 100 m × 100 m grid points (a total of 44,000) and calculating a Walkability Score for each point. We decided that 100 m × 100 m was of sufficient size after testing different grid sizes (e.g., 80 m, 100 m, 150 m, 200 m) while considering the accuracy and efficiency needed to obtain a full Walkability Score. Similar to this study, Zhang and colleagues calculated the walkability index at the 150 m × 150 m grid points in the area of Futian District, China, but our study has converged to a sort of consistent score when using a range of a 100 m grid intervals. Any grid points located in the river or a greenbelt area were excluded from the analysis (no road networks or amenities are found in these areas).
2.3. Correlating Walkability Scores with Attention to Pedestrian Satisfaction
2.3.1. Data: Perceived Satisfaction of the Walking Environment, Walkability Score, and Other Confounding Factors
We used survey data to examine the association between Walkability Score and pedestrian satisfaction in the walking environment. The Seoul city government conducted the survey in 2015 and provided all data without personal identification (e.g., name and address) for public use [51]. A total of 1000 locations in Seoul were randomly selected and 20 pedestrians around each location were then asked to complete the survey. We initially obtained a sample size of 20,000 pedestrians, but excluded 80 of those from four locations due to missing information for a final sample of 19,920.
We used the survey item concerning perceived satisfaction with the walking environment as the dependent variable. This item was expressed on a five-point Likert scale (i.e., “very satisfied,” “somewhat satisfied,” “neutral,” “somewhat dissatisfied,” and “very dissatisfied”). Each cell of five points was not evenly distributed and some had low frequencies. In our samples, the responses for “very satisfied” were only 3.9%. To preserve cell size and perform efficient analysis, we dichotomized the variable into 1 for the satisfied category (very satisfied and somewhat satisfied) and 0 for the dissatisfied category (very dissatisfied, somewhat dissatisfied, and neutral).
The Walkability Score taken among the 966 total locations was used as the independent variable (see Section 2.2.1). Although it is not supported in South Korea, we then compared the correlation of the Walk Score with pedestrian satisfaction by measuring the Walk Score at all given locations using the official website (walkscore.com) [43].
Confounding variables included gender, age, and walking purpose (i.e., recreation or transportation) as taken from the survey data. Gender was coded as 1 for male and 0 for female. Age was measured in five-year intervals and treated as a continuous variable. Walking purpose was measured with multiple response categories and coded as 1 for transportation purpose (e.g., commuting to school or work) and 0 for recreational purpose (e.g., taking a stroll or walking leisurely). Variable details are given in Table 2.
2.3.2. Statistical Analysis to Examine the Association between Walkability Score and Pedestrian Satisfaction
We examined the differences between the Walkability Score and Walk Score through a t-test. We used a logistic regression for the binary outcome to examine the association between the Walkability Score and pedestrian satisfaction with the walking environment. We also estimated the odds ratios of being satisfied (versus dissatisfied), which are associated with the Walk Score. We then compared the significance and direction of the estimated odds ratios between the Walkability Score and the Walk Score. Confounding factors such as age, gender, and walking type were adjusted for the final analyses. Statistical significance was determined at the 0.05 level, and Stata 15 MP software was used for all statistical analyses.
3. Results
3.1. Spatial Distribution of the Seoul Walkability Score
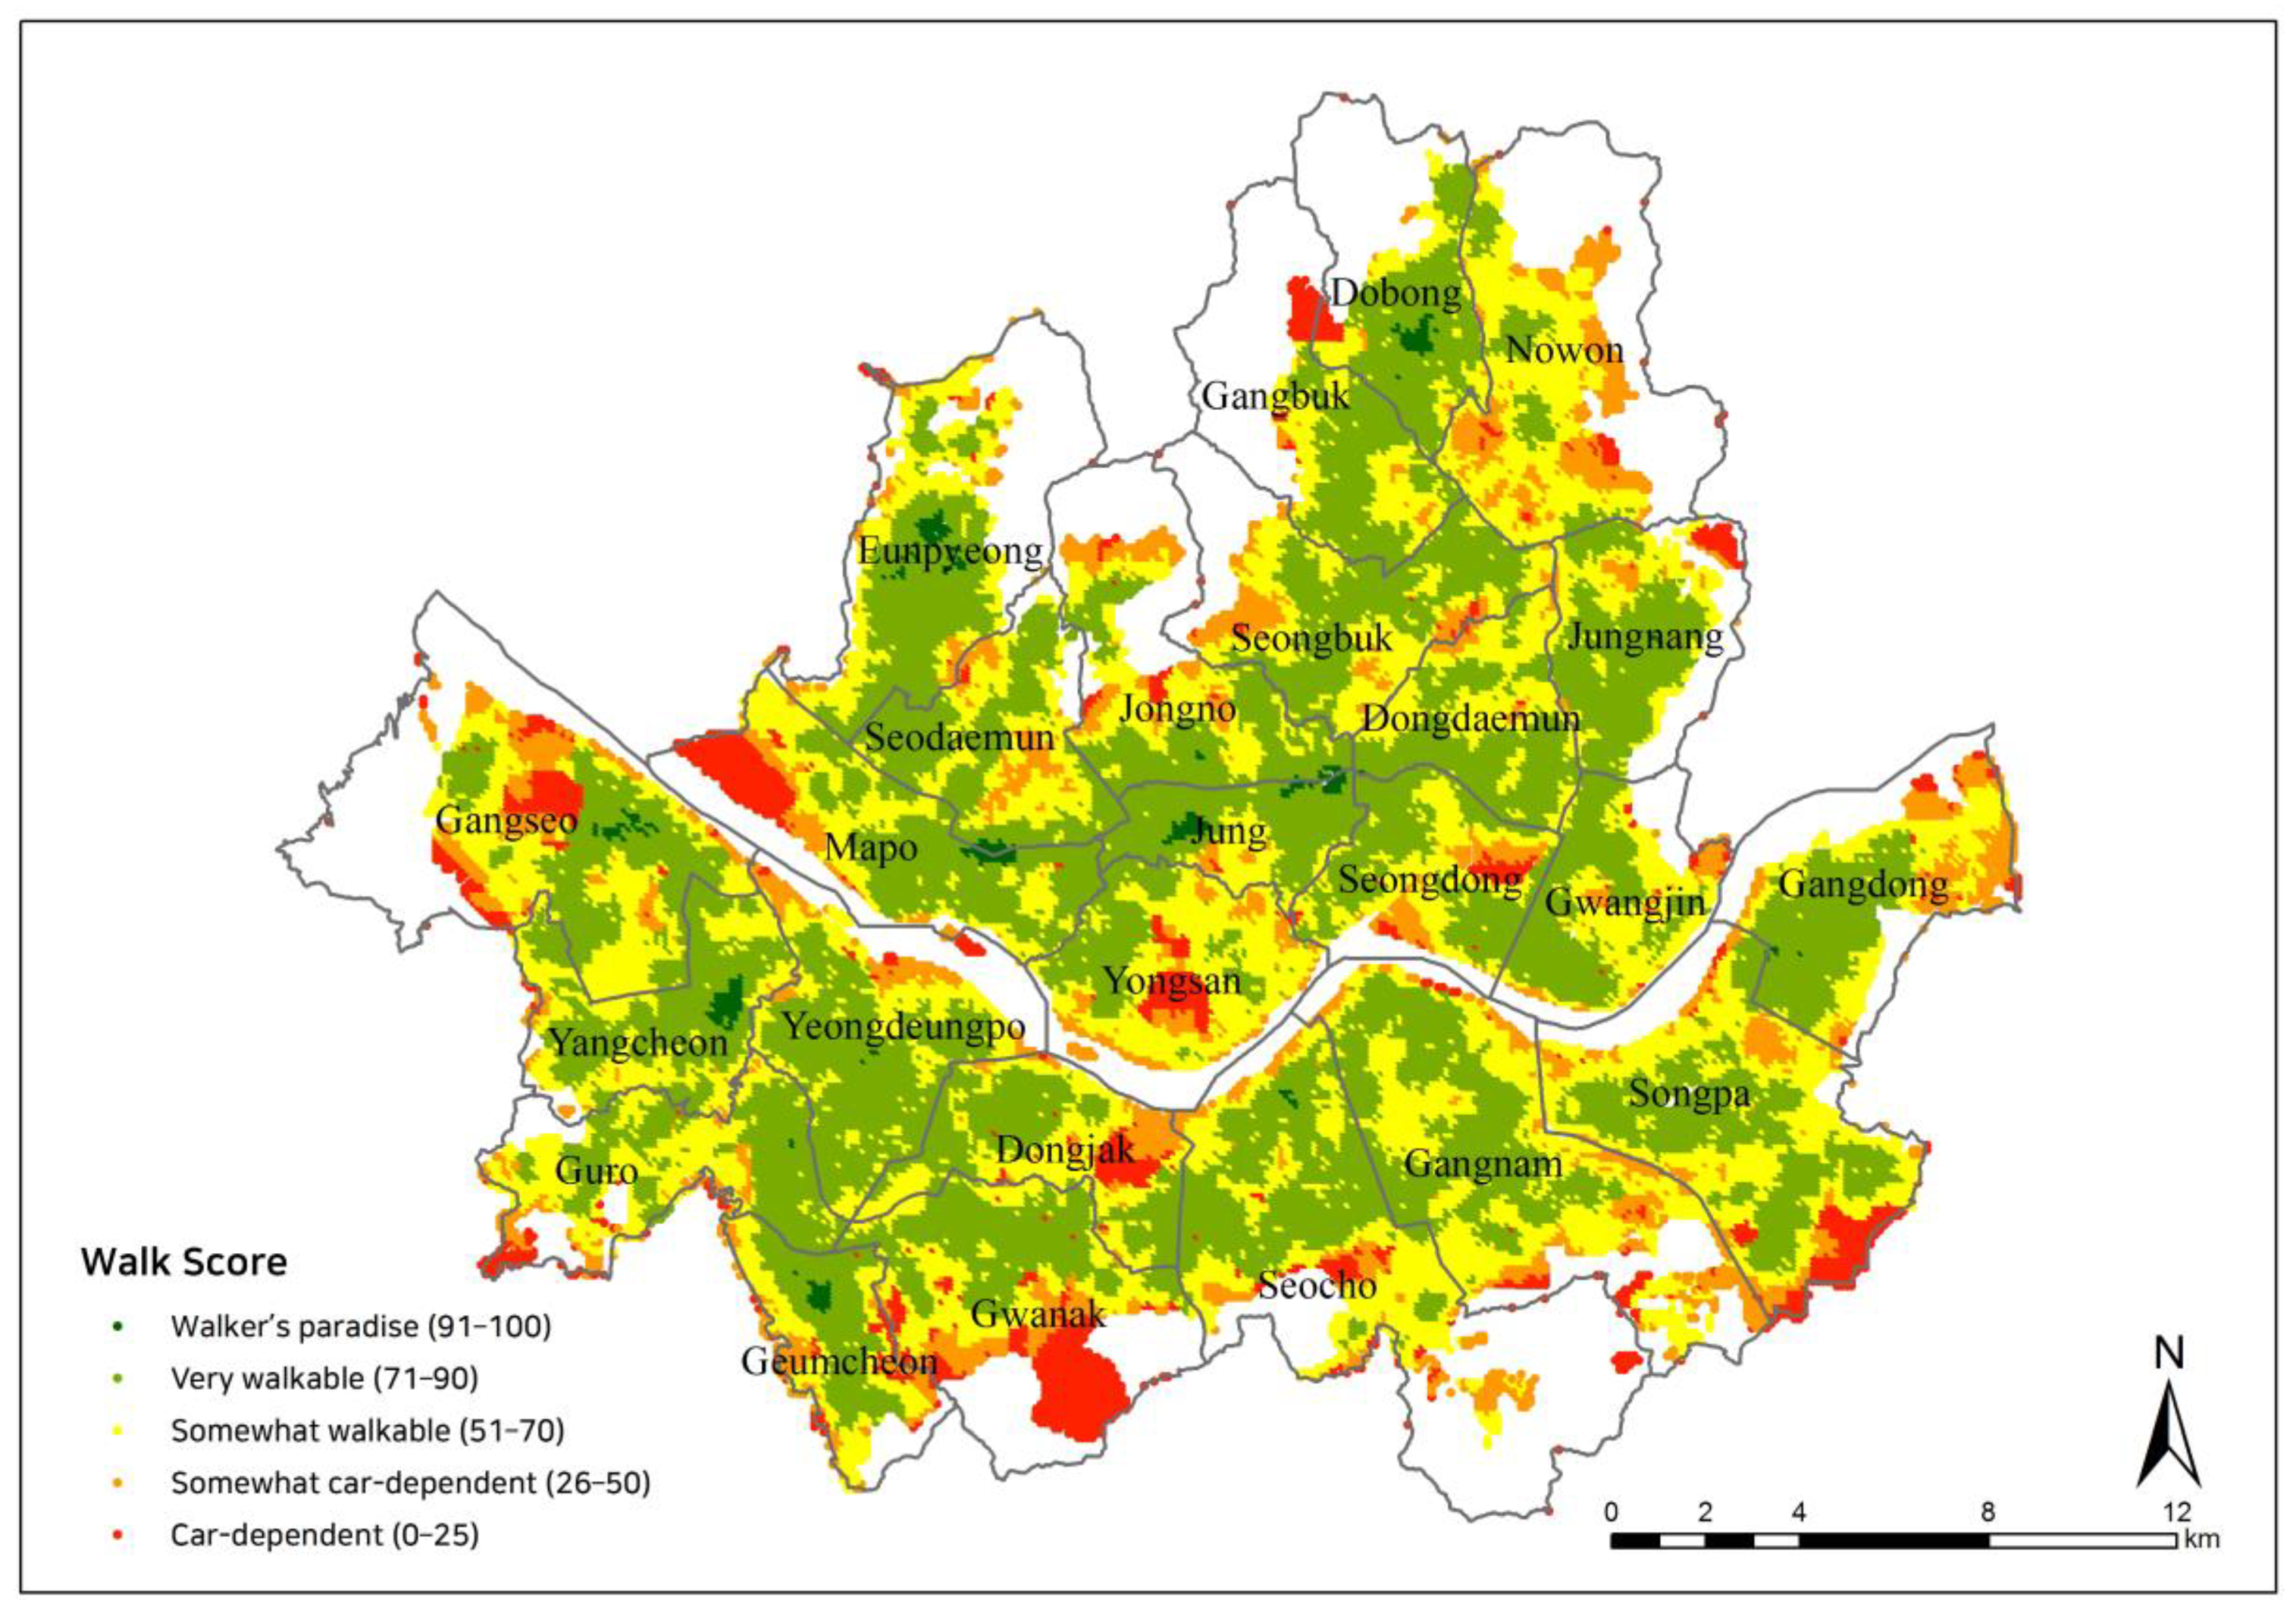
Figure 4 shows the spatial distribution of the Seoul Walkability Score. We specifically computed Walkability Scores at 44,000 locations taken from intersections within the premade 100 m × 100 m grid. Seoul consists of 25 autonomous administrative districts called “gu.” As shown in Figure 4, most of Seoul seems to be walkable. However, spatial variations in the Walkability Score are evident in some of the administrative districts (e.g., Yongsan-gu, Mapo-gu, Gangseo-gu, Gwanak-gu, and Songpa-gu), many of which are close to the city border (e.g., the greenbelt zone) and/or river.
The overall average Walkability Score for the 44,000 grid points in Seoul was 64.4, with a standard deviation of 18.4 and a maximum value of 97.5. Based on the Walk Score category, Table 3 shows the frequencies of each Walkability Score level in Seoul. Percentages of walkable (somewhat walkable, very walkable, walker’s paradise) and car-dependent (somewhat car-dependent, car-dependent) areas were 84.3% and 15.7%, respectively. As shown, more than 80% of Seoul was rated as walkable. However, only 0.8% was rated as a “walker’s paradise” (the highest level). On the other hand, approximately 5.1% of all areas received Walkability Scores of less than 25, which indicates high rates of car-dependence.
As shown in Table 4, Seoul’s average Walkability Score is 64.4, with a standard deviation of 18.4 and a maximum value of 97.5. At the gu level, the very walkable areas (Walkability Scores > 70) were Jung-gu (mean = 75.1, SD = 13.1), Dobong-gu (mean = 73.5, SD = 16.2), Eunpyeong-gu (mean = 71.0, SD = 14.9), and Yangcheon-gu (mean = 71.0, SD = 10.7). All 21 other gu were somewhat walkable (Walkability Scores between 50–69) on average.
3.2. Analyzing the Association between Walkability Score and Pedestrian Satisfaction
Table 5 shows the results of statistical analyses examining the associations between pedestrian satisfaction and walkability measures. We compared the results from both the Walkability Score and Walk Score. Here, Walkability Score was significantly associated with pedestrian satisfaction, but Walk Score was not. This may be explained by the significance of group-mean differences between the two measures (t-test = −47.90 and p < 0.001). Further, both models showed that age and walking trip were significant factors.
3.3. Exploring the Discrepancy between Pedestrian Satisfaction and Walkability Score
While we found a significant association between Walkability Score and pedestrian satisfaction, there was also a possible discrepancy between the two. We thus investigated comprehensive sample locations where there were different patterns between Walkability Score level and perceived satisfaction with the walking environment using street view images published in web portals, such as Kakao Map (https://map.kakao.com/) and Naver Map (https://map.naver.com/). Figure 5 indicates four sample locations. These are categorized into two types (i.e., Type A and Type B). Type A consists of high Walkability Scores and low satisfaction, while Type B consists of low Walkability Scores and high satisfaction. We selected locations in consideration of their main land uses (e.g., residential, commercial, industrial, and green land-use areas).
3.3.1. Type A: High Walkability Score and Low Pedestrian Satisfaction
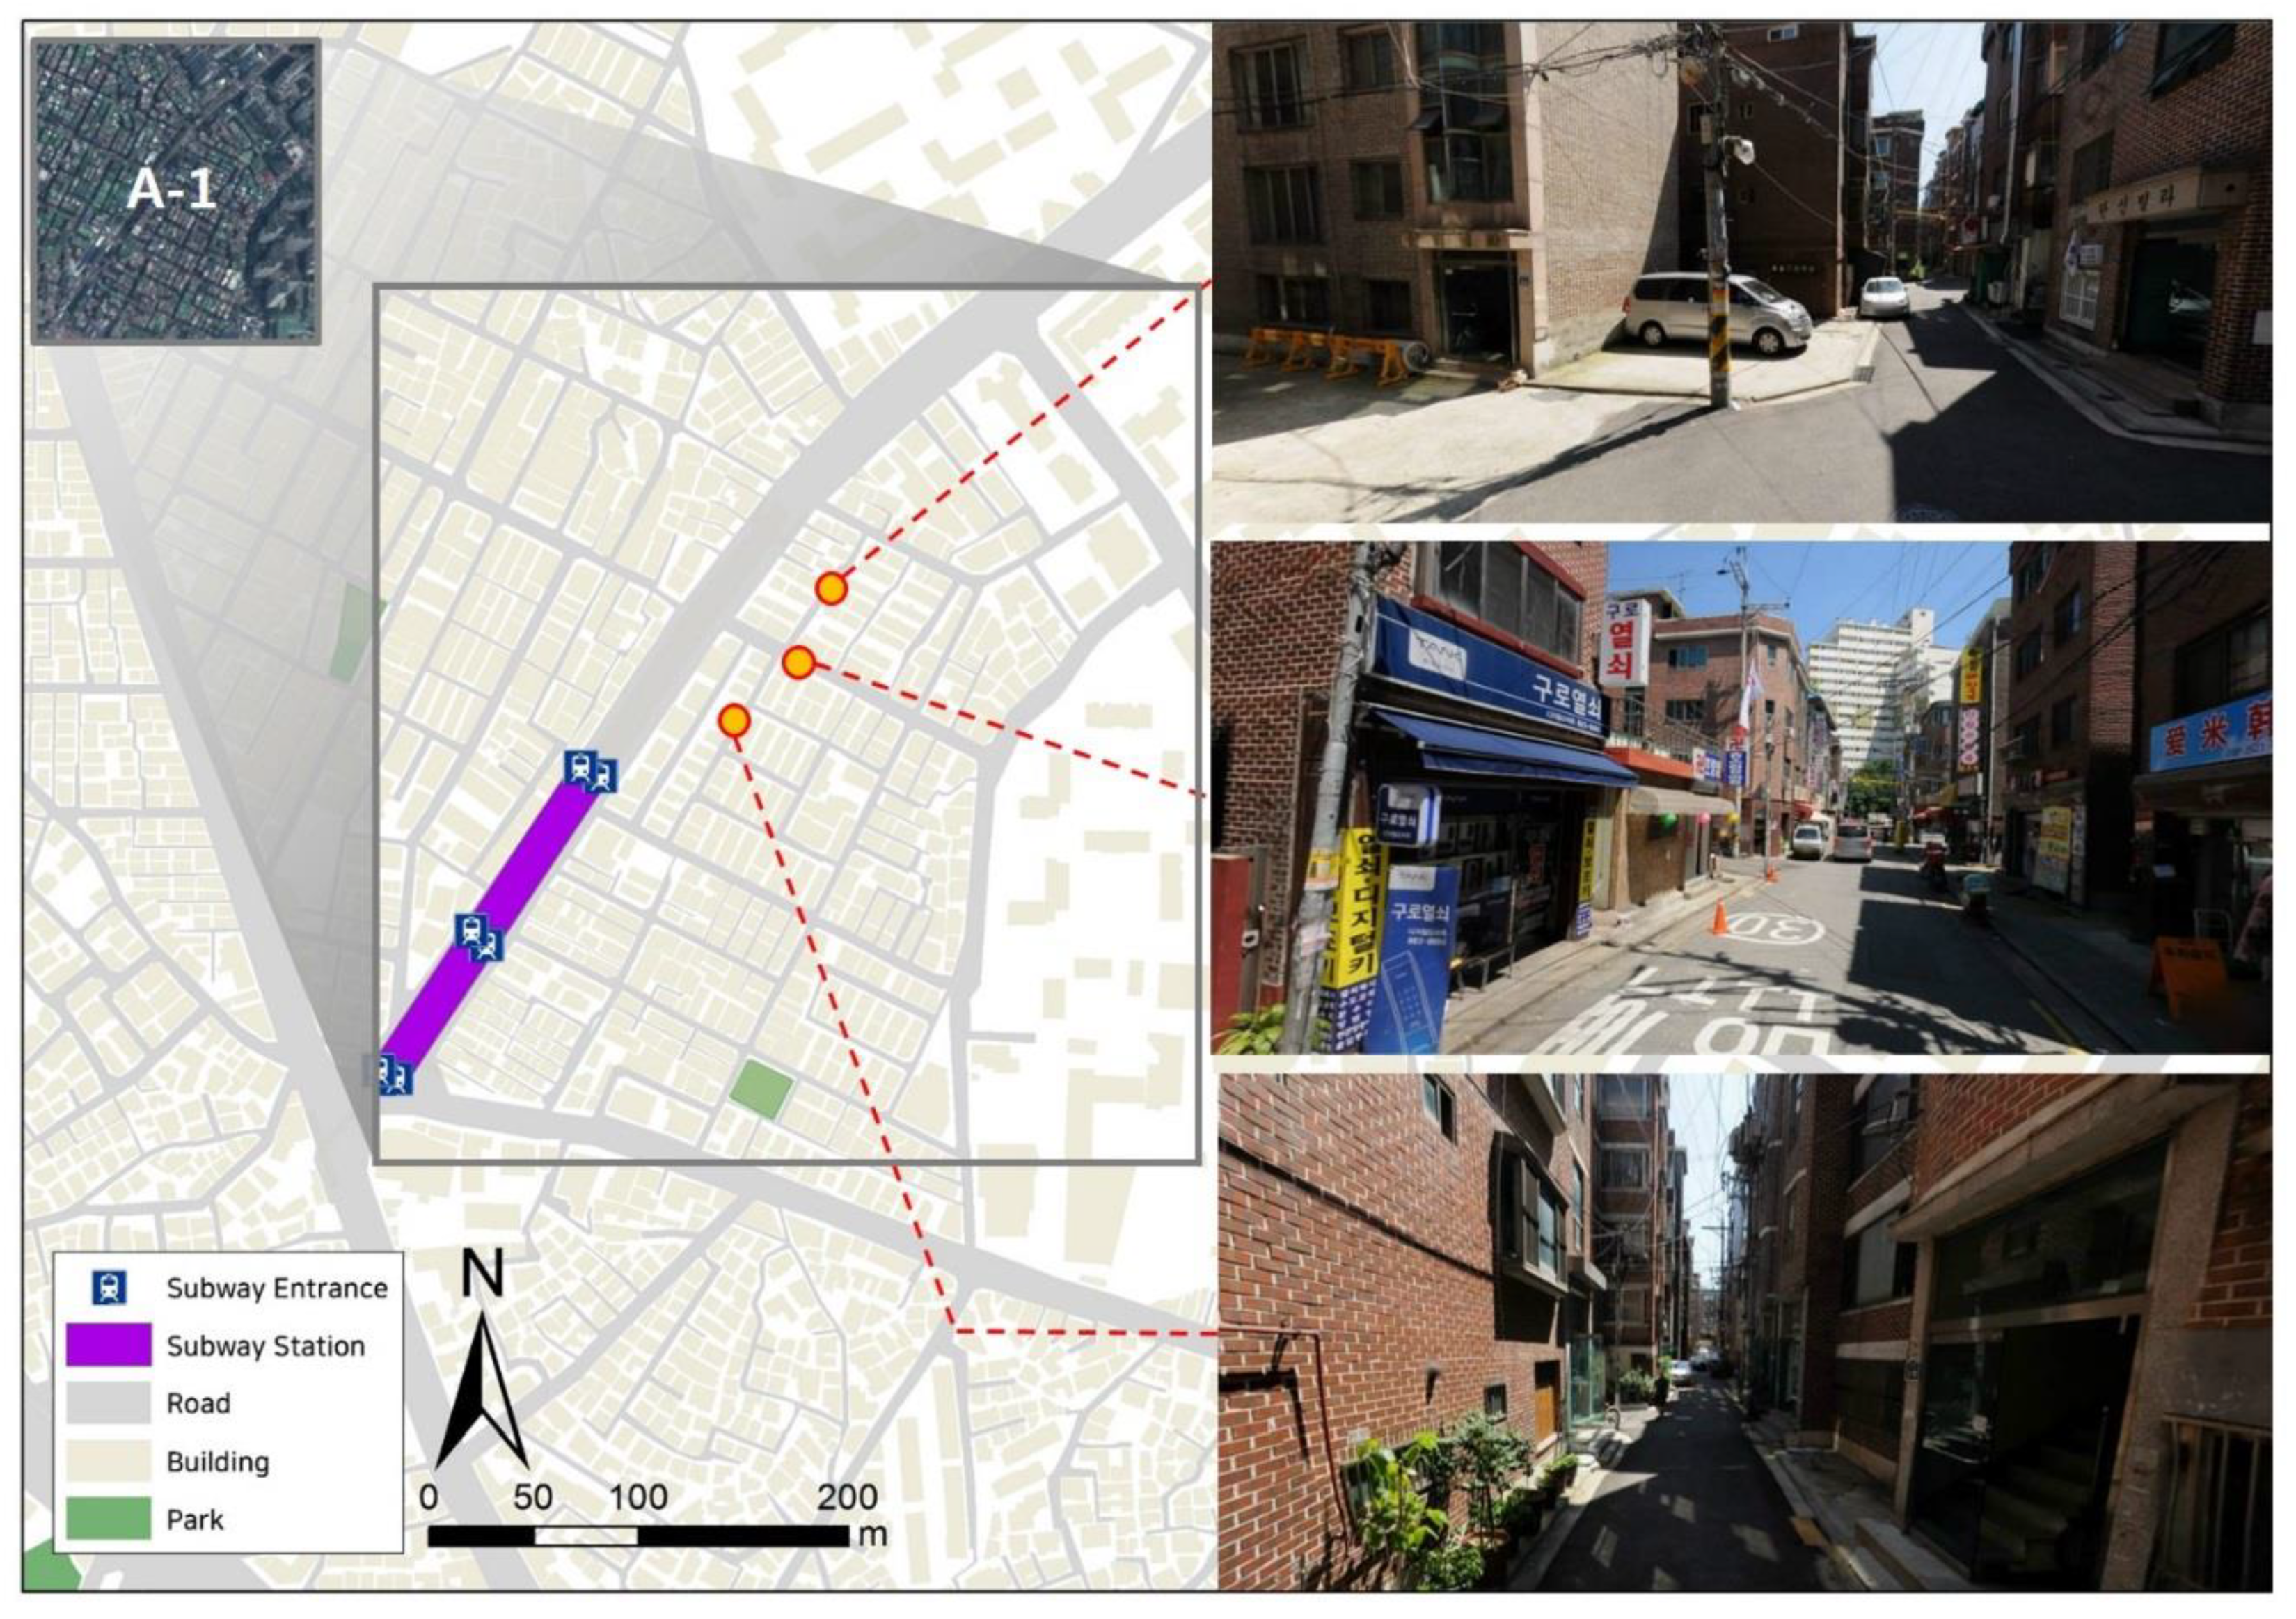
• A-1: Namguro Station: Industrial
The samples are located near Namguro station, where there is a mixture of two main land uses (i.e., residential and industrial). Further, the Seoul Digital Industrial Complex is largely present around this area. There are also many companies in the industrial complex, which has led to various amenities. This area’s Walkability Score was relatively high at 83 due to many accessible destinations (e.g., restaurants, coffee shops, and shopping centers). However, pedestrian satisfaction with the walking environment was relatively low at 1.35. As shown in Figure 6, most roads are shared with pedestrians, but illegal parking can be observed throughout the area. There are also many poorly secured environments that lack streetlights and surveillance cameras. These could be perceived as poor walking environments.
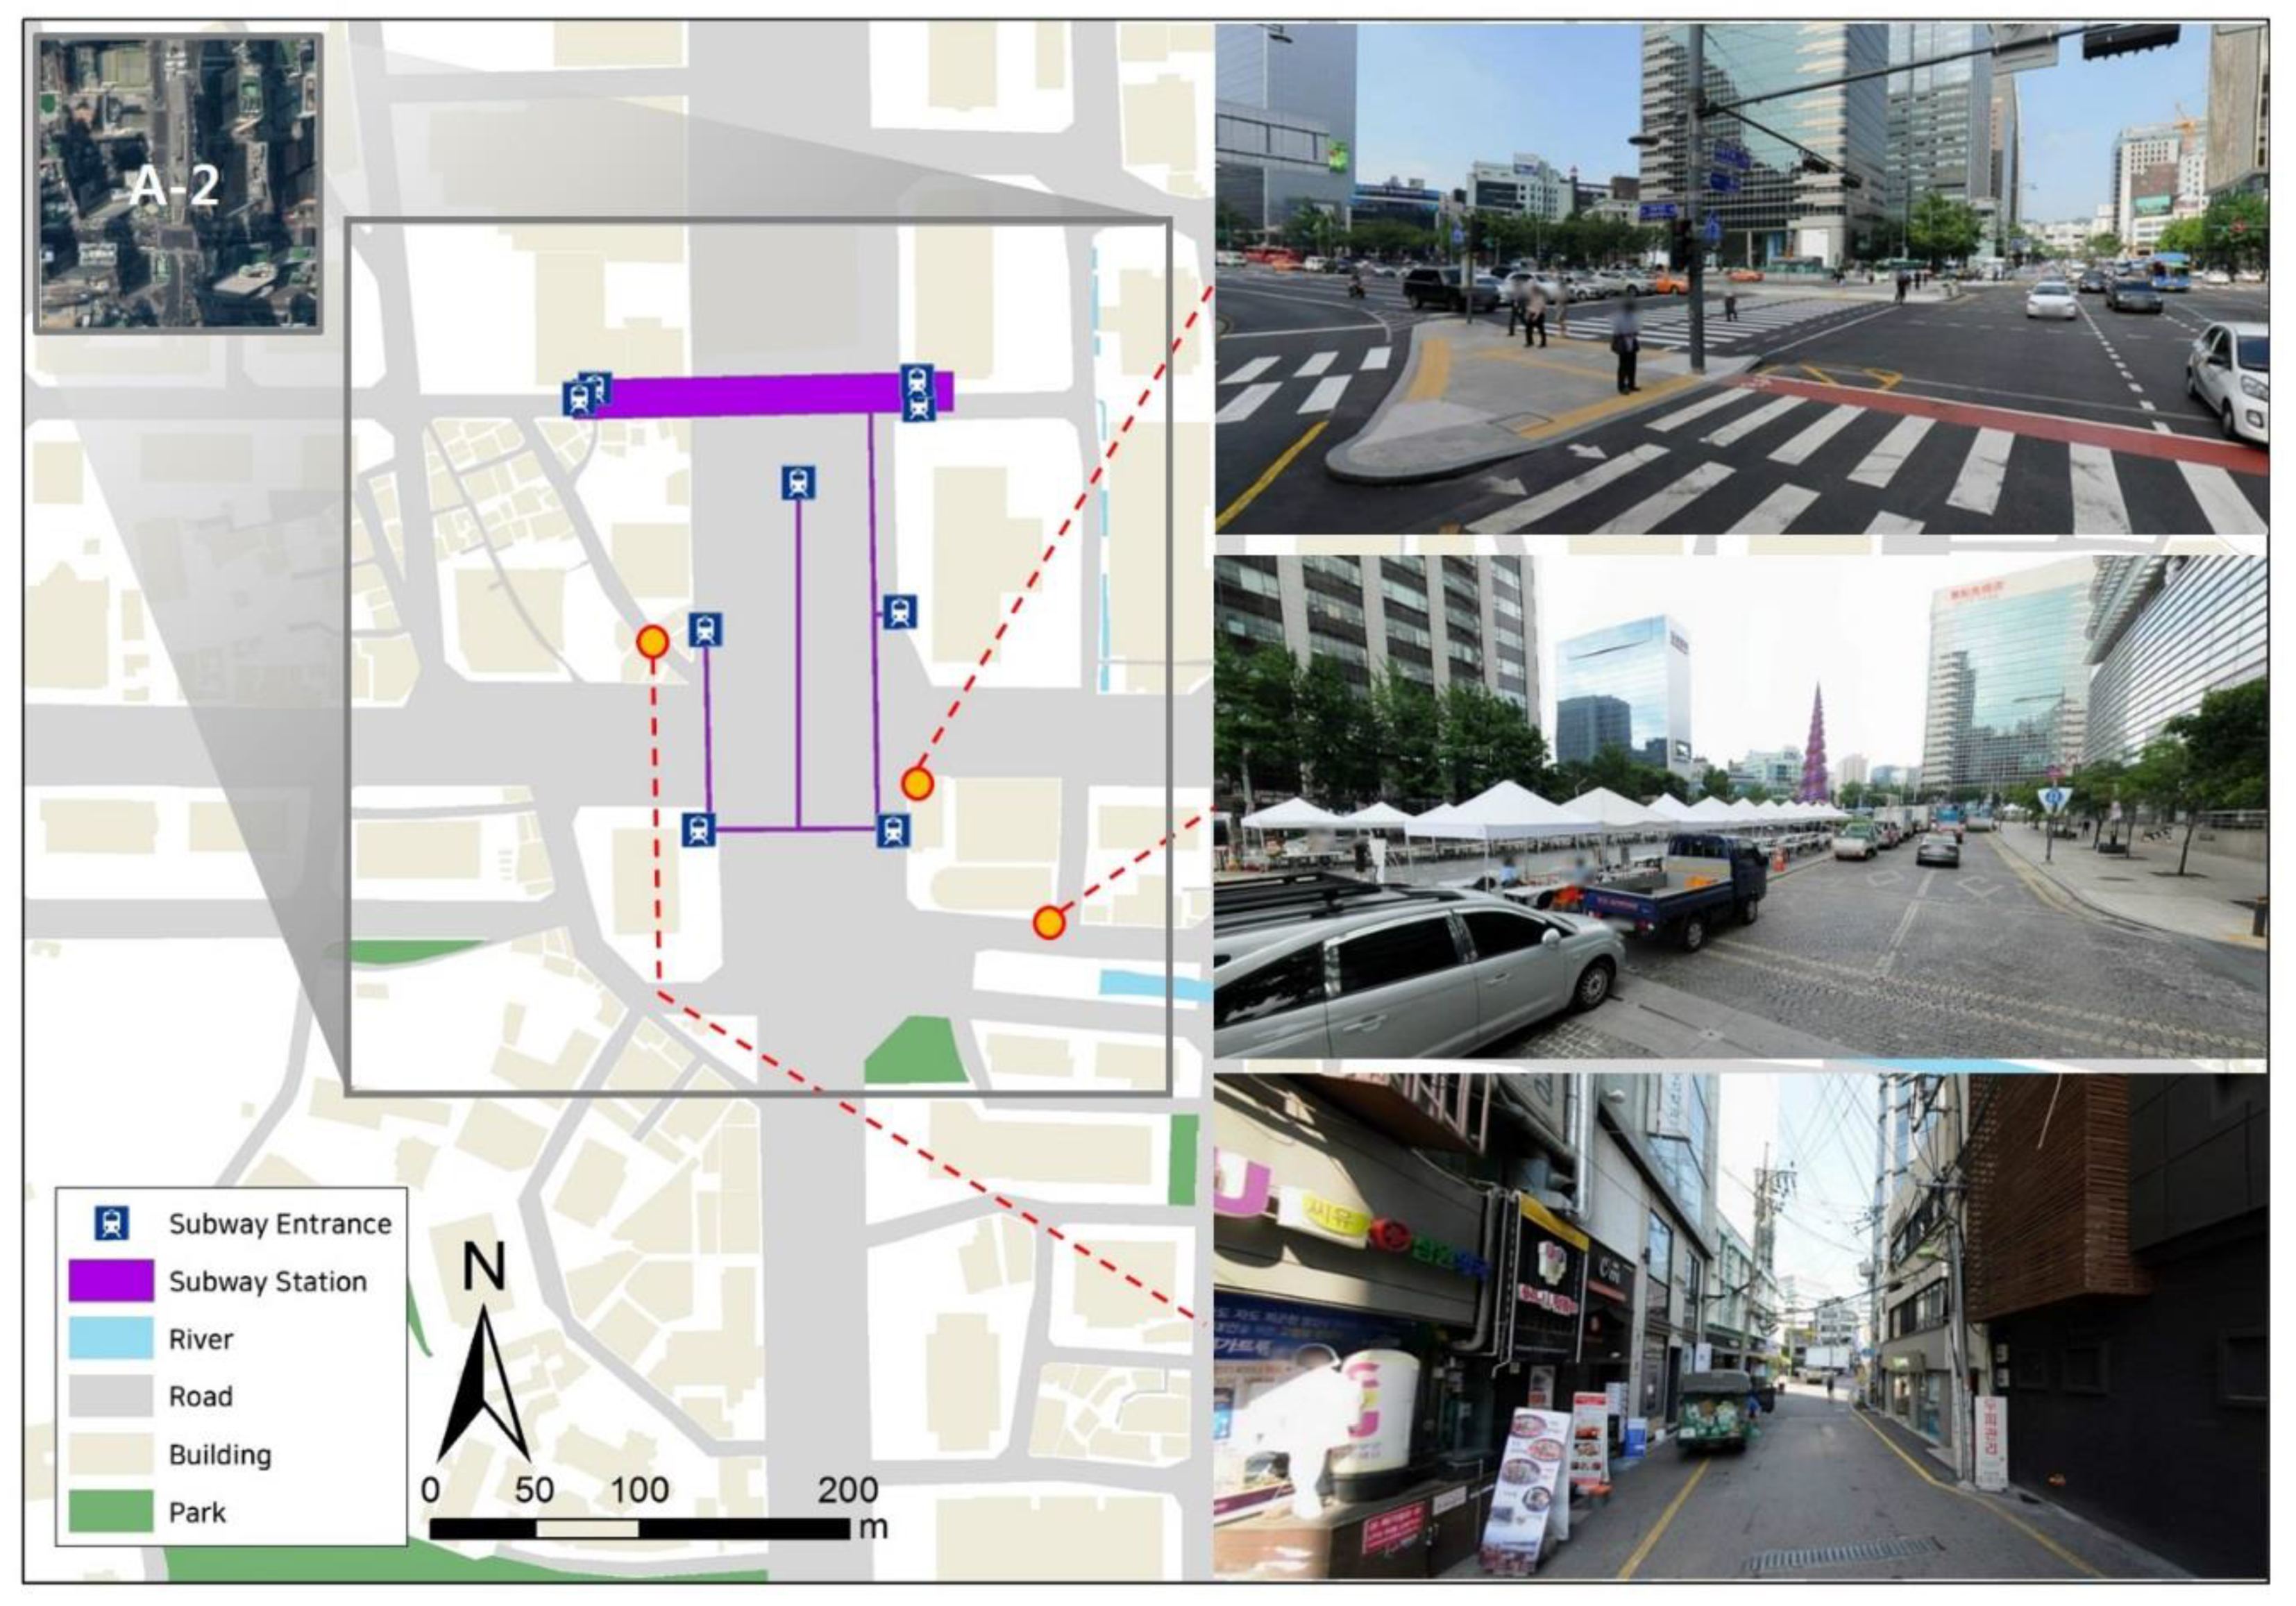
• A-2: Gwanghwamun Station: Commercial
Gwanghwamun refers to the main gate of the Gyeongbokgung Royal Palace. The station is near Gwanghwamun, where there are many amenities for visitors (e.g., the square, Cheonggye stream, the presidential office building called the “Blue House,” city hall, centers for the arts and cultural complexes, and other historical sites). This area is also located in the Central Business District, which contains a high floating population. Gwanghwamun Station had a relatively high Walkability Score of 87.5, but pedestrian satisfaction was very low at 1.2 points. Political rallies and protests are often held at the square, in the boulevard, and at city hall near the station. Sidewalks near the station are very wide and streets are pedestrian-friendly, but illegal parking, poor maintenance, and walking obstacles (e.g., tents, booths, and rally banners) are present throughout (Figure 7).
3.3.2. Type B: Low Walkability Score and High Pedestrian Satisfaction
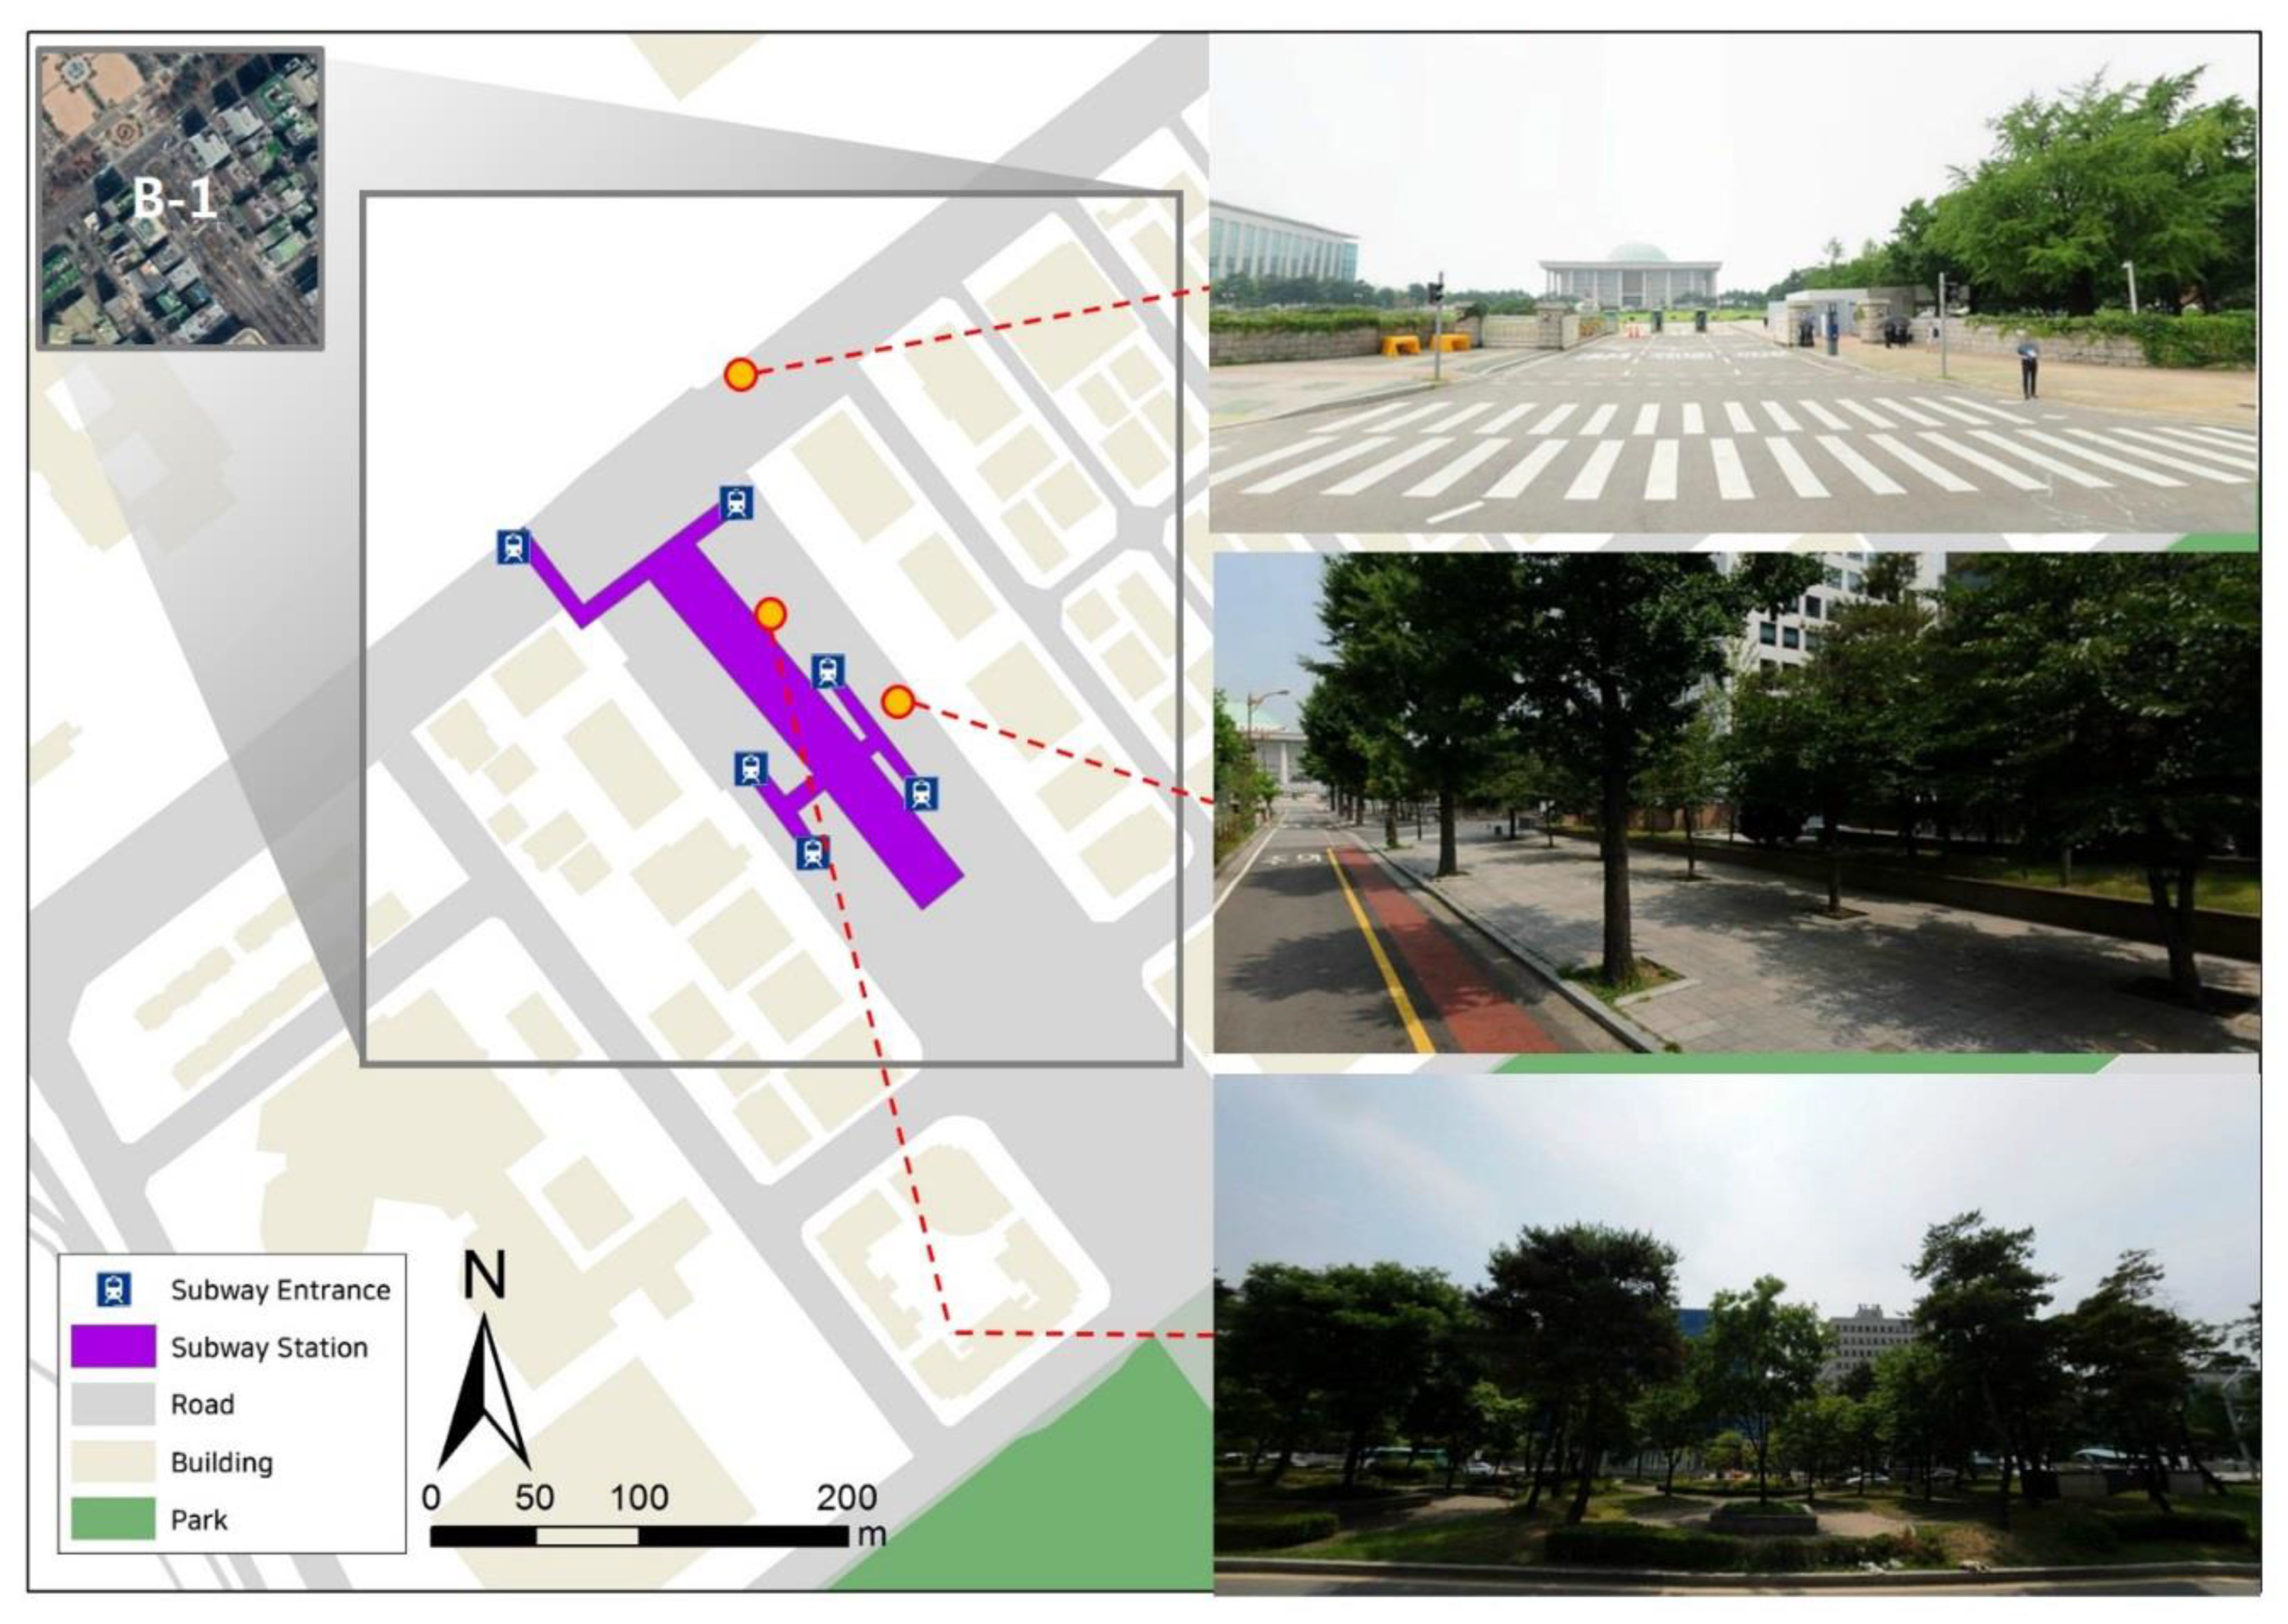
• B-1: National Assembly Building Station: Commercial
The National Assembly Building is the South Korean capital building. The area around the National Assembly Building station contains well-maintained, wide sidewalks in addition to rich greenery areas and bike lanes (Figure 8). The bike lanes are separated from vehicle roads and sidewalks so that cyclists can use them safely and conveniently. Meanwhile, the 229,539 m2 area of Yeouido Park is located about 300 m southeast of this location. The park is used as a resting place for Seoul citizens because of its well-established ecological forests, ponds, theme plaza, and walking paths. With such a well-equipped pedestrian infrastructure, pedestrian satisfaction was relatively high at 3.0. However, the Walkability Score was somewhat low at 53, which is likely the result of poor access to the amenity facilities.
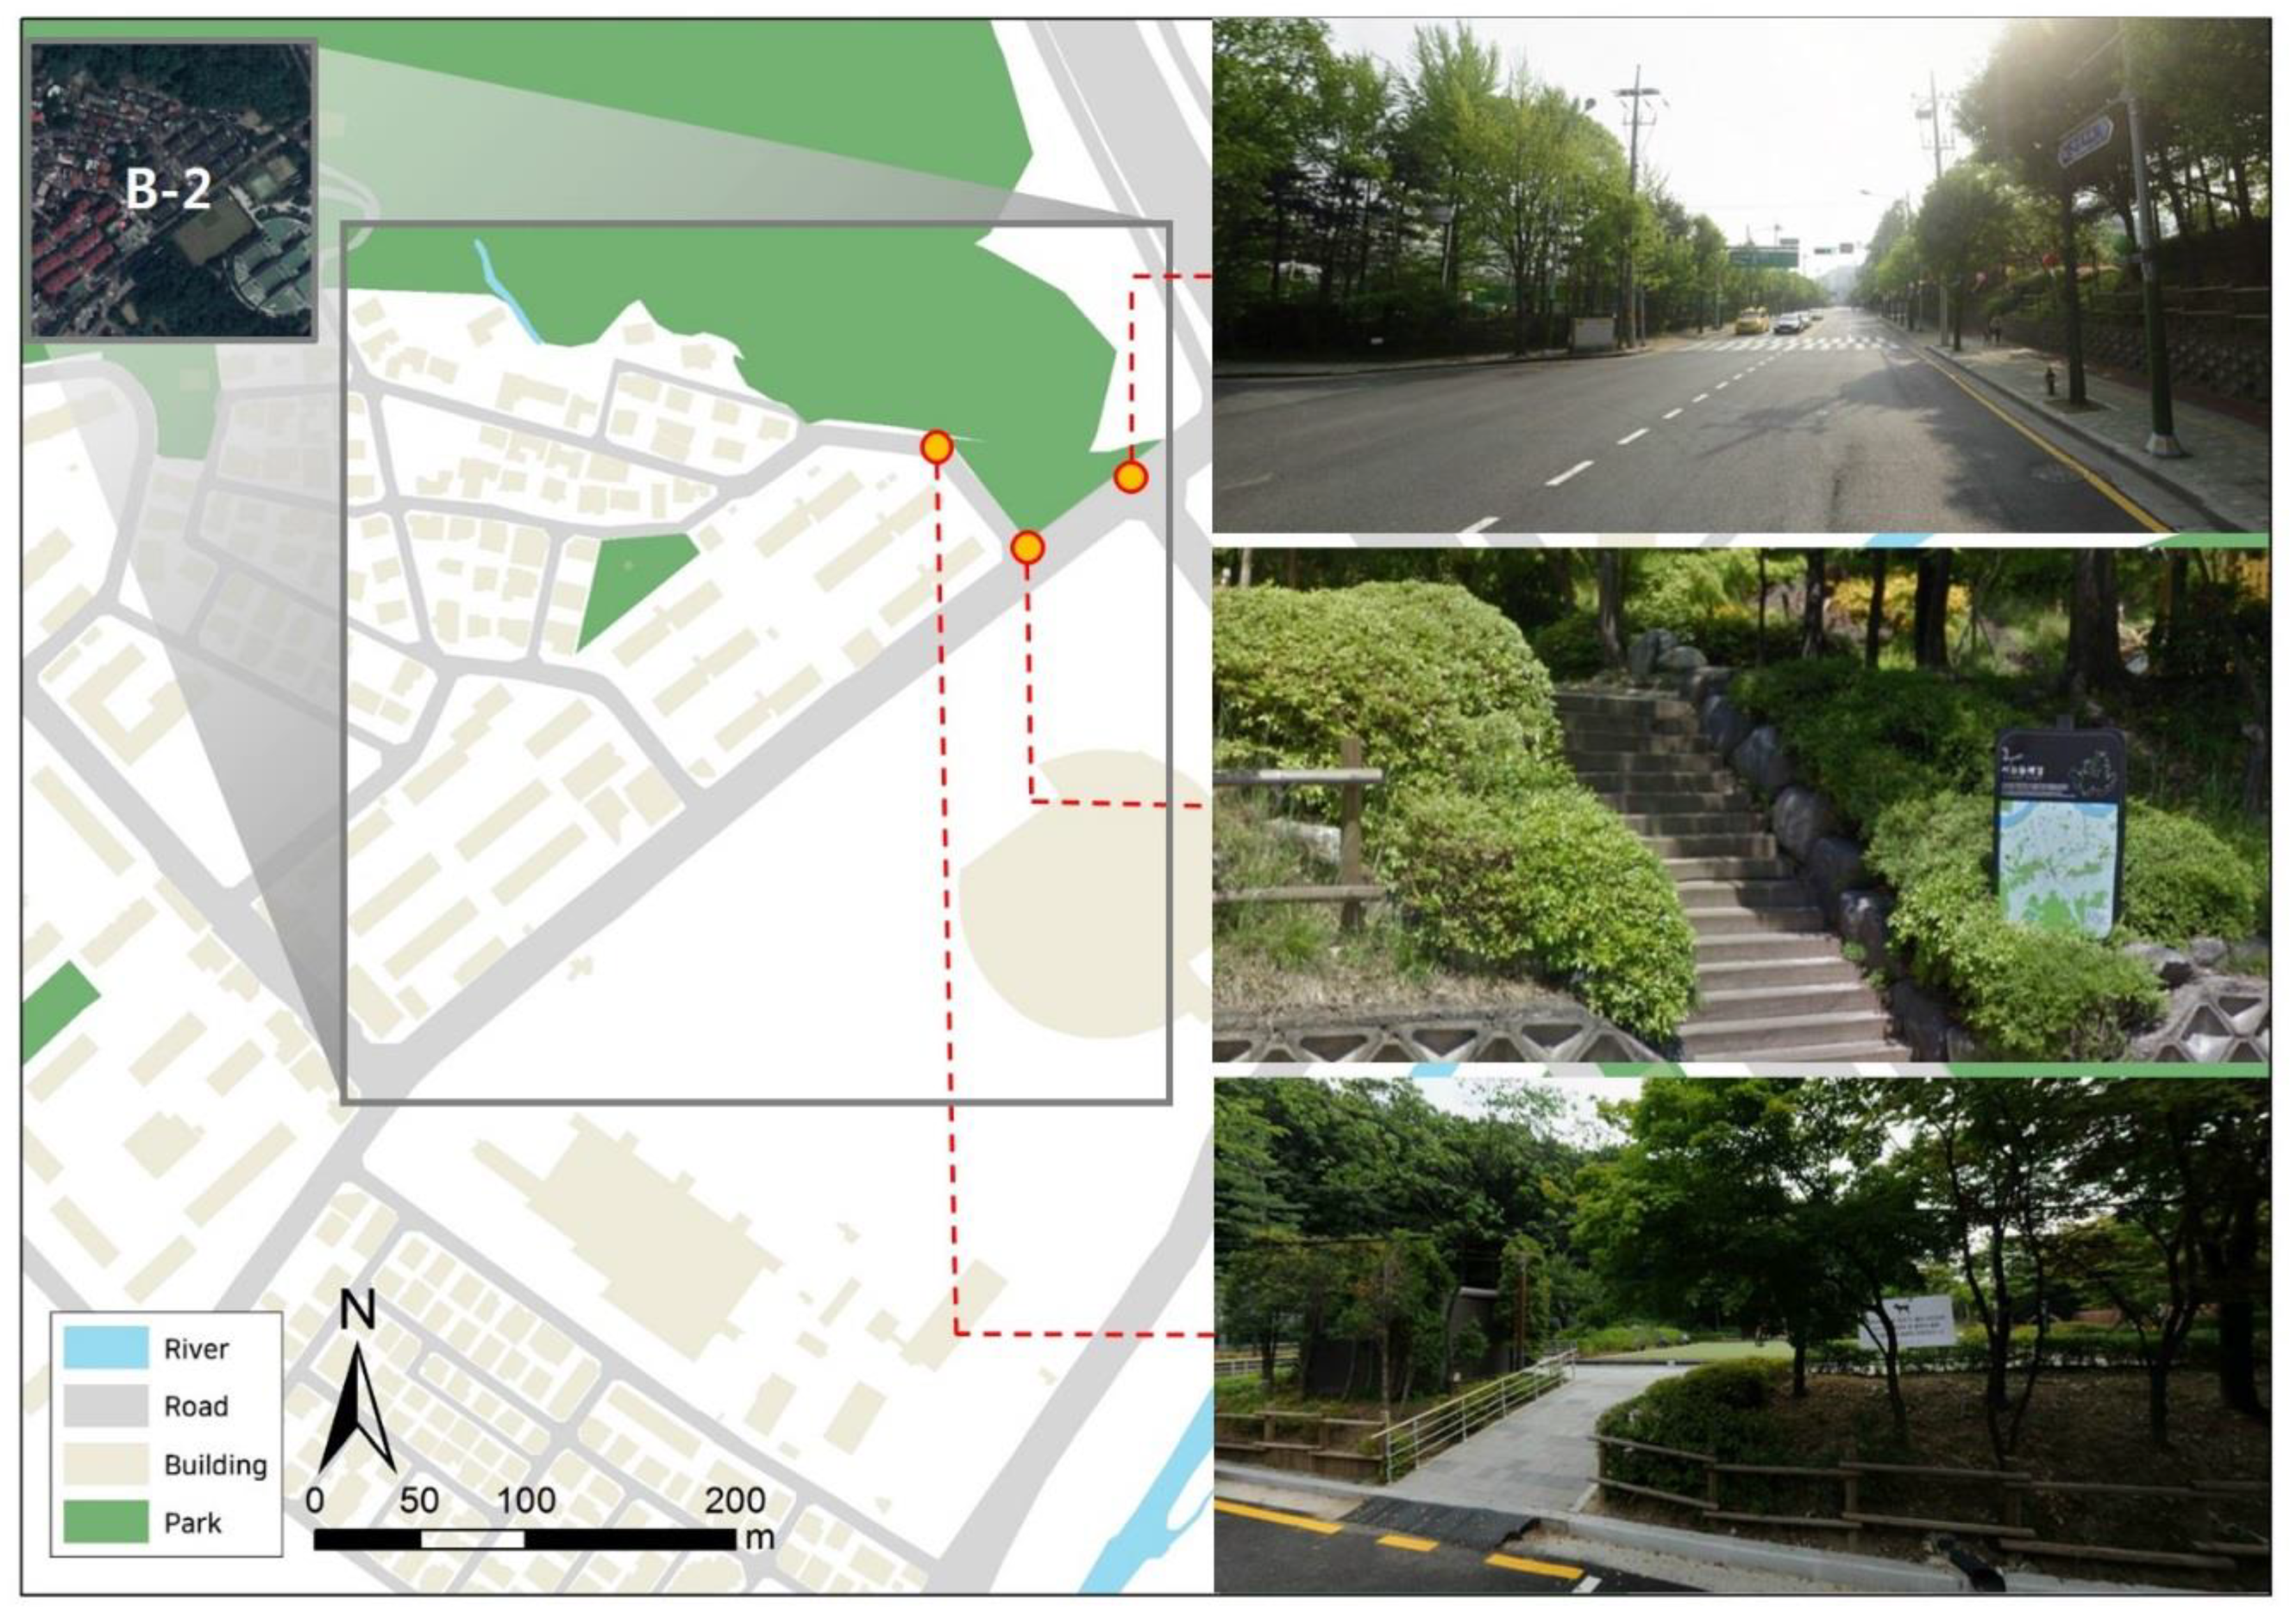
• B-2: Yangjae Stream Forest: Residential/Greenspace
This sample location was near the Yangjae stream and Yangjae Citizens’ Forest park. As shown in Figure 9, this site has good access to the stream, park, and areas with abundant vegetation. The green walkway was constructed across the park and stream before connecting to other hiking routes that skirt around the City of Seoul. The green walkway is part of a 157 km trail that runs across Seoul (i.e., the Seoul Trail). This has remained an attractive place of leisure for both visitors and residents. As such, it had a relatively high pedestrian satisfaction level of 3.05 points, which is likely due to its good access to the park and walkway. However, the area’s large open spaces provide poor access to amenities. As such, the Walkability Score was relatively low at 53.
4. Discussion and Conclusions
Among the several indices of neighborhood walkability suggested in the current literature, Walk Score is the most widely used. However, the built environmental attributes used for the Walk Score algorithm are based on research conducted in the Western context. This study therefore used the Walk Score methodology to develop a Walkability Score for use in the high-density Asian city of Seoul, South Korea (where Walk Score is not supported). To the best of our knowledge, this study was the first to explore a new walkability score in Seoul. While a recent study in Japan examined Walk Score validity (showing a significant correlation with environmental attributes) [39], we note that Walk Score (as provided on the website) is not accurate in that context due to limited data sources. Further, there are significant differences between this study’s Walkability Score and Walk Score based on our application of both at sample locations. We also used survey data to examine the association between Walkability Score and pedestrian satisfaction with the walking environment. Logistic regression results also indicated that the Walkability Score was significantly associated with pedestrian satisfaction, but we could not find any such associations with this item and Walk Score.
We then explored sample locations to determine whether Walkability Scores matched pedestrian satisfaction ratings. While there was a significant and positive statistical association between Walkability Score and pedestrian satisfaction, it is important to note that the coefficients of regression represent the average change in the dependent variable by one unit increase in the independent variable. We sampled locations where we found discrepancies between the Walkability Score and pedestrian satisfaction. This investigation showed that some places with good access to parks and streams and/or well-maintained sidewalks with rich greenery had low Walkability Scores and were thus categorized as “not walkable,” but had relatively high levels of pedestrian satisfaction. These findings may have resulted from a lack of nearby amenities (i.e., the Walkability Score is highly dependent on amenity access). Further, while nearby amenities and/or destinations are important for measuring neighborhood walkability, well-equipped pedestrian infrastructures may be reflective of actual usage patterns and perceptions. Streetscape environments such as sidewalks and green areas along streets or trails running through parks may be more relevant to pedestrian perceptions and experiences [52,53].
While the Walk Score considers, counts, and weights nearby amenities in order of their importance for encouraging walking trips, we note that such importance may differ across urban contexts. For example, parks, open spaces, and green areas may help local residents maintain consistent walking behaviors that promote healthy living. Indeed, previous studies have found significant associations between green environments and not only walking behaviors, but also psychological responses [54,55]. A study by Lwin and Murayama (2011) further suggested that an eco-friendly walk score be integrated into the Walk Score algorithm to measure urban green spaces through Remote Sensing and GIS techniques [56]. Further, the Walk Score places importance on nearby amenities based on environmental correlate studies that measured walking in the Western context. This may not be applicable in the Asian context. Future studies identifying walkable destinations in Seoul should thus concentrate on collecting evidence supporting the generation of a valid walkability measure.
In conclusion, this study provided evidence that the Walkability Score (following the Walk Score algorithm) may be a valid measure for assessing neighborhood walkability. However, more validity checks are necessary to further apply and develop this measurement tool for use in other destinations in the local urban context.
Author Contributions
Conceptualization, E.J.K. and J.W.; methodology, E.J.K. and J.W.; software, E.J.K. and J.W.; validation, E.J.K. and J.W.; formal analysis, E.J.K., J.W., and J.K.; investigation, E.J.K. and J.W.; resources, E.J.K.; data curation, E.J.K. and J.K.; writing—original draft preparation, E.J.K. and J.W.; writing—review and editing, E.J.K. and J.W.; visualization, E.J.K. and J.K.; supervision, E.J.K.; project administration, E.J.K.; funding acquisition, E.J.K.
Funding
This work was supported by the National Research Foundation of Korea (NRF) and funded by the Korea government (MSIT), grant number NRF-2017R1A2B4005440.
Conflicts of Interest
The authors declare no conflict of interest.
References
- Hanibuchi, T.; Kondo, K.; Nakaya, T.; Shirai, K.; Hirai, H.; Kawachi, I. Does walkable mean sociable? Neighborhood determinants of social capital among older adults in japan. Health Place 2012, 18, 229–239. [Google Scholar] [CrossRef] [PubMed]
- Leyden, K.M. Social capital and the built environment: The importance of walkable neighborhoods. Am. J. Public Health 2003, 93, 1546–1551. [Google Scholar] [CrossRef] [PubMed]
- Van Holle, V.; Van Cauwenberg, J.; De Bourdeaudhuij, I.; Deforche, B.; Van de Weghe, N.; Van Dyck, D. Interactions between neighborhood social environment and walkability to explain belgian older adults’ physical activity and sedentary time. Int. J. Environ. Res. Public Health 2016, 13, 569. [Google Scholar] [CrossRef] [PubMed] [Green Version]
- Frank, L.D.; Engelke, P. Multiple impacts of the built environment on public health: Walkable places and the exposure to air pollution. Int. Reg. Sci. Rev. 2016, 28, 193–216. [Google Scholar] [CrossRef]
- Frank, L.D.; Sallis, J.F.; Conway, T.L.; Chapman, J.E.; Saelens, B.E.; Bachman, W. Many pathways from land use to health: Associations between neighborhood walkability and active transportation, body mass index, and air quality. J. Am. Plan. Assoc. 2006, 72, 75–87. [Google Scholar] [CrossRef]
- Frank, L.D.; Stone, B.; Bachman, W. Linking land use with household vehicle emissions in the central puget sound: Methodological framework and findings. Transp. Res. Part D Transp. Environ. 2000, 5, 173–196. [Google Scholar] [CrossRef]
- Boyle, A.; Barrilleaux, C.; Scheller, D. Does walkability influence housing prices? Soc. Sci. Q. 2014, 95, 852–867. [Google Scholar] [CrossRef]
- Washington, E.; Dourado, E. The premium for walkable development under land use regulations. SSRN Electron. J. 2018. [Google Scholar] [CrossRef]
- Rauterkus, S.Y.; Miller, N. Residential land values and walkability. J. Sustain. Real Estate 2011, 3, 23–43. [Google Scholar] [CrossRef]
- Méline, J.; Chaix, B.; Pannier, B.; Ogedegbe, G.; Trasande, L.; Athens, J.; Duncan, D.T. Neighborhood walk score and selected cardiometabolic factors in the french record cohort study. BMC Public Health 2017, 17, 960. [Google Scholar] [CrossRef] [Green Version]
- Coffee, N.T.; Howard, N.; Paquet, C.; Hugo, G.; Daniel, M. Is walkability associated with a lower cardiometabolic risk? Health Place 2013, 21, 163–169. [Google Scholar] [CrossRef] [PubMed]
- Müller-Riemenschneider, F.; Pereira, G.; Villanueva, K.; Christian, H.; Knuiman, M.; Giles-Corti, B.; Bull, F.C. Neighborhood walkability and cardiometabolic risk factors in australian adults: An observational study. BMC Public Health 2013, 13, 755. [Google Scholar] [CrossRef] [PubMed] [Green Version]
- Paquet, C.; Coffee, N.T.; Haren, M.T.; Howard, N.J.; Adams, R.J.; Taylor, A.W.; Daniel, M. Food environment, walkability, and public open spaces are associated with incident development of cardio-metabolic risk factors in a biomedical cohort. Health Place 2014, 28, 173–176. [Google Scholar] [CrossRef] [PubMed]
- Won, J.; Lee, C.; Li, W. Are walkable neighborhoods more resilient to the foreclosure spillover effects? J. Plan. Educ. Res. 2017, 38, 463–476. [Google Scholar] [CrossRef]
- Buck, C.; Pohlabeln, H.; Huybrechts, I.; De Bourdeaudhuij, I.; Pitsiladis, Y.; Reisch, L.; Pigeot, I. Development and application of a moveability index to quantify possibilities for physical activity in the built environment of children. Health Place 2011, 17, 1191–1201. [Google Scholar] [CrossRef]
- Buck, C.; Tkaczick, T.; Pitsiladis, Y.; De Bourdehaudhuij, I.; Reisch, L.; Ahrens, W.; Pigeot, I. Objective measures of the built environment and physical activity in children: From walkability to moveability. J. Urban Health 2014, 92, 24–38. [Google Scholar] [CrossRef] [Green Version]
- Reyer, M.; Fina, S.; Siedentop, S.; Schlicht, W. Walkability is only part of the story: Walking for transportation in stuttgart, germany. Int. J. Environ. Res. Public Health 2014, 11, 5849–5865. [Google Scholar] [CrossRef]
- Frank, L.D.; Sallis, J.F.; Saelens, B.E.; Leary, L.; Cain, K.; Conway, T.L.; Hess, P.M. The development of a walkability index: Application to the neighborhood quality of life study. Br. J. Sports Med. 2009, 44, 924–933. [Google Scholar] [CrossRef]
- Frank, L.D.; Schmid, T.L.; Sallis, J.F.; Chapman, J.; Saelens, B.E. Linking objectively measured physical activity with objectively measured urban form. Am. J. Prev. Med. 2005, 28, 117–125. [Google Scholar] [CrossRef]
- Won, J.; Lee, C.; Forjuoh, S.N.; Ory, M.G. Neighborhood safety factors associated with older adults’ health-related outcomes: A systematic literature review. Soc. Sci. Med. 2016, 165, 177–186. [Google Scholar] [CrossRef]
- Forsyth, A.; Hearst, M.; Oakes, J.M.; Schmitz, K.H. Design and destinations: Factors influencing walking and total physical activity. Urban Stud. 2008, 45, 1973–1996. [Google Scholar] [CrossRef]
- Saelens, B.E.; Handy, S.L. Built environment correlates of walking. Med. Sci. Sports Exerc. 2008, 40, S550–S566. [Google Scholar] [CrossRef] [PubMed] [Green Version]
- Foster, S.; Giles-Corti, B. The built environment, neighborhood crime and constrained physical activity: An exploration of inconsistent findings. Prev. Med. 2008, 47, 241–251. [Google Scholar] [CrossRef] [PubMed]
- Kuzmyak, J.R.; Baber, C.; Savory, D. Use of walk opportunities index to quantify local accessibility. Transp. Res. Rec. J. Transp. Res. Board 2006, 1977, 145–153. [Google Scholar] [CrossRef]
- Vale, D.S.; Saraiva, M.; Pereira, M. Active accessibility: A review of operational measures of walking and cycling accessibility. J. Transp. Land Use 2016, 9, 209–235. [Google Scholar] [CrossRef]
- Walk Score Methodology. Available online: http://pubs.cedeus.cl/omeka/files/original/b6fa690993d59007784a7a26804d42be.pdf (accessed on 15 December 2017).
- Duncan, D.T.; Aldstadt, J.; Whalen, J.; Melly, S.J.; Gortmaker, S.L. Validation of walk score® for estimating neighborhood walkability: An analysis of four us metropolitan areas. Int. J. Environ. Res. Public Health 2011, 8, 4160–4179. [Google Scholar] [CrossRef]
- Nykiforuk, C.I.J.; McGetrick, J.A.; Crick, K.; Johnson, J.A. Check the score: Field validation of street smart walk score in alberta, canada. Prev. Med. Rep. 2016, 4, 532–539. [Google Scholar] [CrossRef] [Green Version]
- Carr, L.J.; Dunsiger, S.I.; Marcus, B.H. Validation of walk score for estimating access to walkable amenities. Br. J. Sports Med. 2010, 45, 1144–1148. [Google Scholar] [CrossRef]
- Liao, Y.; Lin, C.-Y.; Lai, T.-F.; Chen, Y.-J.; Kim, B.; Park, J.-H. Walk score® and its associations with older adults’ health behaviors and outcomes. Int. J. Environ. Res. Public Health 2019, 16, 622. [Google Scholar] [CrossRef] [Green Version]
- Mazumdar, S.; Learnihan, V.; Cochrane, T.; Phung, H.; O’Connor, B.; Davey, R. Is walk score associated with hospital admissions from chronic diseases? Evidence from a cross-sectional study in a high socioeconomic status australian city-state. BMJ Open 2016, 6, e012548. [Google Scholar] [CrossRef] [Green Version]
- Adebamowo, C.A.; Camhi, S.M.; Troped, P.J.; Garvey, M.; Hayman, L.L.; Must, A.; Lichtenstein, A.H.; Crouter, S.E. Associations between walk score and objective measures of physical activity in urban overweight and obese women. PLoS ONE 2019, 14, e0214092. [Google Scholar] [CrossRef]
- Twardzik, E.; Judd, S.; Bennett, A.; Hooker, S.; Howard, V.; Hutto, B.; Clarke, P.; Colabianchi, N. Walk score and objectively measured physical activity within a national cohort. J. Epidemiol. Community Health 2019, 73, 549–556. [Google Scholar] [CrossRef] [PubMed] [Green Version]
- Boisjoly, G.; Wasfi, R.; El-Geneidy, A. How much is enough? Assessing the influence of neighborhood walkability on undertaking 10-minutes walks. J. Transp. Land Use 2018, 11, 143–151. [Google Scholar] [CrossRef] [Green Version]
- Carr, L.J.; Dunsiger, S.I.; Marcus, B.H. Walk score™ as a global estimate of neighborhood walkability. Am. J. Prev. Med. 2010, 39, 460–463. [Google Scholar] [CrossRef] [Green Version]
- Gilderbloom, J.I.; Riggs, W.W.; Meares, W.L. Does walkability matter? An examination of walkability’s impact on housing values, foreclosures and crime. Cities 2015, 42, 13–24. [Google Scholar] [CrossRef]
- Pivo, G. Walk score: The significance of 8 and 80 for mortgage default risk in multifamily properties. J. Sustain. Real Estate 2014, 6, 187–210. [Google Scholar] [CrossRef]
- Walk Score Professional. Available online: https://www.walkscore.com/professional/research.php (accessed on 28 May 2019).
- Koohsari, M.J.; Sugiyama, T.; Hanibuchi, T.; Shibata, A.; Ishii, K.; Liao, Y.; Oka, K. Validity of walk score® as a measure of neighborhood walkability in japan. Prev. Med. Rep. 2018, 9, 114–117. [Google Scholar] [CrossRef]
- Zhang, J.; Tan, P.Y.; Zeng, H.; Zhang, Y. Walkability assessment in a rapidly urbanizing city and its relationship with residential estate value. Sustainability 2019, 11, 2205. [Google Scholar] [CrossRef] [Green Version]
- Kosis. Available online: http://kosis.kr/statisticsList/statisticsListIndex.do?menuId=M_01_01&vwcd=MT_ZTITLE&parmTabId=M_01_01#SelectStatsBoxDiv (accessed on 27 May 2019).
- US Census. Available online: https://www.census.gov/quickfacts/fact/table/newyorkcitynewyork,NY/PST045218 (accessed on 1 September 2019).
- Walk Score. Available online: https://www.walkscore.com/ (accessed on 15 December 2017).
- Seoul Open Data Plaza. Available online: http://data.seoul.go.kr/dataList/datasetList.do (accessed on 10 March 2019).
- Road Name Address. Available online: http://www.juso.go.kr/addrlink/addressBuildDevNew.do?menu=mainJusoLayer (accessed on 1 March 2018).
- National spatial Data Infrastructure Portal. Available online: http://data.nsdi.go.kr/dataset (accessed on 15 March 2018).
- Open Data Portal. Available online: https://www.data.go.kr/search/index.do (accessed on 15 May 2018).
- Cgv. Available online: http://www.cgv.co.kr/ (accessed on 15 December 2017).
- Lotte Cinema. Available online: http://www.lottecinema.co.kr/LCHS/index.aspx (accessed on 15 December 2017).
- Megabox. Available online: http://www.megabox.co.kr/ (accessed on 15 December 2017).
- 2015 Seoul Floating Population Survey. Available online: http://opengov.seoul.go.kr/analysis/11143108 (accessed on 15 May 2019).
- Park, S.-H.; Kim, J.-H.; Choi, Y.-M.; Seo, H.-L. Design elements to improve pleasantness, vitality, safety, and complexity of the pedestrian environment: Evidence from a korean neighbourhood walkability case study. Int. J. Urban Sci. 2013, 17, 142–160. [Google Scholar] [CrossRef]
- Van Cauwenberg, J.; Van Holle, V.; Simons, D.; Deridder, R.; Clarys, P.; Goubert, L.; Nasar, J.; Salmon, J.; De Bourdeaudhuij, I.; Deforche, B. Environmental factors influencing older adults’ walking for transportation: A study using walk-along interviews. Int. J. Behav. Nutr. Phys. Act. 2012, 9, 85. [Google Scholar] [CrossRef] [Green Version]
- James, P.; Banay, R.F.; Hart, J.E.; Laden, F. A review of the health benefits of greenness. Curr. Epidemiol. Rep. 2015, 2, 131–142. [Google Scholar] [CrossRef] [PubMed] [Green Version]
- Tzoulas, K.; Korpela, K.; Venn, S.; Yli-Pelkonen, V.; Kaźmierczak, A.; Niemela, J.; James, P. Promoting ecosystem and human health in urban areas using green infrastructure: A literature review. Landsc. Urban Plan. 2007, 81, 167–178. [Google Scholar] [CrossRef] [Green Version]
- Lwin, K.K.; Murayama, Y. Modelling of urban green space walkability: Eco-friendly walk score calculator. Comput. Environ. Urban Syst. 2011, 35, 408–420. [Google Scholar] [CrossRef]
Figure 1.
Study area.

Figure 2.
Method of calculating distance to a park.

Figure 3.
Distance decay function: (a) Distance decay function for Walk Score; (b) Simplified adaption of distance bands.
Figure 3.
Distance decay function: (a) Distance decay function for Walk Score; (b) Simplified adaption of distance bands.

Figure 4.
Spatial pattern of the Walkability Score in Seoul.

Figure 5.
Sample locations extracted to compare Walkability Score with pedestrian satisfaction.

Figure 6.
Map and street views of Namguro Station.

Figure 7.
Map and street views of Gwanghwamun Station.

Figure 8.
Map and street views of the National Assembly Building Station.

Figure 9.
Map and street views of the Yangjae Stream Forest.


Table 1.
Categories, indicators, algorithm, and data source for the Walkability Score calculation.
| Category | Indicator | Algorithm | Data Source | |
|---|---|---|---|---|
| Total Count | Weight | |||
| Amenity | ||||
| Grocery | Grocery store | 1 | 3 | Seoul Open Data Plaza |
| Restaurants | Restaurants; cafeteria | 10 | 0.75, 0.45, 0.25, 0.25, 0.225, 0.225, 0.225, 0.225, 0.2, 0.2 | |
| Shopping | Department stores; big box retails; shopping malls | 5 | 0.5, 0.45, 0.4, 0.35, 0.3 | Road Name Address |
| Coffee | Coffee shops; bakery | 2 | 1.25, 0.75 | Seoul Open Data Plaza |
| Banks | Banks | 1 | 1 | National Spatial Data Infrastructure Portal |
| Parks | Parks, open green spaces, forests; mountains and hills | 1 | 1 | Road Name Address |
| Schools | Elementary/middle/high schools | 1 | 1 | |
| Books | Bookstores; libraries | 1 | 1 | |
| Entertainment | Movie theatres, museums, gallery, zoos, community gardens | 1 | 1 | Website of three major cinemas, Open Data Portal; Road Name Address |
| Pedestrian Friendliness | ||||
| Intersection density | Intersections per square miles | >200: no penalty 150–200: 1% penalty 120–150: 2% penalty 90–120: 3% penalty 60–90: 4% penalty <60: 5% penalty | National Spatial Data Infrastructure Portal | |
| Average block length | Meters | <120 m: no penalty 120–150 m: 1% penalty 150–165 m: 2% penalty 165–180 m: 3% penalty 180–195 m: 4% penalty >195 m: 5% penalty | ||
Table 2.
Walk Score frequency and percentage according to degree of walkability.
| Variable | Measurement | Frequency (%) | Mean (SD) |
|---|---|---|---|
| Dependent Variable | |||
| Pedestrian’s satisfaction | Binary: 0 = dissatisfied 1 = satisfied | 16,589 (83.28%) 3331 (16.72%) | |
| Independent Variables | |||
| Walkability Score | Continuous: Walkability Score | 73.83 (10.05) | |
| Walk Score | Continuous: Walk Score | 89.20 (8.71) | |
| Confounding Variables | |||
| Gender | Binary: 0 = female 1 = male | 9177 (46.07%) 10,743 (53.93%) | |
| Age | Continuous: 1 = 15–19 years old, 2 = 20–24 years old, 3 = 25–29 years old, 4 = 30–34 years old, 5 = 35–39 years old, 6 = 40–44 years old, 7 = 45–49 years old, 8 = 50–54 years old, 9 = 55–59 years old, 10 = 60–64 years old, 11 = 60 + years old | 6.28 (3.05) | |
| Walking purpose | Binary: 0 = recreational walking 1 = transportation walking | 0: 4744 (23.82%) 1: 15,176 (76.18%) | |
Note: SD: standard deviation.
Table 3.
Walkability Score frequency and percentage according to the degree of walkability.
| Walkability Score | Description | Frequency | Percentage |
|---|---|---|---|
| 90–100 | Walker’s paradise | 354 | 0.8 |
| 70–89 | Very walkable | 21,188 | 48.2 |
| 50–69 | Somewhat walkable | 15,517 | 35.3 |
| 25–49 | Somewhat car-dependent | 4676 | 10.6 |
| 0–24 | Car-dependent | 2265 | 5.1 |
| Total | 44,000 | 100.0 |
Table 4.
Walkability Score descriptive statistics (administrative units of gu).
| Administrative Unit (Gu) | Mean | SD | Min | Max | Administrative Unit (Gu) | Mean | SD | Min | Max |
|---|---|---|---|---|---|---|---|---|---|
| Jongno | 66.0 | 16.8 | 0.0 | 97.3 | Mapo | 61.6 | 22.2 | 0.0 | 94.1 |
| Jung | 75.2 | 13.1 | 0.0 | 97.5 | Yangcheon | 71.0 | 10.7 | 0.0 | 95.3 |
| Yongsan | 57.2 | 20.8 | 0.0 | 87.2 | Gangseo | 59.5 | 22.6 | 0.0 | 92.3 |
| Seongdong | 64.5 | 15.9 | 5.0 | 89.9 | Guro | 65.3 | 16.5 | 0.0 | 90.4 |
| Gwangjin | 68.4 | 13.8 | 0.0 | 88.4 | Geumcheon | 63.2 | 19.2 | 0.0 | 95.8 |
| Dongdaemun | 69.9 | 9.8 | 6.7 | 91.5 | Yeongdeungpo | 69.6 | 13.9 | 0.0 | 91.7 |
| Jungnang | 69.5 | 16.5 | 0.0 | 90.3 | Dongjak | 63.0 | 18.5 | 0.0 | 87.1 |
| Seongbuk | 65.8 | 13.8 | 0.0 | 87.2 | Gwanak | 52.6 | 27.7 | 0.0 | 86.0 |
| Gangbuk | 66.1 | 18.5 | 0.0 | 88.8 | Seocho | 64.6 | 17.3 | 0.0 | 91.5 |
| Dobong | 73.5 | 16.2 | 0.0 | 95.3 | Gangnam | 65.0 | 14.9 | 0.0 | 88.7 |
| Nowon | 56.0 | 14.0 | 0.0 | 87.0 | Songpa | 60.0 | 20.3 | 0.0 | 88.4 |
| Eunpyeong | 71.0 | 14.9 | 0.0 | 96.6 | Gangdong | 64.4 | 17.9 | 0.0 | 92.6 |
| Seodaemun | 68.0 | 13.2 | 0.0 | 95.8 | Seoul (All) | 64.4 | 18.4 | 0.0 | 97.5 |
Note: SD: standard deviation.
Table 5.
Statistical analysis of the association between Walkability Score and pedestrian satisfaction.
Table 5.
Statistical analysis of the association between Walkability Score and pedestrian satisfaction.
| Walkability Score | Walk Score | |||||
|---|---|---|---|---|---|---|
| Variables | OR (SE) | Z | p-Value | OR (SE) | Z | p-Value |
| Gender | 1.038 (0.040) | 0.98 | 0.326 | 1.038 (0.040) | 0.98 | 0.326 |
| Age | 1.028 (0.007) | 4.43 | <0.001 | 1.028 (0.007) | 4.40 | <0.001 |
| Walking Purpose | 1.132 (0.052) | 2.70 | 0.007 | 1.131 (0.052) | 2.68 | 0.007 |
| Walkability Score | 1.008 (0.002) | 3.97 | <0.001 | NA | ||
| Walk Score | NA | 0.997 (0.002) | −1.37 | 0.170 | ||
| Constant | 0.084 (0.013) | −15.57 | <0.001 | 0.195 (0.039) | −8.09 | <0.001 |
| N | 19,920 | 19,920 | ||||
| LR-Chi2 | 41.97 | 27.68 | ||||
| Log likelihood | −8971.875 | −8979.019 | ||||
Note: OR = odds ratio; SE = standard error.
© 2019 by the authors. Licensee MDPI, Basel, Switzerland. This article is an open access article distributed under the terms and conditions of the Creative Commons Attribution (CC BY) license (http://creativecommons.org/licenses/by/4.0/).
Share and Cite
MDPI and ACS Style
Kim, E.J.; Won, J.; Kim, J. Is Seoul Walkable? Assessing a Walkability Score and Examining Its Relationship with Pedestrian Satisfaction in Seoul, Korea. Sustainability 2019, 11, 6915. https://0-doi-org.brum.beds.ac.uk/10.3390/su11246915
AMA Style
Kim EJ, Won J, Kim J. Is Seoul Walkable? Assessing a Walkability Score and Examining Its Relationship with Pedestrian Satisfaction in Seoul, Korea. Sustainability. 2019; 11(24):6915. https://0-doi-org.brum.beds.ac.uk/10.3390/su11246915
Chicago/Turabian StyleKim, Eun Jung, Jaewoong Won, and Jiyeong Kim. 2019. "Is Seoul Walkable? Assessing a Walkability Score and Examining Its Relationship with Pedestrian Satisfaction in Seoul, Korea" Sustainability 11, no. 24: 6915. https://0-doi-org.brum.beds.ac.uk/10.3390/su11246915
Note that from the first issue of 2016, this journal uses article numbers instead of page numbers. See further details here.