Understanding Thermal Impact of Roads on Permafrost Using Normalized Spectral Entropy


1
Key Laboratory for Special Area Highway Engineering of Ministry of Education, Chang’an University, Xi’an 710064, China
2
Engineering Research Center of Highway Infrastructure Digitalization, Ministry of Education, Xi’an 710064, China
3
College of Life Science and Bioengineering, Shenyang University, Shenyang 110044, China
4
CAS Key Laboratory of Forest Ecology and Management, Institute of Applied Ecology, Chinese Academy of Science, Shenyang 110016, China
5
Institute of Agricultural Resources and Regional Planning, Chinese Academy of Agricultural Sciences, Beijing 100081, China
*
Authors to whom correspondence should be addressed.
Sustainability 2019, 11(24), 7177; https://0-doi-org.brum.beds.ac.uk/10.3390/su11247177
Submission received: 26 November 2019
/
Revised: 10 December 2019
/
Accepted: 12 December 2019
/
Published: 15 December 2019
(This article belongs to the Special Issue Global Engineering and Sustainable Development)
Abstract
:Permafrost is characterized by low temperature, and its thermal stability is key to geohydrological cycles, energy exchange, and climate regulation. Increasing engineering activities, i.e., road construction and operations, are affecting the thermal stability in permafrost regions and have already led to the degradation of permafrost and caused environmental problems. To understand the spatiotemporal influence of road construction and operations on the thermal dynamics in permafrost regions, we conducted a study in the Ela Mountain Pass where multiple roads intersect on the Qinghai–Tibet Plateau (QTP) and calculated the thermal dynamics from 2000 to 2017 using normalized spectral entropy (measuring the disorderliness of time-series data). Our results indicate that road level is a significant influencing factor, where high-level roads (expressways) exhibit stronger thermal impacts than low-level roads (province- and county-level roads). Our results also indicate that duration of operation is the most significant factor that determines the thermal impacts of roads on permafrost: the thermal impacts of the newly paved expressway are positively related to elevation, while the thermal impacts of the old expressway are positively related to less vegetated areas. The study provides an excellent method for understanding the spatiotemporal impacts of engineering activities on the temperature dynamics in permafrost regions, thereby helping policymakers in China and other countries to better plan their infrastructure projects to avoid environmentally vulnerable regions. The study also calls for advanced techniques in road maintenance, which can reduce the accumulated disturbance of road operations on permafrost regions.
1. Introduction
Evidence released in the fifth assessment report by the Intergovernmental Panel on Climate Change (IPCC) shows that more than half of global warming from 1951 to 2013 is associated with human activities [1,2]. Global warming driven by human activities has already taken severe tolls on the biogeochemical system of the Earth, including permafrost degradation [3,4].
Permafrost is a critical component of the Qinghai–Tibet Plateau (QTP, the world’s highest and largest plateau) in China. The area of the permafrost on the QTP has undergone substantial degradation during the past several decades (from 1.5 × 10⁶ km2 in 1976 to 1.26 × 10⁶ km2 in 2013, corresponding approximately the size of the United Kingdom) [5,6]. Existing studies show that linear engineering projects (road pavement and operation) are the dominant factor responsible for such degradation [7,8]. Road pavement and operation disturb the water–heat balance between natural ground and atmosphere, thereby leading to temperature rise and permafrost degradation [9]. Consequently, permafrost degradation strongly affects the geohydrological cycle, which can cause unexpected environmental and engineering disasters.
Studies of road pavement and operations in permafrost are hot topics [10,11,12]. Previous studies focus on climate changes and permafrost impacts on road embankment, settlement, and stability [13,14,15]; however, few analyses have been devoted to the thermal impacts of road pavement and operations on permafrost dynamics. For the QTP region, due to limited accessibility in permafrost regions, numerical simulation was adopted to analyze geothermal changes along roads and the surrounding permafrost [16]. Moreover, Liu and others analyzed the thermal effect of rainwater infiltration into the subgrade of roads on the permafrost degradation by laboratory experiment [17]. The results of such methods rely heavily on the model performance with limited real observation data. Other studies used point-level data collected from meteorological observation stations or ground temperature observation holes [18,19]. Although such point-level data can be used to measure ground temperature at the regional level via spatial interpolation, the result usually blurs or ignores important detailed information (e.g., linear impacts from roads). The problem is even more severe on the QTP because the distribution of meteorological observation stations is rather sparse for such a vast region, and many of them are not close to roads. The analyses mentioned above (numerical simulation, lab experiment, point-level observation, and interpolation) are not fit for a large-scale long-term understanding of road pavement and operation on permafrost dynamics (very true for the QTP). Thus, we adopt satellite data collected using a moderate resolution imaging spectroradiometer (MODIS) as our data input, which is ideal for monitoring large-scale long-term land surface data, including high-latitude regions like the QTP [20,21].
To capture spatiotemporal information of ground temperature on the QTP permafrost at the regional level and to better assess the associated impacts of human activities (road pavement and operation), we placed our study region in a mountain pass with multiple road intersections, used satellite data (real observation data, thermal product) as data input, and adopted a powerful indicator, normalized spectral entropy (Hsn), as the method [22,23]. In the analysis, we set the buffer zone as 1 km from study roads, calculated the Hsn of the study area [24,25], and then analyzed and compared the Hsn of the road with respect to different land cover types and elevation divisions.
2. Data and Methods
2.1. Study Region
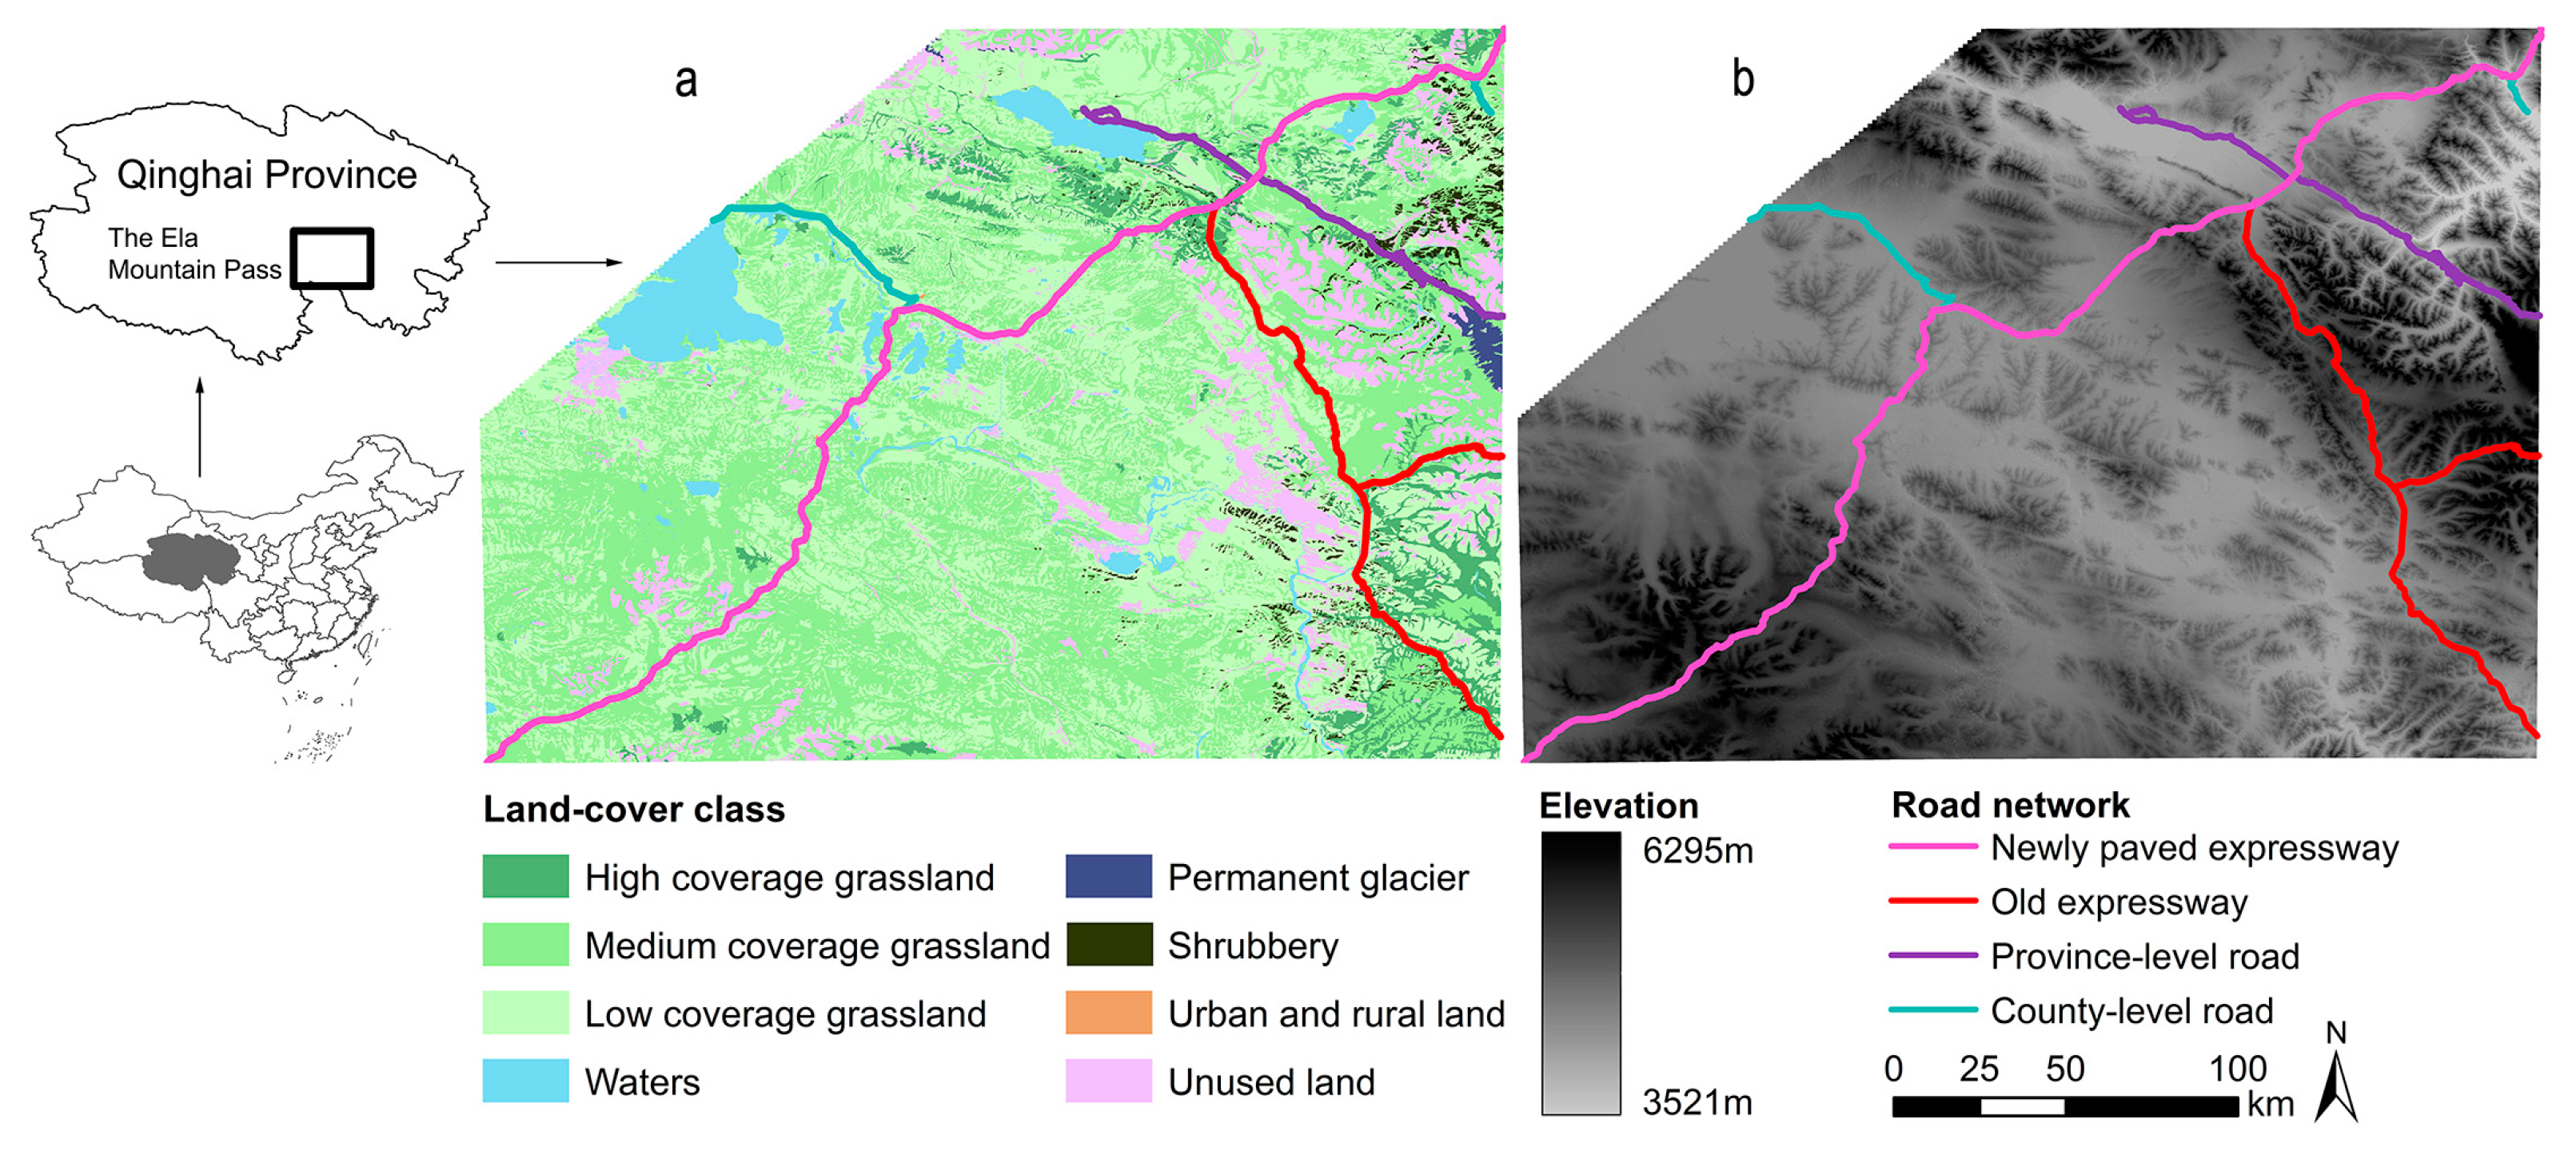
The QTP has the largest permafrost area in the world, which has been considerably affected by increasing human activities (road pavement and operations), causing substantial degradation of permafrost and other related economic and environmental problems [26]. Here, we selected the permafrost region in the Ela Mountain Pass (97.30–99.30°E, 34–35.30°N) on the QTP as our study area. The Ela Mountain Pass is an excellent study region to evaluate the spatiotemporal impacts of human activities on permafrost dynamics, because multiple roads (one old expressway in operation since 2007, one newly paved expressway in operation since 2017, one province-level road in operation since 2016, and two county-level roads in operation since 2000) have been paved and are in operation over the past two decades (Figure 1). Road levels, from high to low, include an expressway, a province-level road, and county-level roads.
2.2. Land Surface Temperature
We used MOD11A1, a MODIS product, which is the daily land surface temperature data provided at 1 km spatial resolution and daily temporal resolution. The MOD11A1 used here were downloaded from the U.S. Geological Survey (https://lpdaac.usgs.gov/), with temporal coverage from January 2000 to December 2017 and spatial coverage between longitude range 92.38–117.49°E and latitude range 30–40°N (covering the study area of Ela Mountain Pass). The MOD11A1 used here is Version 4 (i.e., commercially available), which have been verified by the long-term, large-scale ground temperature data and measured at 90% accuracy [28,29].
We used the MODIS Reprojection Tool (MRT) software to re-project MOD11A1 data onto the WGS 84 projection system, and then saved the data as the geotiff type with nearest neighbor resampling. Next, we extracted the monthly maximum ground temperatures using daily land surface temperature, which were then used in our calculations (see Supplementary file S1 for detailed process). Compared with the monthly ground temperature, monthly maximum ground temperature can better capture the thermal impacts caused by road pavement.
2.3. Normalized Spectral Entropy
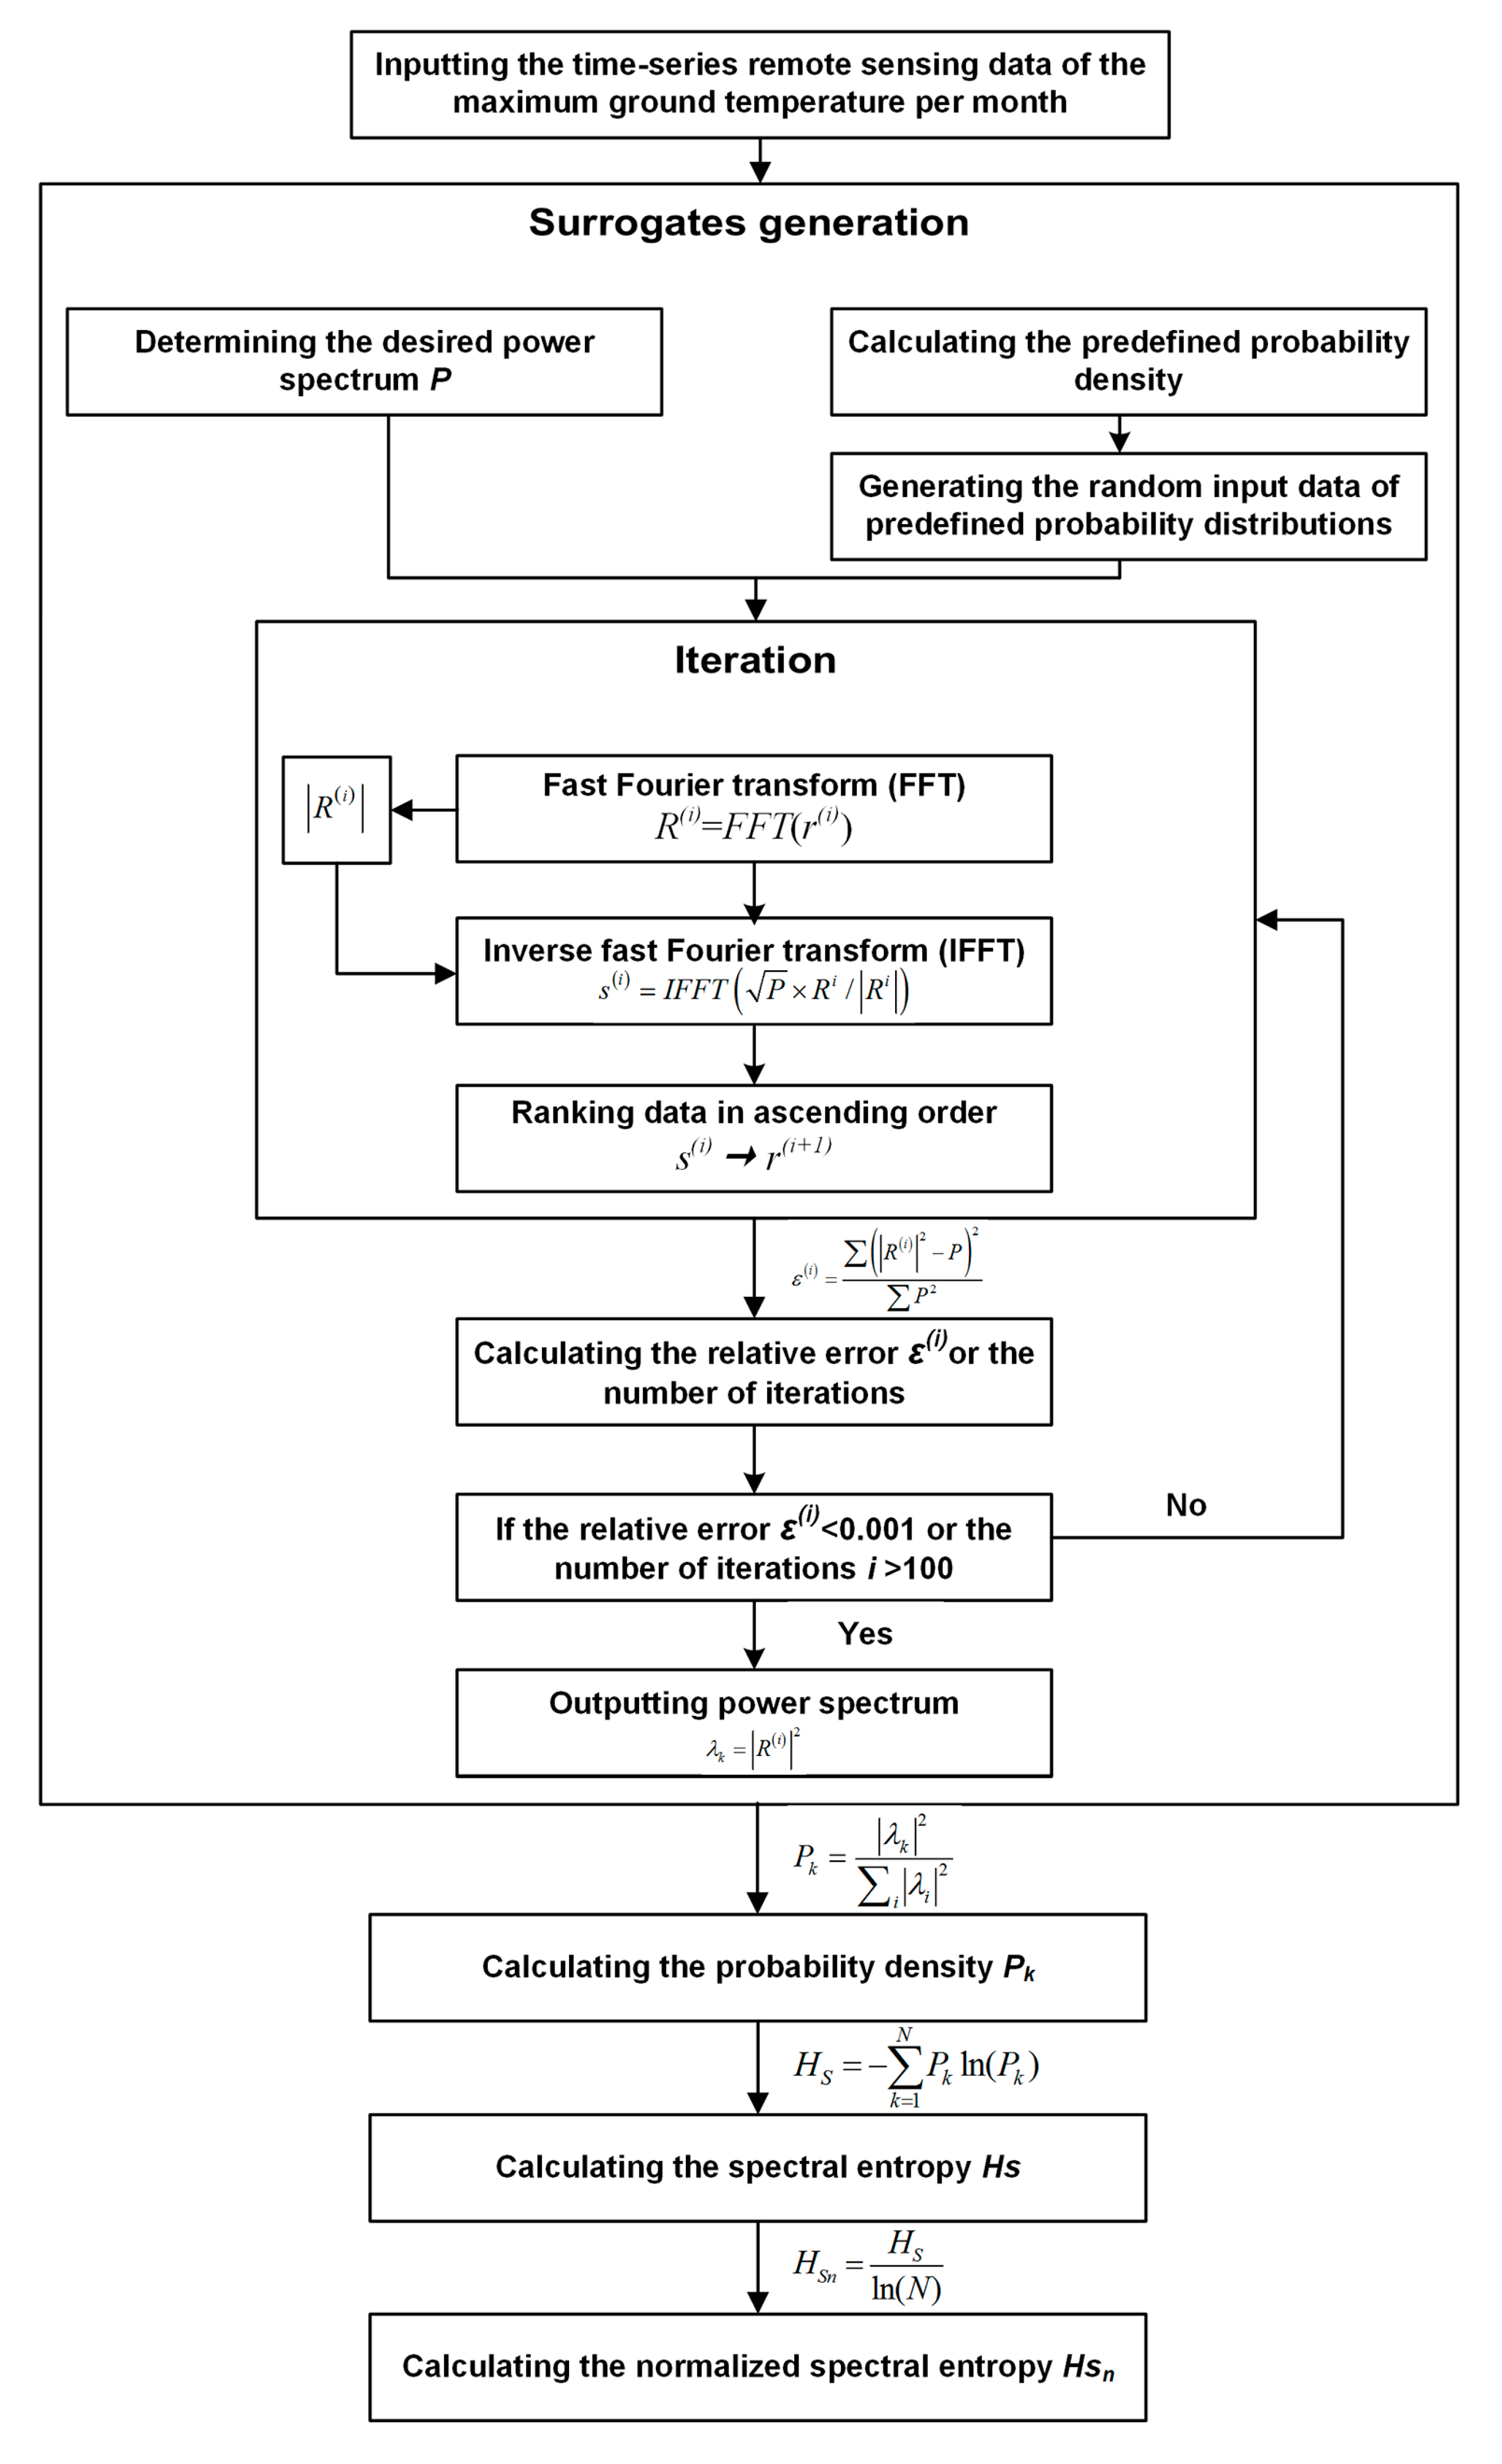
We adopted the normalized spectral entropy here, which is an entropy measurement. Entropy is initially a physical quantity in thermodynamics that characterizes the degree of disorder in the state of molecules [30]. In 1948, information entropy was proposed by Shannon to solve the problem of quantifying information and clarifying the relationship between the probability of information occurrence and information redundancy [31]. Additionally, spectral entropy is the application of information entropy in the power spectrum [23]. Information entropy can be used to assess the degree of disorder or confusion in isolated systems, and the more chaotic a system, the higher the information entropy [32]. Information entropy has been widely applied in the studies of climate change and land use changes [22,23]. Therefore, we attempt to use the normalized spectral entropy to assess the dynamics and disturbances of the permafrost ground temperature system, as well as to quantify the long-term cumulative thermal impacts of roads on permafrost. The steps of calculating the normalized spectral entropy of the study region based on the time-series remote sensing data of the monthly maximum ground temperature are shown in Figure 2.
The spectral entropy of the time-series remote sensing data of the maximum ground temperature per month in the Ela Mountain Pass can be calculated as follows:
where N is equal to half the length of the time series, which denotes the number of frequencies derived by the fast Fourier transform [23]; and Pk is the probability that the amplitude value of the kth signal occurs anywhere in the signal [33], which means the probability density of frequency sequence data for the maximum ground temperature per month. Pk can be calculated as follows:
where λk is the power spectrum of the kth signal [34], namely, the power spectrum of the frequency sequence data for the kth maximum ground temperature.
To obtain the normalized value, spectral entropy is usually processed to a range of values between 0 and 1 as follows:
where the term ln(N) is the theoretical maximum value of entropy when all values of Pk are equal [23].
The normalized spectral entropy Hsn can be used to describe the disorderliness of time-series data based on its power spectrum [23]. For the ground temperature profiles derived from the MOD11A1, stable temperature along time axis would have a small Hsn value, while unstable temperature would have large Hsn value [22].
According to Equations (1)–(3), the key to calculating the normalized spectral entropy Hsn of the time-series data of the maximum ground temperature per month is to convert the time-series data into frequency sequence data and calculate its power spectrum λk. The process of calculating the reference permafrost ground temperature profile of a power spectrum and probability density is surrogate generation, which assesses the dependence of normalized spectral entropy on remote sensing data properties and length [23,35,36].
First, we determined the desired power spectrum P based on the Nyquist frequency theory [33] and generated the original time-series ground temperature of predetermined probability distributions using the rejection method [37], whose probability distribution function is a non-sinusoidal periodic function. The desired power spectrum is a rectangular shape centered at a normalized frequency of 0.5 [33].
Next, we obtained a new sequence at each iteration in two steps [23,33,36]. In step one, we obtained the frequency sequence data of the ground temperature R(i) by taking the fast Fourier transform (FFT) of the original time-series data r(i) arranged in ascending order, R(i) = FFT(r(i)), then the amplitude and the complex phase of R(i) were simultaneously obtained. Then, replacing the amplitude R(i) by the desired one and retaining the complex phase, we obtained a new sequence s(i) taking the inverse fast Fourier transform (IFFT), . In step two, we obtained a new sequence r(i+1) by ranking s(i) in ascending order.
Third, we computed the relative error ε(i) between the desired power spectrum P and obtained new power spectrum to decide upon the cessation of the iterative algorithm as follows:
We produced a more accurate power spectrum by iteratively changing the probability distribution and the power spectrum until the accuracy of the relative error (0.001) or the number of iterations (100) was satisfied [23]. Then, we calculated the Hsn according to Equations (1)–(3). We developed the specific procedures by using the R statistical language for the surrogate generation and outputting the Hsn (see Supplementary file S2 for the detailed process) [38].
3. Results
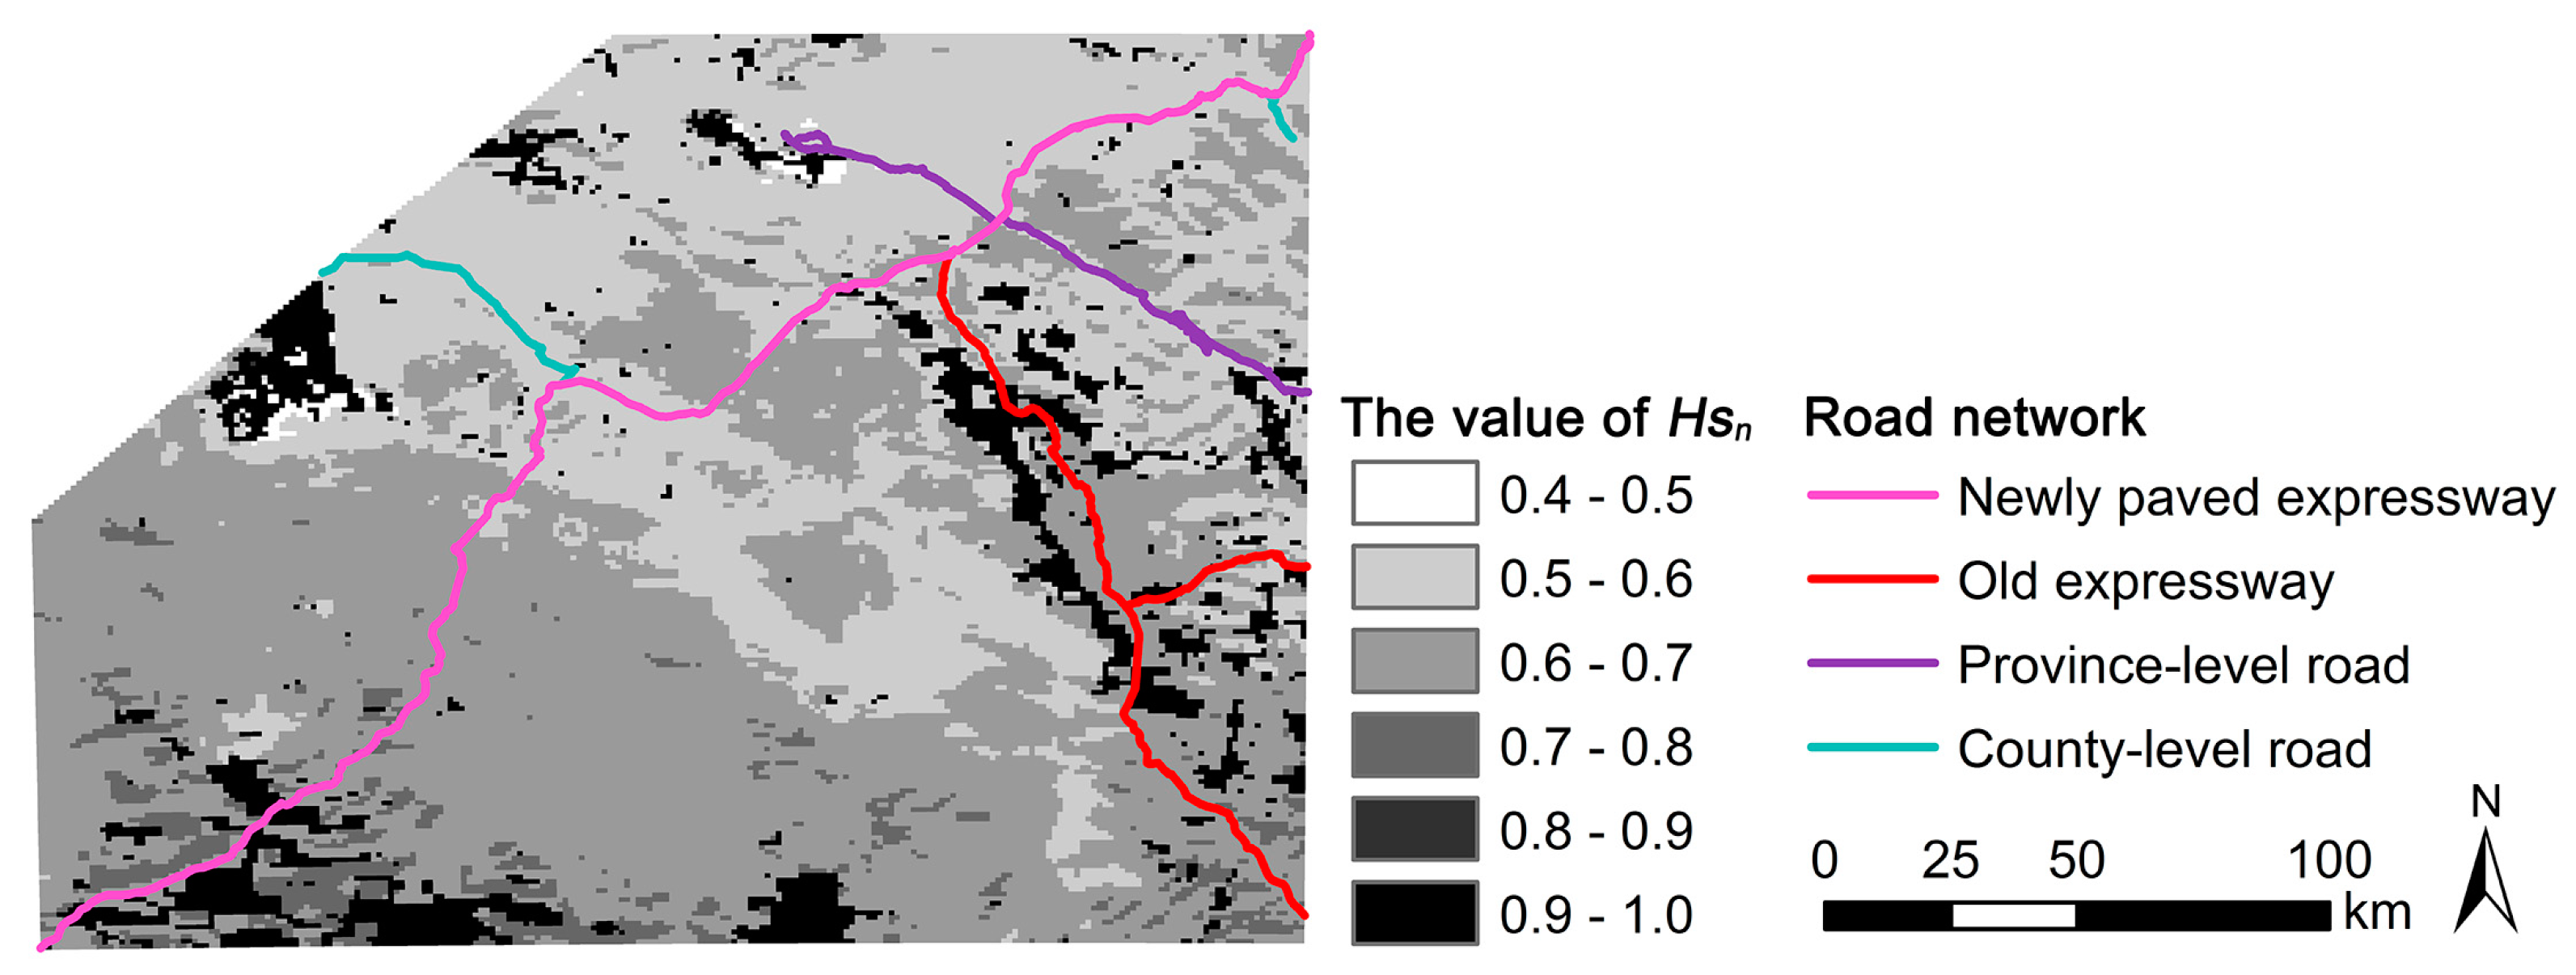
From 2000 to 2017, the thermal impacts of roads on permafrost varied substantially in the Ela Mountain Pass on the QTP (Figure 3). The thermal impact of the old expressway was the largest (average buffered Hsn = 0.69), followed by the new expressway (average buffered Hsn = 0.63), and the province-level road (average buffered Hsn = 0.59). The thermal impact of county-level roads was the smallest (average buffered Hsn = 0.57).
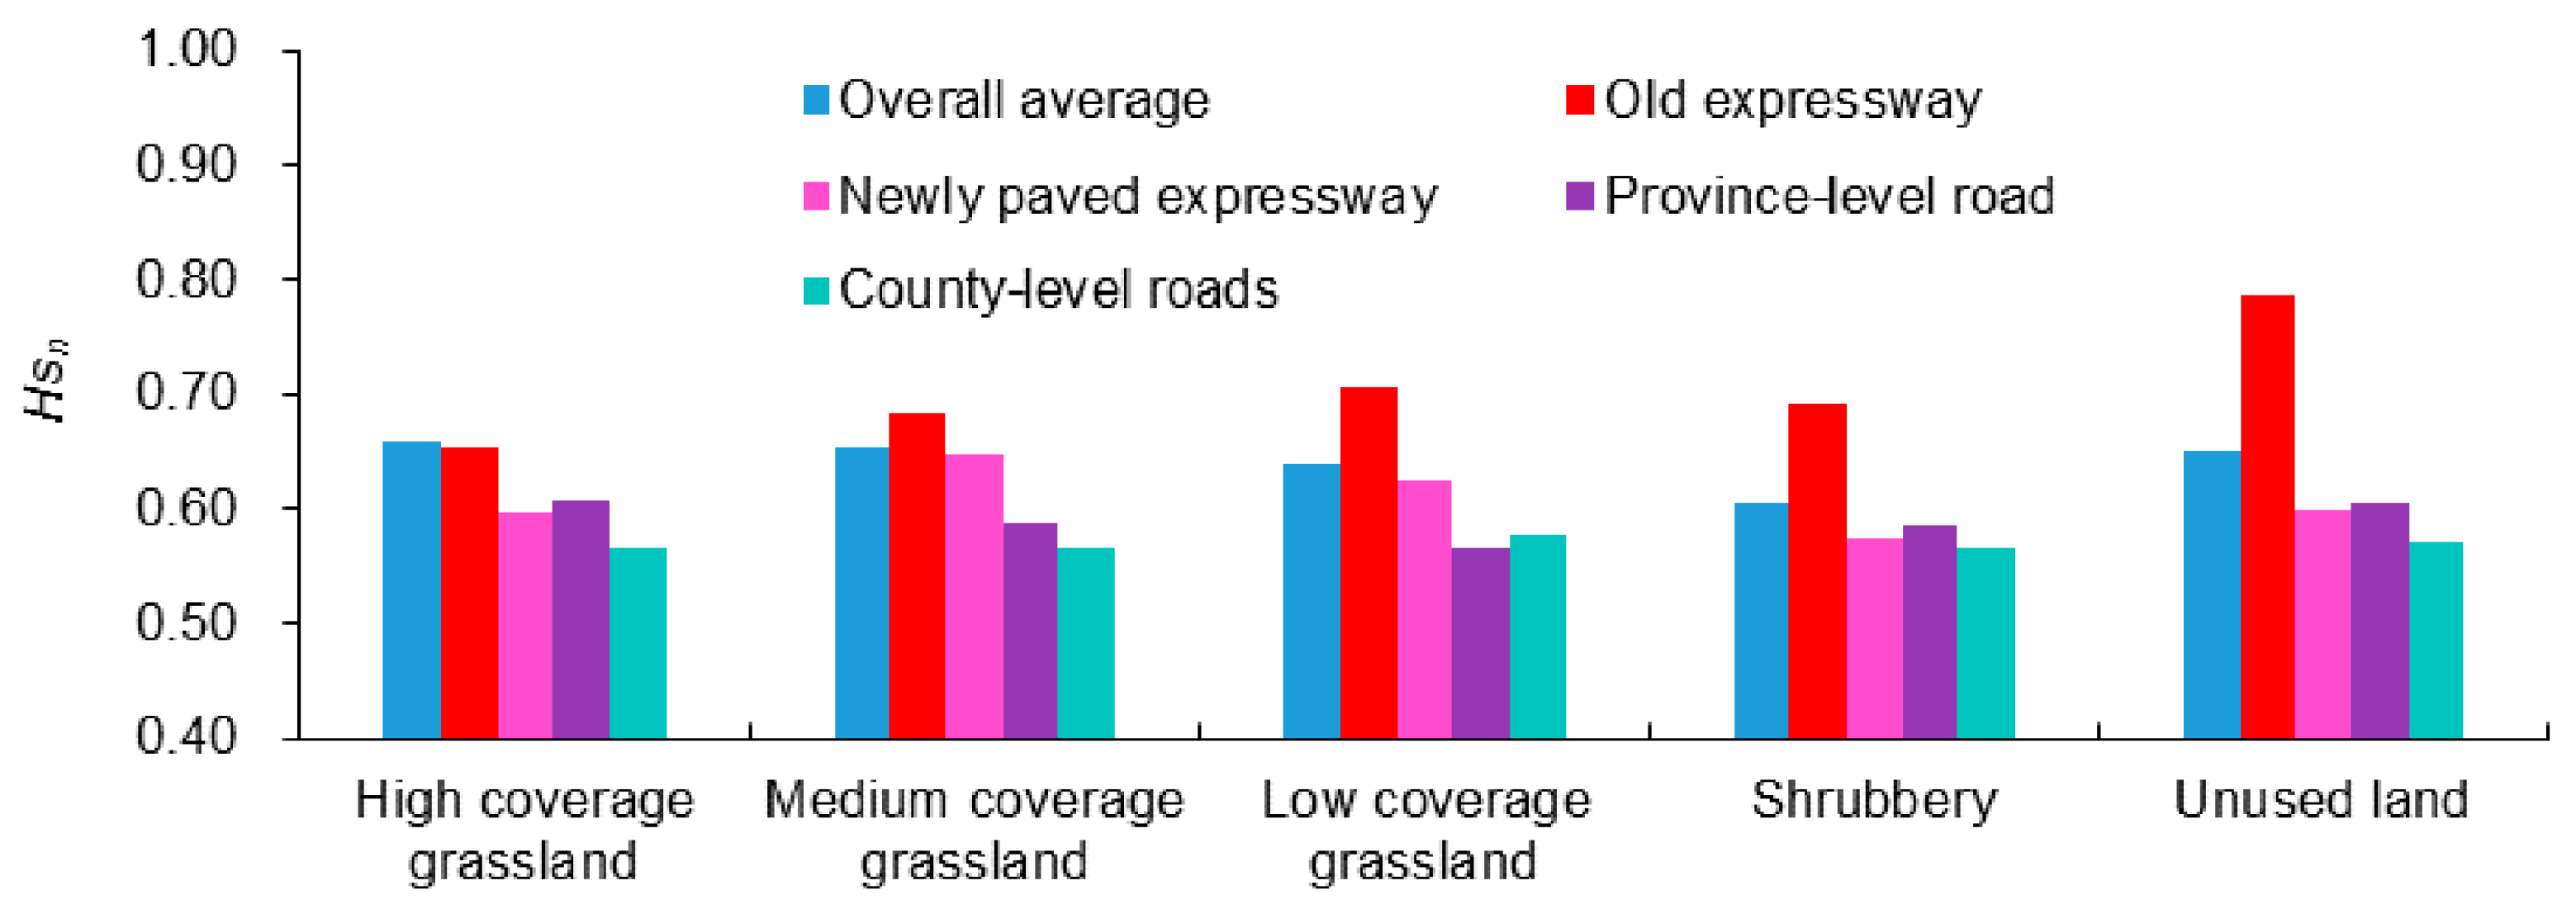
To further understand the thermal impacts of roads on permafrost, we superimposed the land cover and elevation data on the Hsn result map ( Figure 1; Figure 3) and analyzed the buffered Hsn of roads accordingly [39,40]. Road-buffered Hsn on most land covers was lower than the overall average of corresponding land cover, except the old expressway buffered Hsn on medium coverage grassland, low-coverage grassland, shrubbery, and unused land (Figure 4). For the high-coverage grassland, shrubbery, and unused land, the buffered Hsn of the old expressway was the highest, followed by the province-level road and newly paved expressway; the buffered Hsn of the county-level roads was the smallest. For the medium-coverage grassland, the buffered Hsn of the old expressway was the highest, followed by the newly paved expressway and province-level road; the buffered Hsn of the county-level roads was the smallest. For the low-coverage grassland, the old expressway buffered Hsn was the highest, followed by the newly paved expressway and county-level roads; the buffered Hsn of the province-level road was the smallest.
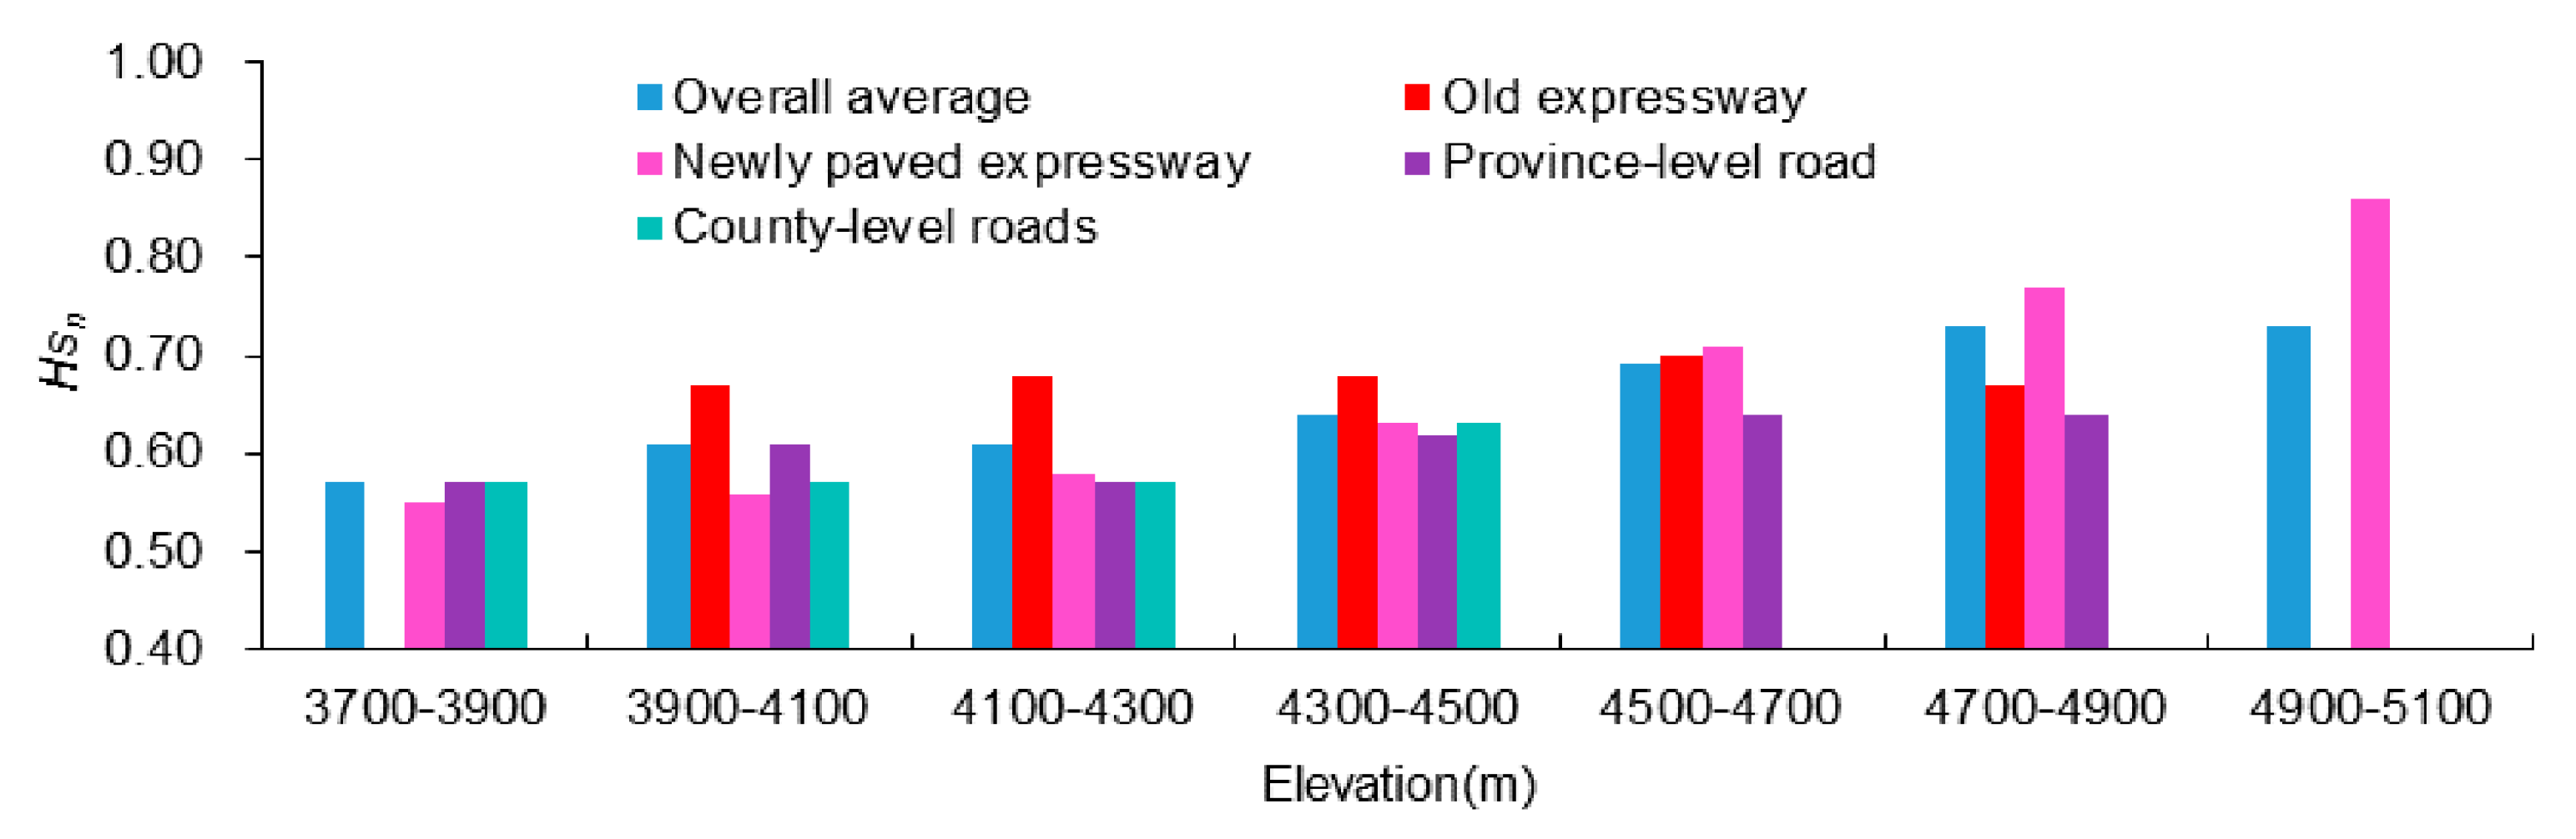
With elevated altitude, the buffered Hsn of all road types increased (Figure 5). The increase in the newly paved expressway buffered Hsn was the greatest, which surpassed the overall average from 4500–4700 to 4900–5100 m. The buffered Hsn of the old expressway experienced a slight increase with the increased elevation and was larger than the overall average in most elevation divisions except for 4700–4900 m. The buffered Hsn of the province-level road and county-level roads were relatively stable, and were smaller than the overall average in all elevation divisions.
In addition to a statistical study of the above difference of the Hsn distribution, we performed ANOVA for Hsn of different roads and outside the road buffer with respect to land cover and elevation (Table 1). The results showed that the Hsn of different roads and outside the road buffer was significantly different among grassland and unused land as all p-value < 0.05, except for shrubbery, whose p-value was 0.306 and greater than 0.05, indicating an infinitesimal thermal impact difference among shrubbery. The difference was also significant when the elevation range was from 4100–4300 to 4900–5100 m, as all p-values were less than 0.05. Detailed parameter outputs of ANOVA are provided in Supplementary Table S1.
4. Discussion and Conclusions
Our results show that different road types have different impacts on the thermal dynamics of permafrost, among which the impact of the expressway is strongest. Specifically, in both land cover and elevation comparisons, the overall average Hsn is generally lower than the Hsn of high-level roads and is higher than the Hsn of low-level roads, showing that the expressway has substantial impacts on the thermal dynamics of permafrost, while the impacts from province-level and county-level roads are limited.
Our results also show that the operation duration is a sensitive factor for the expressway thermal impacts, which provides scientific suggestions in infrastructure planning and construction on the QTP and other permafrost regions. The thermal impact of the newly paved expressway becomes significantly stronger with increased elevation, exhibiting greater perturbation to the permafrost. The thermal impact of the old expressway is more closely related with land covers, and this is particularly true for those land covers with less vegetation coverage, including medium coverage grassland, low coverage grassland, shrubbery, and unused land. Thus, more attention should be paid to the mountain region during road construction, and more maintenance should be conducted for less vegetated regions in road operation.
It is worth noting that weather and elevation contribute to entropy, but they exhibit a limited influence on entropy changes. For example, temperature is an important weather factor, which increases in spring and decreases in winter. Since the temperature fluctuations are rather stable (like a sine function) with a fixed frequency, we assume they contribute little to entropy changes. For elevation, our comparison analysis is conducted in each elevation division, in which we assume elevation does not contribute to entropy changes either.
This study proposes an innovative approach to understanding the thermal impacts of roads on permafrost dynamics at large spatiotemporal scales. The method adopted here relies on Fourier transform, which requires the data series to be stable at the second derivatives. We are currently working on the wavelet transform method, with the objective of improving the understanding of accuracy and of providing improved suggestions on infrastructure construction and planning.
Supplementary Materials
The following are available online at https://0-www-mdpi-com.brum.beds.ac.uk/2071-1050/11/24/7177/s1, File S1: Code for re-projection and extraction of sub-datasets for remote sensing images in batches, and calculating the monthly maximum ground temperature. File S2: R code for calculating normalized spectral entropy of the study region. Table S1: ANOVA of Hsn of different roads and the area outside the road buffer with respect to land cover and elevation.
Author Contributions
Conceptualization, C.Z., F.Z. and J.S.; Methodology, C.Z., H.Z., and F.Z.; Software, H.Z. and J.S.; Validation, H.Z., J.S. and F.Z.; Formal Analysis, C.Z. and F.Z.; Investigation, H.Z.; Resources, C.Z., F.Z. and J.S.; Data Curation, F.Z. and J.S.; Writing—Original Draft Preparation, H.Z.; Writing—Review & Editing, J.S., H.Z. and C.Z.; Funding Acquisition, C.Z.
Funding
This research was funded by Scientific Innovation Practice Project of Postgraduates of Chang’an University [300103002037].
Acknowledgments
The authors thank the Key Laboratory for Special Area Highway Engineering of the Ministry of Education and the Engineering Research Center of Highway Infrastructure Digitalization of the Ministry of Education for providing software, and the CAS Key Laboratory of Forest Ecology and Management and the Institute of Agricultural Resources and Regional Planning for providing basic information.
Conflicts of Interest
The authors declare no conflict of interest.
References
- Rockström, J.; Brasseur, G.; Hoskins, B.; Lucht, W.; Schellnhuber, J.; Kabat, P.; Nakicenovic, N.; Gong, P.; Schlosser, P.; Máñez Costa, M.; et al. Climate change: The necessary, the possible and the desirable Earth League climate statement on the implications for climate policy from the 5th IPCC Assessment. Earths Future 2014, 2, 606–611. [Google Scholar] [CrossRef] [Green Version]
- Tubiello, F.N.; Salvatore, M.; Ferrara, A.F.; House, J.; Federici, S.; Rossi, S.; Biancalani, R.; Condor Golec, R.D.; Jacobs, H.; Flammini, A.; et al. The Contribution of Agriculture, Forestry and other Land Use activities to Global Warming, 1990–2012. Glob. Chang. Biol. 2015, 21, 2655–2660. [Google Scholar] [CrossRef] [PubMed] [Green Version]
- Yoshikawa, K.; Hinzman, L.D. Shrinking thermokarst ponds and groundwater dynamics in discontinuous permafrost near Council, Alaska. Permafr. Periglac. Process. 2003, 14, 151–160. [Google Scholar] [CrossRef]
- Frauenfeld, O.W.; Zhang, T.; Barry, R.G. Interdecadal changes in seasonal freeze and thaw depths in Russia. J. Geophys. Res.-Atmos. 2004, 109, D05101. [Google Scholar] [CrossRef]
- Cheng, G.D.; Jin, H.J. Groundwater in the permafrost regions on the Qinghai-Tibet Plateau and it changes. Hydrogeol. Eng. Geol. 2013, 40, 1–11. [Google Scholar]
- Lu, Q.; Zhao, D.S.; Wu, S.H. Simulated responses of permafrost distribution to climate change on the Qinghai-Tibet Plateau. Sci. Rep. 2017, 7, 3845. [Google Scholar] [CrossRef]
- Cai, H.C.; Li, Y.; Yang, Y.P. Variation of Temperature and Permafrost along Qinghai-Tibet Railway. Chin. J. Rock Mech. Eng. 2016, 35, 1434–1444. [Google Scholar]
- Ran, Y.H.; Li, X.; Cheng, G.D. Climate warming over the past half century has led to thermal degradation of permafrost on the Qinghai-Tibet Plateau. Cryosphere 2018, 12, 595–608. [Google Scholar] [CrossRef] [Green Version]
- Zhang, Z.Q.; Wu, Q.B.; Liu, Y.Z.; Zhang, Z.; Wu, G.L. Thermal accumulation mechanism of asphalt pavement in permafrost regions of the Qinghai-Tibet Plateau. Appl. Therm. Eng. 2018, 129, 345–353. [Google Scholar] [CrossRef]
- De Grandpre, I.; Fortier, D.; Stephani, E. Degradation of permafrost beneath a road embankment enhanced by heat advected in groundwater. Can. J. Earth Sci. 2012, 49, 953–962. [Google Scholar] [CrossRef]
- Oldenborger, G.A.; LeBlanc, A.M. Geophysical characterization of permafrost terrain at Iqaluit International Airport, Nunavut. J. Appl. Geophys. 2015, 123, 36–49. [Google Scholar] [CrossRef]
- Melvin, A.M.; Larsen, P.; Boehlert, B.; Neumann, J.E.; Chinowsky, P.; Espinet, X.; Martinich, J.; Baumann, M.S.; Rennels, L.; Bothner, A.; et al. Climate change damages to Alaska public infrastructure and the economics of proactive adaptation. Proc. Natl. Acad. Sci. USA 2017, 114, E122–E131. [Google Scholar] [CrossRef] [PubMed] [Green Version]
- Fortier, R.; LeBlanc, A.M.; Yu, W.B. Impacts of permafrost degradation on a road embankment at Umiujaq in Nunavik (Quebec), Canada. Can. Geotech. J. 2011, 48, 720–740. [Google Scholar] [CrossRef]
- Ciro, G.A.; Alfaro, M.C. Adaptation strategies for road embankments on permafrost affected by climate warming. In Proceedings of the 2006 IEEE EIC Climate Change Conference, Ottawa, ON, Canada, 10–12 May 2006; p. 10. [Google Scholar]
- Ghias, M.S.; Therrien, R.; Molson, J.; Lemieux, J.M. Controls on permafrost thaw in a coupled groundwater-flow and heat-transport system: Iqaluit Airport, Nunavut, Canada. Hydrogeol. J. 2017, 25, 657–673. [Google Scholar] [CrossRef]
- Liu, W.; Yu, W.; Hu, D.; Lu, Y.; Chen, L.; Yi, X.; Han, F. Crack damage investigation of paved highway embankment in the Tibetan Plateau permafrost environments. Cold Reg. Sci. Technol. 2019, 163, 78–86. [Google Scholar] [CrossRef]
- Liu, W.; Yu, W.; Fortier, R.; Chen, L.; Lu, Y.; Zhang, M.; Hu, D. Thermal effect of rainwater infiltration into a replicated road embankment in a cold environmental chamber. Cold Reg. Sci. Technol. 2019, 159, 47–57. [Google Scholar] [CrossRef]
- Yu, F.; Qi, J.L.; Yao, X.L.; Liu, Y.Z. Comparison of permafrost degradation under natural ground surfaces and embankments of the Qinghai-Tibet Highway. Cold Reg. Sci. Technol. 2015, 114, 1–8. [Google Scholar] [CrossRef]
- Jin, H.J.; Li, S.X.; Wang, S.L.; Zhao, L. Impacts of climatic change on permafrost and cold regions environments in China. Acta Geogr. Sin. 2000, 55, 161–173. [Google Scholar]
- Hachem, S.; Duguay, C.R.; Allard, M. Comparison of MODIS-derived land surface temperatures with ground surface and air temperature measurements in continuous permafrost terrain. Cryosphere 2012, 6, 51–69. [Google Scholar] [CrossRef] [Green Version]
- Yao, Y.; Zhang, B. MODIS-based estimation of air temperature of the Tibetan Plateau. J. Geogr. Sci. 2013, 23, 627–640. [Google Scholar] [CrossRef]
- Sun, J.; Southworth, J. Retrospective analysis of landscape dynamics using normalized spectral entropy. Remote Sens. Lett. 2013, 4, 1049–1056. [Google Scholar] [CrossRef]
- Zaccarelli, N.; Li, B.-L.; Petrosillo, I.; Zurlini, G. Order and disorder in ecological time-series: Introducing normalized spectral entropy. Ecol. Indic. 2013, 28, 22–30. [Google Scholar] [CrossRef]
- Ibisch, P.L.; Hoffmann, M.T.; Kreft, S.; Pe’er, G.; Kati, V.; Biber-Freudenberger, L.; DellaSala, D.A.; Vale, M.M.; Hobson, P.R.; Selva, N. A global map of roadless areas and their conservation status. Science 2016, 354, 1423–1427. [Google Scholar] [CrossRef] [PubMed]
- Liu, S.L. Study on the Ecological Effect of Road Landscape. In Road Landscape Ecology Research; Beijing Normal University Publishing Group: Beijing, China, 2012; pp. 219–289. [Google Scholar]
- Yu, W.B.; Yi, X.; Niu, Y.Z.; Richard, F.; Mu, Y.H.; Zhang, J.M. Dynamic thermal regime of permafrost beneath embankment of Qinghai-Tibet Highway under the scenarios of changing structure and climate warming. Cold Reg. Sci. Technol. 2016, 126, 76–81. [Google Scholar]
- Liu, J.; Kuang, W.; Zhang, Z.; Xu, X.; Qin, Y.; Ning, J.; Zhou, W.; Zhang, S.; Li, R.; Yan, C.; et al. Spatiotemporal characteristics, patterns, and causes of land-use changes in China since the late 1980s. J. Geogr. Sci. 2014, 24, 195–210. [Google Scholar] [CrossRef]
- Wang, B.; Ma, Y.; Ma, W. Estimation of land surface temperature retriecved from EOS/MODIS in Naqu area over Tibetan Plateau. J. Remote Sens. 2012, 16, 1289–1309. [Google Scholar]
- Famiglietti, C.A.; Fisher, J.B.; Halverson, G.; Borbas, E.E. Global Validation of MODIS Near-Surface Air and Dew Point Temperatures. Geophys. Res. Lett. 2018, 45, 7772–7780. [Google Scholar] [CrossRef] [Green Version]
- Bejan, A. Evolution in thermodynamics. Appl. Phys. Rev. 2017, 4, 011305. [Google Scholar] [CrossRef]
- Shannon, C.E. A mathematical theory of communication. Bell Syst. Tech. J. 1948, 27, 379–423. [Google Scholar] [CrossRef] [Green Version]
- Gao, J.; Liu, F.; Zhang, J.; Hu, J.; Cao, Y. Information Entropy As a Basic Building Block of Complexity Theory. Entropy 2013, 15, 3396–3418. [Google Scholar] [CrossRef] [Green Version]
- Ferenets, R.; Tarmo, L.; Anier, A.; Jantti, V.; Melto, S.; Hovilehto, S. Comparison of entropy and complexity measures for the assessment of depth of sedation. IEEE Trans. Biomed. Eng. 2006, 53, 1067–1077. [Google Scholar] [CrossRef] [PubMed]
- Legendre, P.; Legendre, L. Multidimensional qualitative data. In Numerical Ecology (Developments in Environmental Modelling); Elsevier Science B.V.: Toronto, ON, Canada, 2012; pp. 208–216. [Google Scholar]
- Schreiber, T.; Schmitz, A. Improved surrogate data for nonlinearity tests. Phys. Rev. Lett. 1996, 77, 635–638. [Google Scholar] [CrossRef] [PubMed] [Green Version]
- Schreiber, T.; Schmitz, A. Surrogate time series. Phys. D 2000, 142, 346–382. [Google Scholar] [CrossRef] [Green Version]
- Press, W.H.; Teukolsky, S.A.; Vetterling, B.P.; Flannery, B.P. Random numbers; Fast Fourier Transform. In Numerical Recipes in C: The Art of Scientific Computing; Cambridge University Press: Cambridge, UK, 1992; pp. 290–296, 496–532. ISBN 0-521-43108-5. [Google Scholar]
- R-Core-Team. R: A Language and Environment for Statistical Computing; R Foundation for Statistical Computing: Vienna, Austria, 2018. [Google Scholar]
- Luyssaert, S.; Jammet, M.; Stoy, P.C.; Estel, S.; Pongratz, J.; Ceschia, E.; Churkina, G.; Don, A.; Erb, K.; Ferlicoq, M.; et al. Land management and land-cover change have impacts of similar magnitude on surface temperature. Nat. Clim. Chang. 2014, 4, 389–393. [Google Scholar] [CrossRef] [Green Version]
- Rangwala, I.; Miller, J.R. Climate change in mountains: A review of elevation-dependent warming and its possible causes. Clim. Chang. 2012, 114, 527–547. [Google Scholar] [CrossRef]
Figure 1.
Map of the study region with roads superimposed. (a) Land cover map. (b) Elevation map created from a digital elevation model (DEM). Land cover map was created by the Chinese Academy of Sciences [27], provided as vector type. The DEM was downloaded from the National Aeronautics and Space Administration (www.nasa.gov), provided at 90 m resolution. Note the rectangular area is the scope of a moderate resolution imaging spectroradiometer (MODIS) scene, which covers the entire Ela Mountain Pass with the upper-left part missing (not including the study area).

Figure 2.
Diagram of normalized spectral entropy calculation using monthly maximum ground temperature data from 2000 to 2017.
Figure 2.
Diagram of normalized spectral entropy calculation using monthly maximum ground temperature data from 2000 to 2017.

Figure 3.
Results of normalized spectral entropy (Hsn) from 2000 to 2017 in the Ela Mountain Pass, with the roads superimposed.
Figure 3.
Results of normalized spectral entropy (Hsn) from 2000 to 2017 in the Ela Mountain Pass, with the roads superimposed.

Figure 4.
Road-buffered Hsn on different land covers. Overall average denotes the overall average Hsn of corresponding land cover of the entire study region.
Figure 4.
Road-buffered Hsn on different land covers. Overall average denotes the overall average Hsn of corresponding land cover of the entire study region.

Figure 5.
Road-buffered Hsn at different elevations. Overall average denotes the overall average Hsn of corresponding elevation of the entire study region. If there were no data, the column is empty.
Figure 5.
Road-buffered Hsn at different elevations. Overall average denotes the overall average Hsn of corresponding elevation of the entire study region. If there were no data, the column is empty.


Table 1.
ANOVA results of Hsn for different roads and the area outside the road buffer.
| Category | Comparison Object | p-Value 1 |
|---|---|---|
| Land cover | High coverage grassland | 0.001 |
| Medium coverage grassland | <0.001 | |
| Low coverage grassland | <0.001 | |
| Shrubbery | 0.306 | |
| Unused land | <0.001 | |
| Elevation | 3700–3900 m | 0.454 |
| 3900–41900 m | 0.200 | |
| 4100–4300 m | <0.001 | |
| 4300–4500 m | <0.001 | |
| 4500–4700 m | <0.001 | |
| 4700–4900 m | 0.004 | |
| 4900–5100 m | 0.045 |
1 Significance level adopted here is 0.05.
© 2019 by the authors. Licensee MDPI, Basel, Switzerland. This article is an open access article distributed under the terms and conditions of the Creative Commons Attribution (CC BY) license (http://creativecommons.org/licenses/by/4.0/).
Share and Cite
MDPI and ACS Style
Zhang, C.; Zhang, H.; Zhao, F.; Sun, J. Understanding Thermal Impact of Roads on Permafrost Using Normalized Spectral Entropy. Sustainability 2019, 11, 7177. https://0-doi-org.brum.beds.ac.uk/10.3390/su11247177
AMA Style
Zhang C, Zhang H, Zhao F, Sun J. Understanding Thermal Impact of Roads on Permafrost Using Normalized Spectral Entropy. Sustainability. 2019; 11(24):7177. https://0-doi-org.brum.beds.ac.uk/10.3390/su11247177
Chicago/Turabian StyleZhang, Chi, Hong Zhang, Fuqiang Zhao, and Jing Sun. 2019. "Understanding Thermal Impact of Roads on Permafrost Using Normalized Spectral Entropy" Sustainability 11, no. 24: 7177. https://0-doi-org.brum.beds.ac.uk/10.3390/su11247177
Note that from the first issue of 2016, this journal uses article numbers instead of page numbers. See further details here.