Trend Analysis of Urban Heat Island Intensity According to Urban Area Change in Asian Mega Cities


Division of Environmental Science & Ecological Engineering, Korea University, 02841 145 Anam-ro, Seongbuk-gu, Seoul 02841, Korea
*
Author to whom correspondence should be addressed.
Sustainability 2020, 12(1), 112; https://0-doi-org.brum.beds.ac.uk/10.3390/su12010112
Submission received: 28 October 2019
/
Revised: 19 December 2019
/
Accepted: 20 December 2019
/
Published: 22 December 2019
(This article belongs to the Special Issue Climate Change Mitigation and Urban Sustainable Development)
Abstract
:Urban heat island (UHI) is a phenomenon that occurs in cities worldwide. Therefore, there is an increasing need for studies on the changes in UHI intensity and long-term trends based on macroscopic characteristics related to urbanization. In this study, changes in seasonal UHI intensity based on urban area were analyzed for eight Asian mega cities from 1992–2012. The results indicate that the change in pattern of UHI intensity varies for different cities and seasons. UHI intensity increased as the urban area size increased. Furthermore, the dependency of UHI intensity on the economic situation was also demonstrated. With respect to the seasons, significantly increasing trends appeared during the summer. Moreover, depending on urban characteristics such as geography and climate, increasing trends appeared during other seasons. Population was also found to affect UHI intensity by generating anthropogenic heat; however, its effect as an individual factor appeared to be insignificant. This is a macroscale study that analyzes the effect of urban area size on UHI intensity. Future studies on urbanization factors and levels influencing the UHI intensity using higher resolution materials are required
1. Introduction
Urban heat island (UHI) is a commonly observed phenomenon worldwide; it is an urban area where temperatures are significantly higher than those in the surrounding areas. It causes problems such as changes in relative humidity, increase in energy consumption, and human thermal stress [1,2,3,4]. The UHI effect arises from the anthropogenic modification of natural landscapes and the consequent atmospheric and thermophysical changes in the urban boundary layer [5]. The formation of UHI can be mainly ascribed to the increased absorption and trapping of solar radiation in built-up urban fabrics, and to other factors, including population density of built-up areas and vegetation fractions [6]. Specifically, the built-up areas of cities can cause changes in albedo, thermal capacity, and roughness, and can significantly modify the surface-energy budget [7]. In addition, urban areas are the main source of anthropogenic carbon dioxide emissions, which are generated by burning fossil fuels for heating and cooling purposes, industrial processes, and transportation [6]. In this regard, the size of urban areas could be a major factor in UHI development, as explained by Oke [8]. However, the characteristics of such a correlation are not clearly understood.
UHI studies can be categorized into two fields. One type involves case studies, which focus on one or a few cities and evaluate the UHI phenomenon with immense detail. In contrast, the other type—ensemble or cross-sectional studies—examines several cities to understand the common characteristics or fundamental differences among them. The number of systematic empirical studies of the latter type has increased because of the accessibility of remote sensing with global coverage [9], and our study falls into this category. Several studies have indicated that continuing urbanization progressively increases the UHI intensity, and several others have demonstrated that the urban impact could have an effect on recent warming trends [10,11,12]. Hence, comparative studies on UHI changes for cities with different climatic and socio-economic situations, and on urban characteristics, are essential for researchers and decision-makers [6,13,14,15,16].
Several existing studies that focus on UHI at a macroscopic level were examined. Karl et al. [17] classified urbanization in cities of the United States based on population, and performed a time-series analysis for each season. The UHI intensity was defined as the temperature differences between urban and suburban areas with regard to the degree of urbanization. This was done by using the monthly temperature data from 1901–1984 obtained from 1219 observation stations of the historical climatology network. Although differences in urbanization and seasonality were confirmed in their study, there were limitations in the variability based on the location. Moreover, there was a difference in the degree of data construction between the eastern and western regions.
Jones et al. [13] attempted to identify the effect of temperature increase due to urbanization by using the rural-station temperature data for three regions, namely the western Soviet Union, eastern Australia, and eastern China. However, there was a limitation in the study due to the varying numbers of observation stations and analysis periods; furthermore, significant trends were not observed for all regions. Hua et al. [18] conducted a time-series analysis for each season based on temperature differences observed between urban and suburban areas of China from 1961–2000 by using the urban station data. They confirmed differences in UHI effects based on the degree of urbanization and latitude, as well as a positive correlation between the population size and UHI; however, it was not a quantitative analysis. In addition, the primary limitation of the UHI-trend analysis using station data is that it is an average over stations and not an average over the land distribution, as with temperature change due to elevation [19]. Jin et al. [20] used Moderate Resolution Imaging Spectroradiometer (MODIS) images to identify the differences in surface temperature between the urban and suburban areas of Beijing, New York, and Phoenix, but were unable to identify the UHI change trends because they performed single-year analysis instead of long-term analysis. In the study of Asian mega cities by Tran et al. [14] and in that of northwest Siberia by Miles and Esau [21], the change in UHI intensity based on the season and its correlation with related variables were verified using MODIS images. Zhou et al. [9] analyzed the difference in UHI intensity based on the area of each city using MODIS images. In the case of studies that used remotely sensed datasets, only a short-term analysis was performed because of the limitation of temporal resolution. In addition, for the three aforementioned studies [9,14,21], images from different periods were used for each city, and no trend regarding long-term change was confirmed.
In this study, global climate modeling data, which is a combination of observation and remote-sensing data, were used for comparative analysis of long-term change in UHI intensity based on city and season. Climatologies at high resolution for the Earth’s land surface areas (CHELSA) data were used as the global climate modeling data. For eight Asian mega cities (Beijing, Chongqing, Dhaka, Karachi, Manila, Mumbai, Seoul, and Tokyo), a time-series analysis of seasonal UHI intensity from 1992–2012 was performed to analyze the change in UHI intensity. In addition, a correlation analysis was performed to analyze the different correlations between urban area size and UHI intensity for each city. The main goal of this study is to provide long-term trends of UHI intensity for each city under unified conditions and to understand the different results obtained from the characteristics of each city and season.
2. Materials and Methods
2.1. Study Area
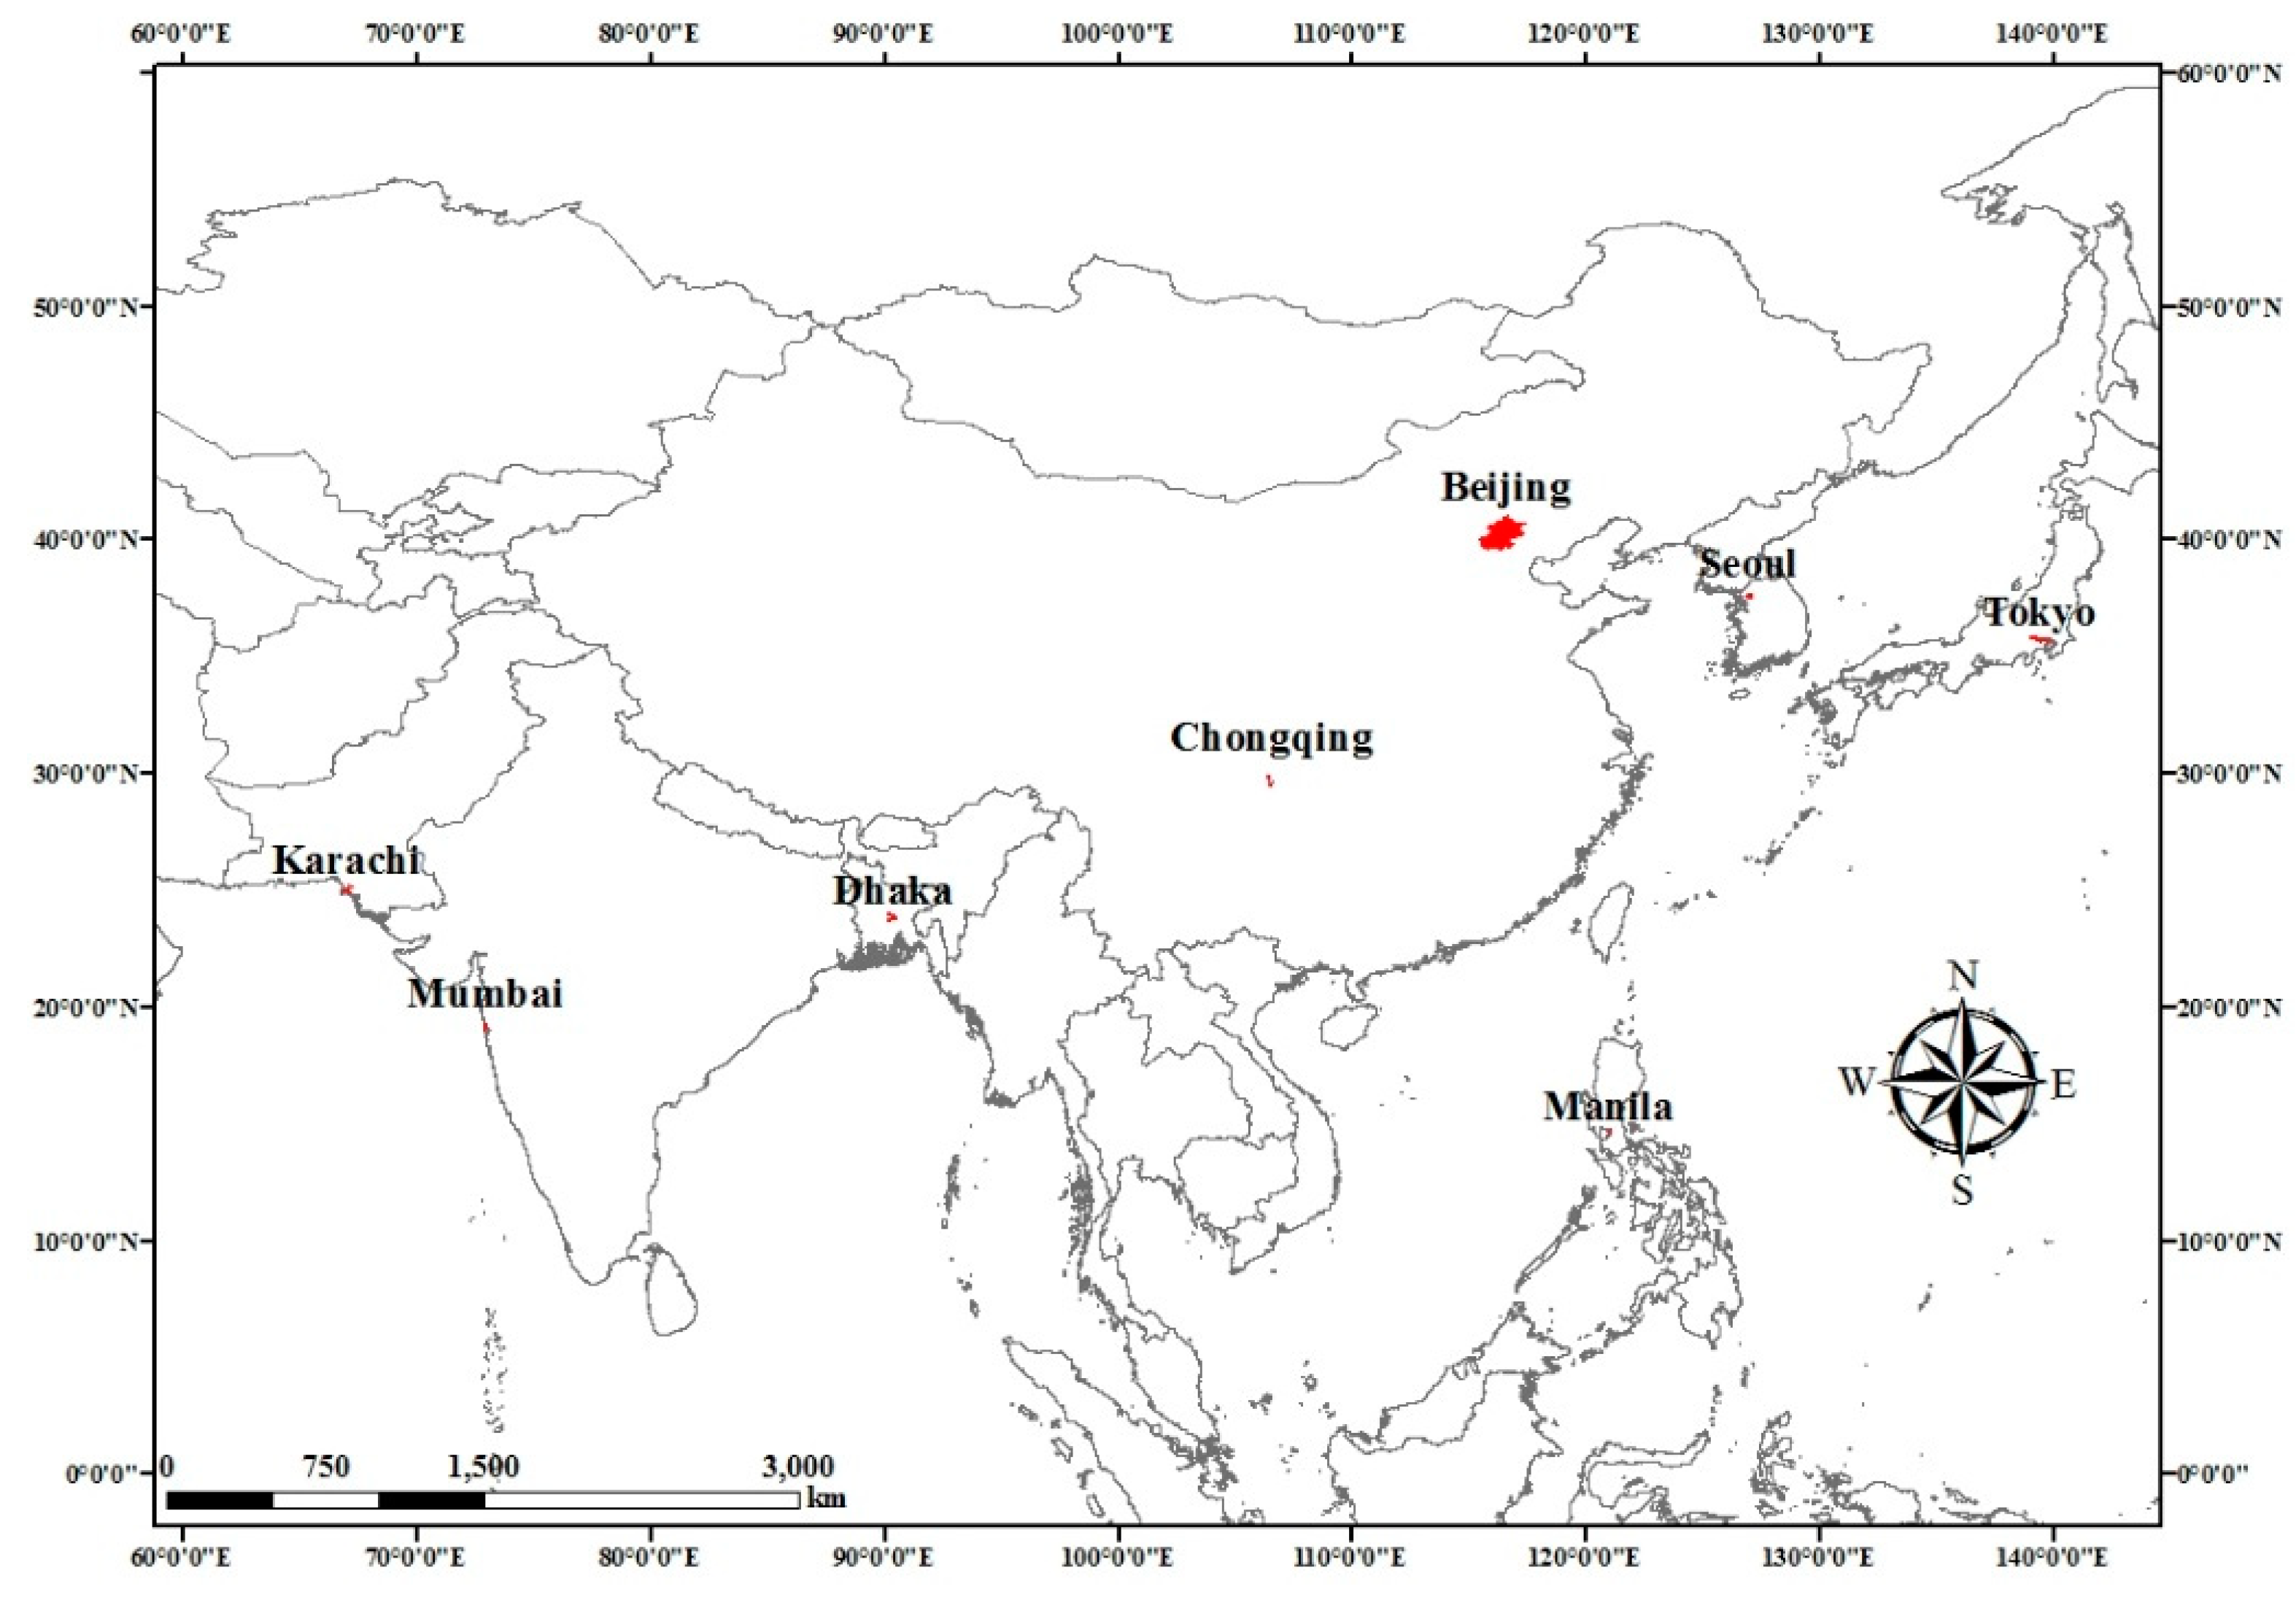
In Asia, urbanization rates increased from 17% in 1950 to 45% in 2010, mainly led by Japan, China, and Korea. In 2014, Asia’s urban population was the largest in the world, at 2.1 billion people. Developing countries are steadily urbanizing, with an average urbanization rate of approximately 2% [22]. Asian cities are growing continuously in terms of both population and physical size because of urbanization; however, due to varying characteristics of topography, population, and economic situation, changes in trends and differences in UHI intensity values based on urban area are expected to be observed. To compare and analyze the differences among eight mega cities, representative features such as geography, population, GDP at Purchasing Power Parity (PPP), and climate were examined; here, GDP growth rate refers to the projected average of real GDP growth rates between 2008 and 2025 (Figure 1) (Table 1) [23,24].
2.2. Data
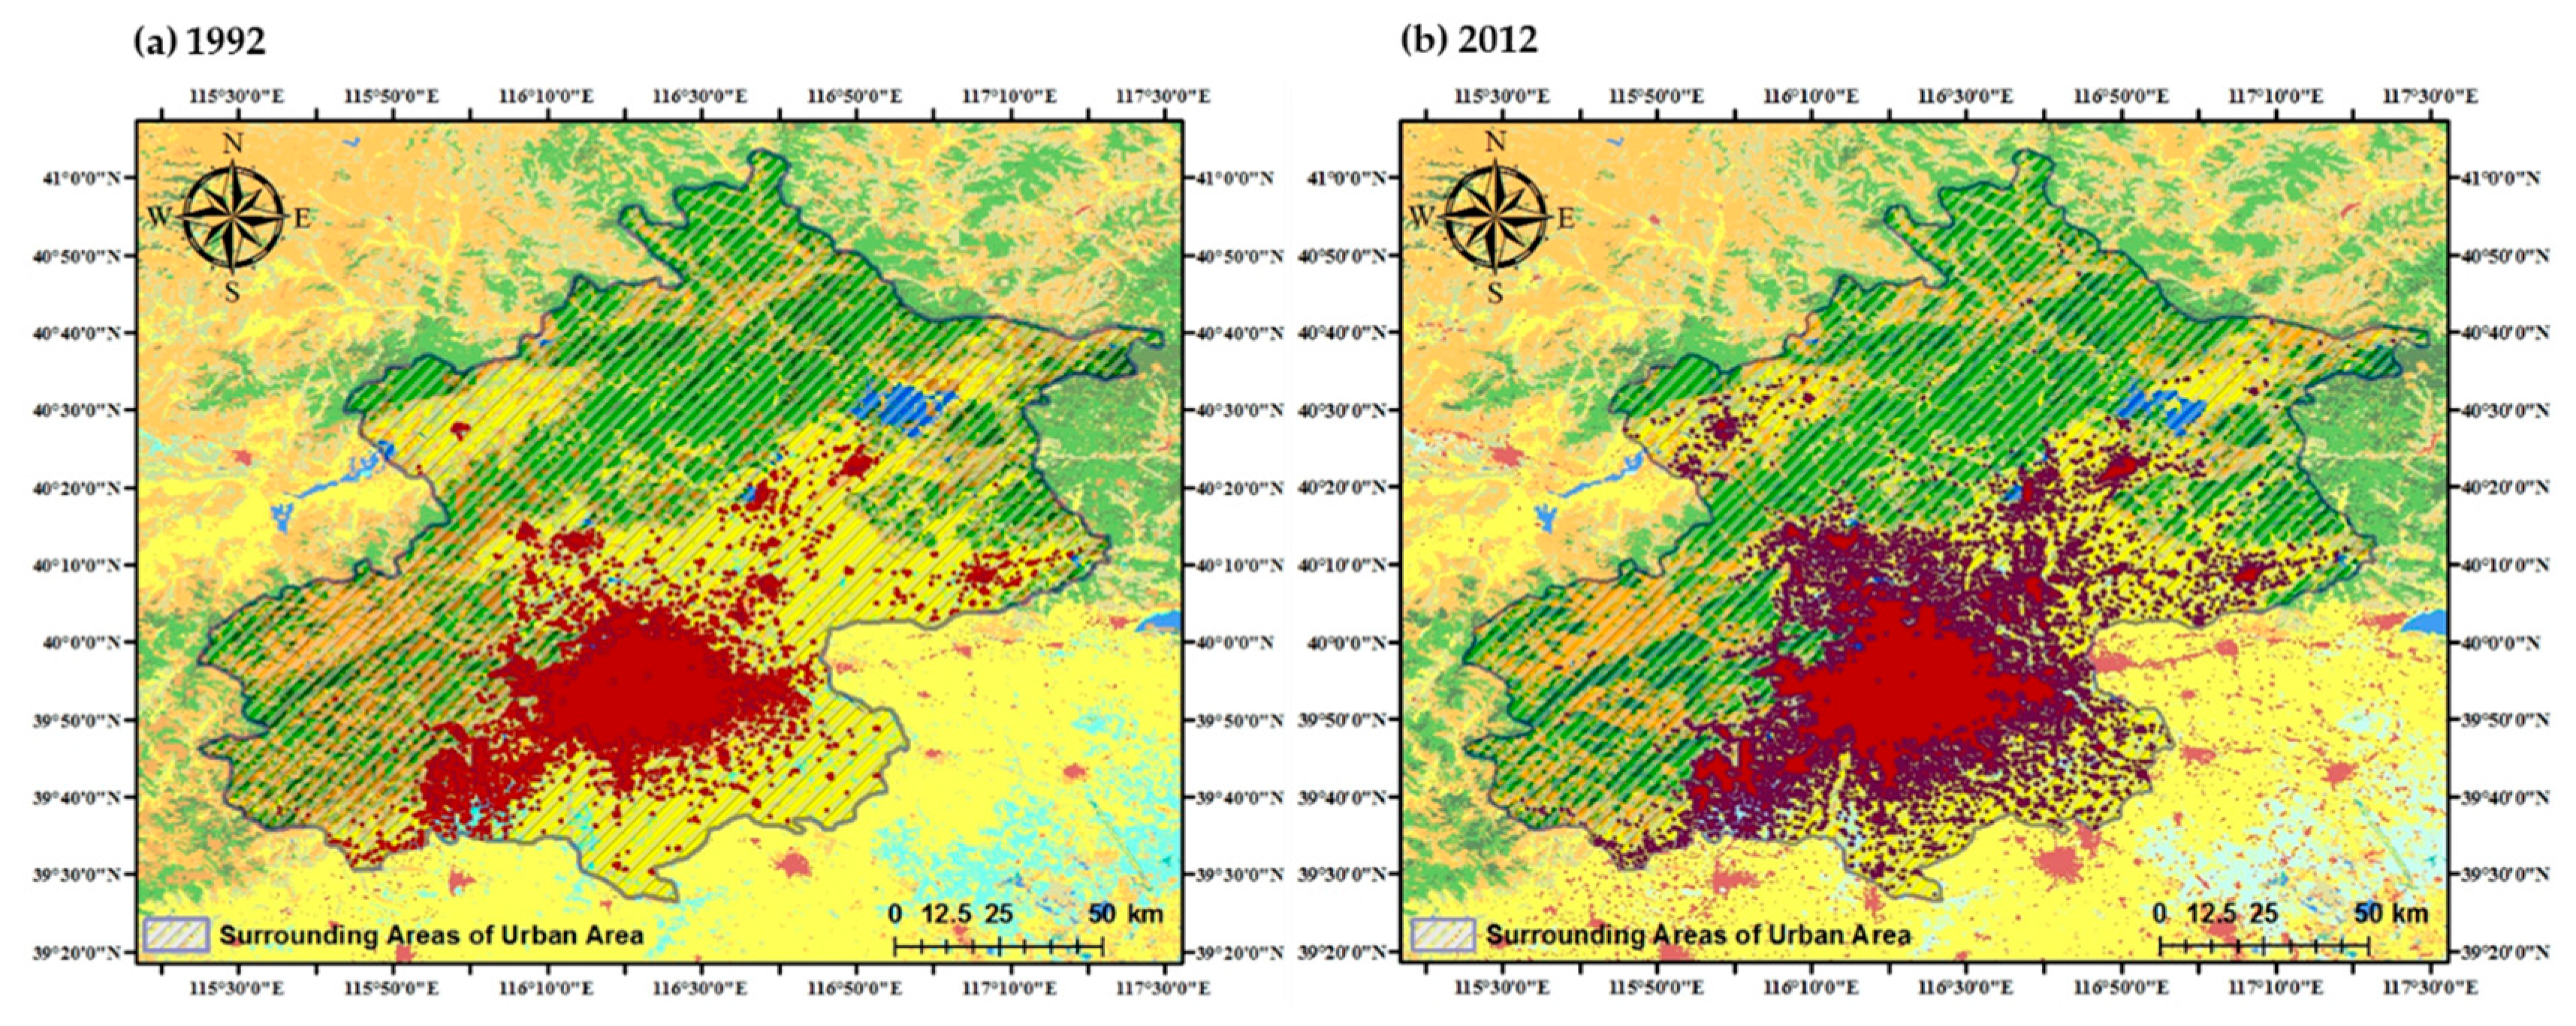
Our study uses three major data sets: (i) land-cover information, (ii) surface-air temperature, and (iii) city-boundary information. For the land-cover information, annual land cover (LC) maps from the climate change initiative (CCI) of the European Space Agency (ESA) from 1992–2012 were used to identify and compare the changes in land cover. The CCI-LC maps deliver consistent global land cover at a 300 m spatial resolution on an annual basis. This unique dataset was produced by reprocessing and interpreting different satellite missions (MEdium Resolution Imaging Spectrometer (MERIS), Advanced Very-High-Resolution Radiometer (AVHRR), Satellite Pour l’Observation de la Terre Vegetation (SPOT-VGT), etc). Thus, this set of annual maps is not produced independently, and its key aspect is its consistency over time [25]. Data created by the ESA CCI are publicly available. In this study, we used maps from 1992–2012 to evaluate the changes in urban area size. The urban area in the CCI-LC consists of global human settlement layers and the global urban footprint [25]. Table A1 provides an overview of the LC classes (see Appendix A). An example of urban growth in Beijing is provided in Figure 2.
For the surface-air temperature data, mean temperature time-series data from CHELSA for 1992–2012 were used. CHELSA data are downscaled model output temperatures, having a high resolution of 30 arc sec (~1 km). For downscaling and assimilating mean monthly temperatures, the monthly means of daily mean temperatures derived from six-hourly synoptic data of ERA-Interim reanalysis were used. The ERA-Interim reanalysis combines the modeling results with ground and radiosonde observations as well as remote-sensing data provided by institutions, such as National Oceanic and Atmospheric Administration/ National Environmental Satellite, Data, and Information Service (NOAA/NESDIS) and the Japan Meteorological Agency, which use a data-assimilation system [26,27]. In addition, the CHELSA temperature data reflect the temperature differences due to elevation that may affect the UHI intensity. The CHELSA temperature data were validated by using several independent station datasets, such as the Global Historical Climatology Network, and were applied to species-distribution modeling to compare with the most commonly used climate dataset for this purpose, which is WorldClim. The validation results showed that CHELSA can predict the spatial patterns of temperature distributions well and can accurately predict the observed values of temperature on a small scale. Further, CHELSA could be a substantial improvement over existing products that are currently being employed for ecological studies [26]. Therefore, CHELSA data are considered to be suitable for analyzing the UHI intensity of each city.
For the boundary information of cities, we used the database of global administrative areas (GADM) data. GADM is a database of the location of the world’s administrative areas (boundaries). Administrative areas in this database are countries and lower-level subdivisions, such as provinces and departments. GADM describes the location of administrative areas, and for each area it provides certain attributes, the foremost being the name, and in some cases, variant names (see https://gadm.org/data.html).
2.3. Method
The UHI effect arises from the anthropogenic modification of natural landscapes in the urban boundary layer [5]. Therefore, as the urban area increases, the UHI intensity also increases. To reflect this trend, we defined the UHI intensity of each city as the difference between the average temperatures of an urban area and those of its surrounding areas within the city boundary [28]. The equation to derive UHI intensity is as follows:
where, Tu and Ts are mean temperatures of the urban area and the surrounding areas of the urban area, respectively (See Equation (1)). We have excluded the water bodies while calculating UHI intensity because they can influence the temperature significantly [21].
UHI Intensity (°C) = Tu − Ts,
For calculating the seasonal average temperature, spring was defined as March–May, summer as June–August, autumn as September–November, and winter as December–February [18,29]. The equation that is used to derive the seasonal average temperature (°C) using CHELSA data is as follows:
where, T1, T2, and T3 indicate the mean temperatures each month belonging to each season in unit of absolute temperature (K) multiplied by 10 [30].
Taverage (°C) = (T1 + T2 + T3)/30 − 273,
After extracting the urban-area and surrounding-area shapes for the period of 21 years (1992–2012) for each city, the average temperature was calculated for each year and season to derive the UHI intensity. By using the derived UHI intensity, a time-series analysis for the 21-year-period was performed, and the change in UHI intensity was identified using the observed trend. Further, a Pearson correlation analysis was performed between the yearly values of UHI intensity and urban area size to confirm the quantitative correlation. To calculate the urban area size, the universal transverse Mercator zone was identified for each megacity to transform the city into a coordinate system. Through the Pearson correlation analysis, a significant correlation could be established if the p-value was less than 0.05.
In addition, the difference in the UHI intensity values and the change trend of each city were confirmed [31]. The changing pattern of UHI intensities can vary depending on spatial characteristics, such as the density of the built environment and the vegetation ratio in urban areas. These characteristics can be different for each city. In addition, UHI intensities are affected by temporal characteristics, such as wind speed and cloud cover; because of cloud cover, UHI intensities tend to be higher during the warmer summer months and lower during the colder winter months [32]. Therefore, the trend of UHI intensity change is different for each city and season in this study. All GIS and remote-sensing data were processed using the ArcGIS 10.3 software; correlation analysis was performed using the SPSS24 program, and time-series analysis was performed using the Excel program.
3. Results
3.1. Correlation Analysis
Significant positive correlations were observed in all cities with an urban area size of over 300 km2 in 2010 and with a GDP of over $100 bn at PPPs in 2008, except for Chongqing. Seasonally, the most significant positive correlation was observed in summer, and the least significant one was observed in winter.
Beijing, despite these characteristics, did not show any correlation between the UHI intensity and urban area size in summer; however, it was the only city that showed a significant positive correlation in winter. These results, like those of previous studies, appear to be related to Beijing’s climatic and geophysical characteristics [33]. Winter in Beijing is drier than summer; during the dry season, the UHI effect could be at its peak, producing high temperatures in urban areas [34]. In a high-latitude city, the UHI intensity is likely to be higher in winter than in summer because of the reduced solar heating, which reduces the vertical turbulent transport and boundary-layer depth [35]. In addition, the anthropogenically generated heat in winter could be one of the factors. The combined effect of these factors appears to form the pattern of Beijing’s UHI phenomenon.
In the cases of Dhaka and Karachi, no correlation between the seasonal UHI intensity and urban area size was observed. According to Spence et al. [36], urbanization is related to a city’s growth in terms of per-capita income as well as urban-based industries and services. In developed countries, urbanization rates and growth are related. Furthermore, per-capita income increased much more rapidly when the urbanization rate reached close to 60%. However, even after productive industrialization, urbanization has not been observed in developing countries such as Bangladesh. As a result, cities experiencing relatively lower economic achievement fail to structurally shift from rural activities to urban-based industries; this could possibly be the reason for a non-linear change in UHI intensity with urban area size.
Despite the relatively low GDP in 2008, Chongqing, similar to Dhaka and Karachi, showed a significant and strong correlation for the spring and summer UHI intensities. One of the factors could be the basin topography of Chongqing. Basin topography can produce an ascending thermal airflow on basin city enveloped by foul air to lead hot air sinking along with the mountain in the basin edge barrier, which can affect the UHI intensity rise when compared with other cities [37]. In addition, Chongqing is the largest central-government-controlled municipality in China and is currently undergoing rapid urbanization. It attracted considerably greater foreign investment during the reform era of China and the rate of urban industrialization and urbanization has increased significantly Comparing to the past. [38,39].
In Manila and Mumbai, the correlation between summer UHI intensity and urban area size was found to be significant and strong, and the autumn UHI intensity was found to be moderately significant. In the case of Manila, a previous study reported that urbanization affected the tendency of sensible heat flux and summer rainfall, and this phenomenon could influence the UHI intensity of the relatively warm season [40]. As Mumbai is also one of the largest metropolises of South Asia, modification of the land surface caused by urban development was observed [41]. According to the existing literature, the UHI of Mumbai appeared to be stronger than that of Delhi, which is a similar metropolitan city. This was owing to Mumbai’s coastal environment with low tree cover and the dense horizontal and vertical growth of buildings [42].
In the cases of both Seoul and Tokyo, a significant and strong correlation was observed for summer UHI intensity. In addition, for Tokyo, a significant correlation was observed for spring and autumn UHI intensity. As developed megacities of East Asia, several previous studies identified the UHI phenomenon in Seoul and Tokyo [14,43,44]. Specifically, in Tokyo, widespread urban warming, known as the extended heat island, appeared in summer because of enhanced surface heating over a large urban area and reduced sea-breeze penetration caused by the increased surface convergence (Table 2) [45].
3.2. Time-Series Analysis of UHI Intensity
From the results of the time-series analysis, an increasing trend was observed for UHI intensity during summer. The increase rates of summer UHI intensity for Manila and Mumbai were 0.015 °C/decade and 0.036 °C/decade, respectively. In the cases of Seoul and Tokyo, the increase rates were approximately 0.02 °C/decade and 0.085 °C/decade, respectively. Further, in the cases of the other seasons, the significantly increasing trends were different for different cities; this result is similar to that of the correlation analysis. Moreover, in the case of Beijing, the highest increasing rate was observed for winter UHI intensity, which is 0.18 °C/decade.
In the case of Chongqing, the results were similar to those of a previous study. The UHI intensity increase rate was approximately 0.07 °C/decade in summer and spring, and approximately 0.05 °C/decade in autumn. A previous study also reported an increase rate of 0.10 °C/decade for the annual mean temperature during 1951–2010 in Chongqing [39]. However, further research is needed in this regard.
In the case of Dhaka and Karachi, the determination coefficient was lower than 0.1 for all seasons, demonstrating an insignificant change in trend. Especially for Dhaka, there was a small difference in temperature between the urban area and its surrounding areas in spring and autumn; however, in summer, the urban heat sink phenomenon was prominent in both cities. This phenomenon results in a cooler urban area when compared with its surrounding areas. This is attributed to urban morphological factors or seasonal surface characteristics, and existing studies have confirmed that this phenomenon occurs in urban areas whose surrounding areas are desert or agricultural land; moreover, this phenomenon is especially prominent in summer [46,47]. As of 2012, approximately 38.2% of the surrounding areas of Karachi were found to be cropland and bare areas. In the case of Dhaka, this value was 96.4%. These results may have been due to the characteristics of the city or to limitations in data, such as in the resolution; therefore, further research is needed in this regard.
The UHI intensity increase rates and values obtained in this study may be different from those obtained in previous studies because of the differences in time period and spatial scale. However, the results obtained in this study are for entire cities and may be different from the UHI intensity values of smaller administrative units in a given city [44].
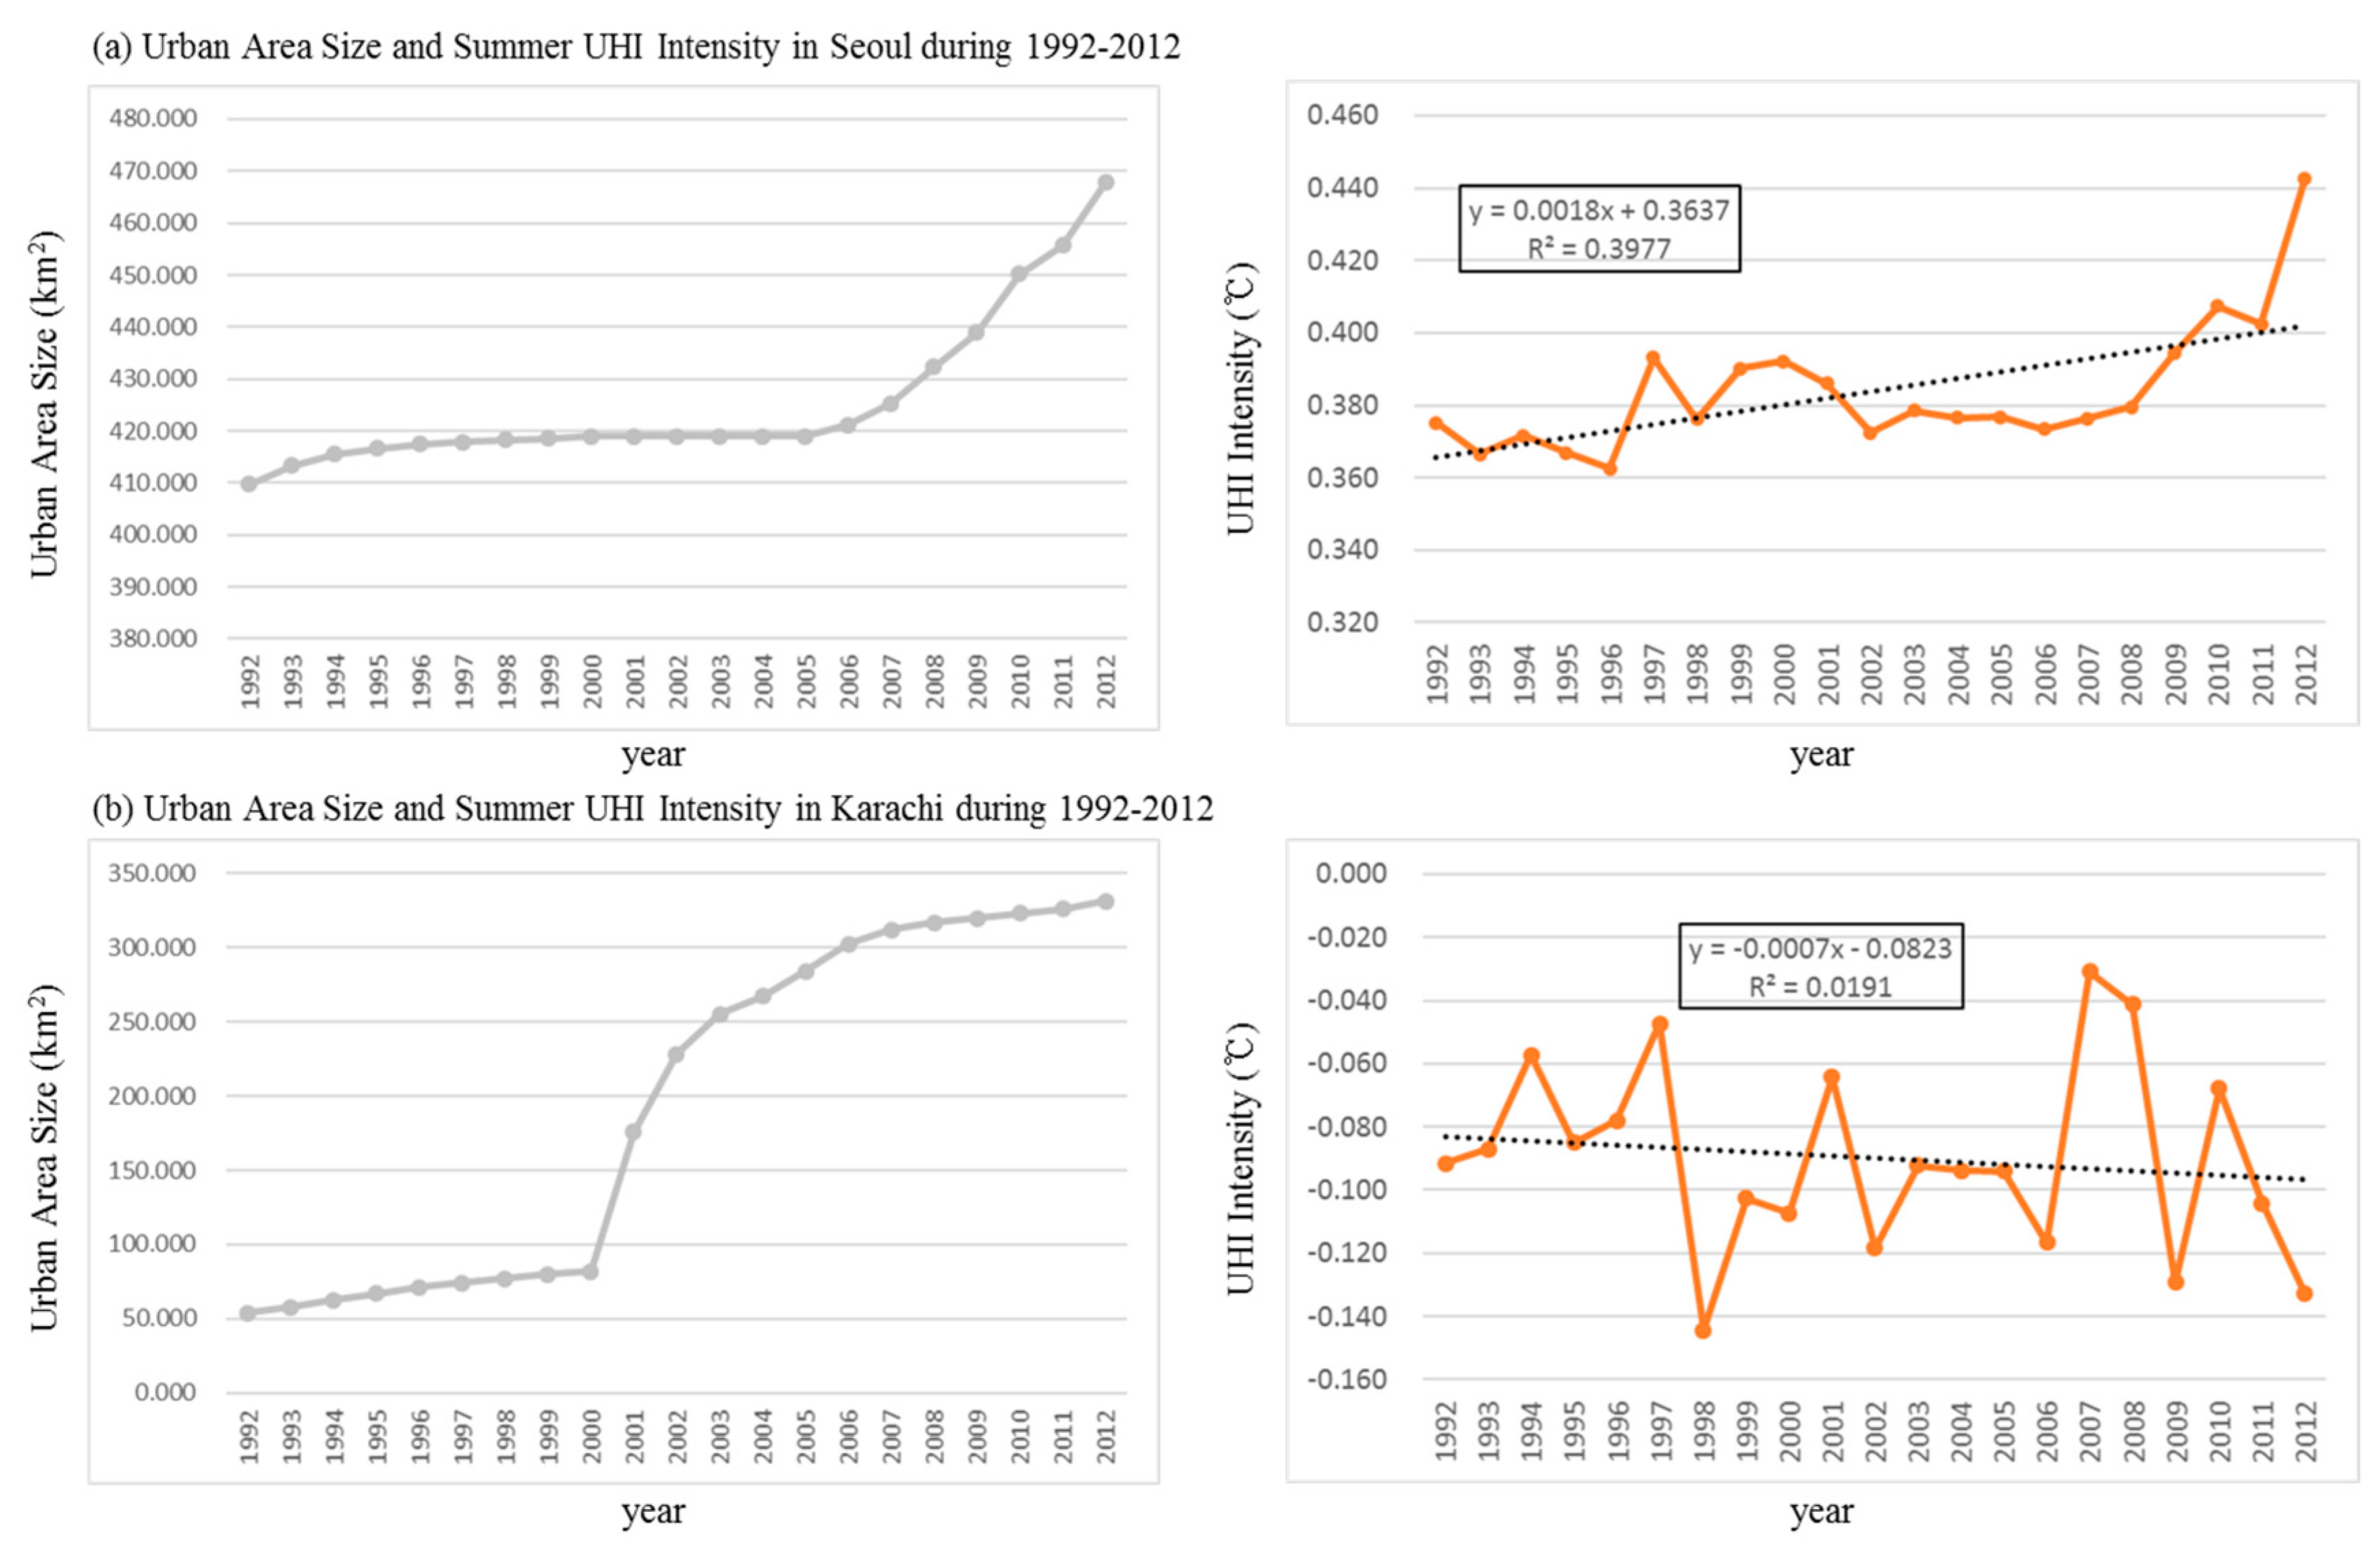
When the average UHI intensity with respect to an intercept value was considered for each city, the UHI intensity was found to be higher than 2 °C for all seasons in Beijing and Tokyo, and lower than 0.5 °C in all the other cities. The urban-area sizes of both these cities are more than 1000 km2 and are considerably higher than those of other cities. This result also indicates that the UHI intensity and urban-area size have a significant correlation. The examples of summer UHI intensity changes for 1992–2012 are depicted in Figure 3. In Seoul, UHI intensity change is similar to the growth of urban areas, but in the case of Karachi, there is a lot of fluctuation and no obvious tendency. Moreover, there is the appearance of urban heat sink (Table 3).
4. Conclusions
We attempted to obtain UHI intensity change trends based on urban-area size for eight Asian mega cities in different seasons using global climate modeling data. Our analysis suggests that there is a difference in the correlation between the urban-area size and UHI intensity, based on the characteristics of each city and season. In addition, the UHI intensity varies depending on the urban-area size and economic situation; these can affect the UHI intensity only when a certain level is attained. Unlike urban-based industrialization, urbanization caused only by an increase in urban area does not have a significant impact on UHI intensity and city growth; thus, a simultaneous increase in built-up density is necessary. The geography and climate can affect UHI intensity as in the case of Beijing and Chongqing. In addition, population can affect UHI intensity by generating anthropogenic heat; however, its effect as a single factor appears to be insignificant. Seasonally, most of the cities exhibit a significant correlation in summer, with the least significant correlation in winter. Further, the rates of UHI intensity increase appear to be the highest during summer, and the rates during other seasons differ based on the city. If a city does not have a sufficient built-up area density, the urban heat sink phenomenon may occur depending on the season. Seasonal changes in UHI intensity were found to be either the same or different, compared with previous studies; therefore, further research is needed in this regard.
A comparative study of the long-term UHI phenomenon is not simple because of the complexities regarding acquisition and inconsistency of data. This study, thus, is meaningful because UHI intensities were compared and analyzed for multiple cities and seasons using unified and available data and methods. CHELSA temperature data seem to be able to capture the average increase in temperature as urban areas increase. However, there may be limitations, such as microscopic differences due to the resolution of the data and the use of the average temperatures of three months. Therefore, further studies on urbanization factors and levels influencing the UHI intensity using higher resolution materials and methods will be needed.
Author Contributions
This paper represents a result of collaborative teamwork. Conceptualization, K.L.; data curation, Y.K. and H.C.S.; formal analysis, K.L.; investigation, K.I. and Y.K.; methodology, K.L.; visualization, K.L. and Y.K.; writing—original draft, K.L.; writing—review and editing, K.L., Y.K., H.C.S., and J.R.; project administration, supervision, and funding acquisition, S.W.J. All authors have read and agreed to the published version of the manuscript.
Funding
This research was supported by the Korea Environment Industry and Technology Institute (KEITI) grant (No. 2018000210006), funded by the Ministry of the Environment (MOE).
Conflicts of Interest
The authors declare no conflict of interest.
Appendix A

Table A1.
Legend of the global climate change initiative-land cover (CCI-LC) maps.
| Value | Label | Color |
|---|---|---|
| 10 | Cropland, rain-fed | |
| 20 | Cropland, irrigated or post-flooding | |
| 30 | Mosaic cropland ( >50%)/natural vegetation (tree, shrub, or herbaceous cover) | |
| 40 | Mosaic natural vegetation (tree, shrub, or herbaceous cover) ( >50%)/cropland (<50%) | |
| 50 | Tree cover, broadleaved, evergreen, closed to open ( >15%) | |
| 60 | Tree cover, broadleaved, deciduous, closed to open ( >15%) | |
| 70 | Tree cover, needle leaved, evergreen, closed to open ( >15%) | |
| 80 | Tree cover, needle leaved, deciduous, closed to open ( >15%) | |
| 90 | Tree cover, mixed leaf type (broadleaved and needle leaved) | |
| 100 | Mosaic tree and shrub ( >50%)/herbaceous cover ( <50%) | |
| 110 | Mosaic herbaceous cover ( >50%)/tree and shrub ( <50%) | |
| 120 | Shrubland | |
| 130 | Grassland | |
| 140 | Lichens and mosses | |
| 150 | Sparse vegetation (tree, shrub, or herbaceous cover) ( <15%) | |
| 160 | Tree cover, flooded, fresh or brackish water | |
| 170 | Tree cover, flooded saline water | |
| 180 | Shrub or herbaceous cover, flooded, fresh/saline/brackish water | |
| 190 | Urban areas | |
| 200 | Bare areas | |
| 210 | Water bodies | |
| 220 | Permanent snow and ice |
References
- Douglas, I. The city as an ecosystem. Prog. Phys. Geogr. 1981, 5, 315–367. [Google Scholar] [CrossRef]
- Oke, T.R. The energetic basis of the urban heat island. Q. J. Royal Meteorol. Soc. 1982, 108, 1–24. [Google Scholar] [CrossRef]
- Fujibe, F. Detection of urban warming in recent temperature trends in Japan. Int. J. Climatol. 2009, 29, 1811–1822. [Google Scholar] [CrossRef]
- Santamouris, M. Using cool pavements as a mitigation strategy to fight urban heat island - a review of the actual developments. Renew. Sust. Energ. Rev. 2013, 26, 224–240. [Google Scholar] [CrossRef]
- Oke, T.R. Boundary Layer Climates, 2nd ed.; Methuen: London, UK, 1987. [Google Scholar]
- Grimmond, S. Urbanization and global environmental change: Local effects of urban warming. Geogr. J. 2007, 173, 83–88. [Google Scholar] [CrossRef]
- Arnfield, A.J. Two decades of urban climate research: A review of turbulence, exchanges of energy and water, and the urban heat island. Int. J. Climatol. 2003, 23, 1–26. [Google Scholar] [CrossRef]
- Oke, T.R. City size and the urban heat island. Atmos. Environ. 1973, 7, 769–779. [Google Scholar] [CrossRef]
- Zhou, B.; Rybski, D.; Kropp, J.P. The role of city size and urban form in the surface urban heat island. Sci. Rep. 2017, 7, 4791. [Google Scholar] [CrossRef] [PubMed]
- Dienst, M.; Lindén, J.; Saladié, Ò.; Esper, J. Detection and elimination of UHI effects in long temperature records from villages–A case study from Tivissa, Spain. Urban Clim. 2019, 27, 372–383. [Google Scholar] [CrossRef]
- Hamdi, R. Estimating urban heat island effects on the temperature series of Uccle (Brussels, Belgium) using remote sensing data and a land surface scheme. Remote Sens. 2010, 2, 2773–2784. [Google Scholar] [CrossRef] [Green Version]
- Zhou, L.; Dickinson, R.E.; Tian, Y.; Fang, J.; Li, Q.; Kaufmann, R.K.; Tucker, C.J.; Myneni, R.B. Evidence for a significant urbanization effect on climate in China. Proc. Natl. Acad. Sci. USA 2004, 101, 9540–9544. [Google Scholar] [CrossRef] [PubMed] [Green Version]
- Jones, P.D.; Groisman, P.Y.; Coughlan, M.; Plummer, N.; Wang, W.C.; Karl, T.R. Assessment of urbanization effects in time series of surface air temperature over land. Nature 1990, 347, 169–172. [Google Scholar] [CrossRef]
- Tran, H.; Uchihama, D.; Ochi, S.; Yasuoka, Y. Assessment with satellite data of the urban heat island effects in Asian mega cities. Int. J. Appl. Earth Obs. Geoinf. 2006, 8, 34–48. [Google Scholar] [CrossRef]
- Wang, F.; Ge, Q. Estimation of urbanization bias in observed surface temperature change in China from 1980 to 2009 using satellite land-use data. Chin. Sci. Bull. 2012, 57, 1708–1715. [Google Scholar] [CrossRef] [Green Version]
- Yang, X.; Hou, Y.; Chen, B. Observed surface warming induced by urbanization in east China. J. Geophys. Res. Atmos. 2011, 116, 1–12. [Google Scholar] [CrossRef]
- Karl, T.R.; Diaz, H.F.; Kukla, G. Urbanization: Its detection and effect in the United States climate record. J. Clim. 1988, 1, 1099–1123. [Google Scholar] [CrossRef] [Green Version]
- Hua, L.J.; Ma, Z.G.; Guo, W.D. The impact of urbanization on air temperature across China. Theor. Appl. Climatol. 2008, 93, 179–194. [Google Scholar] [CrossRef]
- Wickham, C.; Rohde, R.; Muller, R.A.; Wurtele, J.; Curry, J.; Groom, D.; Jacobsen, R.; Perlmutter, S.; Rosenfeld, A.; Mosher, S. Influence of urban heating on the global temperature land average using rural sites identified from MODIS classifications. Geoinform. Geostat. Overv. 2013, 1, 1895–2007. [Google Scholar]
- Jin, M.; Dickinson, R.E.; Zhang, D.A. The footprint of urban areas on global climate as characterized by MODIS. J. Clim. 2005, 18, 1551–1565. [Google Scholar] [CrossRef]
- Miles, V.; Esau, I. Seasonal and spatial characteristics of urban heat islands (UHIs) in northern West Siberian cities. Remote Sens. 2017, 9, 989. [Google Scholar] [CrossRef] [Green Version]
- Song, M.K. World urbanization key issues and growth prospects in emerging cities. World Cities 2014, 7, 46–55. (In Korean) [Google Scholar]
- Habitat, U.N.; ESCAP, U. The State of Asian and Pacific Cities 2015: Urban transformations Shifting from quantity to quality; UN Habitat: London, UK, 2015. [Google Scholar]
- Hawksworth, J.; Hoehn, T.; Tiwari, A. Which are the largest city economies in the world and how might this change by 2025. PriceWaterhouseCoopers UK Economic Outlook. 2009, 20–34. [Google Scholar]
- Arino, O.; Ramoino, F. Land Cover CCI Product User Guide Version 2.0; UCL-Geomatics: London, UK, 2017. [Google Scholar]
- Karger, D.N.; Conrad, O.; Böhner, J.; Kawohl, T.; Kreft, H.; Soria-Auza, R.W.; Zimmermann, N.E.; Linder, H.P.; Kessler, M. Climatologies at high resolution for the earth’s land surface areas. Sci. Data 2017, 4, 170122. [Google Scholar] [CrossRef] [PubMed] [Green Version]
- Uppala, S.M.; Kållberg, P.W.; Simmons, A.J.; Andrae, U.; Bechtold, V.D.C.; Fiorino, M.; Gibson, J.K.; Haseler, J.; Hernandez, A.; Kelly, G.A.; et al. The ERA-40 re-analysis. Q. J. Ryoal. Meteorol. Soc. 2005, 131, 2961–3012. [Google Scholar] [CrossRef]
- Zhou, B.; Rybski, D.; Kropp, J.P. On the statistics of urban heat island intensity. Geophys. Res. Lett. 2013, 40, 5486–5491. [Google Scholar] [CrossRef]
- McKinnon, K.A.; Rhines, A.; Tingley, M.P.; Huybers, P. The changing shape of Northern Hemisphere summer temperature distributions. J. Geophys. Res. Atmos. 2016, 121, 8849–8868. [Google Scholar] [CrossRef]
- Karger, D.N.; Zimmermann, N.E. Climatologies at High Resolution for the Earth Land Surface Areas CHELSA V1. 2: Technical Specification; Springer Nature: London, UK, 2019. [Google Scholar]
- Gogtay, N.J.; Thatte, U.M. Principles of correlation analysis. J. Assoc. Physicians India 2017, 65, 78–81. [Google Scholar]
- Schatz, J.; Kucharik, C.J. Seasonality of the urban heat island effect in Madison, Wisconsin. J. Appl. Meteorol. Climatol 2014, 53, 2371–2386. [Google Scholar] [CrossRef]
- Liu, W.; Ji, C.; Zhong, J.; Jiang, X.; Zheng, Z. Temporal characteristics of the Beijing urban heat island. Theor. Appl. Climatol. 2007, 87, 213–221. [Google Scholar] [CrossRef]
- Jauregui, E.; Godinez, L.; Cruz, F. Aspects of heat-island development in Guadalajara, Mexico. Atmos. Environ. 1992, 26, 391–396. [Google Scholar] [CrossRef]
- Hinkel, K.M.; Nelson, F.E.; Klene, A.E.; Bell, J.H. The urban heat island in winter at Barrow, Alaska. Int. J. Climatol. 2003, 23, 1889–1905. [Google Scholar] [CrossRef] [Green Version]
- Spence, M.; Annez, P.C.; Buckley, R.M. Urbanization and Growth; World Bank Publications: Washington, DC, USA, 2008; pp. 1–45. [Google Scholar]
- Chang, H.T. A temporal and spatial analysis of urban heat island in basin city utilizing remote sensing techniques. Int. Arch. Photogramm. Remot. Sens. Spat. Inf. Sci. 2016, 41. [Google Scholar] [CrossRef] [Green Version]
- Sigurdson, J.; Palonka, K. Innovative city in west China Chongqing; European Institute of Japanese Studies Working Paper 239; Stockholm School of Economics: Stockholm, Sweden, 2008. [Google Scholar]
- Yao, R.; Luo, Q.; Luo, Z.; Jiang, L.; Yang, Y. An integrated study of urban microclimates in Chongqing, China: Historical weather data, transverse measurement and numerical simulation. Sustain. Cities Soc. 2015, 14, 187–199. [Google Scholar] [CrossRef] [Green Version]
- Oliveros, J.M.; Vallar, E.A.; Galvez, M.C.D. Investigating the effect of urbanization on weather using the weather research and forecasting (WRF) model: A case of Metro Manila, Philippines. Environments 2019, 6, 10. [Google Scholar] [CrossRef] [Green Version]
- Srivastava, A.K.; Voogt, J.; Kshirsagar, S.R.; Srivastava, K. Heat islands over Mumbai as revealed by autorecorded thermograph data. J. Earth Syst. Sci. 2016, 125, 85–93. [Google Scholar] [CrossRef] [Green Version]
- Grover, A.; Singh, R. Analysis of urban heat island (UHI) in relation to normalized difference vegetation index (NDVI): A comparative study of Delhi and Mumbai. Environments 2015, 2, 125–138. [Google Scholar] [CrossRef] [Green Version]
- Choi, Y.Y.; Suh, M.S.; Park, K.H. Assessment of surface urban heat islands over three megacities in East Asia using land surface temperature data retrieved from COMS. Remote Sens. 2014, 6, 5852–5867. [Google Scholar] [CrossRef] [Green Version]
- Lee, K.I.; Ryu, J.E.; Jeon, S.W.; Jung, H.C.; Kang, J.Y. Analysis of the effect of heat island on the administrative district unit in Seoul using LANDSAT image. Korean J. Remote Sens. 2017, 33, 821–834, (In Korean with English abstract). [Google Scholar]
- Fujibe, F. Urban warming in Japanese cities and its relation to climate change monitoring. Int. J. Climatol. 2011, 31, 162–173. [Google Scholar] [CrossRef]
- Carnahan, W.H.; Larson, R.C. An analysis of an urban heat sink. Remote Sens. Environ. 1990, 33, 65–71. [Google Scholar] [CrossRef]
- Fan, C.; Myint, S.; Kaplan, S.; Middel, A.; Zheng, B.; Rahman, A.; Huang, H.P.; Brazel, A.; Blumberg, D. Understanding the impact of urbanization on surface urban heat islands—A longitudinal analysis of the oasis effect in subtropical desert cities. Remote Sens. 2017, 9, 672. [Google Scholar] [CrossRef] [Green Version]
Figure 1.
Study area, Asian mega cities.

Figure 2.
Example of land cover pattern for Beijing: (a) pattern in 1992; (b) pattern in 2012.

Figure 3.
Example of annual summer UHI intensity changes according to urban area growth during 1992–2012: (a) Seoul; (b) Karachi.
Figure 3.
Example of annual summer UHI intensity changes according to urban area growth during 1992–2012: (a) Seoul; (b) Karachi.

Table 1.
Information for each city.
| City | Major Geography of City (latitude) | Population in 2010 (thousands) | Urban Area Size in 2010 (km2) | GDP in 2008 ($bn at PPPs) | GDP Growth Rate (% pa: 2008–25) | Köppen Climate |
|---|---|---|---|---|---|---|
| Beijing | Inland, plain (39°54’27”N) | 16,190 | 2992.901 | 166 | 1.8 | Humid continental |
| Chongqing | Mountainous, basin (29°33’46.01”N) | 11,244 | 311.159 | 57 | 5.6 | Humid subtropical |
| Dhaka | Near delta, plain (23°42’37.44”N) | 14,731 | 214.734 | 78 | 6.5 | Tropical savanna |
| Karachi | Coastal area (24°54’20.16”N) | 14,081 | 322.828 | 78 | 4.1 | Arid |
| Manila | Coastal area (14°36’15.12”N) | 11,891 | 506.099 | 149 | 1.8 | Tropical savanna |
| Mumbai | Coastal area (19°4’22.19”N) | 19,422 | 405.075 | 209 | 6.3 | Tropical |
| Seoul | Inland, basin (37°33’57.6”N) | 9796 | 450.164 | 291 | 2.3 | Humid subtropical |
| Tokyo | Coastal area (35°41’22.2”N) | 36,834 | 1084.786 | 1479 | 1.7 | Humid subtropical |
Table 2.
Results of correlation analysis between urban area size and urban heat island (UHI) intensity for each city and season during 1992–2012.
Table 2.
Results of correlation analysis between urban area size and urban heat island (UHI) intensity for each city and season during 1992–2012.
| City | Spring | Summer | Autumn | Winter | ||||
|---|---|---|---|---|---|---|---|---|
| R | p-Value | R | p-Value | R | p-Value | R | p-Value | |
| Beijing | 0.298 | 0.189 | 0.261 | 0.254 | 0.127 | 0.585 | 0.645 ** | 0.002 |
| Chongqing | 0.873 ** | 0.000 | 0.862 ** | 0.000 | 0.545* | 0.011 | 0.140 | 0.546 |
| Dhaka | −0.058 | 0.804 | −0.024 | 0.918 | 0.196 | 0.395 | −0.173 | 0.453 |
| Karachi | 0.120 | 0.604 | −0.056 | 0.810 | −0.274 | 0.230 | 0.025 | 0.913 |
| Manila | 0.395 | 0.076 | 0.937 ** | 0.000 | 0.468 * | 0.033 | 0.414 | 0.062 |
| Mumbai | 0.244 | 0.287 | 0.930 ** | 0.000 | 0.523 * | 0.015 | 0.222 | 0.333 |
| Seoul | −0.073 | 0.755 | 0.854 ** | 0.000 | 0.279 | 0.220 | 0.304 | 0.180 |
| Tokyo | 0.468 * | 0.033 | 0.627 ** | 0.002 | 0.477 * | 0.029 | 0.188 | 0.414 |
Note: * p < 0.05, ** p < 0.01.
Table 3.
Results of time-series analysis of UHI intensity for each city and season during 1992–2012.
Table 3.
Results of time-series analysis of UHI intensity for each city and season during 1992–2012.
| City | Spring | Summer | Autumn | Winter | ||||
|---|---|---|---|---|---|---|---|---|
| Function (y) | R2 | Function (y) | R2 | Function (y) | R2 | Function (y) | R2 | |
| Beijing | 0.0076x + 2.4156 | 0.098 | 0.0039x + 2.2554 | 0.069 | 0.0023x + 2.3311 | 0.019 | 0.0183x + 2.0819 | 0.373 |
| Chongqing | 0.0068x + 0.4622 | 0.673 | 0.0066x + 0.4669 | 0.614 | 0.0046x + 0.4844 | 0.278 | 0.0016x + 0.4214 | 0.042 |
| Dhaka | 0.0003x − 0.0032 | 0.002 | –8E-05x − 0.0592 | 0.002 | 0.0005x + 0.0011 | 0.006 | –0.0061x + 0.1532 | 0.056 |
| Karachi | 0.0024x − 0.1233 | 0.007 | –0.0007x − 0.0823 | 0.019 | –0.0039x + 0.0638 | 0.051 | 0.001x + 0.0739 | 0.002 |
| Manila | 0.0056x + 0.0447 | 0.195 | 0.0015x + 0.0702 | 0.803 | 0.0061x + 0.0216 | 0.159 | 0.005x + 0.0307 | 0.158 |
| Mumbai | 0.0045x + 0.4106 | 0.059 | 0.0036x + 0.3941 | 0.792 | 0.015x + 0.3368 | 0.240 | 0.0044x + 0.4594 | 0.031 |
| Seoul | –0.0028x + 0.4164 | 0.025 | 0.0018x + 0.3636 | 0.398 | 0.0039x + 0.2954 | 0.046 | 0.0002x + 0.3619 | 0.000 |
| Tokyo | 0.0067x + 2.6582 | 0.104 | 0.0085x + 2.2644 | 0.291 | 0.006x + 2.6296 | 0.083 | –0.0009x + 2.8896 | 0.004 |
© 2019 by the authors. Licensee MDPI, Basel, Switzerland. This article is an open access article distributed under the terms and conditions of the Creative Commons Attribution (CC BY) license (http://creativecommons.org/licenses/by/4.0/).
Share and Cite
MDPI and ACS Style
Lee, K.; Kim, Y.; Sung, H.C.; Ryu, J.; Jeon, S.W. Trend Analysis of Urban Heat Island Intensity According to Urban Area Change in Asian Mega Cities. Sustainability 2020, 12, 112. https://0-doi-org.brum.beds.ac.uk/10.3390/su12010112
AMA Style
Lee K, Kim Y, Sung HC, Ryu J, Jeon SW. Trend Analysis of Urban Heat Island Intensity According to Urban Area Change in Asian Mega Cities. Sustainability. 2020; 12(1):112. https://0-doi-org.brum.beds.ac.uk/10.3390/su12010112
Chicago/Turabian StyleLee, Kyungil, Yoonji Kim, Hyun Chan Sung, Jieun Ryu, and Seong Woo Jeon. 2020. "Trend Analysis of Urban Heat Island Intensity According to Urban Area Change in Asian Mega Cities" Sustainability 12, no. 1: 112. https://0-doi-org.brum.beds.ac.uk/10.3390/su12010112
Note that from the first issue of 2016, this journal uses article numbers instead of page numbers. See further details here.