Evolution of the Global Agricultural Trade Network and Policy Implications for China


1
College of Earth and Environmental Sciences, Lanzhou University, Lanzhou 730000, China
2
Institute of Geographic Sciences and Natural Resources Research (IGSNRR), Chinese Academy of Sciences, Beijing 100101, China
*
Authors to whom correspondence should be addressed.
Sustainability 2020, 12(1), 192; https://0-doi-org.brum.beds.ac.uk/10.3390/su12010192
Submission received: 29 October 2019
/
Revised: 13 December 2019
/
Accepted: 22 December 2019
/
Published: 25 December 2019
Abstract
:Global agricultural trade plays an essential role in balancing supply and demand regarding agricultural products worldwide. Based on complex network theory, two types of agricultural trade networks weighted by the physical quantity and monetary value were built. In both networks, eight groups of agricultural products showed diverse variation in time and space. During 1986 to 2016, the total physical trade increased by 2.55 times with a gradual growth process, and total monetary value increased 1.98 times with fluctuation. The cumulative distribution of node degree and strength followed power-law distribution. Scale expansion and structure complexity of both networks reflected heterogeneity between nodes and the trend of agricultural economic globalization. Meeting demand and seeking greater returns are the main drivers of global agricultural trade development. Mainly developed countries occupied the important positions in the global agricultural trade network, but some emerging economies such as China, Brazil, and India became important sources of demand and supply. China not only needs to fully use international resources to meet demand for agricultural products, but also needs to ensure its own food security through multiple countermeasures.
1. Introduction
Trade liberalization has greatly accelerated the volume of traded agricultural products in recent decades [1] and transformed the geography of food systems [2]. Global food trade has increased exponentially since the 1960s and at a greater rate than food production itself [3]. This plays an increasingly important role in global food security, with about 23% of the food produced for human consumption traded internationally [4]. The essential resources required for agricultural production are largely immobile (e.g., water and land), but agricultural products can flow around the world [5]. Agricultural product imports are nearly universally used to overcome local limits to growth [6]. Thus, agricultural trade has become a means by which land and water factors are reconfigured between regions and alters the distribution of agricultural resources throughout the world [7,8]. Each country can exert respective comparative advantages and improve land and water resource use efficiency and help optimize resource use at the global level [9,10]. International agricultural trade not only strengthens economic ties between countries but has also become an important part of building a community of shared future.
With the advance of economic globalization, the international agricultural trade network has become increasingly complex due to changes in demand–supply structure of agricultural products, trade liberalization policies, and diet changes across the world [11]. This network grows continuously, extending its reach all over the world and linking numerous producers and consumers. Complex network theory has been applied to reveal essential features of the structure, function, and dynamics of many complex systems [12,13]. The agricultural trade network exhibits well-defined network characteristics [14], and complex network analysis helps us better understand essential features of this typical complex network [15]. There has been much research concerning the agricultural trade network in the last decade, for example, the global virtual water trade network [9,16], the property of the global food trade network [17], and the impact of the agricultural trade network on food security [18]. These studies have addressed some related scientific questions, but features, mechanisms, and trends of network evolution require further discussion. In addition, few studies have focused on the performance of specific trade members and the relationships between them and the trade network.
The aim of this study was to construct a global agricultural trade network weighted by trade quantity and monetary value, compare the differences of the two kinds of network, and reveal the key network properties. The study analyzed the temporal and spatial variation of the flow of eight categories of agricultural products and investigated the mechanism and trends of the network evolution. By tracing the performance of China in the global agricultural trade network, we propose some policy implications about improving the utilization efficiency of agricultural resources and ensuring supply safety of agricultural products.
The Chinese Context
China is the country with the largest number of food consumers and has only about 0.087 ha of arable land and 2068 m3 of freshwater per capita [19], representing only 45% and 25% of world average levels, respectively. Cropland and freshwater scarcity severely constrain its agricultural production [20,21]. China’s geographic mismatch between its arable land and water availability has exacerbated this restraint [22]. China needs to assure food for 23% of the world’s population with 7% of the world’s cropland—both a great achievement and a serious challenge. On the one hand, China has maintained agricultural self-sufficiency in grains in most years, even though agriculture needs to compete for scarce land resources with urbanization and industrialization [23], and has lifted 700 million people out of poverty. On the other hand, with economic development, population growth, and diet changes, the challenges China is facing in balancing food supply and demand have increased significantly [24,25]. Diet structures have changed dramatically from plant-based to oil and livestock foods in the last 30 years, and so more agricultural resources have been required. Extensive use of chemical fertilizers, pesticides, and plastic films has increased soil and water pollution. Therefore, international trade has become an inevitable pathway for China to meet domestic demand for agricultural products and relieve pressure on land and water resources [26].
However, the role of China in global agricultural trade is both sensitive and complex. After joining the WTO in 2001, China has played a greater role in world agricultural trade [27] and has become a major importer of agricultural products. China is now the largest importer of soybeans, the second largest importer of cotton, and the third largest importer of pork in the world. Because of high agricultural production costs, China’s major farm products lack competitiveness in international markets. Importation of a large number of agricultural products helps in reducing the intensity of agricultural resource utilization and facilitating improvement of agricultural efficiency but has some negative effects as well. The debate of “Who will feed China?” is compelling and ongoing [23,28]. As a populous country, excessive reliance on international markets to ensure domestic supply of agricultural products has a huge risk. In the event of a global supply shortage, not only will there be few of the products available for import, but their price will also rise. Consequently, the Chinese Government has set a policy goal of basic self-sufficiency in grain.
The main problem of agricultural supply has changed from insufficient total amount to structural contradictions in China—some supplies have not adapted well to changes in demand, with soybean in short supply but corn in oversupply. The prices of most agricultural products are lower in international than domestic markets, and so importation of agricultural products is profitable, which is another reason that China has purchased large amounts of agricultural products from abroad. In the long term, China still faces the dilemma of supplying enough agricultural products and sustainable utilization of agricultural resources. Using global agricultural trade to balance supply and demand in agricultural products, produce more grain with lower environmental costs to ensure food security, and improve domestic agricultural benefits are long-term tasks for China [26]. Analysis of the evolution of the global agricultural trade network is constructive for achieving these strategic goals.
2. Materials and Methods
2.1. Two Types of Agricultural Trade Networks
Complex networks reveal essential features of the structure, function, and dynamics of many complex systems [12,29]. According to the complex network theory, the global agricultural trade network is a weighted and directed network [13]. In this network, each country participating in trade is represented by a node. The links between nodes represent the flows of products traded from export to import country, thus, each link between a pair of nodes is directed by direction of trade. A complex network is mainly measured by the node degree k and the node strength s. In this study, k is the number of trading partners of each country (exporter or importer) and s is the sum of the weights assigned to each node’s links. Here, we endow the weights for the network with physical volume and monetary value of a specific agricultural product exported and imported by each country, respectively. Thus, we constructed a global agricultural trade network for each year of 1986–2016.
As an economic activity, the aim of agricultural trade is to pursue profit maximization, and so the different attributes of agricultural products influence benefits to trading enterprises. There are multiple attributes between various agricultural products. In view of physical properties, products of the same weight have different sizes and moisture contents, which impact modes and cost of transportation. Some products can be stored for long periods and transported for long distances, such as cereal and fiber products. Other products have high water content and easily rot and deteriorate, and so need to be refrigerated to maintain freshness during transportation, such as meat, fruit, and vegetables. Concerning value attributes, products of the same weight have different volumes of value. Per unit weight of meat and fruit have high value but grains and rhizomes have lower value. There are both similarities and differences between physical and value measurements; therefore, it is necessary to research two types of weighted networks.
2.2. Distribution of Node Degree and Strength
The distributions of k and s can explore the heterogeneity between different nodes. For an agricultural trade network with n nodes, if nk represents the node number with degree k in the network, the degree distribution P(k) is defined as P(k) = nk/n. P(k ≥ k0) represents the cumulative degree distribution as follows:
where P(k ≥ k0) represents the cumulative degree distribution such that the fraction of nodes with degrees is greater than or equal to k0, and kmax is the maximum node degree in the trade network.
Similarly, the cumulative strength distribution P(s ≥ s0) is:
where P(s ≥ s0) represents the cumulative node strength distribution such that the fraction of nodes with strength is greater than or equal to s0, and smax is the max strength of node in the trade network.
If the distribution of the node degree and strength is consistent with the power–law relationship, it is taken as a sign that the network is a scale-free network [30]. In general, there are numerous nodes with low strength and few nodes with high strength in a trade network [30,31].
where β and γ are the power–law index, and k and s are the degree and strength of the corresponding node, respectively.
2.3. Density and Clustering Coefficients of the Agricultural Trade Network
Density of the trade network D is used to reflect the overall tightness among the trading countries in the network, and can be calculated as follows:
where the value of D is in the range 0–1, with D = 1 when all nodes are connected and D = 0 when all nodes are isolated; larger D values show closer relationships of the trade network. The m and n represent the number of actual links and total node number in the trade network, respectively.
The clustering coefficient Ci is the measure of how close the neighborhood of a node is. A country or region has multiple trading partners and there are also trade relations among the trading partners, so this forms some different trade groups. Ci is defined as follows:
where Ci denotes the clustering coefficient of node i, its range is also 0–1, with larger C meaning that neighbor nodes connect with one another well; Ci is the average of all individual clustering coefficients; ki denotes the degree of node i; and ei denotes the actual number of links between ki neighbors.
Average path length is used to represent the average number of steps along the shortest paths for all possible pairs of nodes in the trade network [30]. Average path length is defined as follows:
where dij is the shortest path between two nodes, it is the minimum number of edges of all paths from node i to j, and n is the number of nodes in the trade network.
2.4. Data
We considered 69 kinds of agricultural products and divided them into eight groups: cereals, oil crops, fruits, vegetables, sugars, fibers, roots and tubers, and livestock products. The international trade data of these products were taken from the FAOSTAT database [32], including the annual trade matrix from 1986 to 2016.
3. Results
3.1. Overall Characteristics of Agricultural Trade Networks Weighted by Physical and Value Volumes
Both the total number of nodes and links in the global agricultural network increased dramatically during 1986–2016. The number of trade nodes grew from 178 to 203, the number of links increased by 2.5 times, from 32,800 to 114,000, and average links of each node increased from 48 to 99. The number of importing countries is more than that of export countries, since agriculture production is only possible in certain places and not all regions have the advantage to export certain agricultural products.
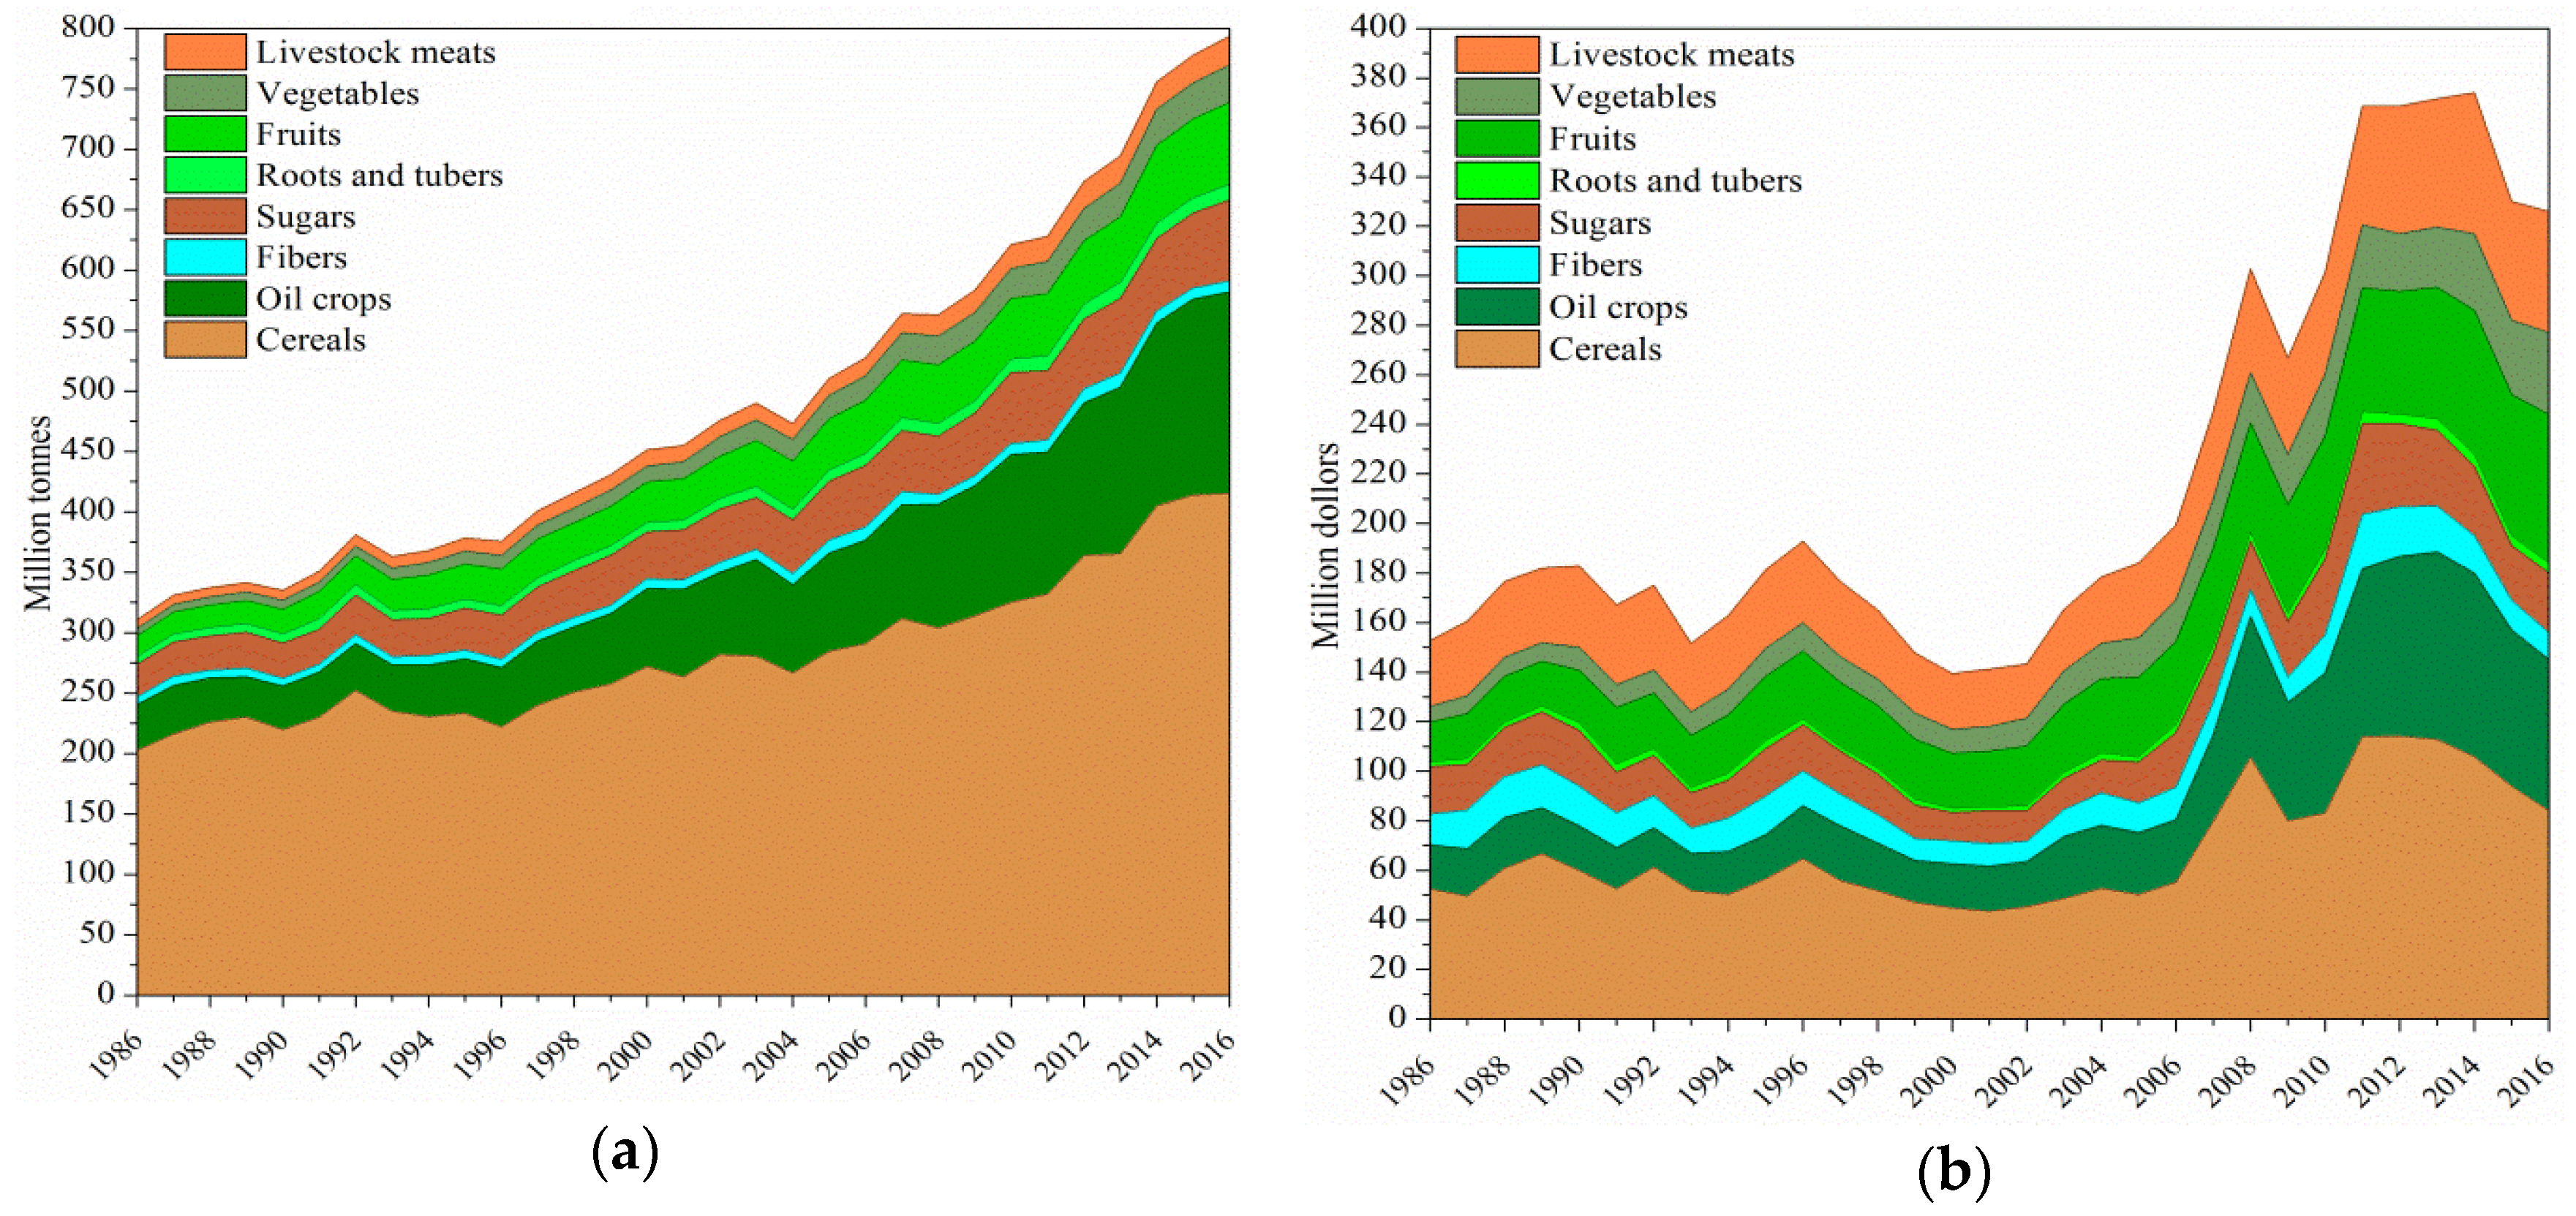
Changes in the general export strength of agricultural products during 1986–2016 showed that, in terms of physical volume (Figure 1a), the total export of agricultural products increased gradually by 2.55 times during 1986–2016, from 311 million to 794 million tonnes, indicating the expanding of the global trade scale (Figure 1a). In terms of value volume, total export also increased but with fluctuation (Figure 1b). It grew especially rapidly after 2005, with the maximal value of $337 billion in 2014. This illustrates that an increase in export volume of agricultural products did not indicate an increase in monetary value. The main reason for this was the great variation in prices of agricultural products in different years. Over the past century, gross food prices have generally fallen, and were especially affected in 1997 by the financial crisis in Asia—the value of international agricultural products traded during 1998–2002 declined to its lowest interval in 30 years, in marked contrast to the steady increase in physical volume (Figure 1a). In mid-2008, there was a rapid rise in food prices induced by the droughts in Russia, Ukraine, and the US in 2007, the increase demand for agrofuels, and other reasons [4,33,34], resulting in rapid growth of gross trade value (Figure 1b).
Table 1 presents the fitting function of the cumulative degree and strength distribution of two types of trade networks. From Table 1, the R2 in most years were above 0.6, and the estimated parameters were all significant at 1% level, indicating the obvious power–law distributions of the cumulative degree and strength distributions.
Figure 2 shows the cumulative distribution of node degree and node strength probability during 1986–2016; both cumulative node degree (links) and node strength followed power–law distribution, with the cumulative distribution of node strength showing larger curvature. There were many nodes with relatively small degree and strength and only a few nodes with larger degree and strength in the agricultural network, which indicated that both the number of trade partners and trade volume of each nation in the global agricultural trade network were highly heterogeneous. Weighting of the network increased its heterogeneity.
The average node degree and strength (s) increased year by year (Figure 2). The degree of each node increased from 48 to 99, while the physical volume increased during 1986 to 2016 from 3.3 million to 7.6 million tonnes, and value volume increased from $1.7 billion to $3.4 billion. Most nodes expanded their trade partners and volume for 30 years in both networks. In addition, the number of hub nodes also rose and their strengths were further enlarged. The strength change was less in the value than in the physical network but had more hub nodes and faster growth (Figure 2b,c). The main reasons were that bulk farm products of low value, such as cereals, accounted for a larger share of gross trade in the physical network but high-value products dominated the value network.
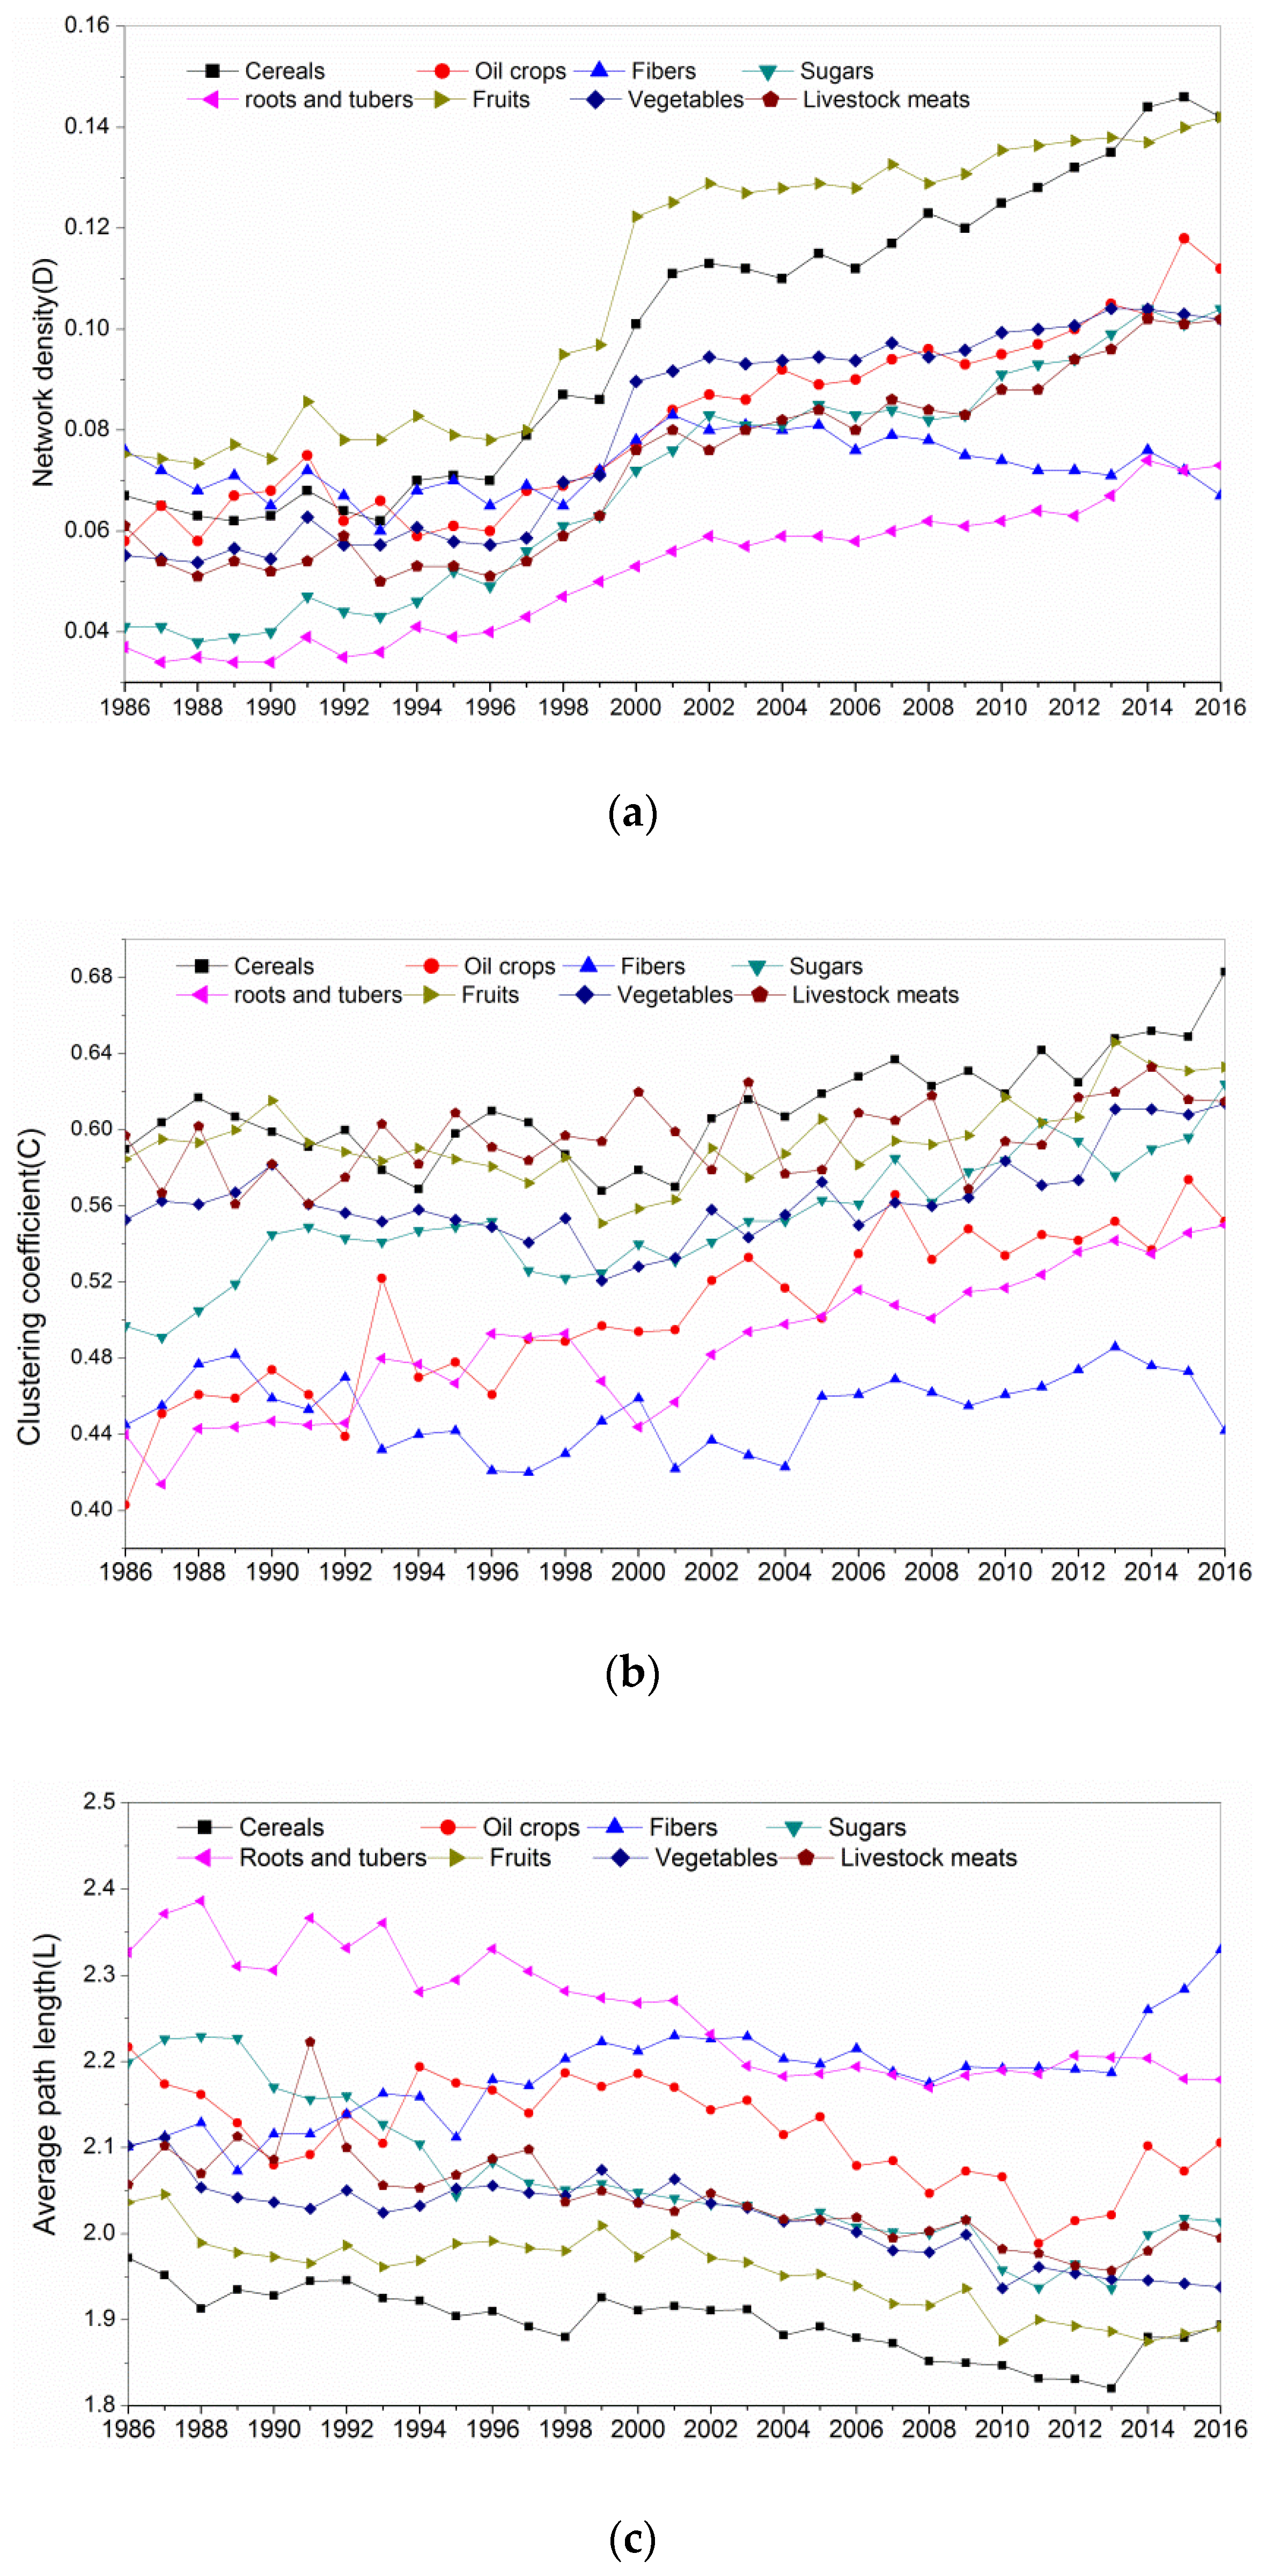
The network densities of eight groups of agricultural products were calculated using Equation (4), which showed the network density (D) values of seven groups (apart from fiber) rising, and especially quickly after 1998 (Figure 3a). This indicates closer relationships developing between economies participating in global trade. Meanwhile, differences in D values among the eight groups widened during 1986–2016. By 2016, cereals and fruits had the highest network density, and roots and tubers and fibers had the lowest density, which presented three levels of D values. However, in 2016, all the eight groups had D < 0.16, implying that network densities still have enormous potential for broadening.
The clustering coefficient (C) also showed an increasing trend in eight groups of agricultural products, with those for oil crops, sugar, and roots and tubers growing faster than other groups (Figure 3b). Thus, trade relationships in these three groups became tighter between neighbor nodes.
Differing from D and C, the average path length (L) generally declined during 1986–2016, with the exception of fiber (Figure 3c). This is because, with the process of economic globalization, the links between the nodes increased and trade activity between neighboring countries in space achieved faster growth. However, trade in fiber was more concentrated in a few countries, and showed a different trend.
3.2. Variation Trend of Eight Groups of Agricultural Products
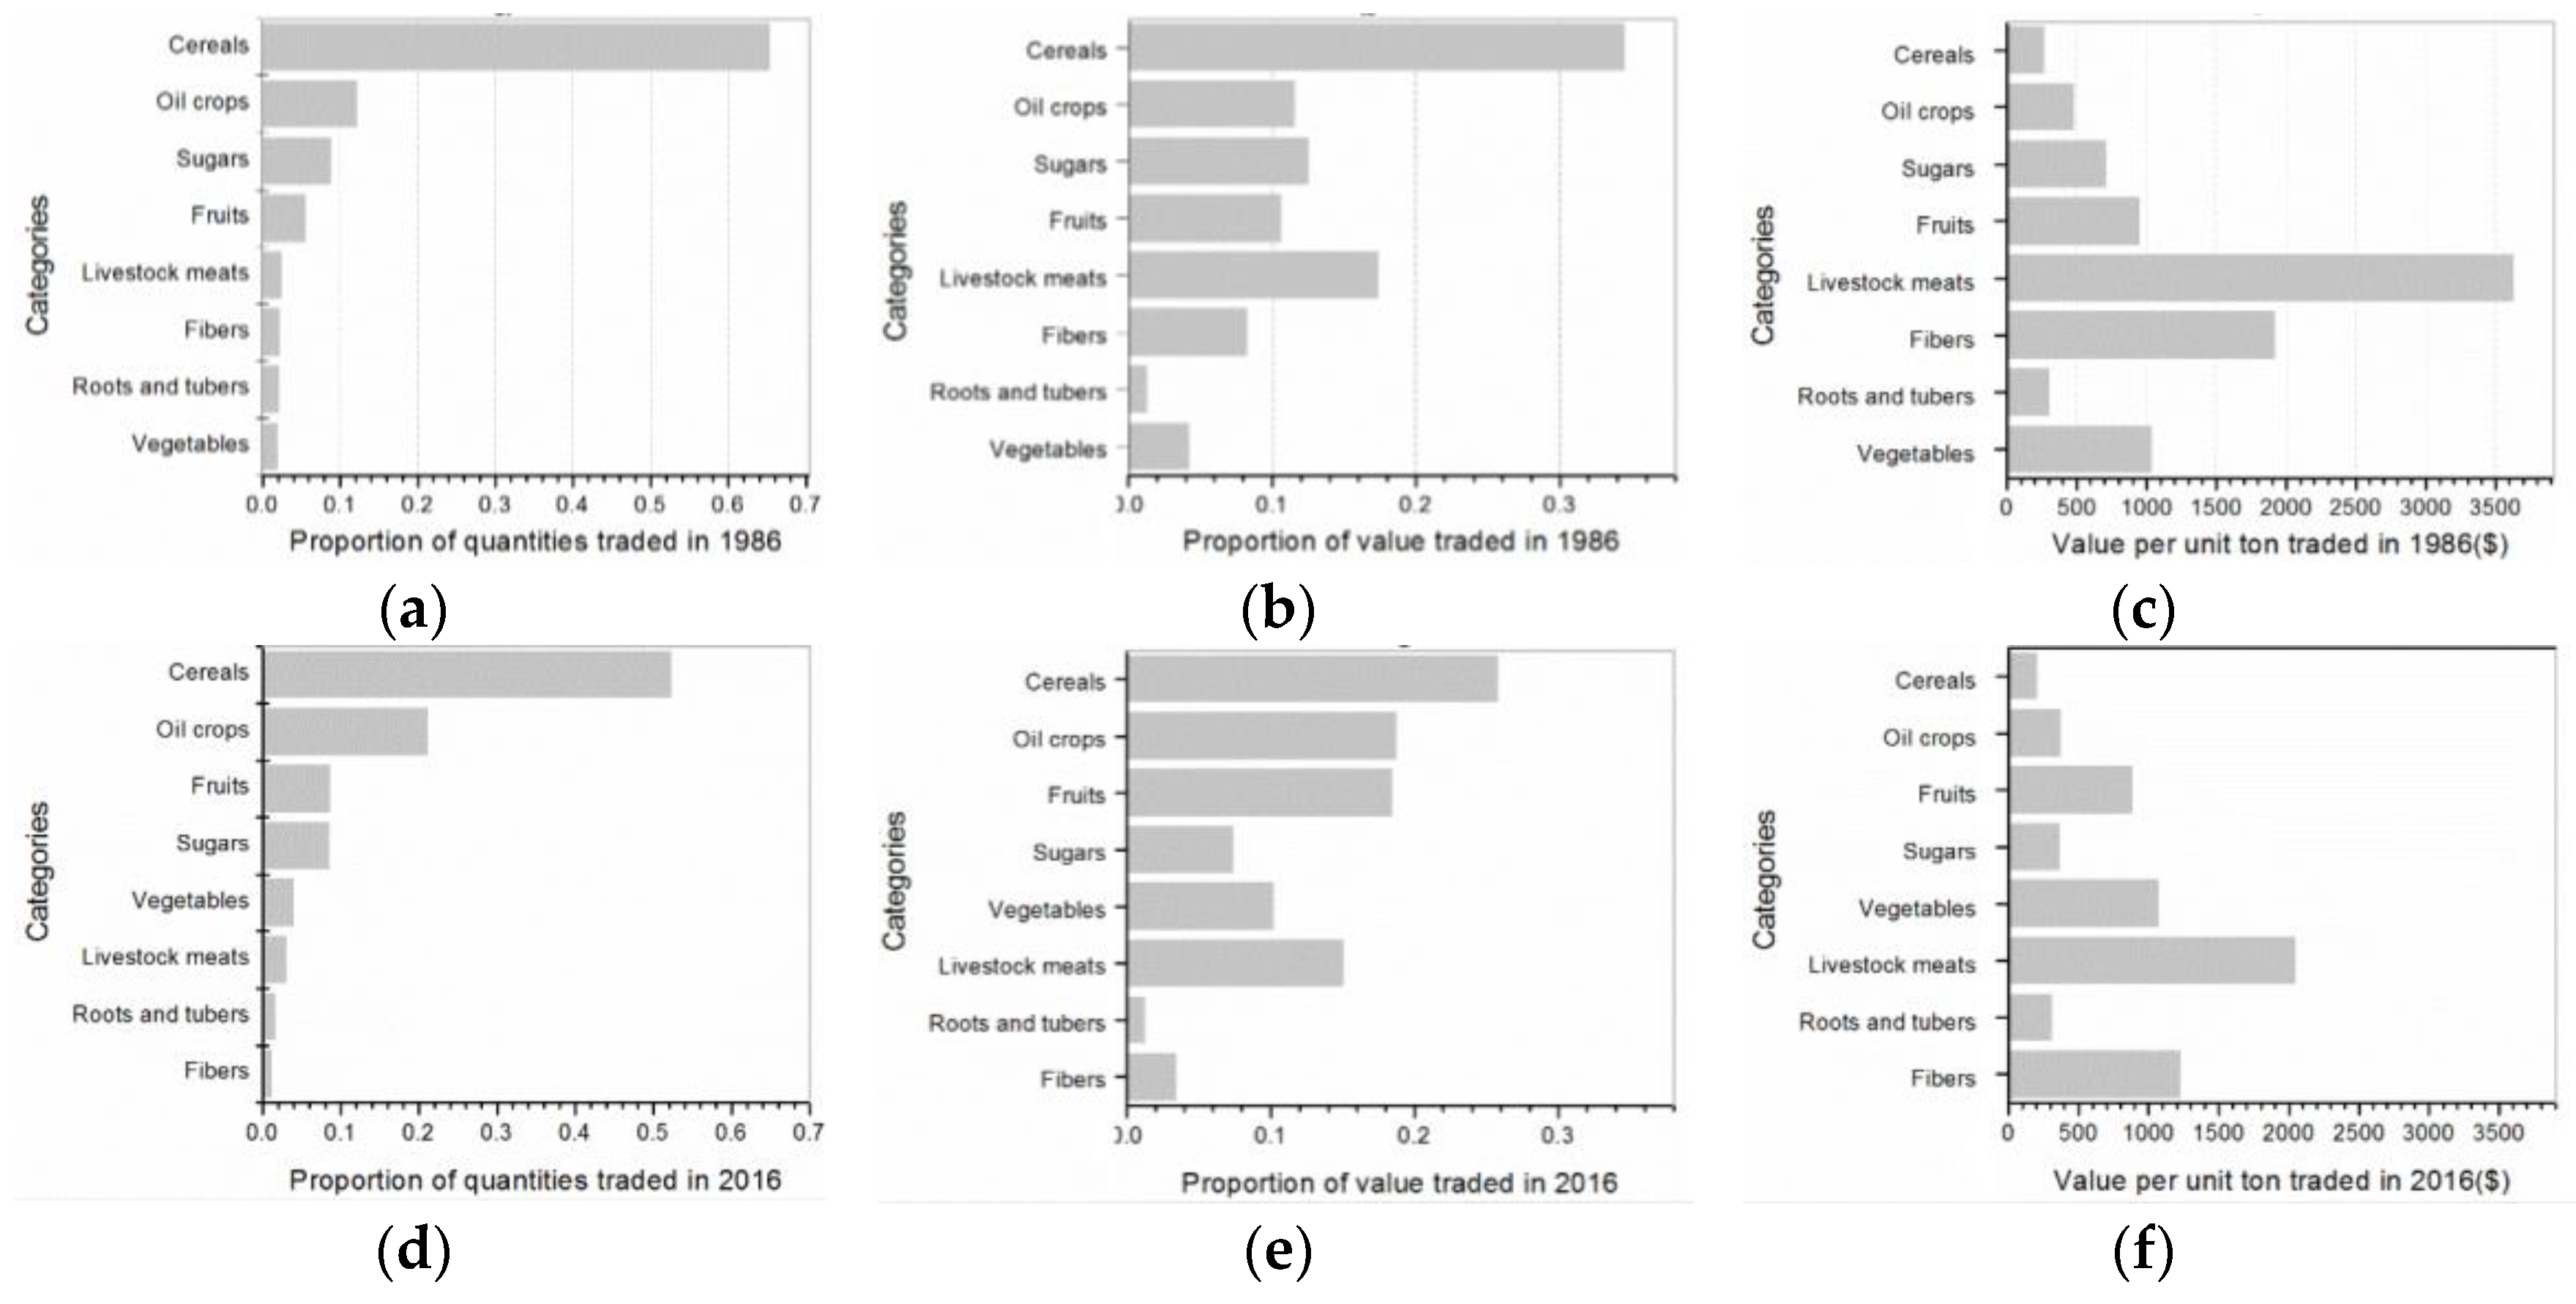
There were significant differences among the proportions of total agricultural trade for physical and value volumes in the eight groups of products. To further distinguish the differences between them, we used agricultural trade data in 1986 and 2016 as examples and calculated the percentages of physical and value of each group of products relative to the total agricultural trade and the values of unit weight, respectively (Figure 4). The unit prices of cereals, root and tubers, fruits, and vegetables changed little during 1986–2016, but those of oil crops, fiber, sugar, and livestock meat showed significant decreasing trends. Unit prices declined, likely due to increasing demand and the decrease in production costs. For instance, the share of oil crops in total agricultural trade increased from 13.6% to 34.2% during 1986–2016, but average price per ton dropped from $471 to $365.
As the main source of nutrition for human beings, cereals are essential for the food security of all countries, but some nations are unable to feed themselves because of multiple factors and have to depend on international trade to meet food demand [4]. Trade of cereal products dominated global agricultural trade: its physical volume increased during 1986–2016 from 203 million to 415 million tonnes, and monetary value increased from $53 billion to $84 billion. However, corresponding shares declined from 65.2% to 52.3% and from 34.4% to 25.8%, respectively. The great difference of proportions in the two trade networks was mainly due to low prices per unit weight. Their lower water capacity means that cereals can be easily stored for long periods and transported long distances; thus, trade cost of cereals was lower than that of others, and their quantities were the greatest in all categories.
Oil crops were the second largest agricultural product in global trade: physical trade volume increased during 1986–2016, from 37 million to 167 million tonnes, and trade value increased from $18 billion to $61 billion; and corresponding shares in total trade increased from 12.1% to 21.0% and 11.6% to 18.7%, respectively. The physical trade volume of sugar rose significantly from 27 million to 67 million tonnes during the study period, but with little change in share. The trade attributes of oil crops and sugar (mainly processed products) were similar to those of cereals, but prices per unit weight were higher than for cereals, and their shares in physical and value networks were similar.
The physical trade volume of fruits, vegetables, and livestock meat changed little during 1986 to 2016, but the value volume of fruits and vegetables increased. Differing from cereals, the fruit, vegetables, and livestock meat have higher water capacity, and do not favor long-term storage, with freshness the primary guarantee of quality. Additional measures, such as freezing, refrigerating, and keeping fresh, are needed during transportation. Therefore, their trade costs are far higher than that of other groups. However, these products can improve people’s quality of life, and have higher values per unit weight. Consequently, the shares of fruits, vegetables, and livestock meat were only 3%, 8.6%, and 4% of total trade in the physical network in 2016, respectively, but corresponding shares of total trade in the value network were 15%, 18%, and 10%. Thus, there were significant differences in proportions between the two trade networks.
Roots, tubers, and fibers had only small trade volumes. Roots and tubers are low-value goods, with their share in the physical network being slightly less than in the value network. Fibers have a higher unit price, and their share was lower in the physical compared with the value network—their shares in both networks declined by more than half during 1986–2016.
The above analysis shows that different types of agricultural products may meet different market demands, adapt to different modes of transportation, and have different trade costs and benefits. In general, market demand and cost/benefit of trading enterprises are two important aspects influencing international agricultural trade.
3.3. Position of Major Economies in the Two Trade Networks
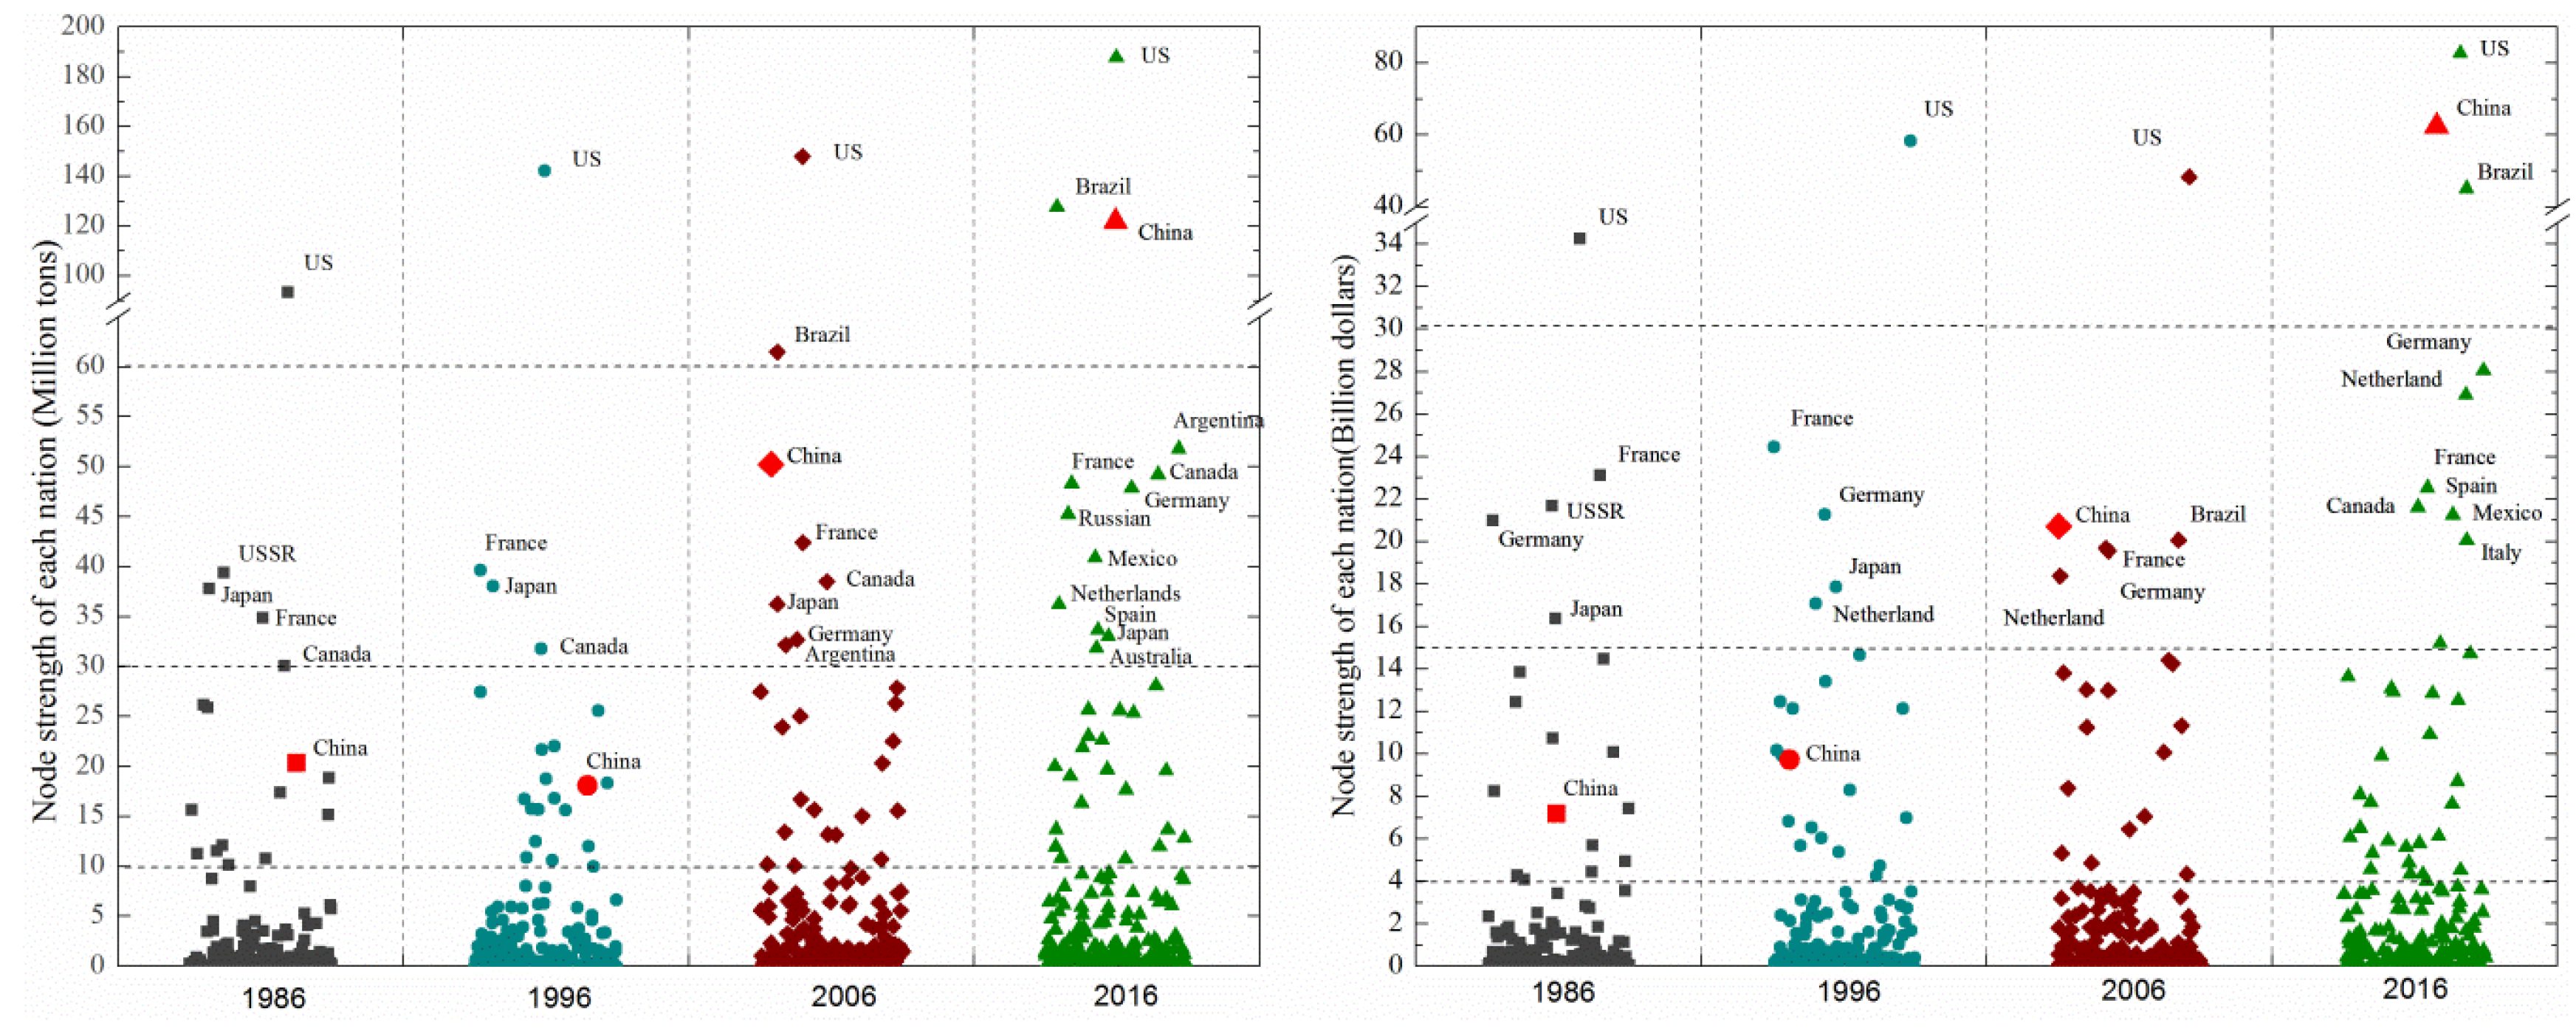
When all nations were sorted according to annual node strength, a hierarchical structure resembling a pyramid appeared from many small nodes to few large nodes (Figure 5). The position of each nation in the annual hierarchy shows its real trade ability, and the change in position of a nation between years shows the ability to change. Only a few nodes had high strength, but they played hub roles in the whole trade network. The US was always at the top of pyramids in both trade networks during 1986–2016, with several developed nations such as France, Germany, and Japan following. An interesting change is the emerging developing countries of China and Brazil rapidly moving toward the top of pyramids and becoming hub nodes second to the US in 2016.
Nations often had different positions in the same year in the two types of networks. Some economically advanced countries in Europe—such as the Netherlands, UK, and Italy—mainly import and export fruits, vegetables, and animal products of high value. They were at lower positions in the physical network, yet higher in the value network. For some countries in Africa and South Asia, such as Thailand and Indonesia, economic development is relatively slow or land and water resources are relatively scarce; therefore, they had higher positions in the physical than the value network. Other countries, like Canada and Argentina, were located in the second level of the physical network and the third of the value network, because they mainly export land-intensive and lower-value products. In general, with deepening economic globalization, the strength of most nodes in the agricultural trade network increased, but the hierarchical structure of the trade network was more complex.
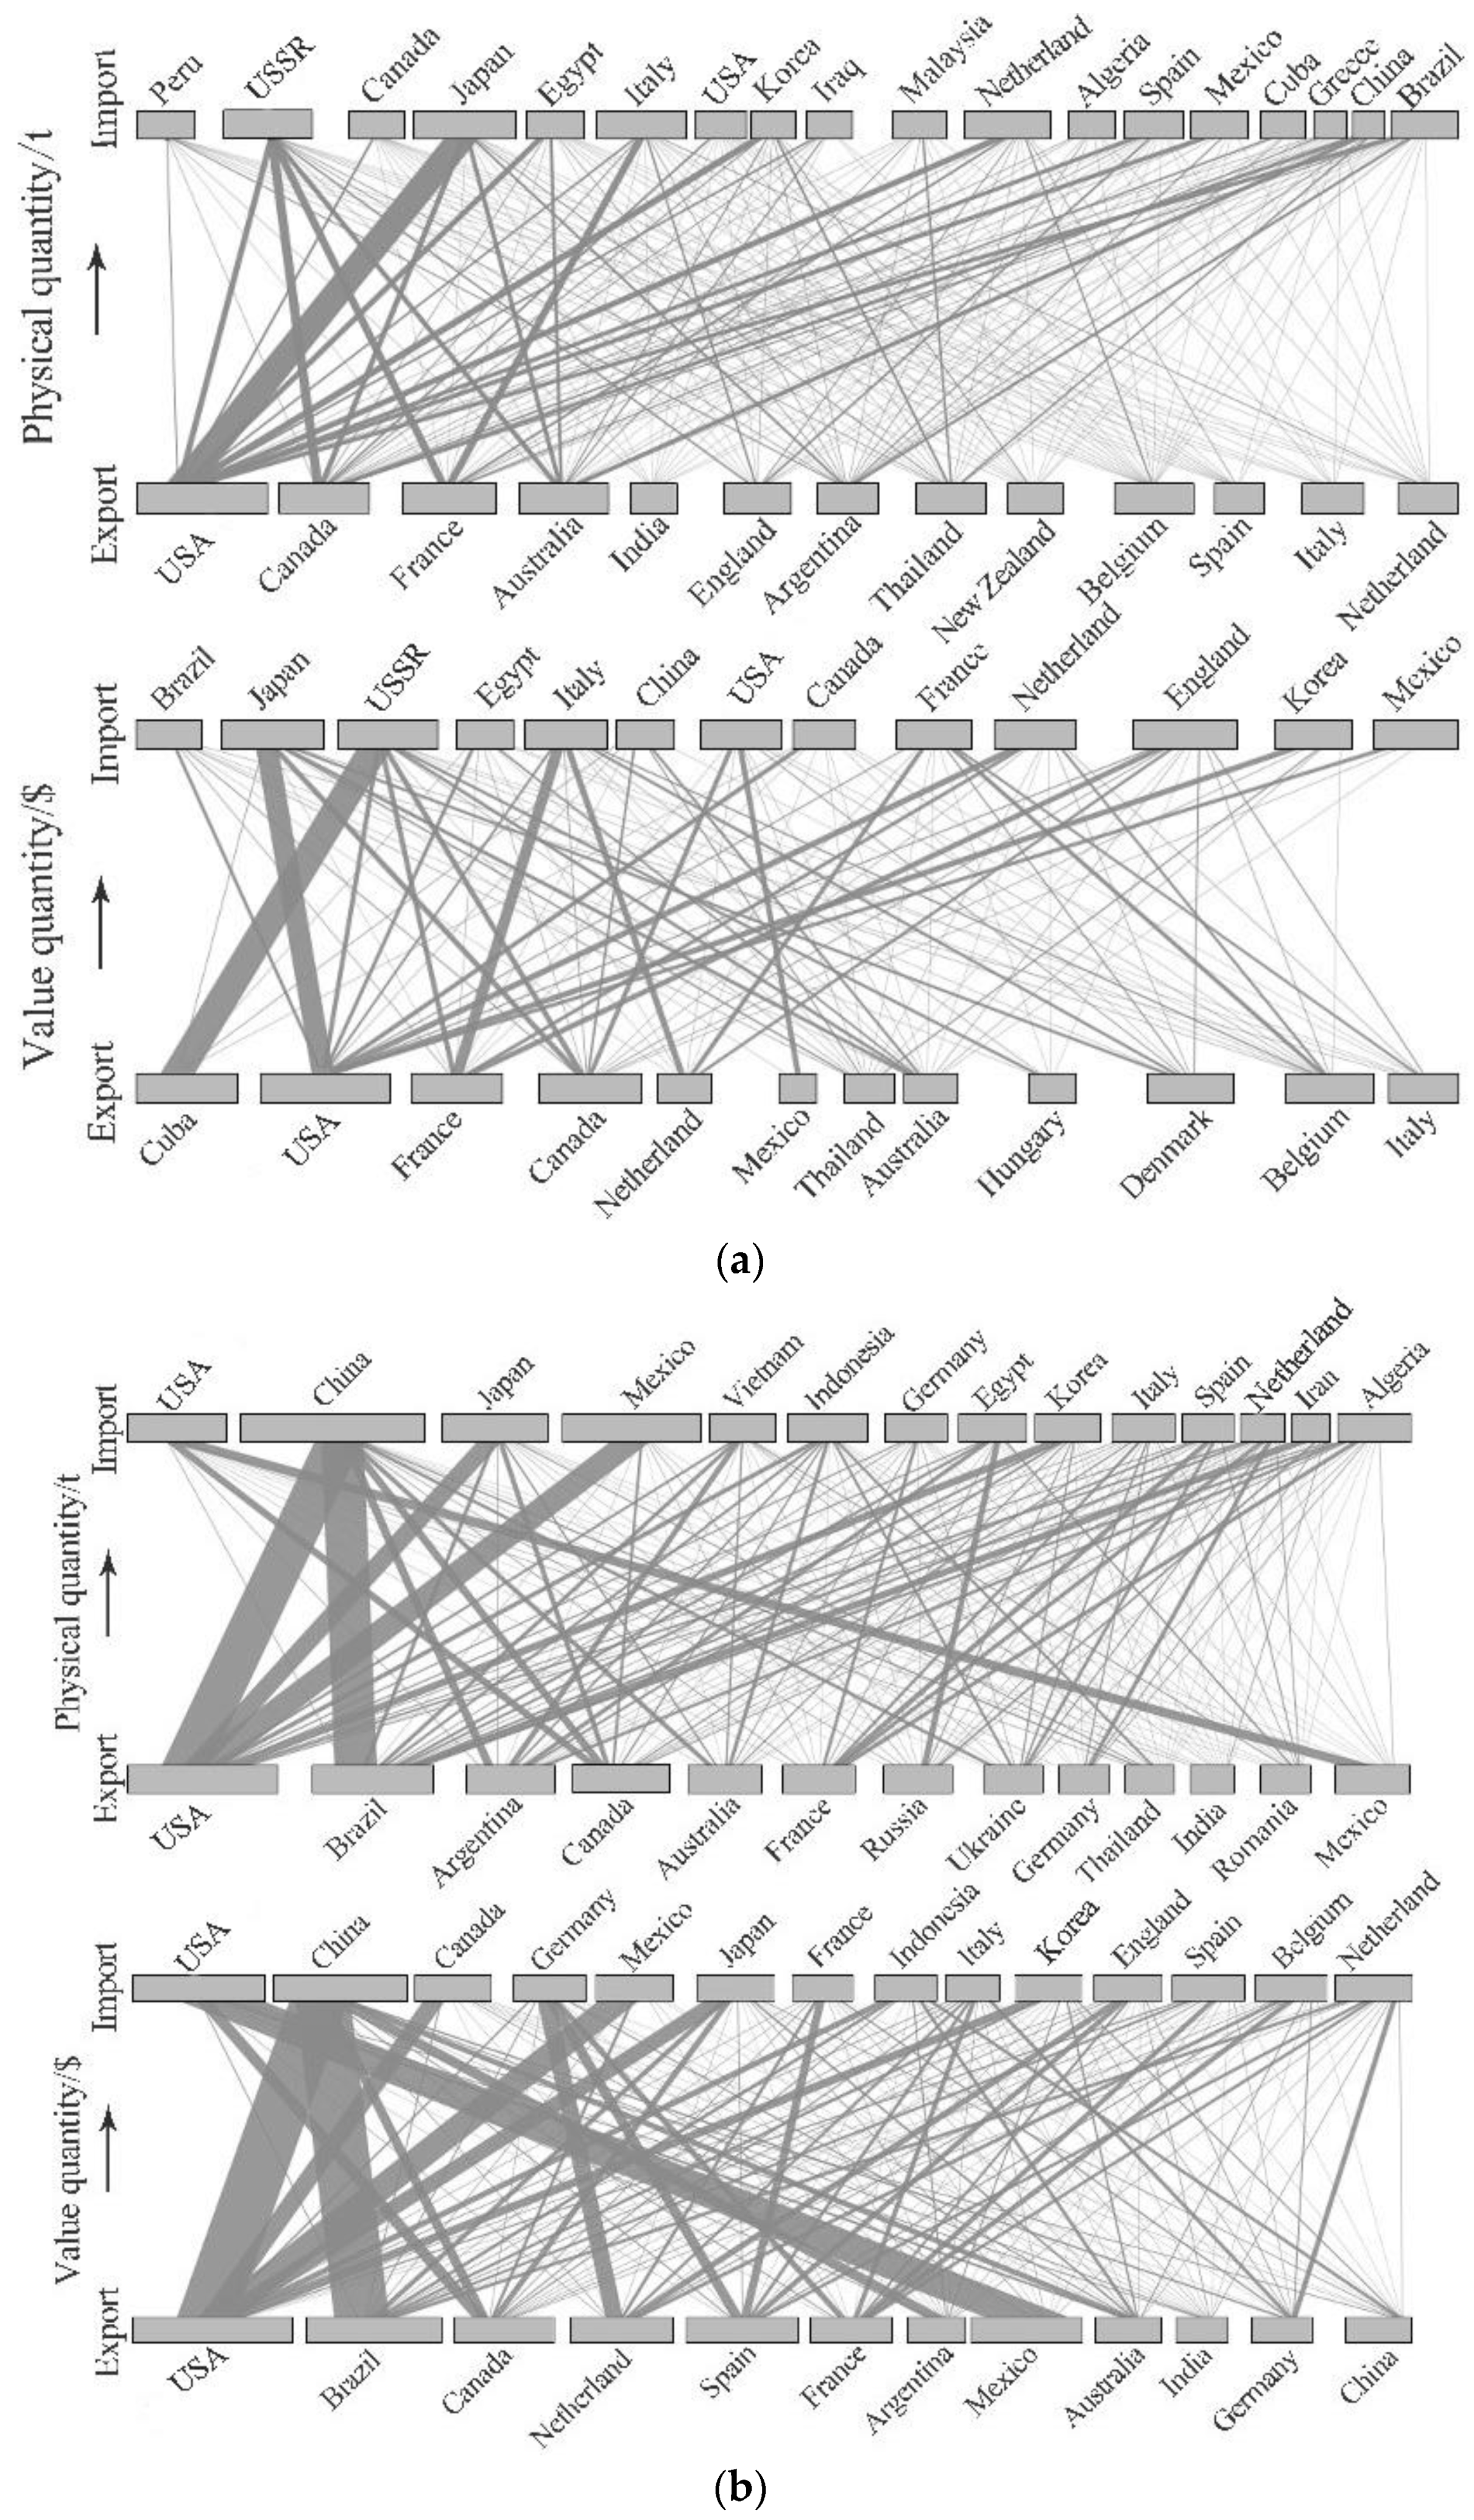
Exporting was more concentrated than importing, and so we chose exporting countries that accounted for 70% of the total trade and importing countries that accounted for more than 80% of the total trade as target objects and directly expressed the trade relationships between these major economies (Figure 6a,b). The thickness of link lines in Figure 6a,b denotes the trade size between two countries. In 1986, the main trade products were cereals, soybeans, and sugar. The strongest link was US–Japan in the physical network, followed by Canada–USSR (former Union of Soviet Socialist Republics), France–USSR, France–Italy, and US–South Korea. In the value trade network, the strongest link was Cuba–USSR, followed by US–Japan, and France–Italy. Bulky trade occurred among developed countries as well as the USSR (Figure 6a).
By 2016, the geographical pattern of agricultural trade showed significant change—the top node countries in global trade had changed (Figure 6b). In the top 14 exporting countries, the UK, New Zealand, Belgium, Spain, Italy, and the Netherlands were replaced by Brazil, Russia, Ukraine, Germany, Romania, and Mexico in the physical network. Most links became stronger, indicating that related trade volume grew, and major links showed considerable variation. US–China and Brazil–China became the strongest links in both networks, followed by US–Mexico, US–Japan, Mexico–US, Brazil–Iran and Argentina–China. Thus, the top export hub was the US and the top import hub was China. Of course, there were differences in order between the two networks. In 2016, products of bulky trade were soybeans, maize, wheat, rice, barley, apple, onion, garlic, cotton, beef, and pork. Developed countries generally imported high-value agricultural products and developing countries imported large amounts of cereals. Most agricultural trade was concentrated in some developed countries and emerging developing countries. Especially, some big emerging countries with China, Brazil, and India represented important demand or supply sides, and showed substantially raised positions in global agricultural trade networks, which changed the associated geographical patterns.
At the intercontinental level, Asia and Europe imported most of the agricultural products, accounting for 80.3% and 82.8% of total trade volume in the physical and value networks in 1986, and correspondingly 78.3% and 82.4% in 2016. The major exporters were North America, South America, Europe, and Oceania. However, main flow directions of agricultural products showed huge changes during 1986–2016. North America to Asia (Japan was a major importer) and internal trade among European countries were the major relationships in 1986, representing 43.2% and 49.3% of the total trade in the physical and value networks, respectively, followed by North America to Europe and Oceania to Asia. By 2016, exports from South America to Asia were of similar strength as those of North America to Asia (China was a major importer), but exports from North America to Europe significantly declined from 12.7% to 1.7%. Europe increased exports to Asia and Africa, representing increases in total Europe exports from 21.2% to 39.9%. In general, trade links among countries within Europe tended to be higher-value products than others.
3.4. China’s Position in Global Agricultural Trade Networks
As a large agricultural country, China’s position in global agricultural trade networks was trivial in 1986. At that time, China’s rural reform had achieved its preliminary effect, and the situation of food shortages had been overcome. Due to a low agricultural production level, China had little surplus of agricultural products available for export and lacked the financial ability to import more agricultural products. The import and export volumes were 8.8 million and 11.7 million tonnes in the physical network, respectively, with global ranking of eighth; volumes were $2.5 billion and $4.9 billion in the value network, respectively, with global ranking of 13th. There were 103 countries that had trade relations with China.
During 1986–2016, especially after joining the WTO in 2001, China rapidly moved toward the top of trade pyramids and became the largest importer in the world, conducting business activities with 160 countries. During 1986–2000, China’s node degree increased from 597 to 2278, node strength increased from 20.32 million to 127.64 million tonnes in the physical network, and from $3.4 billion to $60.7 billion in the value network. China played an important role in the process that reshaped the pattern of global agricultural trade. In 2016, China’s import volume far exceeded export volume in agricultural trade; China mainly imported soybean and wheat from the US, Brazil, Canada, and Argentina; milk products from Australia and New Zealand; cotton from India; sugar from Brazil and Cuba; beef from the US and Australia; and pork from Europe and the US. China’s export products were mainly fruit, vegetables, and minor coarse cereals: apples to South Asian countries; and fresh onion, tomato, garlic, and pepper and their processed products to Japan, Korea, and Central Asia.
4. Discussion
Complex network theory is an efficient way to analyze the structure of trade networks and their evolutionary process. It can reveal change characteristics and trends of agricultural trade networks through fitting power–law distributions to node strength, reflecting well the drivers of agricultural trade and structure evolution, and visually displaying the trading relationships between countries or geographical regions [9].
The results of our study display trade patterns of different economic groups in physical and value trade networks. In general, developed countries usually exchanged the high-value agricultural products with others, while developing countries were concentrating more on trading low-value but large quantities of products for food security or improving people’s lives. In addition, agricultural trade was a means of transferring water and land resources between different regions; some countries with affluent arable land tend to export land-intensive agricultural products such as cereals and oil crops, such as the US, Brazil, Argentina, Canada, and Australia. Previous study has shown that Argentina, Canada, and Australia dedicated 70%–85% of their domestic harvest areas for export, and the US was 35% [2]. Countries that stressed in land deficit were the major importers in the trade network, such as China, Japan, and South Korea. Some countries were mainly focused on exporting high-value products, such as the EU, which contributed the most to the monetary value network, specializing in exporting more high-value products. In addition, though China was the largest importer of the oil crops, it also exports large amounts of relatively high-value products such as vegetables and fruits.
The network and bilateral trade relationships of physical and value volumes show different features. The network analysis can help to optimize global food security and explore hypothetical scenarios to maximize the economic value through agricultural trade on both a global and regional scale. The network weighted by physical volume mainly reflects the demand situation of the purposes of agricultural products, while the network weighted by monetary value more reflects the revenue of agricultural trade from the structural change and price fluctuation of agricultural products. Studying the two types of trade networks may provide decision support for choice of trade partners and adjustment of trade policy. In addition, agricultural trade is ultimately an economic exchange [7], and measuring the value of traded products helps provide a deeper understanding of the evolution of agricultural trade networks.
Because increasing numbers of countries are relying on global trade for the supply of agricultural products, the openness of policies is likewise of growing importance. Variation in the two trade networks reflected the rapid globalization in the agricultural economy during 1986–2016. Nations gained comparative advantages by exporting the commodities that intensively use their relatively abundant resources and importing products for which they have less advantage [9]. Moreover, agricultural trade is influenced by many factors, especially, the relative trade agreements between specific countries can lead to the intensification of the trade in these countries, such as the densely internal trade relationships among EU countries. Policy changes and economic development are also important drivers of some countries that are changing the global agricultural trade structure [9]. The dramatic rise of the oilseeds and livestock feeds trade in recent years was mainly caused by increasing income in some developing countries. Subsidy policy was also one of the main causes that stimulate some crops to become export-oriented; for instance, 40% of maize harvested was exported to the US as the maize was subsidized [2].
More and more nations increasingly rely on foreign resources for their agricultural product supply. This indicates that agricultural resources are reallocated in more broadly spatial scales with economic globalization, the interconnectedness of agricultural trade is growing, and the relationships between countries participating in the trade network are becoming tighter. This conclusion of our research is in accordance with [2,9,14]. International agricultural trade means that relevant water and land resources flow between countries, which has had profound influences on society and the environment, for example: diet structure change [35], land use transition [36,37] and water use reduction in net importers for agricultural products [9]. In fact, the high benefit from global trade is at the expense of the environment and climate [36]. Therefore, it is essential to respond actively to a set of environmental problems for the sustainable development of agriculture.
The globalization of agricultural has become increasingly important to national food security; policy-makers need to move towards a network- and interaction-oriented view from a regional view. A well-functioning international trade network can also support the adaptation to climate change-related challenges worldwide [38]. However, the strong interconnection existing within the trade network causes the effect of episodic regional declines in crop production to be felt globally [39]. Meanwhile, concentrated trade relationships could raise importer susceptibility to price spikes if crop production is disrupted or if governments impose export restrictions [40], and any shock affecting the central nodes would propagate easily to the rest of the network [18]. From this point of view, the agricultural network is moving towards a ‘robust-yet-fragile’ configuration [41]. Thus, further studies also need to focus on the relative path to improve the stability of the international agricultural trade network, such as the management of connectivity in the system and gradual changes and feedback impacting the system [41].
China’s position in global agricultural trade networks has changed from the exporter to the largest importer in the world. Based on China’s basic national conditions of a large population, insufficient land, and water shortage, using the international market to meet domestic demand for agricultural products is inevitable [6]. Thus, China needs to diversify its trade partners to ensure food supply security. As income grows, China’s people will increase their consumption of animal products [9]. China also needs to use the favorable opportunity of agricultural products in the international market to reduce the use intensity of domestic soil and water resources by importing and improving people’s living standard [22]. However, as the largest importers of global agricultural trade, China’s domestic agricultural supply has significant implications for both China’s own national food security and that of the world [42]. From this point of view, China also needs to take the relative measures to improve its agricultural production efficiency, such as adjusting agricultural structure to reach a higher farmland use efficiency [1].
5. Conclusions
Based on complex network theory and, using global agricultural trade data for 1986–2016 concerning eight groups of agricultural products, this study built two types of trade networks: a physical network weighted by product weights and a value network weighted by monetary values of products. The main conclusions follow:
During 1986–2016, the total number of trade nodes increased from 178 to 203, the total physical trade of global agricultural products increased by 2.55 times and the growth process was stable. Therein, oil crops had the largest growth, with an increase of 4.57 times. The total value of trade increased by 1.98 times, showing a fluctuating growth trend. Therein, fruits had the largest contribution, with an increase of 3.75 times. This indicates that the change trend of the two networks was the same, but their evolutionary processes differed.
The cumulative distribution of trade node strength followed a power–law relationship. Over time, node strengths of most countries increased, with the extension index of the function also increasing. The network density and clustering coefficient showed increasing tendencies, and average path length became shorter. These changes indicate that the scale of the two networks enlarged, their structure became more complex, and heterogeneity between nodes was enhanced.
The number of countries participating in global trade of agricultural products increased and covered almost all nations in 2016. The strength of nodes, particularly “hub” nodes, further improved as the number of nodes increased, clearly showing the integrative trend of the global agriculture economy. There were some important changes in the geographical pattern of global agricultural trade—North American and European countries were always economies with the largest average node degree, but some emerging economies such as China, Brazil, and India became important sources of demand and supply. The original major trade link lines were replaced by new link lines.
Due to different unit prices, the proportions that the eight groups of agricultural products represented of total agricultural trade differed greatly between the physical and value networks. Meat, fruit, vegetables, and fiber with higher unit prices had higher shares in the value than the physical network, and other products were the opposite. Low-value goods suited to long-term storage and long-distance transport tended to be cross-continental trade, but perishable goods with high value tended to be intra-continental. The main objectives of trade activities of all countries were meeting demand and seeking greater returns.
During 1986–2016, China’s position rapidly rose in global agricultural trade networks and it became the largest importer in the world. For both trade networks, the links between China and the US, and China and Brazil, had the largest volume. The global trade of agricultural products plays an important role in meeting food demand and saving agricultural resources for China, but the impacts of China on international agricultural markets are sensitive and complex. China needs to continue to import agricultural products by international trade to better meet domestic demand and must propel diversification of the sources of imports. Additionally, the comparative advantages of domestic agricultural resources should be brought into full play, and the export of high-value products should be gradually expanded. Moreover, the economic benefit of agricultural production should be further improved, and the competitiveness of domestic agricultural goods enhanced.
Our research considered the volume and economic trade network and illustrated their attributes and feature change, which provide comprehensive insight into agricultural trade for decision-making in the globalization era. However, we are limited in deeper analysis of the network, including the topology of the two networks [14,18], prediction of the trade links [43], and the drivers behind the evolution of the trade networks [44].
Author Contributions
Conceptualization, W.Q. and S.N.; methodology, W.Q.; software, X.W.; validation, X.W. and W.Q.; formal analysis, W.Q.; investigation, W.Q.; resources, C.Z.; data curation, W.Q.; writing—original draft preparation, W.Q.; writing—review and editing, W.Q.; visualization, A.L.; supervision, S.N.; project administration, S.C.; funding acquisition, A.L. All authors have read and agreed to the published version of the manuscript.
Funding
This research was funded by the “Natural Science Foundation of China (grant no. 41801192)” and the “Key Research Program of Chinese Academy of Sciences (grant no. ZDBS-SSW-DQC).”
Conflicts of Interest
The authors declare no conflict of interest.
References
- Qiang, W.; Liu, A.; Cheng, S.; Kastner, T.; Xie, G. Agricultural trade and virtual land use: The case of China’s crop trade. Land Use Policy 2013, 33, 141–150. [Google Scholar] [CrossRef]
- Macdonald, G.K.; Brauman, K.A.; Sun, S.; Carlson, K.M.; Cassidy, E.S.; Gerber, J.S.; West, P.C. Rethinking agricultural trade relationships in an era of globalization. BioScience 2015, 65, 275–289. [Google Scholar] [CrossRef]
- Ercsey-Ravasz, M.; Toroczkai, Z.; Lakner, Z.; Baranyi, J. Complexity of the international agro-food trade network and its impact on food safety. PLoS ONE 2012, 7, e37810. [Google Scholar] [CrossRef]
- D’odorico, P.; Carr, J.A.; Laio, F.; Ridolfi, L.; Vandoni, S. Feeding humanity through global food trade. Earth Future 2014, 2, 458–469. [Google Scholar] [CrossRef]
- Carole, D.; Ignacio, R.-I. Environmental impacts of food trade via resource use and greenhouse gas emissions. Environ. Res. Lett. 2016, 11, 035012. [Google Scholar] [CrossRef]
- Porkka, M.; Guillaume, J.H.A.; Siebert, S.; Schaphoff, S.; Kummu, M. The use of food imports to overcome local limits to growth. Earth Future 2017, 5, 393–407. [Google Scholar] [CrossRef]
- Macdonald, G.K. Eating on an interconnected planet. Environ. Res. Lett. 2013, 8, 2. [Google Scholar] [CrossRef]
- Meyfroidt, P.; Lambin, E.F.; Erb, K.-H.; Hertel, T.W. Globalization of land use: Distant drivers of land change and geographic displacement of land use. Curr. Opin. Environ. Sustain. 2013, 5, 438–444. [Google Scholar] [CrossRef]
- Dalin, C.; Konar, M.; Hanasaki, N.; Rinaldo, A.; Rodriguez-Iturbe, I. Evolution of the global virtual water trade network. Proc. Natl. Acad. Sci. USA 2012, 109, 5989–5994. [Google Scholar] [CrossRef] [Green Version]
- Dalin, C. Water for Food: Evolution and Projections of Water Transfers Through International and Domestic Agricultural Trade. Ph.D. Thesis, Princeton University, Civil and Environmental Engineering, Princetion, NJ, USA, 2014. [Google Scholar]
- Jalava, M.; Guillaume, J.H.A.; Kummu, M.; Porkka, M.; Siebert, S.; Varis, O. Diet change and food loss reduction: What is their combined impact on global water use and scarcity? Earth Future 2016, 4, 62–78. [Google Scholar] [CrossRef] [Green Version]
- Barabási, A.-L. Scale-Free Networks: A Decade and Beyond. Science 2009, 325, 412–413. [Google Scholar] [CrossRef] [PubMed] [Green Version]
- Foster, J.G.; Foster, D.V.; Grassberger, P.; Paczuski, M. Edge direction and the structure of networks. Proc. Natl. Acad. Sci. USA 2010, 107, 10815–10820. [Google Scholar] [CrossRef] [PubMed] [Green Version]
- Shutters, S.T.; Muneepeerakul, R. Agricultural trade networks and patterns of economic development. PLoS ONE 2012, 7, e39756. [Google Scholar] [CrossRef] [PubMed]
- Yang, Y.; Dong, W. Global energy networks: Insights from headquarter subsidiary data of transnational petroleum corporations. Appl. Geogr. 2016, 72, 36–46. [Google Scholar] [CrossRef]
- Konar, M.; Dalin, C.; Suweis, S.; Hanasaki, N.; Rinaldo, A.; Rodriguez-Iturbe, I. Water for food: The global virtual water trade network. Water Resour. Res. 2011, 47, 5. [Google Scholar] [CrossRef] [Green Version]
- Konar, M.; Lin, X.; Ruddell, B.; Sivapalan, M. Scaling properties of food flow networks. PLoS ONE 2018, 13, e0199498. [Google Scholar] [CrossRef]
- Sartori, M.; Schiavo, S. Connected we stand: A network perspective on trade and global food security. Food Policy 2015, 57, 114–127. [Google Scholar] [CrossRef] [Green Version]
- NBS. China Statistical Yearbook of 1991–2016; China Statistics Press: Beijing, China, 2017. [Google Scholar]
- Liu, J.; Savenije, H.H.G. Food consumption patterns and their effect on water requirement in China. Hydrol. Earth Syst. Sci. Discuss. 2008, 12, 887–898. [Google Scholar] [CrossRef] [Green Version]
- Yu, C.; Huang, X.; Chen, H.; Huang, G.; Ni, S.; Wright, J.S.; Hall, J.; Ciais, P.; Zhang, J.; Xiao, Y.; et al. Assessing the impacts of extreme agricultural droughts in China under climate and socioeconomic changes. Earth Future 2018, 6, 689–703. [Google Scholar] [CrossRef]
- Dalin, C.; Qiu, H.; Hanasaki, N.; Mauzerall, D.L.; Rodriguez-Iturbe, I. Balancing water resource conservation and food security in China. Proc. Natl. Acad. Sci. USA 2015, 112, 4588–4593. [Google Scholar] [CrossRef] [Green Version]
- Lohmar, B.; Gale, F. Who Will China Feed? Amber Waves 2008, 6, 10–15. [Google Scholar]
- Zhao, C.; Liu, B.; Piao, S.; Wang, X.; Lobell, D.B.; Huang, Y.; Huang, M.; Yao, Y.; Bassu, S.; Ciais, P.; et al. Temperature increase reduces global yields of major crops in four independent estimates. Proc. Natl. Acad. Sci. USA 2017, 114, 9326–9331. [Google Scholar] [CrossRef] [PubMed] [Green Version]
- Yuan, W.; Liu, S.; Liu, W.; Zhao, S.; Dong, W.; Tao, F.; Chen, M.; Lin, H. Opportunistic market-driven regional shifts of cropping practices reduce food production capacity of China. Earth Future 2018, 6, 634–642. [Google Scholar] [CrossRef] [Green Version]
- Chen, X.; Cui, Z.; Fan, M.; Vitousek, P.; Zhao, M.; Ma, W.; Wang, Z.; Zhang, W.; Yan, X.; Yang, J. Producing more grain with lower environmental costs. Nature 2014, 514, 486–489. [Google Scholar] [CrossRef] [PubMed]
- Carter, C.A. China’s agriculture: Achievements and challenges. Areupdate 2011, 14, 5–7. [Google Scholar]
- Brown, L.R. Who will feed China? World Watch 1994, 7, 10–19. [Google Scholar]
- Newman, M.E.J. The structure and function of complex networks. Siam Rev. 2003, 45, 167–256. [Google Scholar] [CrossRef] [Green Version]
- Geng, J.-B.; Ji, Q.; Fan, Y. A dynamic analysis on global natural gas trade network. Appl. Energy 2014, 132, 23–33. [Google Scholar] [CrossRef]
- Brey, J.J.; Prados, A. Stretched exponential decay at intermediate times in the one-dimentional ising model at low temperatures. Phys. A Stat. Mech. Appl. 1993, 197, 569–582. [Google Scholar] [CrossRef]
- FAO. FAOSTAT. 2018. Available online: http://www.fao.org/faostat/en/ (accessed on 21 December 2018).
- Godfray, H.C.J.; Beddington, J.R.; Crute, I.R.; Haddad, L.; Lawrence, D.; Muir, J.F.; Pretty, J.; Robinson, S.; Thomas, S.M.; Toulmin, C. Food security: The challenge of feeding 9 billion people. Science 2010, 327, 812–818. [Google Scholar] [CrossRef] [Green Version]
- Chen, G.Q.; Han, M.Y. Global supply chain of arable land use: Production-based and consumption-based trade imbalance. Land Use Policy 2015, 49, 118–130. [Google Scholar] [CrossRef]
- Kastner, T.; Rivas, M.J.I.; Koch, W.; Nonhebel, S. Global changes in diets and the consequences for land requirements for food. Proc. Natl. Acad. Sci. USA 2012, 109, 6868–6872. [Google Scholar] [CrossRef] [PubMed] [Green Version]
- Defries, R.S.; Rudel, T.; Uriarte, M.; Hansen, M. Deforestation driven by urban population growth and agricultural trade in the twenty-first century. Nat. Geosci. 2010, 3, 178–181. [Google Scholar] [CrossRef]
- Kastner, T.; Erb, K.-H.; Nonhebel, S. International wood trade and forest change: A global analysis. Glob. Environ. Chang. 2011, 21, 947–956. [Google Scholar] [CrossRef]
- Huang, H.; Von Lampe, M.; Van Tongeren, F. Climate change and trade in agriculture. Food Policy 2011, 36, S9–S13. [Google Scholar] [CrossRef]
- Suweis, S.; Rinaldo, A.; Maritan, A.; D’odorico, P. Water-controlled wealth of nations. Proc. Natl. Acad. Sci. USA 2013, 110, 4230–4233. [Google Scholar] [CrossRef] [Green Version]
- Headey, D. Rethinking the global food crisis: The role of trade shocks. Food Policy 2011, 36, 136–146. [Google Scholar] [CrossRef]
- Michael, J.P.; Satyajit, B.; So Young, C.; Benjamin, I.C. Assessing the evolving fragility of the global food system. Environ. Res. Lett. 2015, 10, 024007. [Google Scholar] [CrossRef]
- Huang, J.-K.; Wei, W.; Cui, Q.; Xie, W. The prospects for China’s food security and imports: Will China starve the world via imports? J. Integr. Agric. 2017, 16, 2933–2944. [Google Scholar] [CrossRef]
- Tuninetti, M.; Tamea, S.; Laio, F.; Ridolfi, L. To trade or not to trade: Link prediction in the virtual water network. Adv. Water Resour. 2016, 110, 528–537. [Google Scholar] [CrossRef]
- Tamea, S.; Carr, J.A.; Laio, F.; Ridolfi, L. Drivers of the virtual water trade. Water Resour. Res. 2014, 50, 17–28. [Google Scholar] [CrossRef]
Figure 1.
Change process of agricultural trade: (a) physical volume; (b) value volumes.

Figure 2.
Cumulative distribution of node degree and strength probability of the two networks: (a) node degree; (b) node strength of the physical network; (c) node strength of the value network.
Figure 2.
Cumulative distribution of node degree and strength probability of the two networks: (a) node degree; (b) node strength of the physical network; (c) node strength of the value network.

Figure 3.
Change trend of density (a), clustering coefficient (b), and average path length (c) of the agricultural trade network.
Figure 3.
Change trend of density (a), clustering coefficient (b), and average path length (c) of the agricultural trade network.

Figure 4.
Structure of global agricultural trade in volume and value (a,b,d,e) and values per weight (c,f) in 1986 and 2016.
Figure 4.
Structure of global agricultural trade in volume and value (a,b,d,e) and values per weight (c,f) in 1986 and 2016.

Figure 5.
Pyramids based on node strength in two trade networks. USSR is the former Union of Soviet Socialist Republics.
Figure 5.
Pyramids based on node strength in two trade networks. USSR is the former Union of Soviet Socialist Republics.

Figure 6.
Agricultural trade network structures between major countries: (a) 1986; (b) 2016. USSR is the former Union of Soviet Socialist Republics.
Figure 6.
Agricultural trade network structures between major countries: (a) 1986; (b) 2016. USSR is the former Union of Soviet Socialist Republics.


Table 1.
The fitting function of the cumulative degree and strength of physical and strength of the network.
Table 1.
The fitting function of the cumulative degree and strength of physical and strength of the network.
| Year | Node Degree in Two Networks | Node Strength in Physical Network | Node Strength in Value Network | |||
|---|---|---|---|---|---|---|
| −β | R2 | −γ | R2 | −γ | R2 | |
| 1986 | −0.430 | 0.860 *** | −0.151 | 0.770 *** | 0.167 | 0.771 *** |
| 1990 | 0.443 | 0.900 *** | −0.142 | 0.748 *** | 0.173 | 0.790 *** |
| 1995 | −0.432 | 0.872 *** | −0.158 | 0.757 *** | 0.182 | 0.787 *** |
| 2000 | −0.373 | 0.803 *** | −0.143 | 0.718 *** | 0.149 | 0.696 *** |
| 2005 | −0.387 | 0.817 *** | −0.139 | 0.709 *** | 0.165 | 0.750 *** |
| 2010 | −0.300 | 0.674 *** | −0.140 | 0.723 *** | 0.168 | 0.767 *** |
| 2016 | −0.351 | 0.828 *** | −0.142 | 0.735 *** | 0.162 | 0.761 *** |
*** Denotes significant at 1% level.
© 2019 by the authors. Licensee MDPI, Basel, Switzerland. This article is an open access article distributed under the terms and conditions of the Creative Commons Attribution (CC BY) license (http://creativecommons.org/licenses/by/4.0/).
Share and Cite
MDPI and ACS Style
Qiang, W.; Niu, S.; Wang, X.; Zhang, C.; Liu, A.; Cheng, S. Evolution of the Global Agricultural Trade Network and Policy Implications for China. Sustainability 2020, 12, 192. https://0-doi-org.brum.beds.ac.uk/10.3390/su12010192
AMA Style
Qiang W, Niu S, Wang X, Zhang C, Liu A, Cheng S. Evolution of the Global Agricultural Trade Network and Policy Implications for China. Sustainability. 2020; 12(1):192. https://0-doi-org.brum.beds.ac.uk/10.3390/su12010192
Chicago/Turabian StyleQiang, Wenli, Shuwen Niu, Xiang Wang, Cuiling Zhang, Aimin Liu, and Shengkui Cheng. 2020. "Evolution of the Global Agricultural Trade Network and Policy Implications for China" Sustainability 12, no. 1: 192. https://0-doi-org.brum.beds.ac.uk/10.3390/su12010192
Note that from the first issue of 2016, this journal uses article numbers instead of page numbers. See further details here.