Impact of Apartment Tightness on the Concentrations of Toxic Gases Emitted During a Fire

1
Institute of Safety Engineering, The Main School of Fire Service, 01-629 Warsaw, Poland
2
Teaching Department, The Central School of State Fire Service, 42-200 Częstochowa, Poland
*
Author to whom correspondence should be addressed.
Sustainability 2020, 12(1), 223; https://0-doi-org.brum.beds.ac.uk/10.3390/su12010223
Submission received: 28 October 2019
/
Revised: 9 December 2019
/
Accepted: 23 December 2019
/
Published: 26 December 2019
(This article belongs to the Special Issue Green Technologies in Air Treatment)
Abstract
:Due to the thermal modernization process of old residential buildings, there has been a significant increase in the air-tightness of apartments, which may contribute to the deterioration of the safety of users and rescue teams in a fire, for example, the emergence of a very dangerous backdraft phenomenon. The aim of the study was to investigate the impact of air-tightness of premises on selected fire parameters in particular toxic gas concentrations, which is the most common cause of deaths of people due to fires. In the research, an experimental method was used, consisting of the measurement of concentrations of gases such as oxygen, carbon monoxide and dioxide, hydrogen sulfide, propylene, acetylene, hydrogen and nitric oxide, and dioxide, which most often give off during a fire due to modern interior design materials. Two fire tests were carried out, one in a sealed apartment and the other unsealed (one window wing half-open). The concentrations of the previously mentioned gases obtained in both tests are presented and then compared with each other. Based on the analysis, conclusions have been formulated, which suggest that increasing the tightness may increase the toxicity of the fire environment.
1. Introduction
Contemporary research indicates that improper thermal insulation of buildings and improperly functioning ventilation in a building will affect faster fire growth, achieving higher heat release rates, and higher temperatures, and thus a shorter time to achieve flashover, or increase the likelihood of a backward flame (backdraft) or smoke explosion [1]. Toxic thermal decomposition and combustion products are primarily contained in smoke, which is one of the first factors directly threatening people during a fire. Research conducted worldwide in this area confirms the fact that carbon monoxide is responsible for the majority of fire victims, and its enhanced effect is caused by hyperventilation due to carbon dioxide and oxygen deficiency causing hypoxia [2]. The impact of fire gases on the health and life of people in a fire environment is essential. It is known from statistical data that about 80% of fire victims suffer death due to the inhalation of toxic products of the decomposition and combustion of synthetic polymer materials, which have a suffocating, irritating, and narcotic effect [3]. The basic products of their thermal decomposition and combustion, which are most often the cause of death, include carbon monoxide (CO), hydrogen cyanide (HCN), hydrogen chloride (HCl), sulfur and nitrogen oxides (SOx, NOx), carbon dioxide (CO2), compounds phosphorus, organic irritants (formaldehyde, acroleins), and smoke particles, i.e., soot or aerosols. [4,5]
The toxicity of the fire environment (mainly smoke) is affected by its individual development phases, e.g., smoldering fire with flameless combustion or an early well ventilated fire with flame combustion, or a phase of post-flashover fire with flame burning, physicochemical parameters of materials and construction products (e.g., containing flame retardants), as well as ventilation efficiency [3]. If the burning material will contain nitrogen in its composition, e.g., PUR/PIR foams, there will be compounds in the smoke, such as hydrogen cyanide (HCN), ammonia (NH3), and nitrogen oxides (NO, NO2) [4]. In turn, when burning PVC there will be, for example, hydrogen chloride (HCl) and hydrogen bromide (HBr) in the smoke. The content in the fire smoke of these substances causes an irritating and stifling effect on the human body, e.g., after less than 30 s, loss of orientation (soot content), eye irritation (irritant gases), and difficulty in breathing (stifling gases). Irritant gases such as HCl, HBr, HF, NOx, or acrolein and formaldehyde may, depending on the dose absorbed, cause inflammation and pulmonary edema, and even after a few hours of exposure may lead to death. In contrast, asphyxiation gases, i.e., CO, HCN, CO2, or a low oxygen concentration, from the moment of absorption of the limit dose value cause confusion and then loss of consciousness [5,6]. Physiological and pathological (disorderly pathological) effects of toxicity of the fire environment were investigated by Purser, among others, on the example of a chair fire. The effects of the physiological impact of this environment are visible at a rapid pace (seconds, minutes) and directly affect vital functions such as breathing, pain, vision, circulation, brain function (awareness, ability to move), and can lead to death. In contrast, pathological effects are characterized by slow development (hours, days, years), affecting the life functions of human organs in the long term [7,8]. A few thematic researches related to this publication should be mentioned here. The first relates to fire experiments carried out in a 22-story residential building on 25 and 26 July 2006, in Dalmarnock, one of Glasgow’s suburbs in Scotland. One of their main goals was to analyze the dynamics of fire in a real building and its impact on the building structure, as well as to determine the impact of various ventilation configurations [9,10,11]. Another example is a research conducted by French scientists in September and October 2011 in France. They included two fire scenarios in a single room equipped with standard furniture and other elements characteristic of a typical bedroom. A measuring system including thermocouples, heat flux density meters, gas analyzers, opacimeter, and several video cameras was used. In the first scenario, it was assumed that the source of fire is a cigarette in the bed, from which the quilt and mattress are ignited in turn. The windows and doors in this case were closed, so due to the lack of sufficient oxygen there was no flashover and the fire was suppressed quite quickly. In the second scenario, the fire source was a rubbish bin. Due to the open door to the room, the amount of oxygen was sufficient for a rapid increase of fire and flashover. The obtained results could be used to validate computer fire models [12]. The latest publication, focused on ship fires, has the form of a report prepared by scientist of the University of Lund in Sweden. It is devoted to the study of the impact of room tightness on fire development. A 20-foot container was used in the experiment. In addition, analytical calculations and simulation tests were also carried out using the FDS program. From the point of view of the fire safety of people, it has been shown that the use of thermal insulation currently common in residential construction has an impact on the parameters of the fire environment, such as temperature and gas concentrations, as well as the time of occurrence of flashover phenomenon [13]. This publication is at the same time a continuation and extension of research related to the impact of better thermal insulation, and thus, the tightness of modern apartments on the parameters of the fire environment and in particular the concentration of toxic gases.
2. Methodology of the Tests
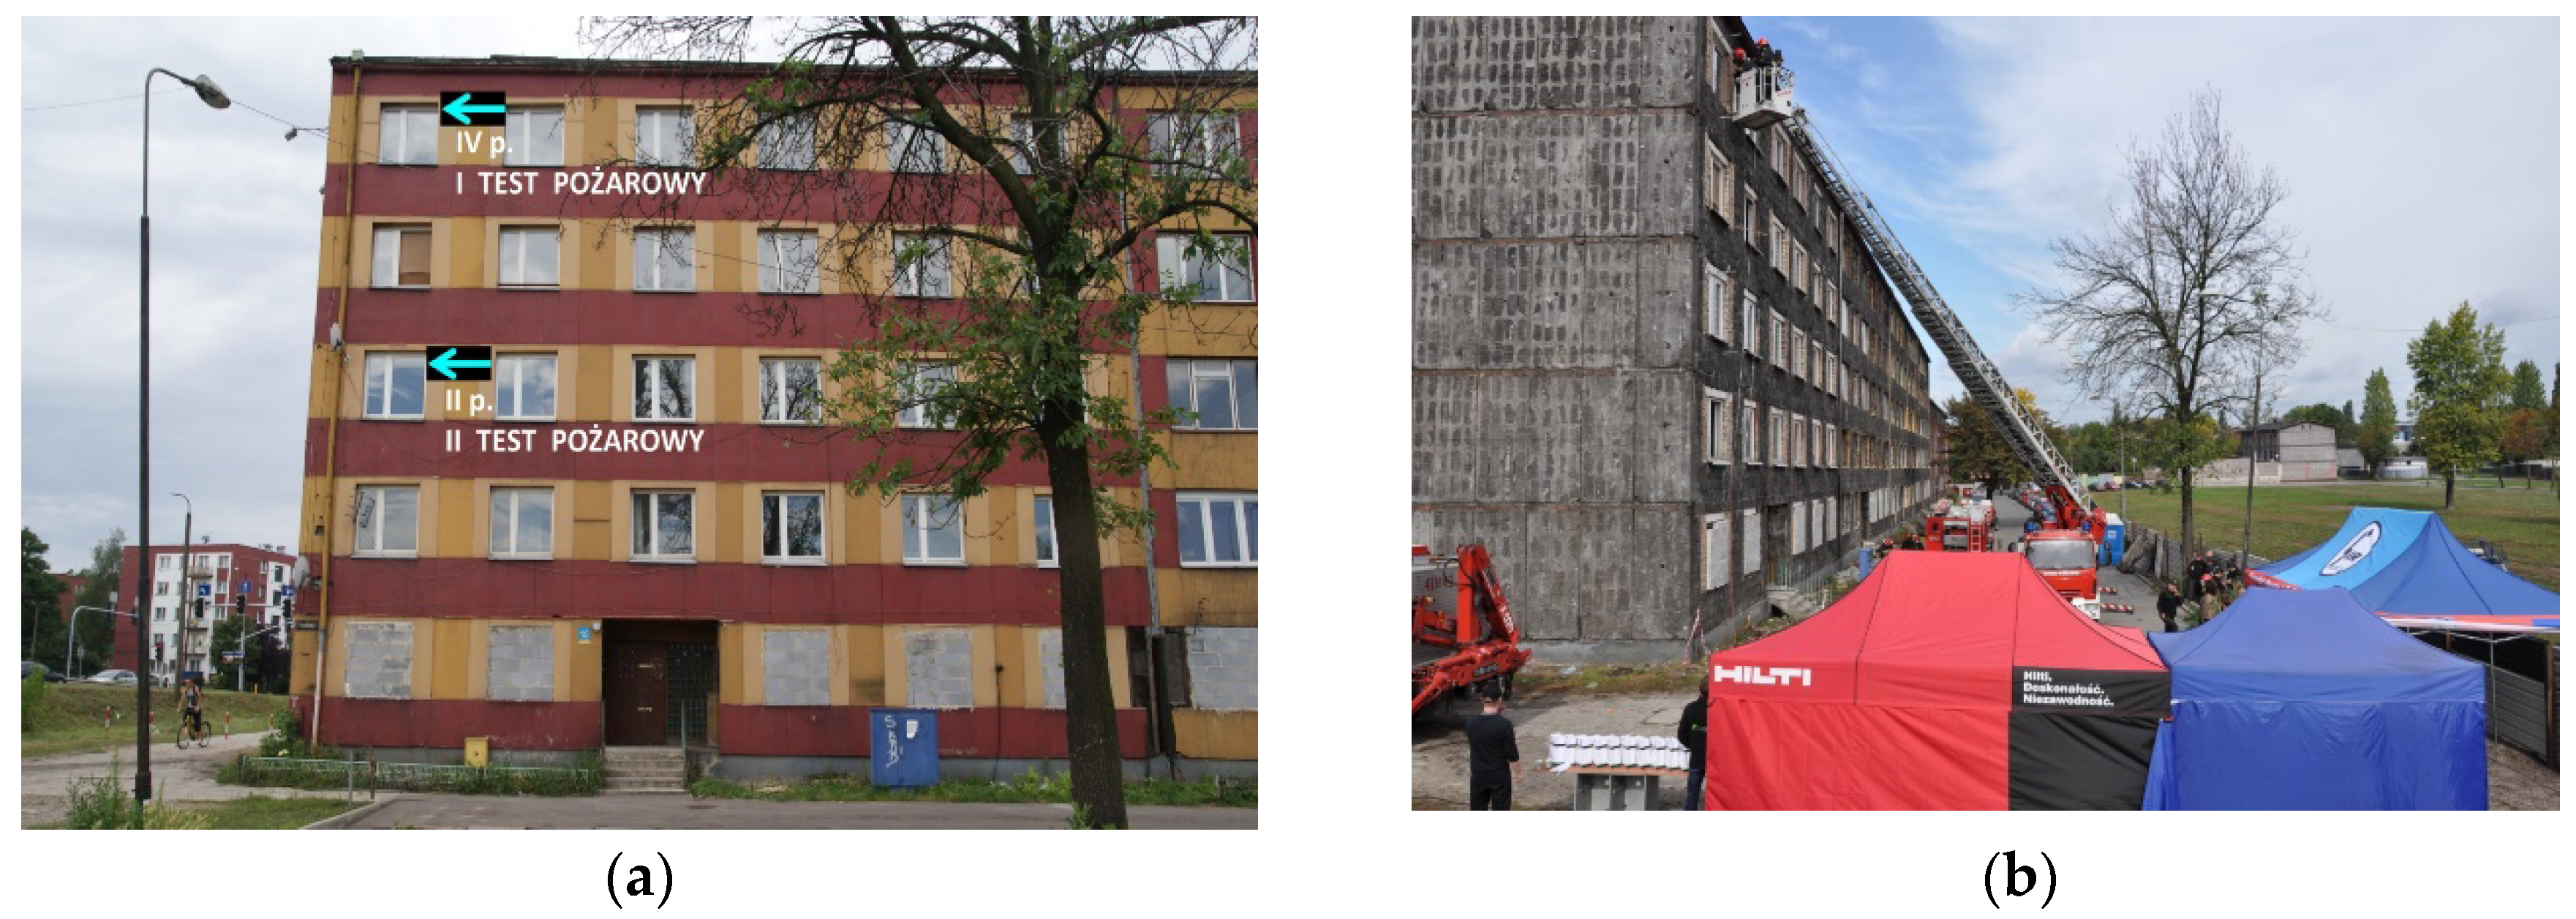
Taking under consideration a great number of fires and interventions related to the occurrence of carbon monoxide and other toxic gases, this research tried to examine the impact of apartment air-tightness on fire toxicity in residential buildings. The experiment was carried out in a 5-story example building located in Bytom (Silesian District, Poland). It was built in 1976, made in the technology of a prefabricated reinforced concrete slabs (after removing the facade slabs, it turned out that the building was additionally made of aerated concrete blocks, i.e., gray cellular concrete). The pictures of the building before and after removing the facade panels are presented in Figure 1a,b respectively.
Two full-scale fire tests were conducted in the building, where two fire scenarios were assumed for
- A sealed part of apartment No. 19 (poorly ventilated) located on the fourth floor with an area of 36.56 m2 (cubic capacity 91.4 m3). In a further part of the research it will be marked as the first test (I test in the figures and tables);
- An unsealed part of apartment No. 11 located on the second floor with an area of 37.59 m2 (cubic capacity of 93.9 m3). In the next part of the research it will be marked as the second test (II test in the figures and tables).
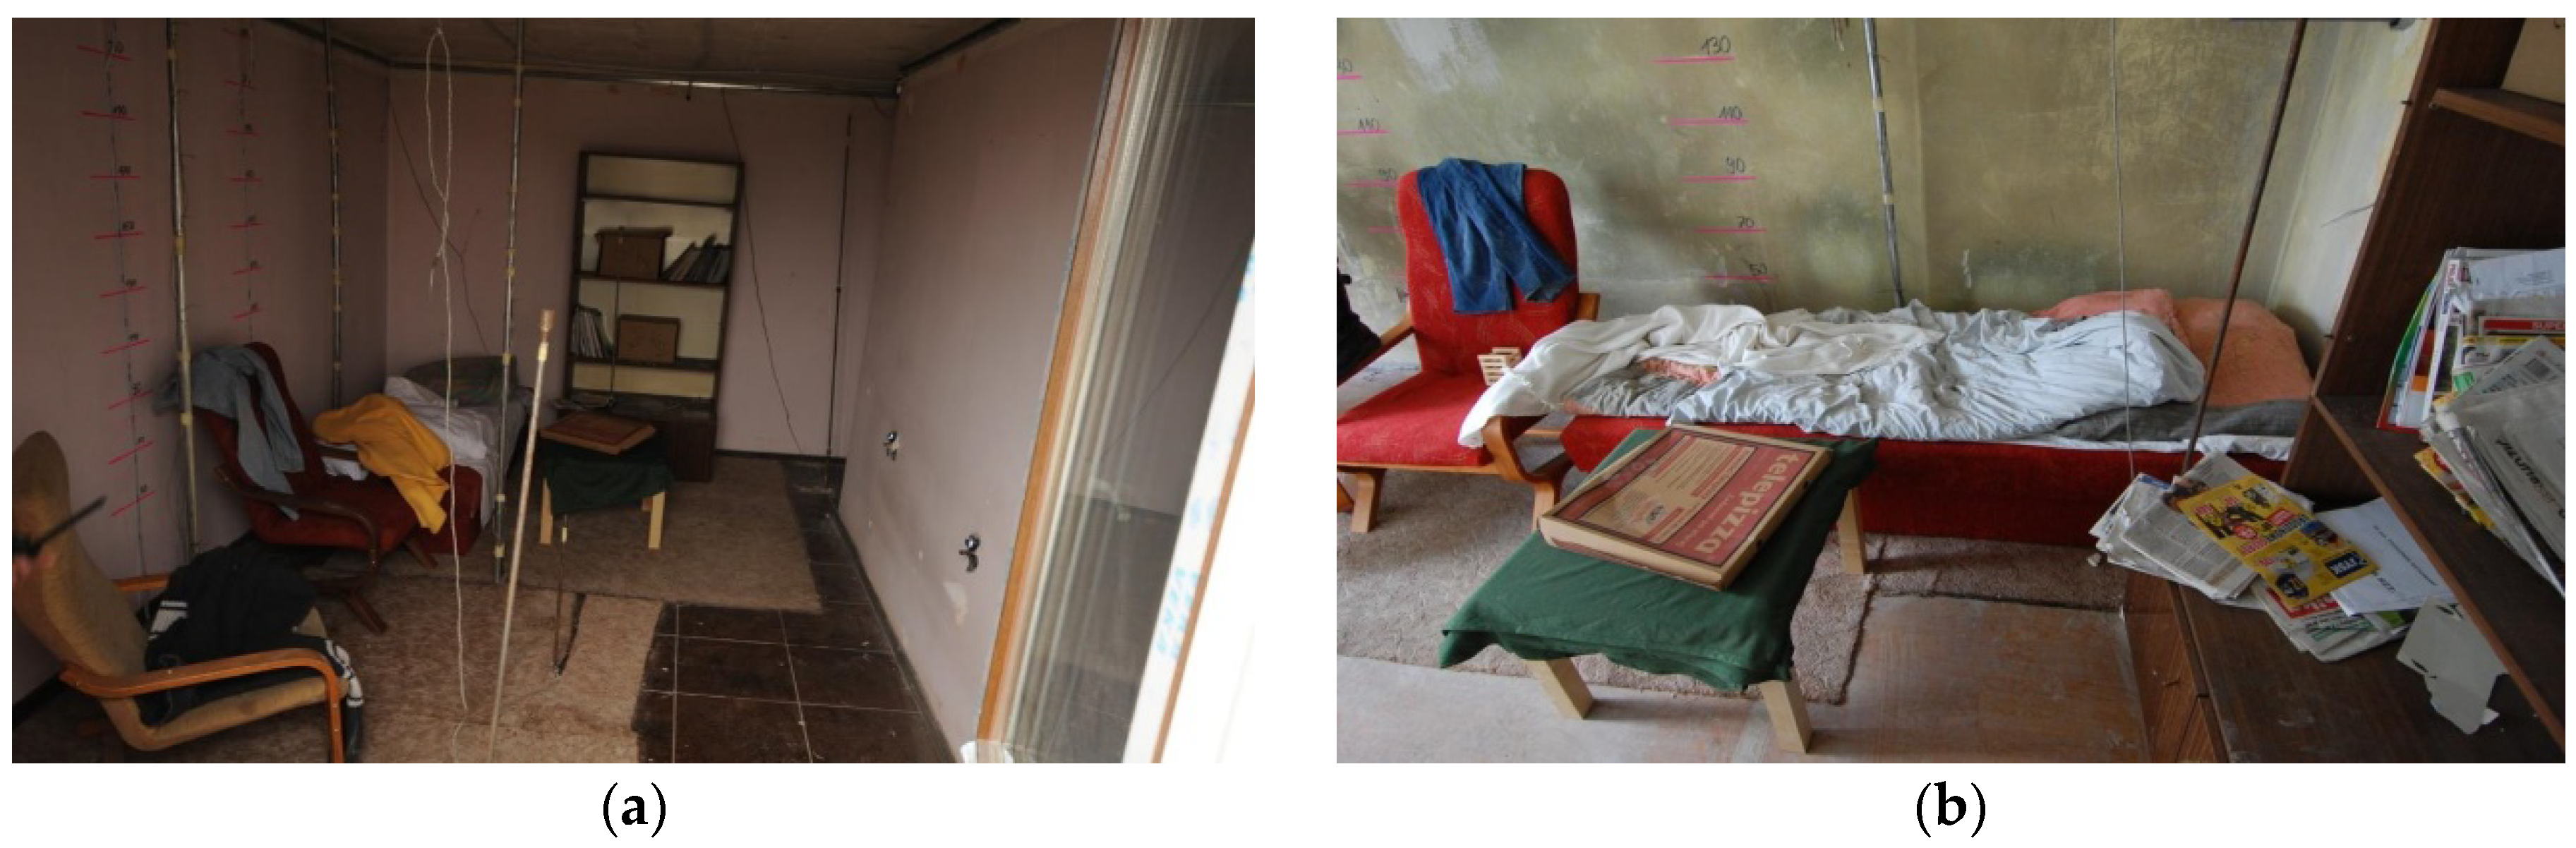
In the sealed apartments (the first test) the following configuration of ventilation openings was used: All windows and doors to the apartment were closed, all interior doors were fully open, the vent in the kitchen with dimensions of 14 × 14 cm was open, while closed in the bathroom. The only difference between both apartments was one window sash of size 915 × 1425 cm open 20 cm wide in unsealed apartment. The window was located on the north side. During both tests the wind was blowing from the west, but its speed was higher during the fire test in the unsealed premises (4.5 m/s) than the sealed (1.5 m/s). In both apartments, the furniture and their settings were identical. They were made to order from the same materials and according to the same pattern. They were used during full-scale fire tests and in standard conditions in the fire laboratory. Each apartment was equipped with the following combustible materials: couch, two armchairs, wall unit, table, blanket, bedding set, tablecloth, pair of trousers, sweater, curtain, and carpet covering 7.5 m2. Due to the fact that during the tests the fire was located and no flashover occurred in the entire fire zone, in accordance with the Polish standard PN-B-02852:2001, the actual surface on which the combustible material was located was used to determine the fire load density. It was about 306 MJ/m2 for this area (approximately 9 m2) and on average 179 MJ/m2 for the entire room area (approximately 15 m2). Measuring stations for the current registration of results during fire tests were located in rooms directly below the examined apartments, i.e., on the first floor during the first test and on the third floor during the second test. Pictures of two rooms before the fire tests are shown in Figure 2 (sealed in Figure 2a and unsealed in Figure 2b).
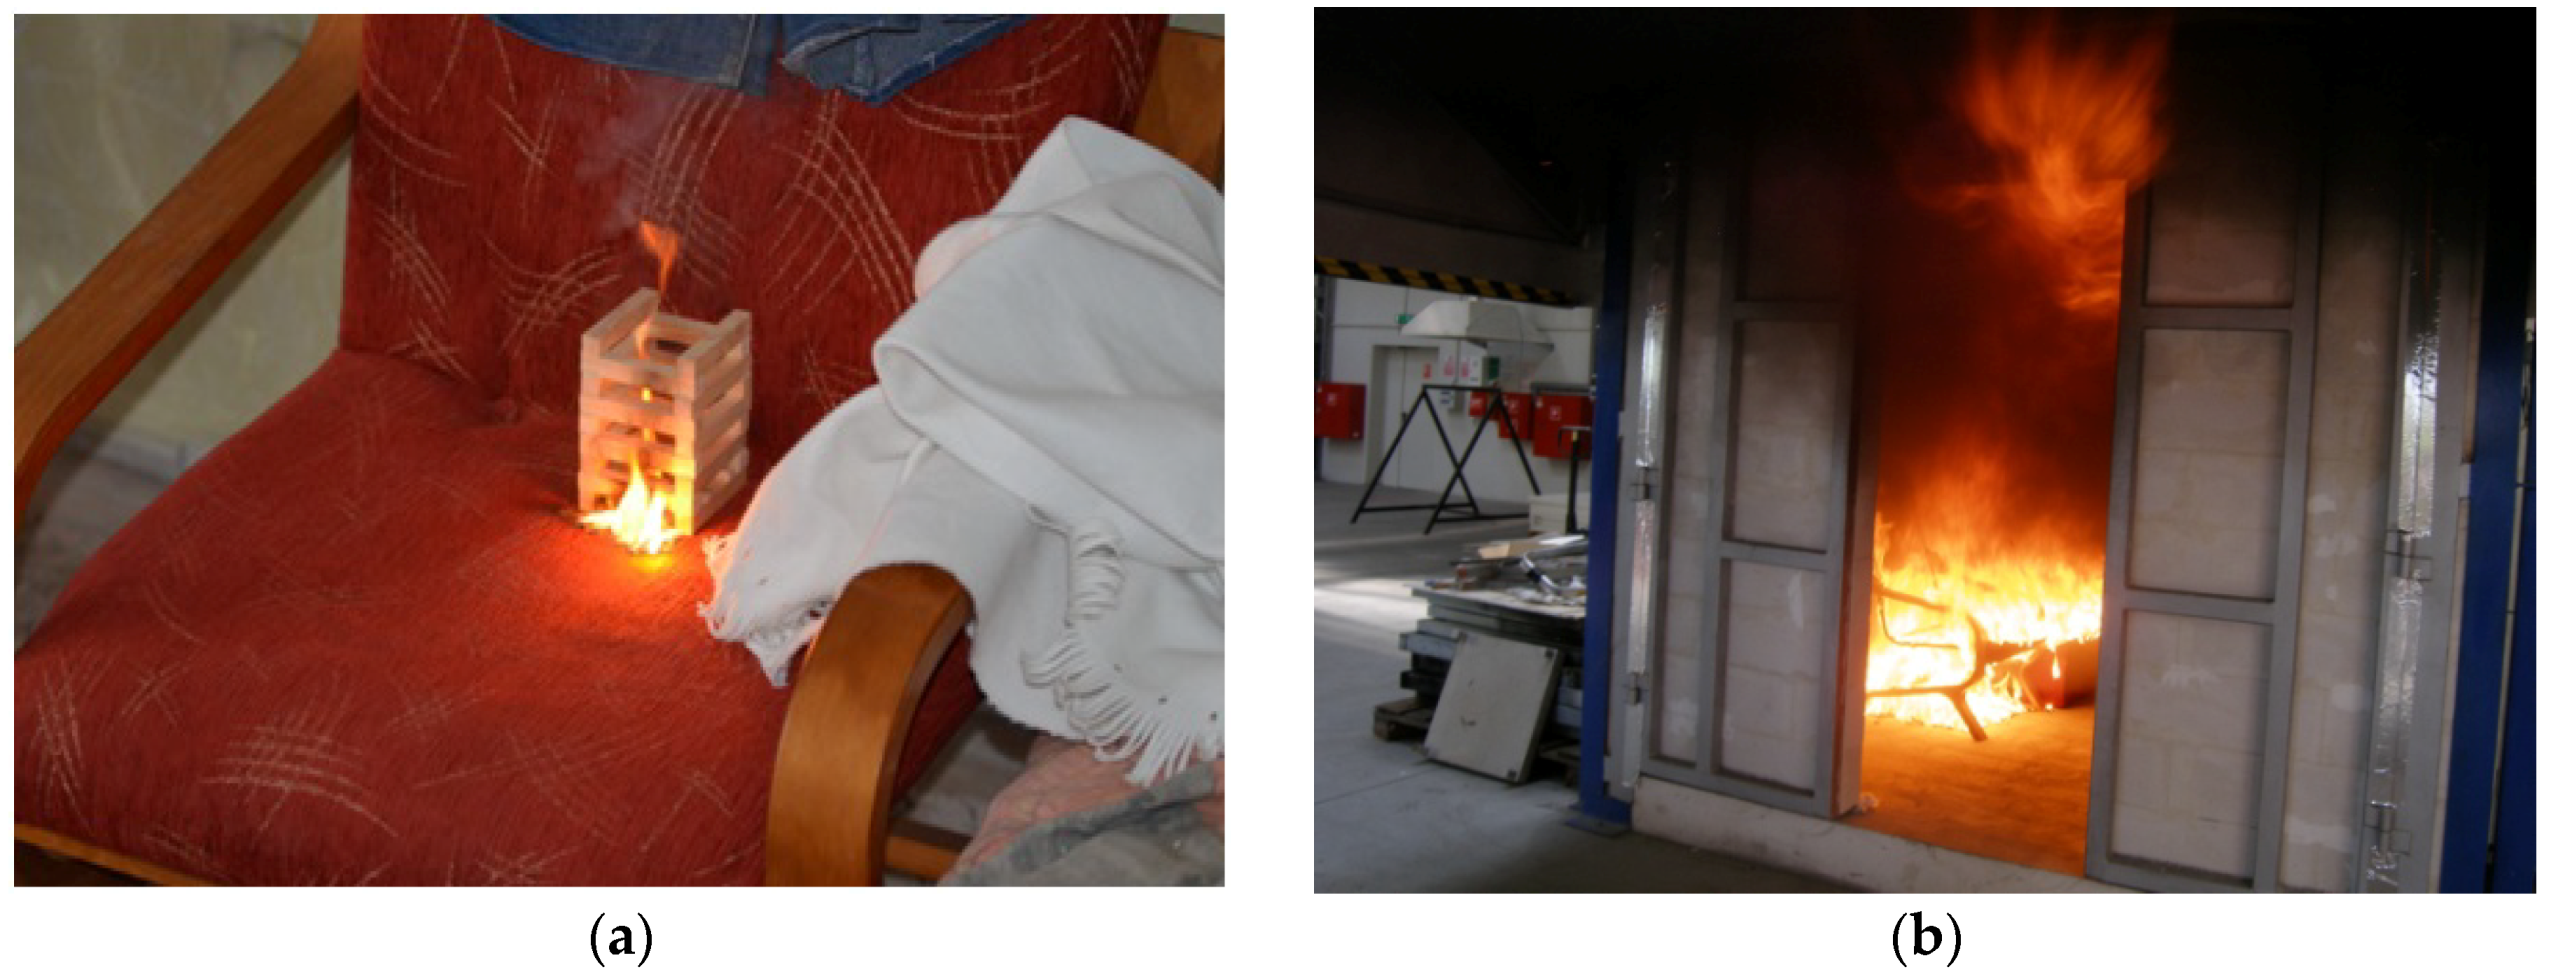
The ignition sources and their location (the seat of the chair next to the bed) during full scale fire tests were identical for both apartments. They consist of two elements:
- Spruce wood pile made in accordance with British BS 5852 “wood crib 7” (combustion heat 2110 kJ, flame height 345–490 mm, heat flux 25 kW/m2, fuel supply indicator 32 g min−1, 90% weight loss, time 375 s, burning time 390 s);
- ROTHENBERGER soldering torch with a disposable container with the MULTIGAS 300 propane/butane gas mixture (35% propane, 65% butane). Technical data: flame temperature up to 1900 °C. Container 600 mL/338 g, No.3.5510, designed for all soldering torches and ROTHENBERGER instruments equipped with a connection made according to DIN EN 417. The containers are filled with purified gas. Gas is harmless to the earth’s ozone layer, FCKW-free, TÜV certified.
The place and source of ignition are shown in Figure 3a. The development of the tested fire in the unsealed apartment is compatible with the HRR (Heat Release Ratio) curve (presented in the next section) obtained by the furniture calorimeter method in accordance with PN-ISO 9705. A picture of the laboratory room during test is shown in the Figure 3b.
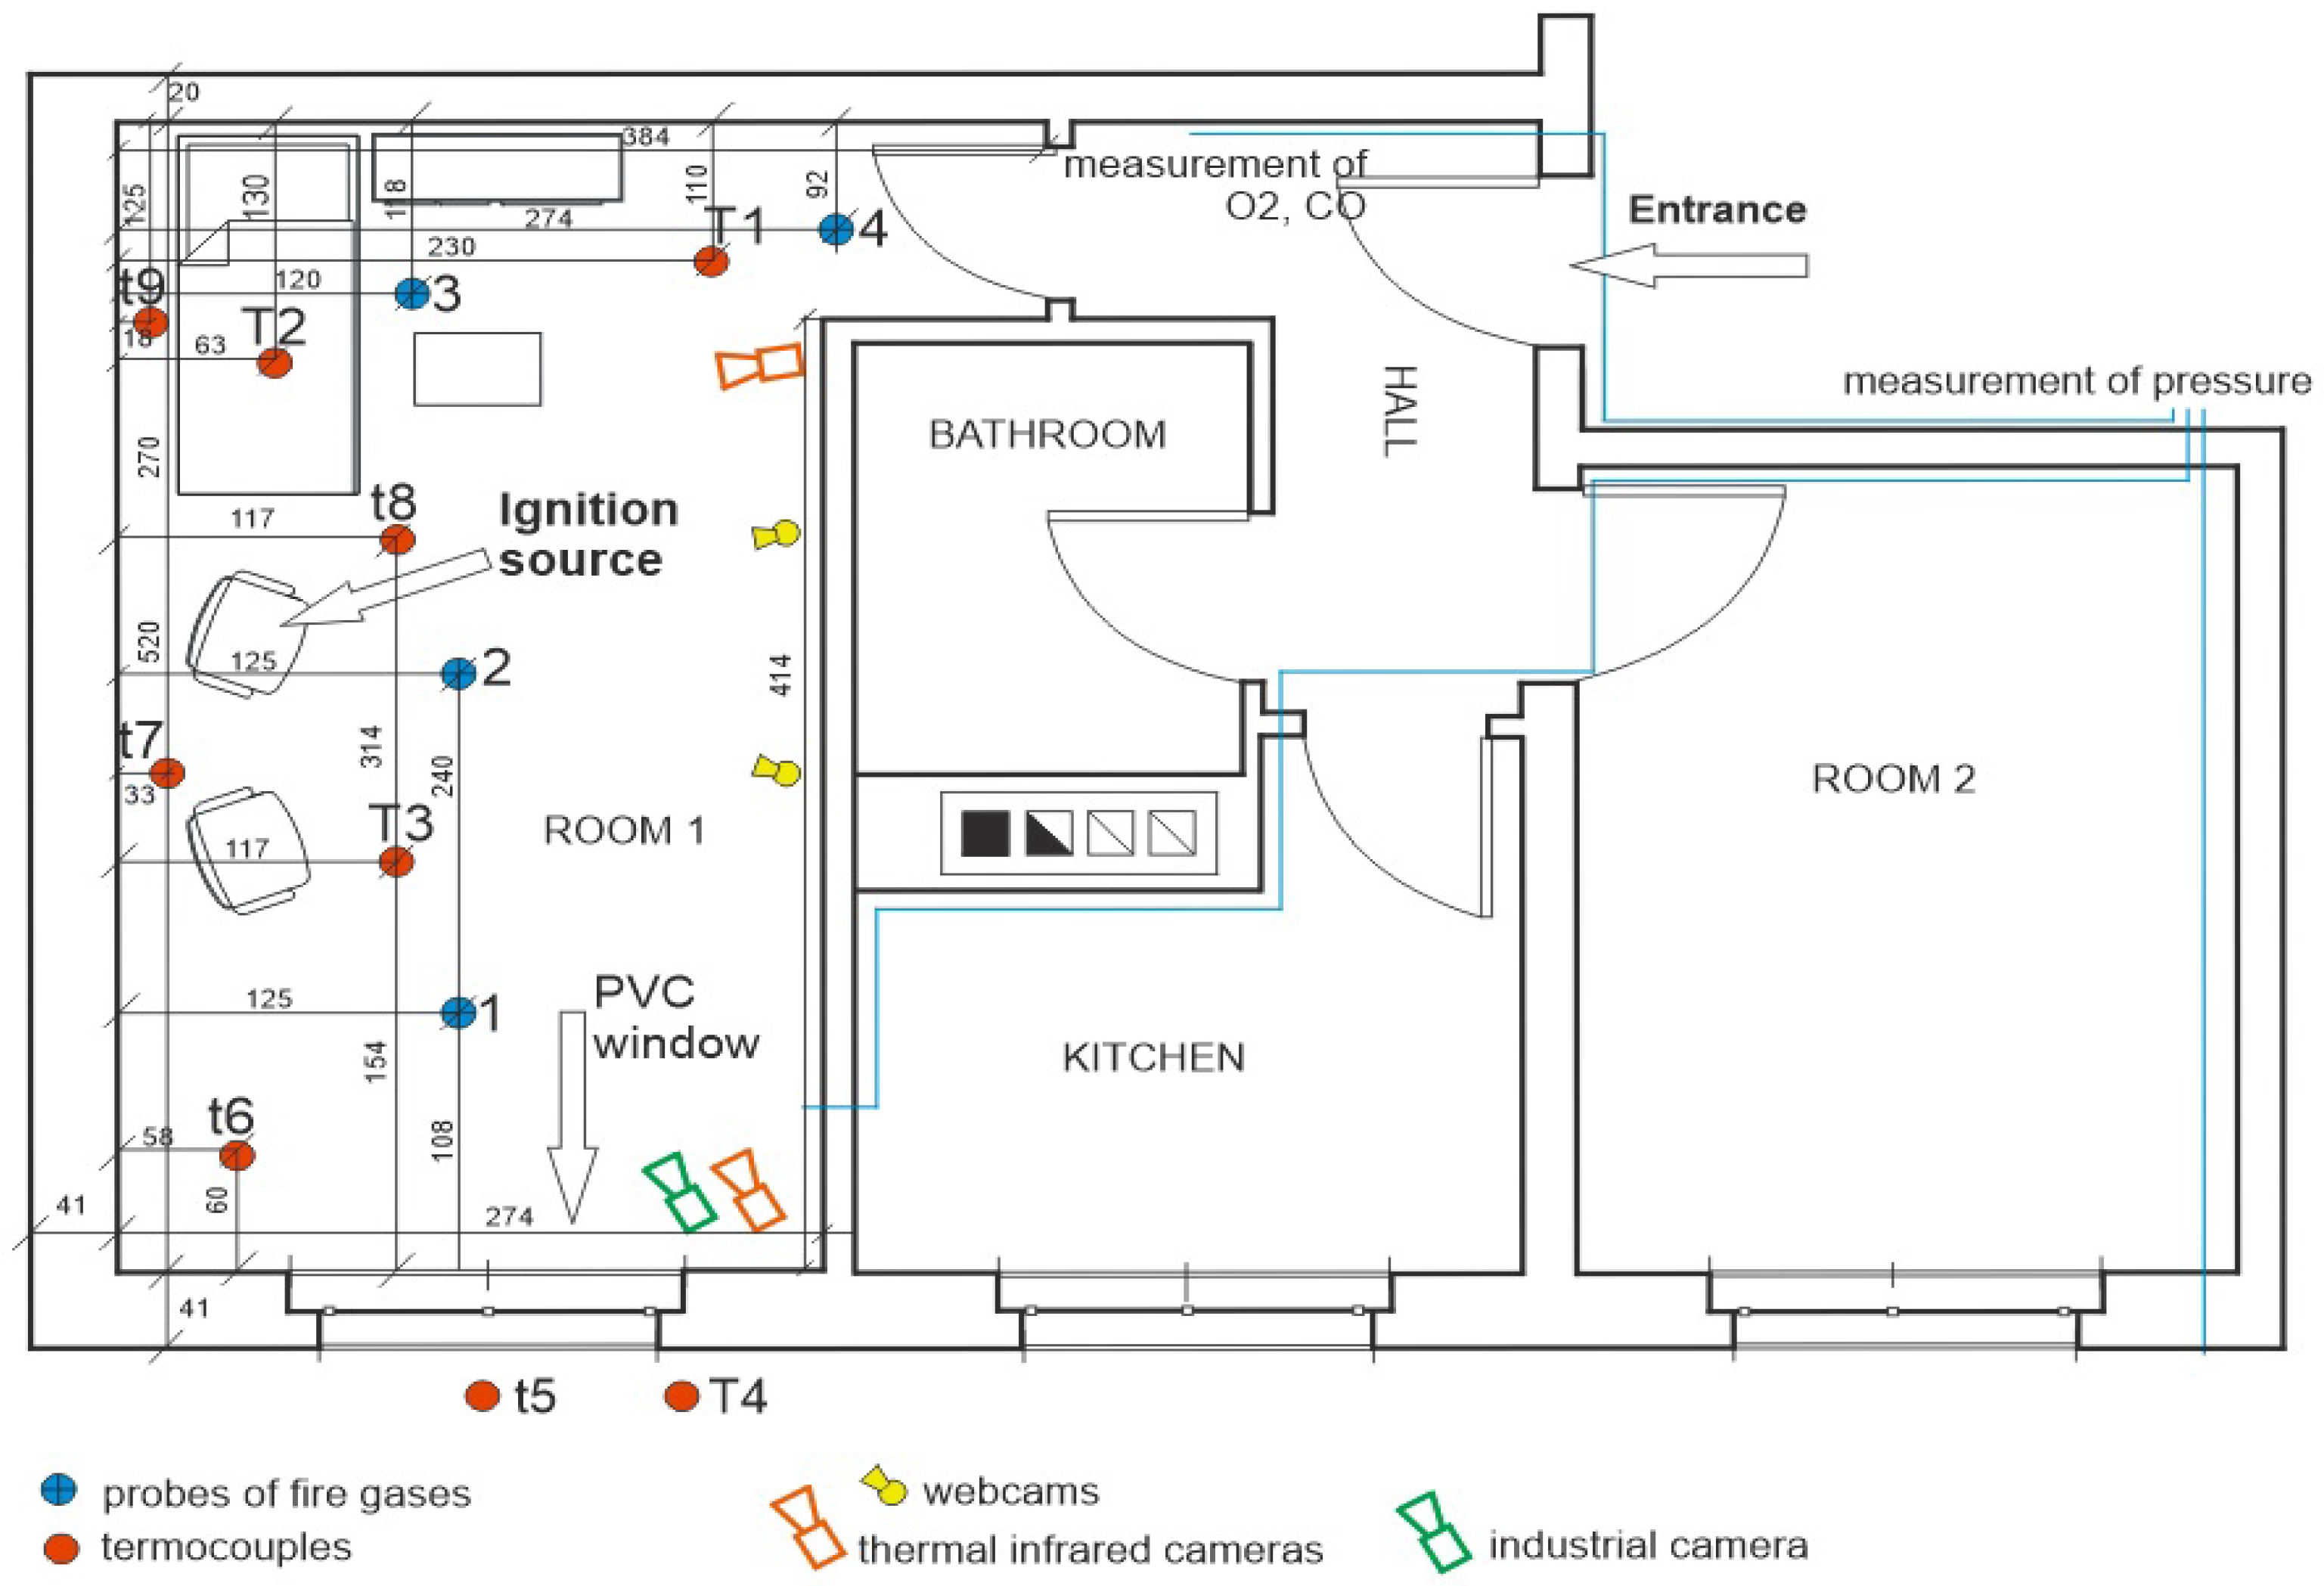
Example of the distribution of metal probes for measuring fire gases, thermocouples, and cameras are shown in Figure 4.
During two fire tests, the concentrations of the following fire gases were recorded in both rooms: CO, CO2, SO2, HCH, NO2, NO, H2S, HCL, O2, CH4, H2, N2, C2H2, C2H4, C3H6, C2H6, C3H8, and -C4H10, n-C4H10. In addition, O2 and CO were measured in the hall. Four probes were placed in each of the examined apartments: one at the floor at a height of 90 cm (probe No. 2), two at a height of 160 cm (probe No. 1 and 3), and one under the ceiling (ceiling) at a height of 230 cm (probe No. 4). A test hose was connected to the measuring probes, with which gas samples were taken using suction and pressure pumps. The test hoses were connected tightly to Dräger measuring instruments: X-am 5600, Pac III.
The following measuring apparatus intended for measuring the concentration of toxic gases and oxygen was used in the tests:
- Agilent 7890A gas chromatographs equipped with FID detectors, TCD, methanizer, and carboxyl capillary columns—CarbonPlot;
- X-am 5600 Dräger multi-channel gas analyzer (O2, CO2, CO);
- Pac III single-channel gas analyzers from Dräger (H2s, NO, NO2, SO2);
- Suction and pressure pump for taking gas samples;
- Four metal sampling probes in each of the examined apartments;
- Sampling hose;
- Tedlar sacks;
- IMR 1400 fire gas analyzer for measuring O2%, CO ppm, CO2%, NO ppm, NOx ppm, SO2 ppm, and °C air temperature;
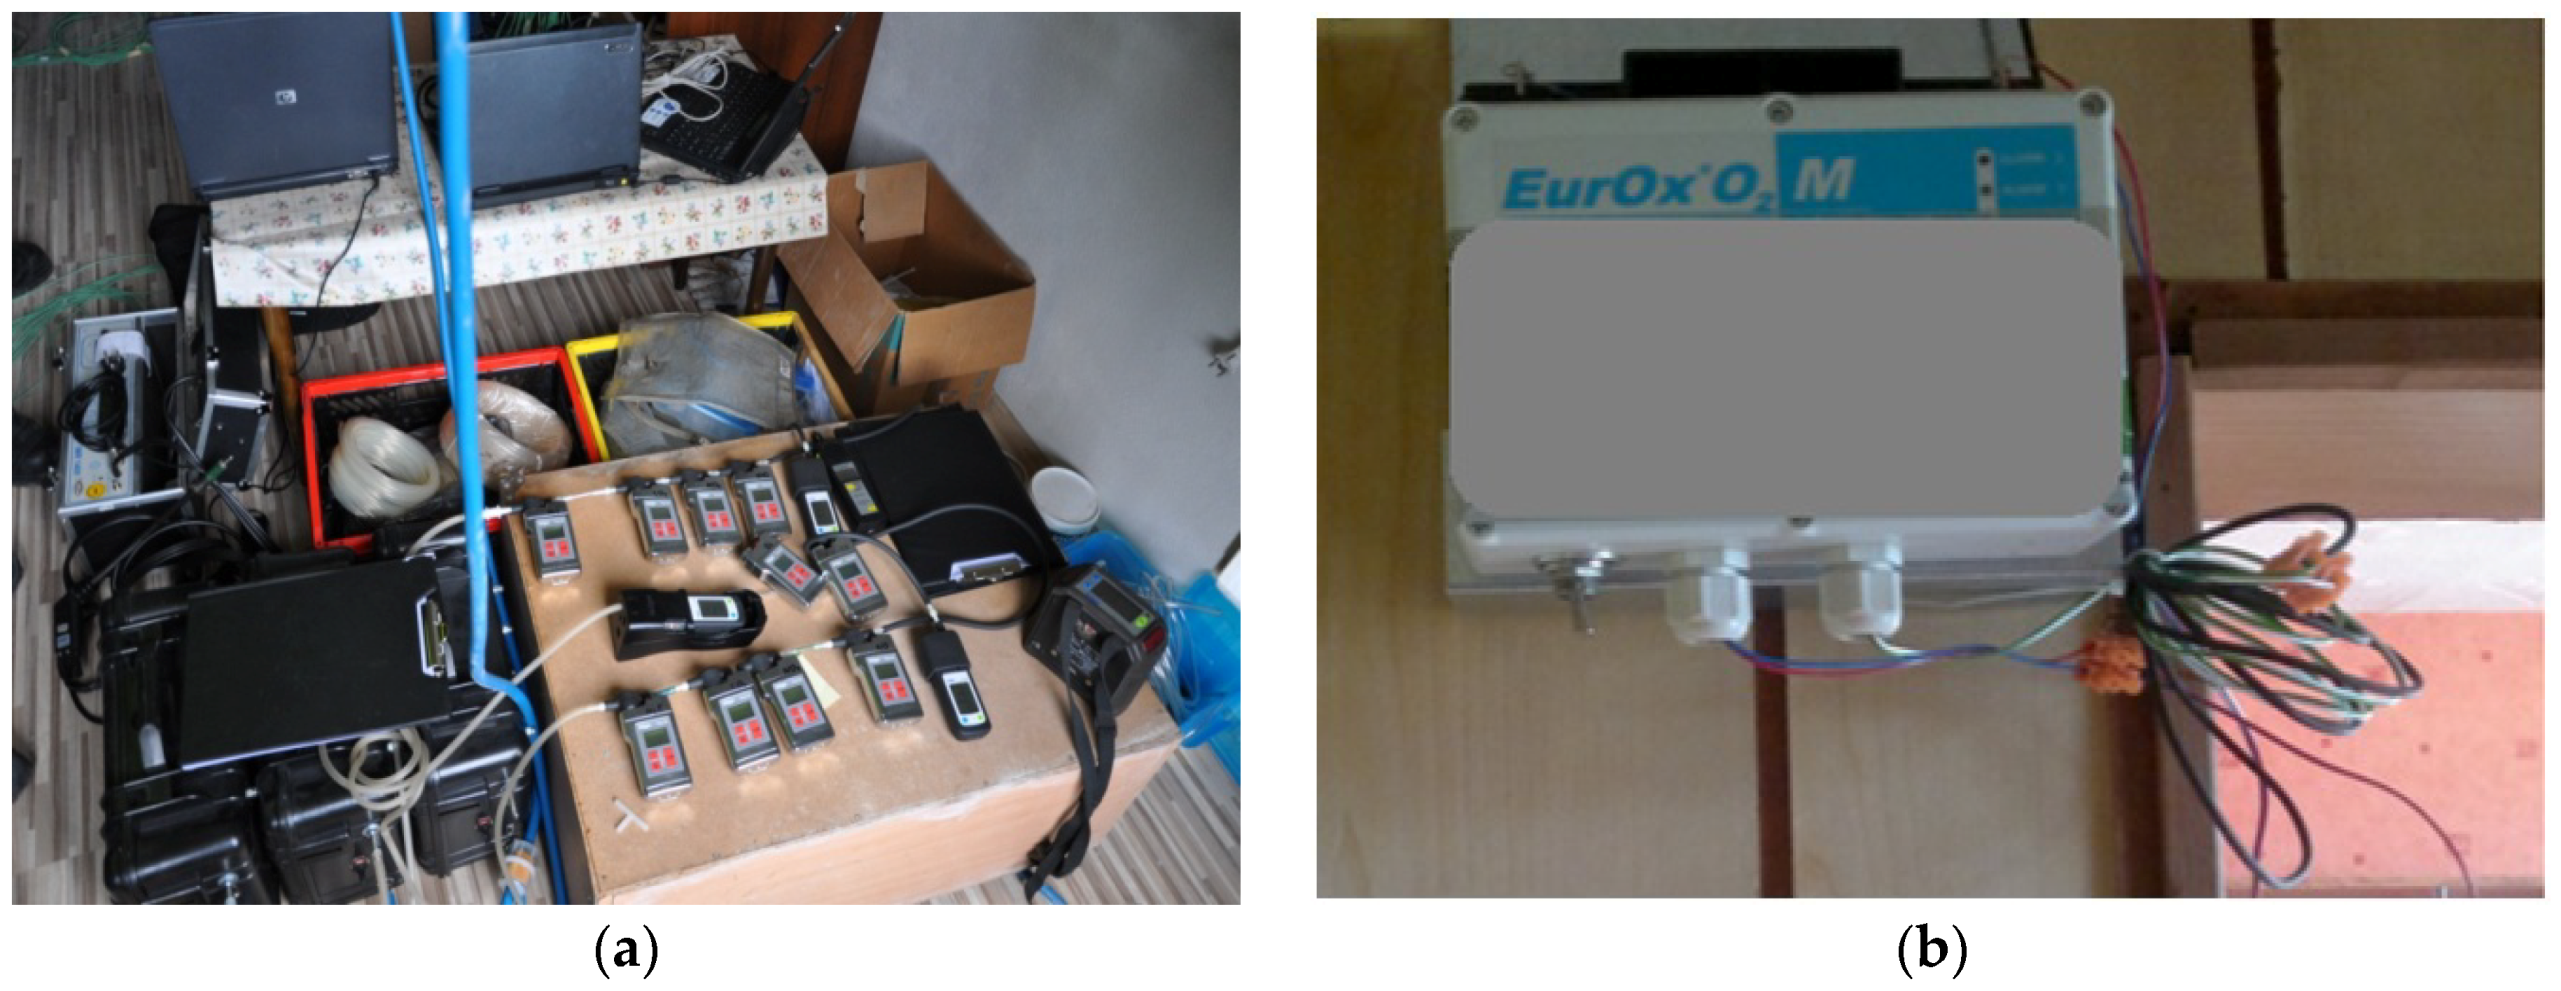
- EUROx®O2 PRO SERVICE oxygen detector with serial number 357/09/12/M/E and a range of 0–25%;
- Simultaneous test kit Simultantest for organic and inorganic gases, e.g., HCN, HCL, HBr.
A picture of the apparatus for measuring the concentration of toxic gases is shown in Figure 5a, while for measuring oxygen concentration in Figure 5b.
The research procedure consisted of the following activities carried out listed in order:
- Preparation of the test apparatus for fire tests:
- Checking and testing of a computer program for recording and reading temperatures;
- Connection, calibration, and checking the operation of measuring sensors, among others thermocouples, recorders, gas analyzers, infrared cameras, smoke detectors or fire alarm system, linear temperature sensors;
- Measurement of initial ambient conditions (wind speed, pressure differences between the building and the environment, and between the staircase and the dwelling, indoor and outdoor air temperature);
- Preliminary flammability test of the wooden pile (made for the requirements of Wood Crib 7 according to the British BS 5852 standard) confirmed the height of the flame (in the range 34.5 cm–49 cm) and the time of its complete burning (it was 6.5 min);
- Setting a 3-min time step when taking measurements of fire gas concentration;
- Setting fire to the wooden stack placed on the armchair and simultaneously starting the recording of measurements (e.g., temperature, fire gases, pressure, oxygen concentration). The possibility of emergency termination of tests is provided in the event of a situation threatening the safety of the persons carrying out the measurements and who are in the room located under the fire;
- Completion of the test in a sealed apartment 30 min after ignition and switching off part of the measuring apparatus. The measurement of the carbon monoxide concentration in the corridor and the temperatures at T1, T2, and T3 continued for 20 min from the end of the test and planned intervention of firefighters (the place of fire was extinguished and a window in the room was opened to smoke the apartment);
- Firemen putting out the fire and opening a window in the room to smoke the apartment;
- Checking the building’s safety by a firefighter in charge of Rescue Activities and diagnostics of building structural damage to the building by the District Building Supervision Inspector;
- Carrying out the second test in the unsealed apartment according to the procedure described in points 1–6.
3. Results
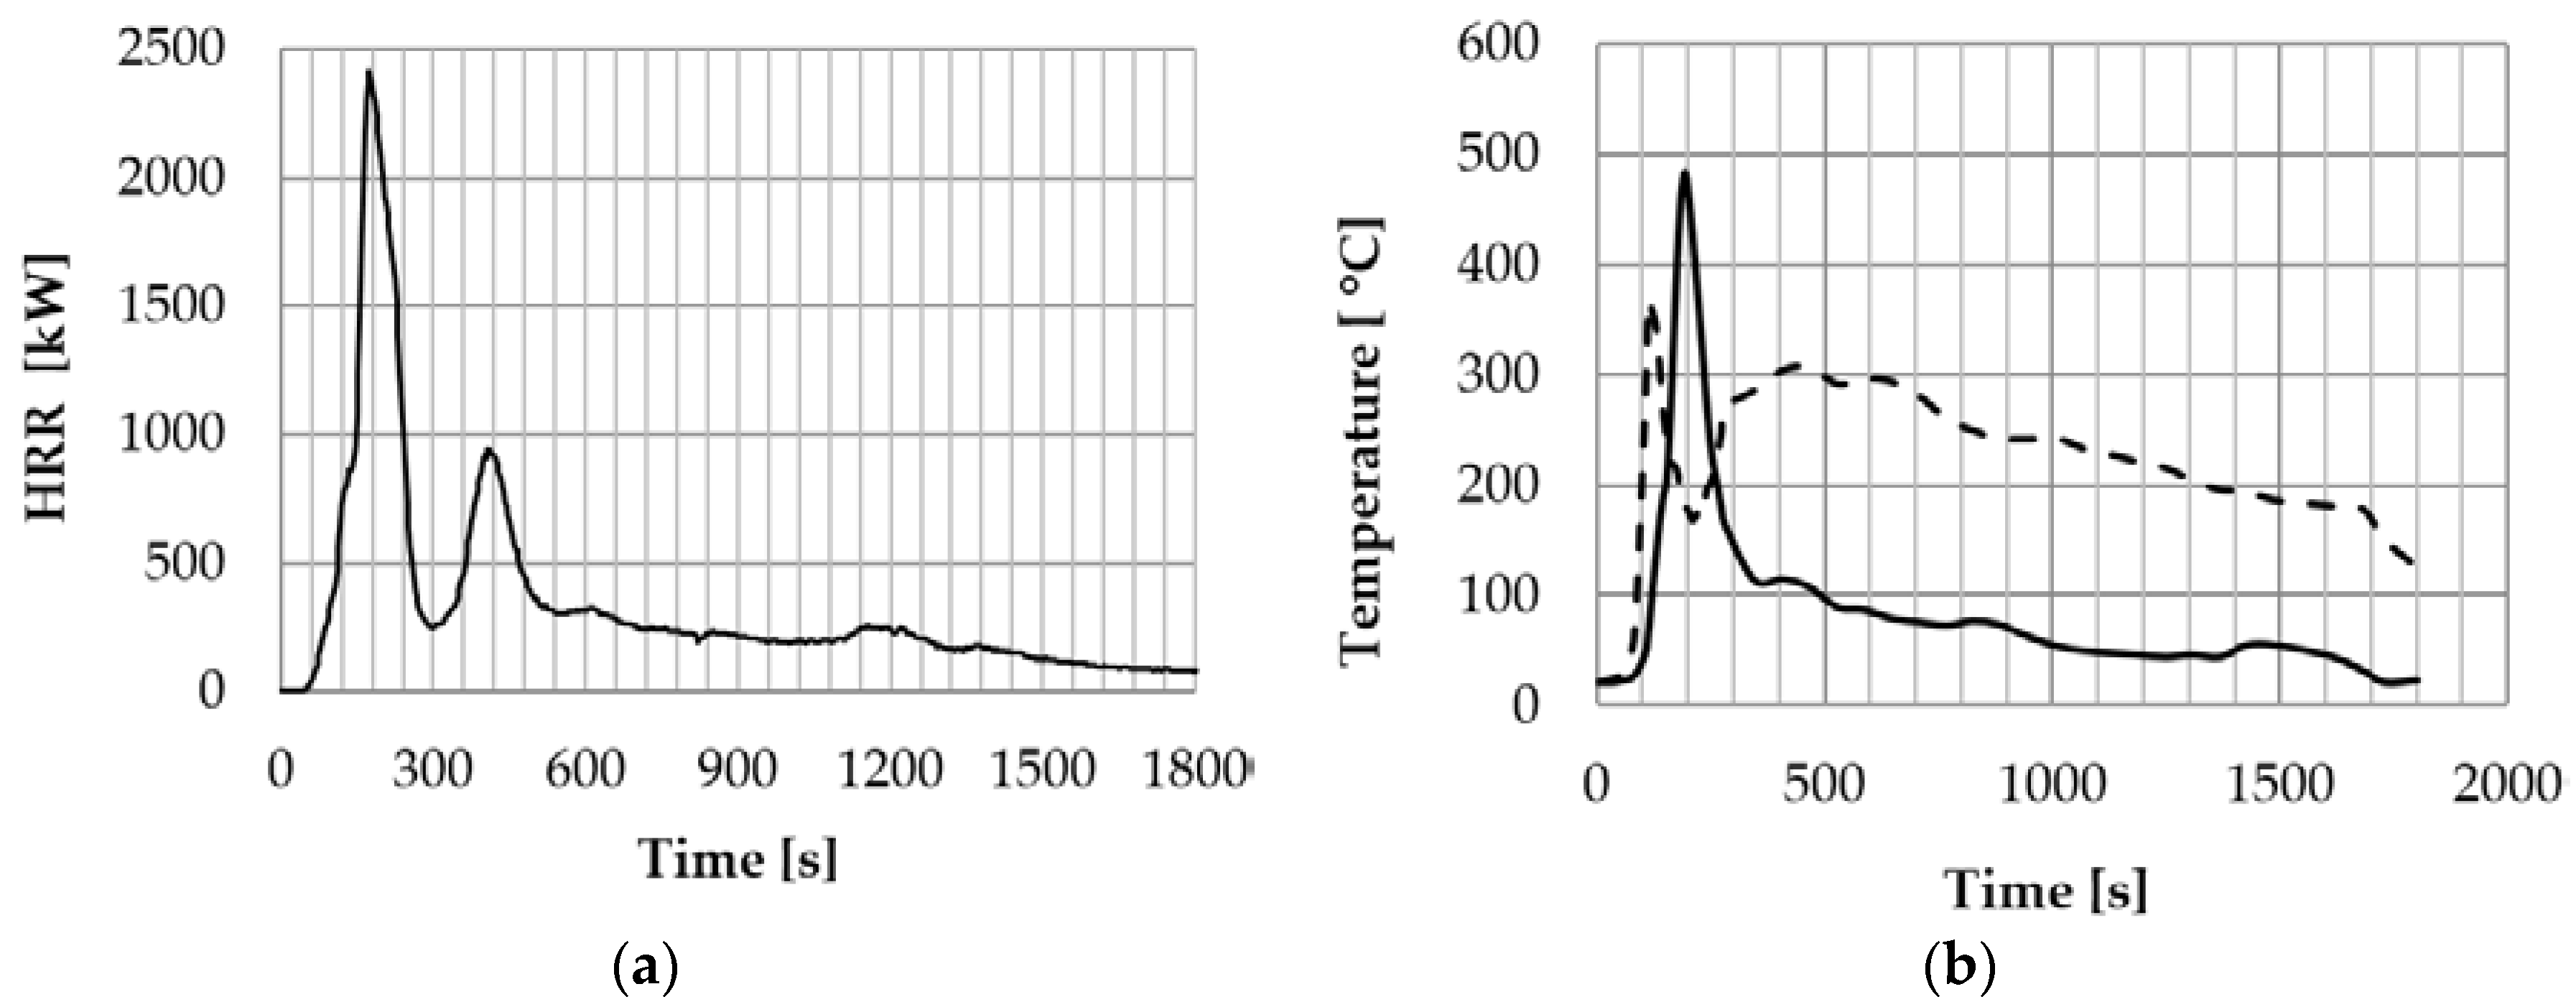
Although many environmental parameters were measured during tests, including temperature in selected points of the room, due to the specificity of the journal, this publication focuses on the analysis of toxic gas concentrations emitted during two tests. However, to illustrate the nature of fire development during the tests, HRR time histories and examples of temperature courses measured during the first (solid line) and the second (dashed line) tests by thermocouple t8.8 mounted at a height of 245 cm above the floor on the t8 tree closest to the fire source (see Figure 5) are shown in Figure 6.
The following gas concentrations measured at a height of 160 cm (probe 1) above the floor obtained during two fire tests, the first in a sealed apartment (marked with a solid line) and the second in an unsealed apartment (marked with a dashed line) are presented:
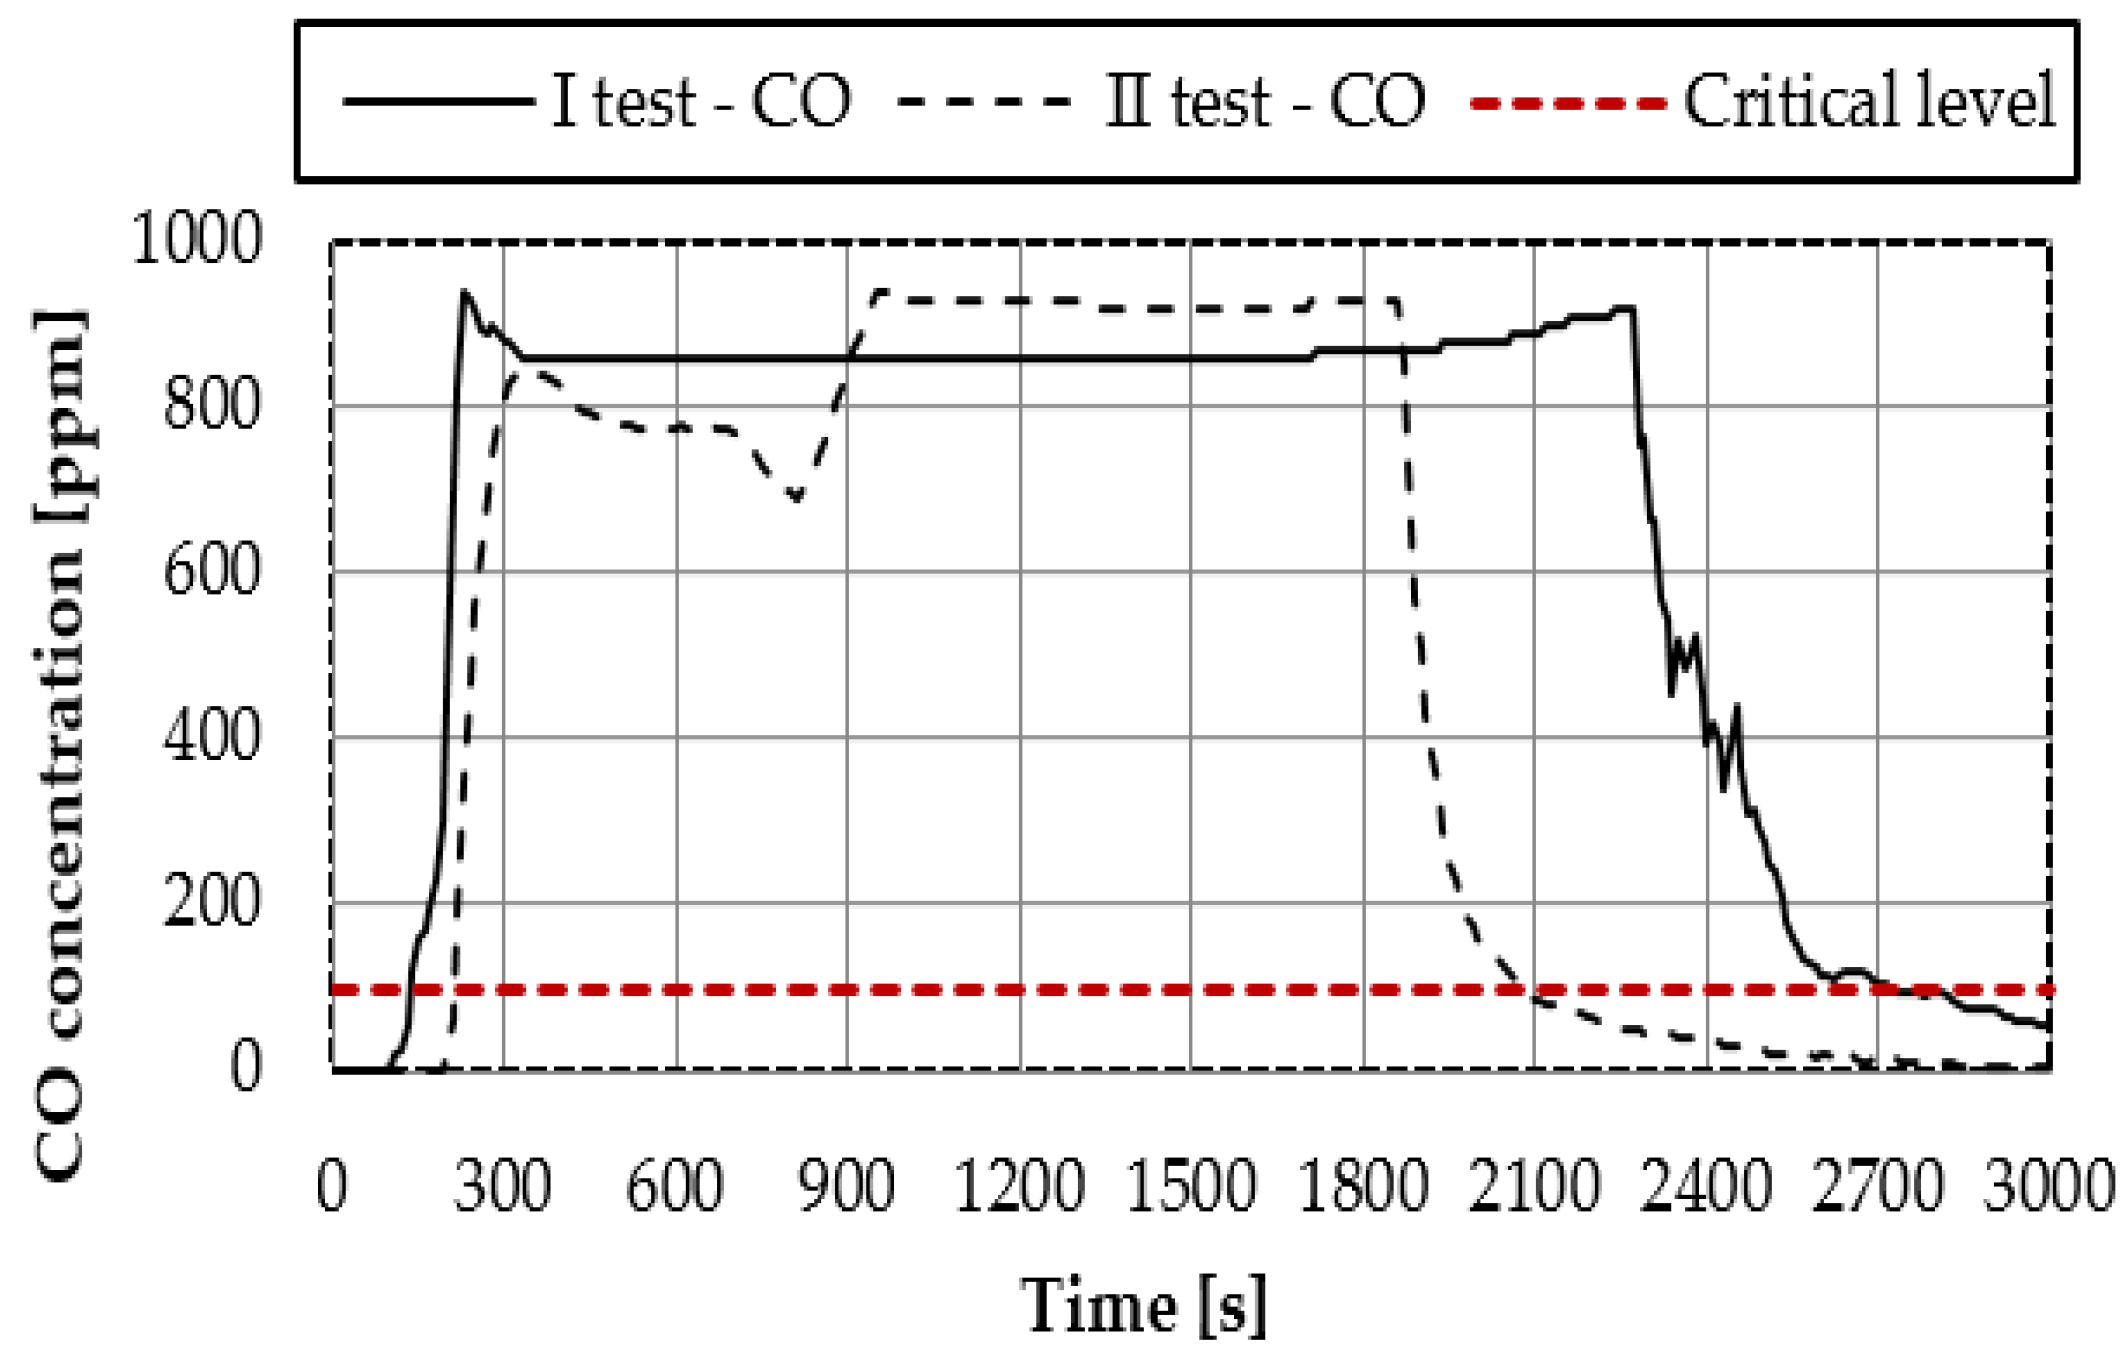
Carbon monoxide concentrations measured by the probes No. 1, 2, and 4 (located at heights of 160 cm, 90 cm, and 230 cm, respectively) during the first and the second test are shown in Figure 9b. Concentrations of the same gas but measured by the sensor located in the corridor at a height of 180 cm above the floor during the first and the second tests are presented in Figure 10. These charts are drawn on the basis of measurements made by the company Smay Sp. z o.o. The assumed critical value of CO concentration equal to 100 ppm is signed by the horizontal red dashed line in the figure.
The maximum values of toxic gas concentrations and corresponding times for both tests are collected in Table 1.
4. Discussion
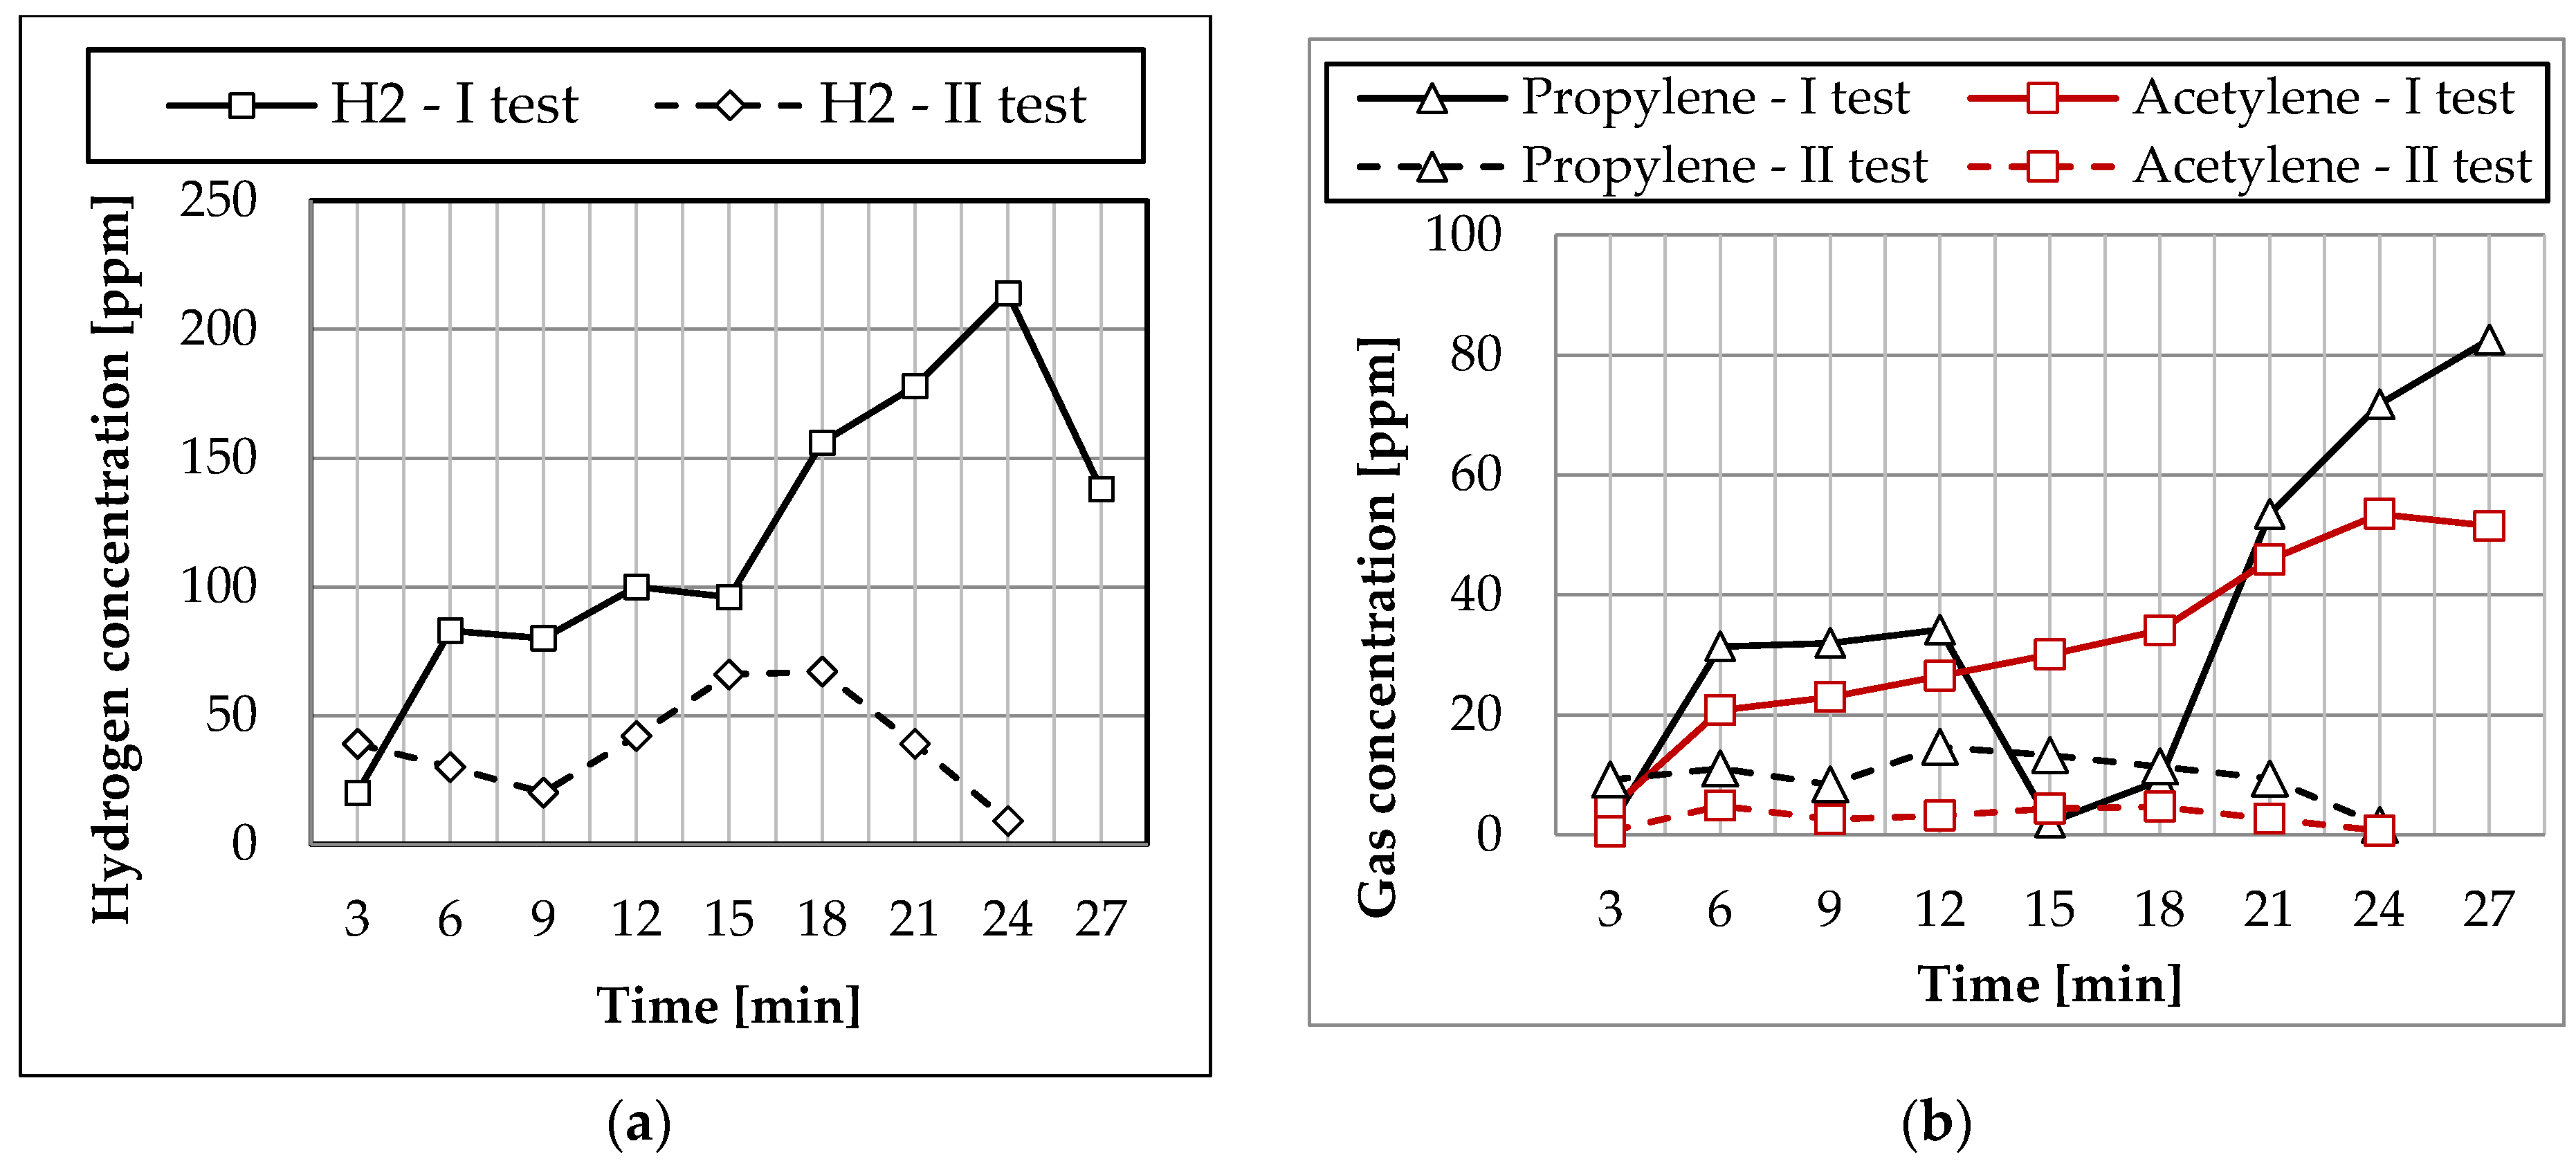
The analysis based on the results presented in Chapter 3 can be found in this section. The graphs shown in Figure 7a show that in the beginning of the fire (after three minutes) the hydrogen concentrations during the second test were slightly higher (39 ppm) than during the first test (20 ppm). However, the hydrogen concentrations during the first test (sealed apartment) still started to exceed those measured during the second test. After 24 min the difference between them reached 200 ppm. The maximum hydrogen concentration during the first test was 214 ppm (after 24 min) while during the second test this value reached only 67 ppm (after 18 min).
The graphs presented in Figure 7b show that the higher concentrations of propylene and acetylene were obtained during the first test, except for the time period between the 14th and 18th minute, when the propylene concentration was lower than in the second test (between the 12th and 15th minute there was a rapid drop of propylene concentration to 2,1 ppm). Starting from 15 min, the propylene concentration begins to increase steadily, reaching a value of about 82 ppm after 27 min, exceeding the value of the concentration measured during the second test by over 70 ppm. The acetylene concentration measured during the first test was higher than the one measured during the second test throughout the study period. At the 12th minute, the propylene concentration was the highest, equal to 14.7 ppm, and the highest acetylene concentration value of 4.9 ppm was obtained in the sixth minute. It remained at the level of about 4.7 ppm, up to the 18th minute, since its value began to decrease to 0.7 ppm in the 24th minute. The propylene concentration during the first test increased systematically reaching the maximum value equal to about 53.5 ppm after 24 min, while during the second test it remained at a low level not exceeding 5 ppm. Generally, higher concentrations of propylene than acetylene were obtained during both tests.
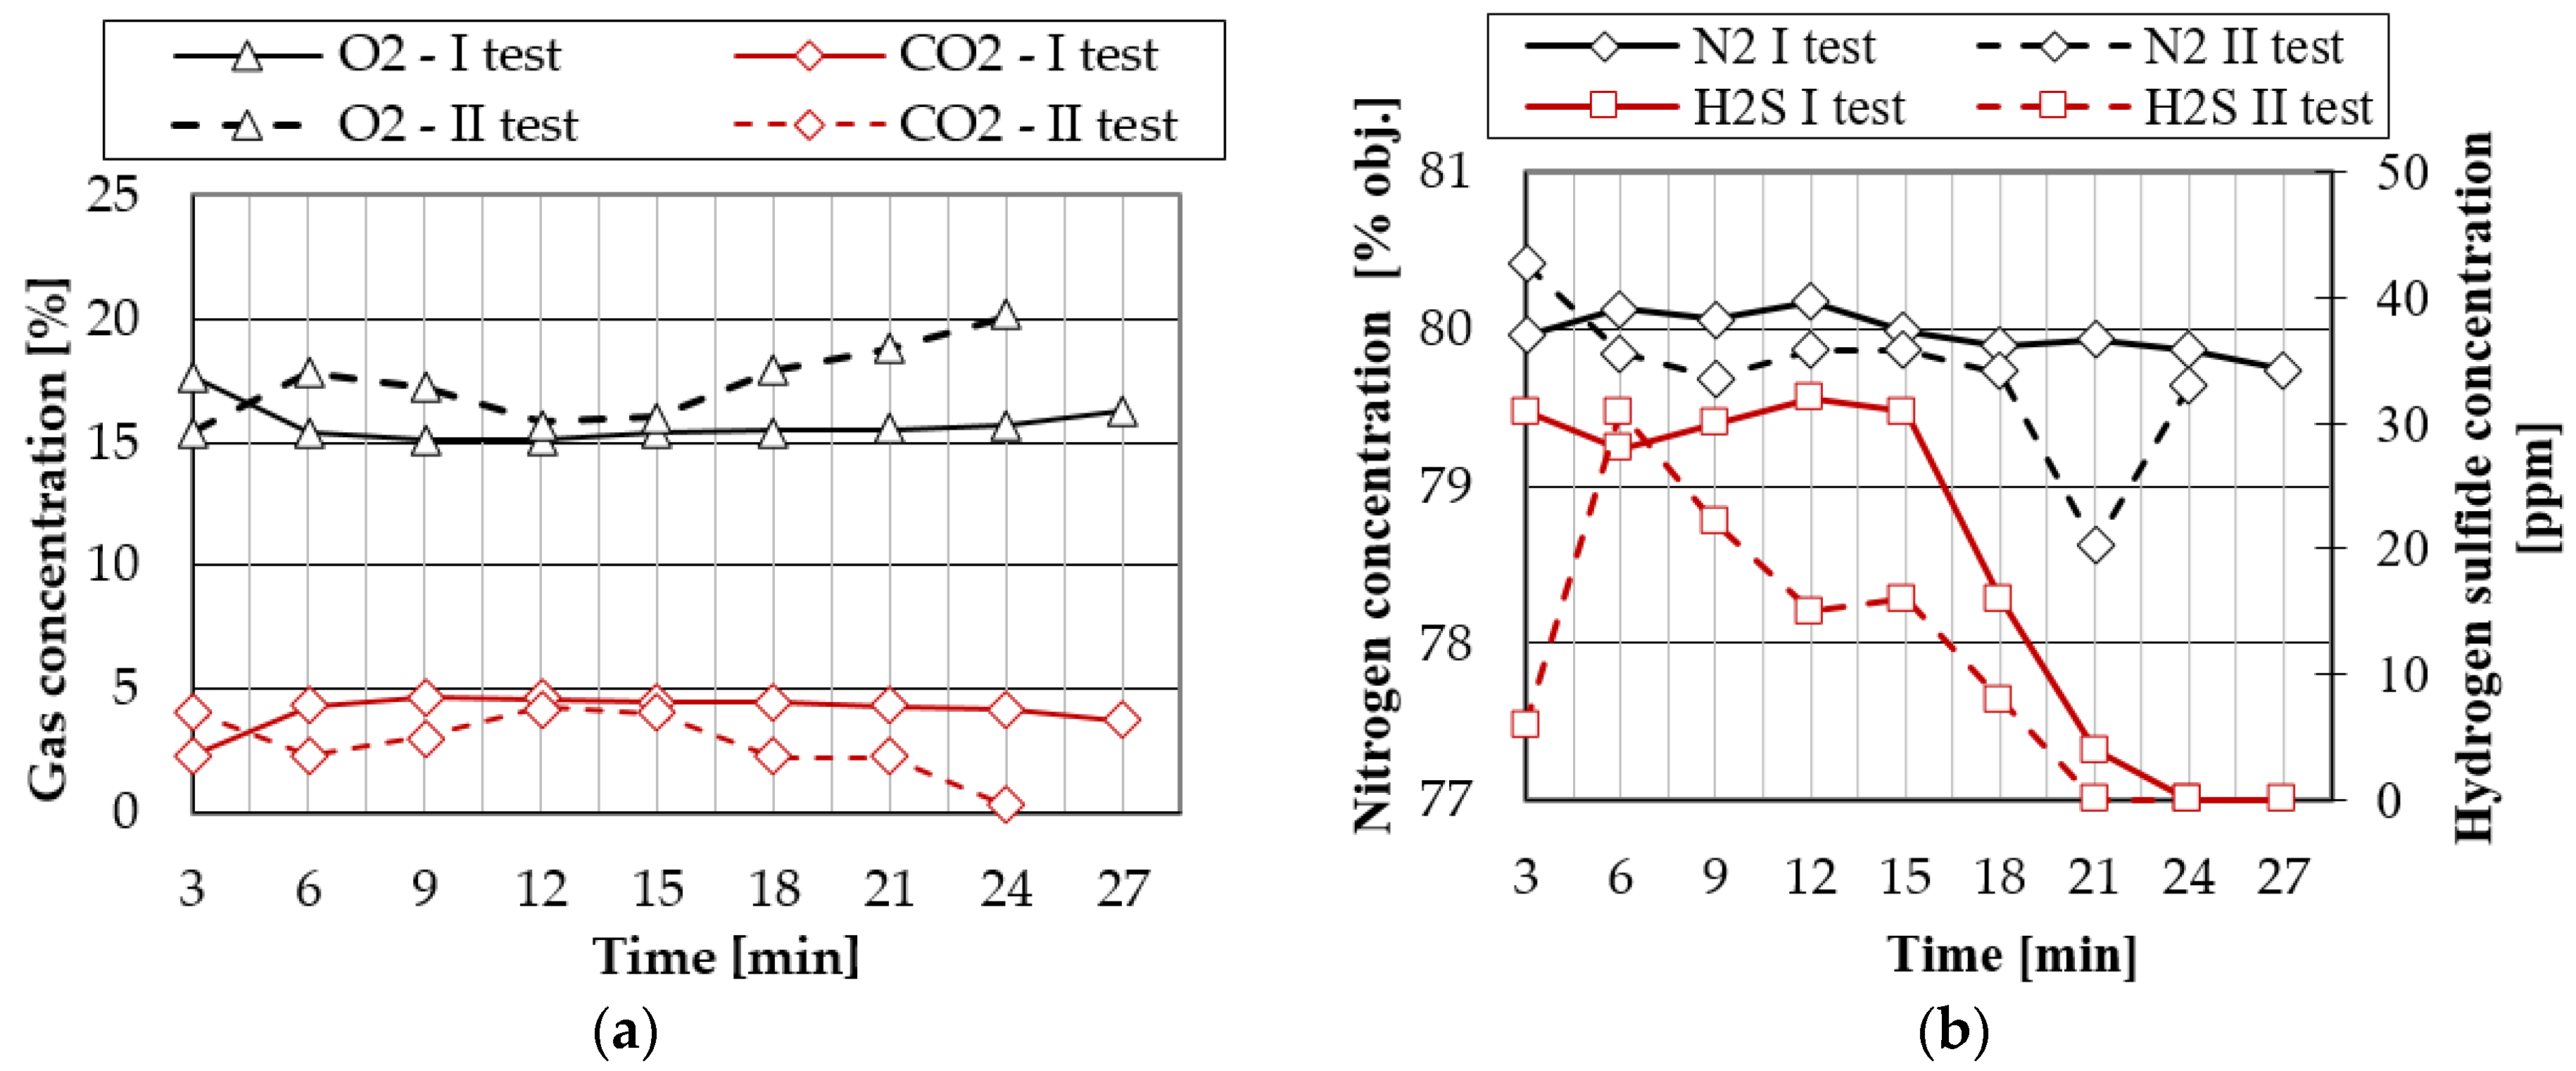
The graphs presented in Figure 8a show that starting from five minutes the oxygen concentration measured during the first test was lower than that measured during the second test. Practically, from six minutes it stayed in the range of 15–16%, only slightly increasing at the end of the test. The lowest value of about 15% was observed in the 12th minute of the first test. During the second test, a rapid decrease in oxygen concentration to 15.4% was observed at its beginning, followed by an increase to 17.8%, again decreasing to 15.8% in the 12th minute of the test, followed by a continuous increase until the end of the test (about 20% after 24 min). The smallest difference not exceeding 0.5% was observed between the 12th and 15th minute of the test, and the largest equal to about 5% after about the 24th minute of the test. Starting from the sixth minute of the first test, the carbon monoxide concentration was more or less stable between 4% and 5%.
The graphs presented in Figure 8b show that after six minutes, concentrations of either nitrogen or hydrogen sulphide measured during the first test were higher than that during the second test. The maximum of hydrogen sulphide concentration equal to 32 ppm was obtained in the 12th minute of the first test while nearly the same value, equal to 31 ppm, was received in the sixth minute of the second test. Starting from the 15th minute of the first test and from the sixth minute of the second test, the hydrogen sulphide concentration decreased (except for a slight increase between the 12th and 15th minute in the case the second test) reaching zero level in the 24th minute and 21th minute, respectively. The concentration of hydrogen during both tests varied within the limits of 79–81%. The maximum concentration of nitrogen equal to 80.17% was registered in the 12th minute of the first test and equal to 80.41% in the third minute of the second test.
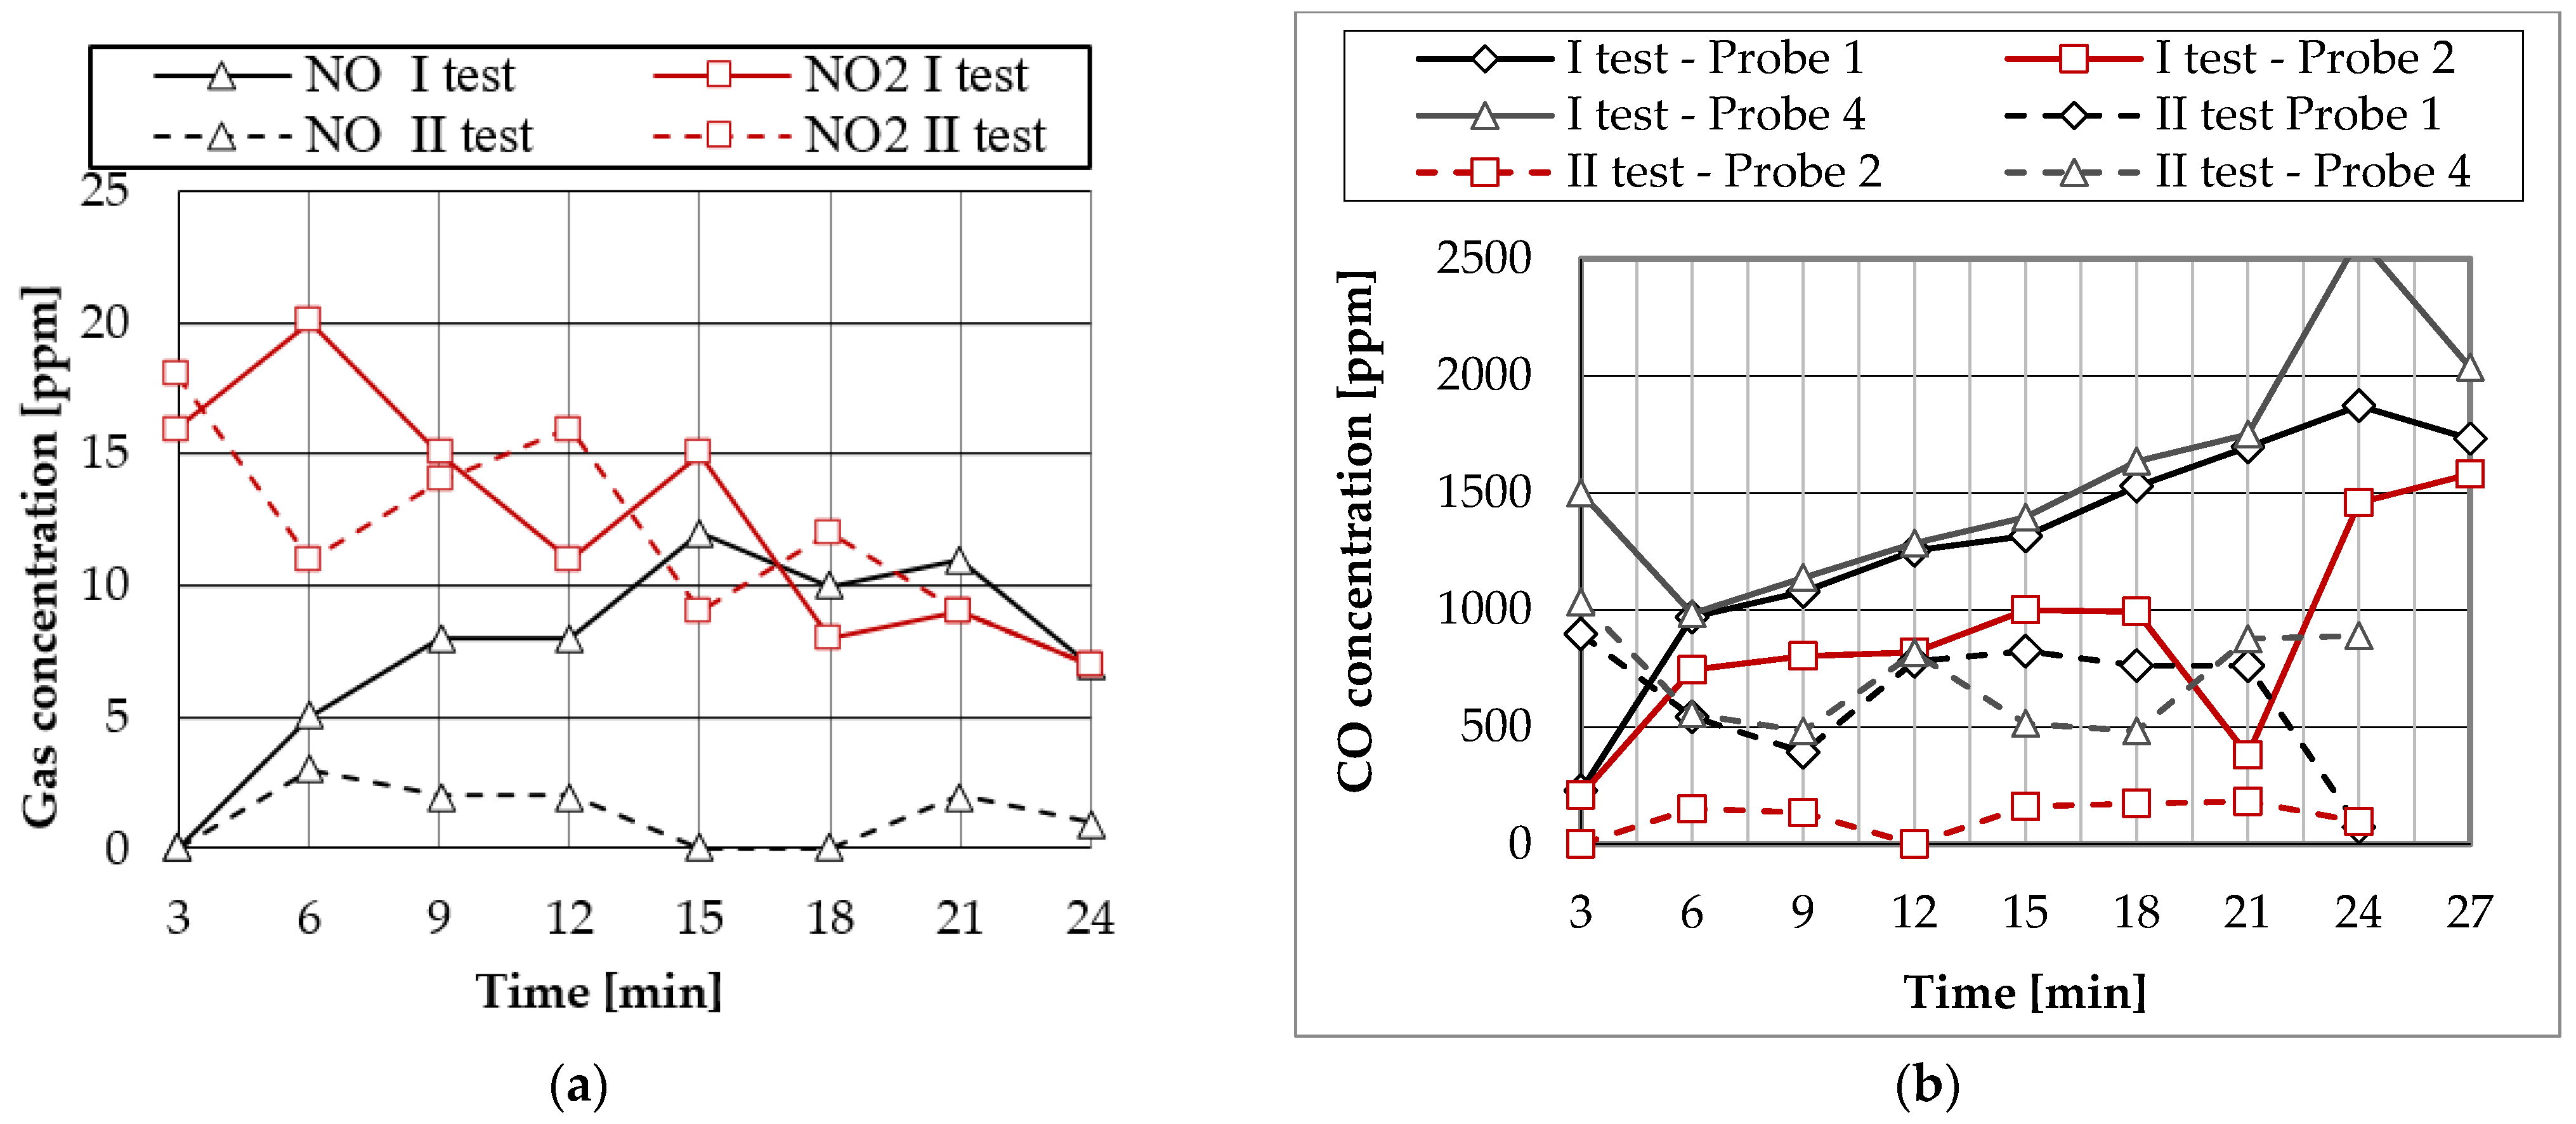
The graphs presented in Figure 9a show that nitrogen oxide concentration measured during the first test (sealed apartment) was higher than during the second test at all times. The highest value of the concentration of this gas equal to 12 ppm (in the 15th minute of the test) was noted during the first test while during the second test this value was only 3 ppm (in the sixth minute of the test). The fluctuation of nitrogen dioxide and its gradual decrease during both tests can be observed. The highest value of nitrogen dioxide concentration equal to 20 ppm during the first test was obtained (in the sixth minute of the test).
The graphs presented in Figure 9b show that the highest concentration of carbon monoxide equal to 2589 ppm was measured in the 24th minute of the first test by probe No. 4 located at a height of 230 cm, about 110 cm from the entrance door. The highest concentration measured by the same probe during the second test was 1034 ppm (in the 24th minute of the test). Corresponding maximum concentrations measured by the other probes were 1872 ppm (I test) and 897 ppm (II test) by probe No. 1, as well as 1580 ppm (I test) and 182 ppm (II test).
The graphs presented in Figure 10 show that highest concentrations of carbon monoxide measured by the sensor located in the corridor are comparable and are approximately 930 ppm. The fast growth of carbon monoxide concentration can be noticed during both tests (after 130 s in the case of the first test and after 190 s in the case of the second test). From this point, after about 100 s, the CO concentration reaches its maximum value, which is maintained for about 2000 s in the case of the first test and about 1500 s in the case of the second test. Exceeding the critical concentration value of 100 ppm (NDSCh value given in the regulation [14]), marked with a horizontal red line on the Figure 10, occurred after about 150 s in the case of the first test and 240 ppm in the case of the second test.
Taking into account external factors like wind, its speed and direction could have the greatest impact on fire development. However, its low strength and location of the window in relation to the wind direction indicates that it had a relatively small impact on the combustion process and thus the gas concentrations. Other external factors, such as humidity and pressure do not affect the development of fire in a sealed premises, but they can have impact on this process in unsealed premises mainly by changing the speed of the air stream flowing through the window opening. Internal factors that affect the development of fire are the location of the furniture, doors, windows, and the source of the fire in the room, as well as the configuration of the ventilation openings, e.g., whether the internal door will be open or closed. The study of the impact of these factors on fire development was not the subject of this paper.
As for the full reproducibility of the results, it is not possible due to too many factors that affect the development of fire. Even partial repetition would require ensuring identical distribution and area of the rooms in the apartment, its fixed and movable equipment, location of furniture and measuring sensors, the same source of fire, and many other elements, which would be practically impossible.
The obtained results of two tests could be used to validate field fire models in residential premises. The authors conducted simulation tests using commonly available CFAST and FDS programs. First of all, they were used for comparative analysis of temperature, which will be the subject of a separate article. The results of these studies indicate difficulties in modeling poorly ventilated fires mainly due to the lack of sufficiently accurate mapping of the process of solid phase distribution and pyrolysis, and the associated simplification in CFD modeling.
Based on the review of the literature and experience of the authors, as well as in relation to the obtained test results, which confirmed the increase in fire risk due to the increase of apartment tightness, recommendations for residential buildings, especially low and medium-high, which in the event of a fire should enable users to evacuate safely, were proposed. Some of them are given below:
- Multi-family residential buildings, both new and subjected to thermo-modernization, should be subject to the obligation to conduct air-tightness tests of premises in the aspect of assessing their fire safety. During the tests, the value of the air exchange rate per hour at a pressure difference of 50 Pa should be determined. This information should be taken into account when agreeing the occupancy permit for a given object due to the key impact on the health and life of residents in the event of a fire, but not only;
- The relevant regulations related to fire safety should specify critical and routine conditions for the safe operation of rescue teams based on the simultaneous impact on the body of selected parameters of the fire environment, i.e., temperature, intensity of heat radiation, smoke and toxic gas concentrations, and the permissible time of exposure to these factors;
- Issues related to ventilation and its intensity, types of ventilation systems, including the effects of wind on the building and air distribution in residential premises should be included in the training programs of the firefighting commanders. In addition to ensuring a building’s structure load capacity within a certain period of time, the skillful management of airflow by firefighters during rescue and firefighting activities affects the commander decision to save people without evacuation, while ensuring that they can safely survive the fire without leaving the building. Introducing virtual reality techniques to firefighters’ training programs can serve this purpose;
- When determining the critical conditions for rescue teams, the firefighting operation commander should consider whether the essential elements of the residential building construction will provide the appropriate fire resistance class. This applies especially to single-family buildings as well as attics and external walls of low residential buildings.
5. Conclusions
On the basis of the analysis of results obtained during full-scale fires included in Section 4, the following final conclusions have been formulated:
- Practically after a few minutes of fire, the concentrations of all analyzed toxic gases (except for NO2) released during full scale fire tests were higher in the case of a sealed apartment (I test) than an unsealed one (II test). The maximum differences between the values measured by probe No. 1 during these tests were 205 ppm for H2, 82.6 ppm for propylene, 53 ppm for acetylene, 4% for CO2, 1,2% for N2, 17 ppm for H2S, 12 ppm for NO, and 1776 ppm for CO. In most cases, the maximum differences occurred at the end of the test (in the 24th minute or 27th minute of the test), except for H2S, when it occurred in the middle of the test (in the 12th minute of the test);
- During the first test, carbon monoxide concentration exceeded 2000 ppm, which can result in death at half an hour of exposure. Although during the second test at the height of 160 cm this concentration did not exceed 1000 ppm, it can cause toxicity of the body due to hypoxia after a long time;
- Carbon dioxide with a highest concentration of 4.67%, can increase the rate of respiration causing palpitations, tinnitus, headaches, increased blood pressure, impaired vision, and anxiety. Such a concentration significantly reduced the composition of the air, reducing the oxygen content;
- Maximum concentrations of hydrogen sulfide equal to about 30 ppm in a short period of exposure are not dangerous to human health, but after a long time (6–7 h) may cause fainting during prolonged breathing;
- Maximum value of NO2 (20 ppm) and NO (12 ppm) concentrations in a short time should not pose a threat to human health and life. However, with longer exposure times they can cause bronchitis and bronchopneumonia;
- Hydrogen, propylene, and acetylene, whose relatively high concentrations have been recorded by the measuring probe, are flammable gases that give off a large amount of heat in a fire environment. Attention should be paid to their high concentrations, because they are responsible for the occurrence of the backdraft phenomenon when the door is opened by rescue teams or the window glass is broken;
- Lower oxygen concentrations were obtained in a sealed apartment than in an unsealed apartment. The lowest registered oxygen concentration was about 15% vol. air, which results in a loss of consciousness and fainting. Below a concentration of 16%, impaired coordination of movement, headaches (distraction), fatigue (sleepiness), and an increase in blood pressure, which is a reason for difficult evacuation from the building and poses a threat to life, can occur.
Author Contributions
Conceptualization, D.S.; methodology, J.G. and D.S.; introduction, J.G. and D.S.; formal analysis, J.G. and D.S.; investigation, D.S.; resources, J.G.; data curation, J.G. and D.S.; writing—original draft preparation, J.G. and D.S.; writing—review and editing, J.G.; visualization, J.G. and D.S.; supervision, J.G.; project administration, D.S.; funding acquisition, D.S. All authors have read and agreed to the published version of the manuscript.
Funding
This research received no external funding.
Acknowledgments
The measurement of gas concentrations was supported by Central Mine Rescue Station in Bytom and City Headquarters of the State Fire Service in Bytom, as well as the Rescue and Firefighting Unit Katowice-Piotrowice.
Conflicts of Interest
The authors declare no conflict of interest.
References
- Barański, M.; Maciak, T. Określanie czasu procesu bezpiecznej ewakuacji ludności z zagrożonych obiektów. Zeszyty Naukowe SGSP 2014, 49, 78–97. [Google Scholar]
- Półka, M.; Konecki, M.; Salamonowicz, Z. Toxicity of the fire environment. Pol. Rev. Aviat. Med. 2010, 4, 357–370. [Google Scholar]
- Seńczuk, W. Toxicity of non-metals and their inorganic compounds. In Modern Toxicology; PZWL Publishing House: Warsaw, Poland, 2006; pp. 448–449. [Google Scholar]
- Półka, M. Toxicity analysis of thermal decomposition and combustion products obtained from selected epoxy materials. Saf. Fire Eng. 2010, 3, 73–81. [Google Scholar]
- Stec, A.A.; Hull, T.R. Fire Toxicity; Woodhead Publishing: Cambridge, England; CRC Press LLC: Boca Raton, FL, USA, 2010; pp. 26–47. [Google Scholar]
- Stec, A.A. Toxicity of the fire environment. In Proceedings of the International Conference on Inner Fire, Olsztyn, Poland, 17–18 September 2018. [Google Scholar]
- Purser, D.A. Assessment of hazards to occupants from smoke. In Toxic Gases and Heat, The SFPE Handbook of Fire Protection Engineering, 4th ed.; DiNeno, P.J., Ed.; National Fire Protection Association: Quincy, MA, USA, 2009; Volume 2, pp. 96–193. [Google Scholar]
- Purser, D.A. Fire toxicity and toxic hazard analysis. In Proceedings of the 6th International Seminar on Fire and Explosion Hazards, University of Leeds, Leeds, UK, 11–16 April 2010. [Google Scholar]
- Abecassis-Empis, C.; Reszka, P.; Steinhaus, T.; Cowlard, A.; Biteau, H.; Welch, S.; Rein, G.; Torero, J.L. Characterisation of Dalmarnock fire test one. Exp. Therm. Fluid Sci. 2007, 32, 1334–1343. [Google Scholar] [CrossRef] [Green Version]
- Rein, G.; Torero, J.L.; Jahn, W. Round-robin study of a priori modelling predictions of the Dalmarnock fire test one. Fire Saf. J. 2009, 44, 590–602. [Google Scholar] [CrossRef] [Green Version]
- Rein, G.; Jahn, W.; Torero, J.L. Modelling of growth phase of Dalmarnock fire test one. In Proceedings of the 12th International Fire and Materials Conference, San Francisco, CA, USA, 31 January–2 February 2011. [Google Scholar]
- Guillamue, E.; Didieux, F.; Thiry, A.; Bellivier, A. Real-scale fire tests one bedroom apartments with regard to tenability assessment. Fire Saf. J. 2014, 70, 81–97. [Google Scholar] [CrossRef] [Green Version]
- Back, A. Fire Development in Insulated Compartments: Effects from Improved Thermal Insulation; Technical Report No. 5387; Department of Fire Safety Engineering and Systems Safety, Lund University: Lund, Sweden, 2012. [Google Scholar]
- Ministry of Economy and Labor. Regulation of the Ministry of Economy and Labor of October 10, 2005. (Dz. U z 2005 Nr 212, poz. 1769) Amending the Regulation on the Highest Permissible Concentrations and Intensities of Agents Harmful to Health in the Work Environment; Ministry of Economy and Labor: Warsaw, Poland, 2005.
Figure 1.
Pictures of a residential building at Pocztowa Str. 15 in Bytom from the north, scheduled for fire tests: (a) before the removal of facade panels containing asbestos (July 2012); (b) on the day of the experiment (20 September 2012).
Figure 1.
Pictures of a residential building at Pocztowa Str. 15 in Bytom from the north, scheduled for fire tests: (a) before the removal of facade panels containing asbestos (July 2012); (b) on the day of the experiment (20 September 2012).

Figure 2.
Pictures of rooms where fire tests were carried out: (a) sealed; (b) unsealed.

Figure 3.
Picture of the (a) place and source of ignition; (b) fire test according to PN-ISO 9705.

Figure 4.
An example of the distribution of metal probes, thermocouples, and cameras in the room.

Figure 5.
View of (a) apparatus for measuring concentrations of fire gases; (b) oxygen sensor.

Figure 6.
(a) Heat Release Ratio (HRR) vs. time; (b) temperature measured during the first and the second tests by thermocouple t8.8 located on the tree t8 near the fire source.
Figure 6.
(a) Heat Release Ratio (HRR) vs. time; (b) temperature measured during the first and the second tests by thermocouple t8.8 located on the tree t8 near the fire source.

Figure 7.
Concentrations measured by probe No. 1 during the first and second fire tests of (a) hydrogen; (b) propylene and acetylene.
Figure 7.
Concentrations measured by probe No. 1 during the first and second fire tests of (a) hydrogen; (b) propylene and acetylene.

Figure 8.
Concentrations measured by probe No. 1 during the first and second fire tests of (a) oxygen and carbon dioxide; (b) nitrogen and hydrogen sulphide.
Figure 8.
Concentrations measured by probe No. 1 during the first and second fire tests of (a) oxygen and carbon dioxide; (b) nitrogen and hydrogen sulphide.

Figure 9.
(a) Nitrogen oxide and dioxide concentrations measured by probe No. 1 during the first and second fire tests; (b) carbon monoxide concentrations measured by probes No. 1, 2, and 4 during the first and the second tests.
Figure 9.
(a) Nitrogen oxide and dioxide concentrations measured by probe No. 1 during the first and second fire tests; (b) carbon monoxide concentrations measured by probes No. 1, 2, and 4 during the first and the second tests.

Figure 10.
Carbon monoxide concentrations measured during the first and the second tests by the sensor mounted in the corridor.
Figure 10.
Carbon monoxide concentrations measured during the first and the second tests by the sensor mounted in the corridor.


Table 1.
Maximum values of concentrations of registered toxic gases obtained during both tests and time to reach them.
Table 1.
Maximum values of concentrations of registered toxic gases obtained during both tests and time to reach them.
| No. | Gas | Unit | Probe No. | Test I | Test II | ||
|---|---|---|---|---|---|---|---|
| Maximum | Time | Maximum | Time | ||||
| 1 | Hydrogen | ppm | 1 | 214 | 24 | 67 | 18 |
| 2 | Propylene | ppm | 1 | 82.6 | 27 | 14.7 | 12 |
| 3 | Acetylene | ppm | 1 | 53.5 | 24 | 4.9 | 6 |
| 4 | Carbon dioxide | % | 1 | 4.67 | 9 | 4.25 | 12 |
| 5 | Hydrogen sulphide | ppm | 1 | 32 | 12 | 31 | 6 |
| 6 | Nitrogen oxide | ppm | 1 | 12 | 15 | 3 | 6 |
| 7 | Nitrogen dioxide | ppm | 1 | 20 | 6 | 18 | 3 |
| 8 | Carbon monoxide | ppm | 1 | 1872 | 24 | 897 | 3 |
| 9 | Carbon monoxide | ppm | 2 | 1580 | 27 | 182 | 21 |
| 10 | Carbon monoxide | ppm | 4 | 2589 | 24 | 1034 | 3 |
| 11 | Carbon monoxide | ppm | Corridor | 928.5 | 6 | 938.5 | 16 |
© 2019 by the authors. Licensee MDPI, Basel, Switzerland. This article is an open access article distributed under the terms and conditions of the Creative Commons Attribution (CC BY) license (http://creativecommons.org/licenses/by/4.0/).
Share and Cite
MDPI and ACS Style
Gałaj, J.; Saleta, D. Impact of Apartment Tightness on the Concentrations of Toxic Gases Emitted During a Fire. Sustainability 2020, 12, 223. https://0-doi-org.brum.beds.ac.uk/10.3390/su12010223
AMA Style
Gałaj J, Saleta D. Impact of Apartment Tightness on the Concentrations of Toxic Gases Emitted During a Fire. Sustainability. 2020; 12(1):223. https://0-doi-org.brum.beds.ac.uk/10.3390/su12010223
Chicago/Turabian StyleGałaj, Jerzy, and Damian Saleta. 2020. "Impact of Apartment Tightness on the Concentrations of Toxic Gases Emitted During a Fire" Sustainability 12, no. 1: 223. https://0-doi-org.brum.beds.ac.uk/10.3390/su12010223
Note that from the first issue of 2016, this journal uses article numbers instead of page numbers. See further details here.