1. Introduction
Worldwide, the impacts of various anthropogenic activities, such as increased industrialisation, pollution, deforestation, and overconsumption, are causing destruction and overexploitation of natural resources and have been recognised as the most significant risk not only for the environment but also for human health and well-being [
1,
2,
3]. The overexploitation of natural resources has grown rapidly in the last two decades, and global resource supply chains have become extremely complex. This has resulted in increasing environmental pressures and impacts [
2]. If humankind continues to live on the edge of or outside of the ecological limits, it will be much more difficult to achieve equity, justice, prosperity, well-being, and healthy quality of life for everyone at the global and local levels [
4,
5,
6].
The need for humanity to remain within the safe operating space of planetary boundaries and the need to eradicate poverty and accelerate sustainable socio-economic development are linked by the concept of “safe and just space for humanity” [
7,
8,
9]. Therefore, a global shift from a linear economy towards a circular economy is needed, in which socio-institutional change along with resource efficiency and innovative product design [
10,
11] contribute to economic development and human well-being, with reduced pressures and impacts on the environment. The circular economy approach aims at continuous economic development to achieve waste minimisation, energy efficiency, and environmental conservation, without posing significant challenges to the environment and natural resources [
12]. The circular economy is a competitive environmental strategy to production processes and economic activity that allows resources to maintain their highest value while benefiting the business and society as a whole with better supply chain, low volatility of resource prices, better customer relations, improved services, and new employment opportunities [
12,
13]. The key considerations in the implementation of a circular economy are to refuse, reduce, rethink, repair, restore, remanufacture, and reuse resources [
10,
11,
14], and pursue longevity, renewability, replaceability, and upgradability for resources and products that are used.
The sustainable development goal “one” of the United Nations seeks to eradicate poverty and subsequent inequalities in all forms, leaving no one behind. Owing to the multi-dimensional nature of poverty, its eradication involves complex interactions within socio-economic systems. Across the world, several development projects [
15,
16] and poverty alleviation programmes [
17,
18] have been implemented, which are primarily aimed at socio-economic development and poverty reduction of poor and vulnerable communities. The
Deendayal Antyodaya Yojana–National Rural Livelihoods Mission (DAY-NRLM), a centrally sponsored programme of the Government of India, is one of the world’s largest poverty eradication programmes that aims to eliminate rural poverty in the country through the promotion of multiple livelihoods for each rural poor household. The programme follows a participatory and community-demand-driven approach that focusses largely on the eradication of poverty and pays special attention to the development of social resilience and sustainable socio-economic development.
This study tried to identify an ideal strategy for sustainable socio-economic development planning for rural communities in developing economies by evaluating the DAY-NRLM programme. For this, we used fuzzy cognitive mapping―a participatory modelling approach that allows for the exploration and management of various interrelationships between human, environmental, and socio-economic systems. The main principle behind using participatory modelling is that the resulting policy can effectively support a range of social, economic, and environmental goals. The systems-based integrated and participatory modelling approaches allow the stakeholders to contribute to the development of a system model, as well as support decision-makers’ understanding of the system being examined and all its aspects, by participating in the scenario development process and identifying correct strategies within the domain. Therefore, it is safe to say that the contribution that stakeholders can offer to a given problem, usually related to support for decision-making, policies, regulation, or management, is valuable [
19]. The fuzzy cognitive mapping approach allows stakeholders to collaboratively develop a “cognitive map” (i.e., a weighted, directed graph), which represents the perceived causal structure of their system [
20]. Fuzzy cognitive map (FCM) [
21] is a collection of concepts and causal relationships between them, in the form of a directed graph that can model a real-world system. Because FCMs can easily incorporate human knowledge and adapt to any given domain [
22], they have been extensively applied in many research fields and areas of application [
23,
24]. Their simple model structure gives them considerable awareness and broad research interest [
25].
This study also explored a new method for aggregating individual FCMs using the application of ordered weighted averaging (OWA) operators. The aggregation of individual FCM models must be taken into account when a variety of sources need to be included in the modelling procedure of a given system [
23]. Individual FCMs, constructed by experts and/or stakeholders, can be aggregated to produce a combined FCM that will incorporate the knowledge from all the different experts and/or stakeholders involved in the FCM construction process. The main objective behind aggregating individual FCMs is to improve the reliability of the overall model and make them less susceptible to potentially inaccurate knowledge of a single expert and/or stakeholders or knowledge inconsistency among the participants. Regarding the combination of multiple FCMs into a single collective model, among the techniques that can be found in the related literature, two methods are widely used in real-life problems [
26]—the weighted average and the OWA method introduced by Yager [
27]. The weighted average method is considered as the benchmark method for FCM aggregation purposes, where the final FCM model is built by averaging numerical values for a given interconnection [
28]. However, there are certain limitations to implementing this methodology. For example, when a large number of stakeholders/participants are asked to assign values on the relationships of a given system, significant deviations can arise between these values, which shows an inconsistency of knowledge among the participants that leads to an inaccurate overall FCM. On the other hand, the application of OWA operators in the aggregation of individual FCMs has a limited presence in the literature. In particular, OWA operators in an FCM framework were introduced by Zhenbang and Lihua [
29], who highlighted the ability of OWA operators to simulate the various AND/OR relationships between the concepts and studied the OWA aggregation under different conditions. An OWA operator based on distance was examined by Leyva-Vazquez et al. [
30] to rank the scenarios depending on the decision-makers’ risk preferences.
The study used the context of the DAY-NRLM programme, which predominantly focuses on livelihood enhancement through building self-managed and sustainable community institutions of “the rural poor women”. These community institutions are expected to overcome their social, financial, and economic exclusion. The broader objectives of the programme involve social mobilisation, institution building, enrolment of women in social security schemes and entitlements, socio-economic inclusion, sustainable livelihoods, capacity building, promotion of economic stability, improvement of social resilience, and skill development, aimed at elimination of rural poverty. Ultimately these outcomes will lead to the reduced socio-economic poverty and improved quality of life.
The paper is structured as follows:
Section 2 describes the problem along with the methods used in this study. This section includes in particular the basic principles of FCMs, the specifications of the OWA operators, and the proposed algorithm based on the weights of the OWA operator to aggregate FCM weights. This section also deals with the quasi-qualitative method for constructing the collective FCM from groups, whereas in
Section 3, the aggregation results produced from the application of the OWA method in the developed FCMs, the sensitivity analysis, and the scenario analysis are provided. In the end,
Section 4 summarises the conclusions of this study.
2. Methodology
2.1. Overview of Fuzzy Cognitive Maps
FCMs are soft computing techniques that combine fuzzy logic and neural networks [
31]. They were first introduced by Kosko [
21,
32] as fuzzy-graph structures for representing causal reasoning. They provide a more flexible and natural ability for knowledge representation and reasoning, which are essential to intelligent systems [
33,
34].
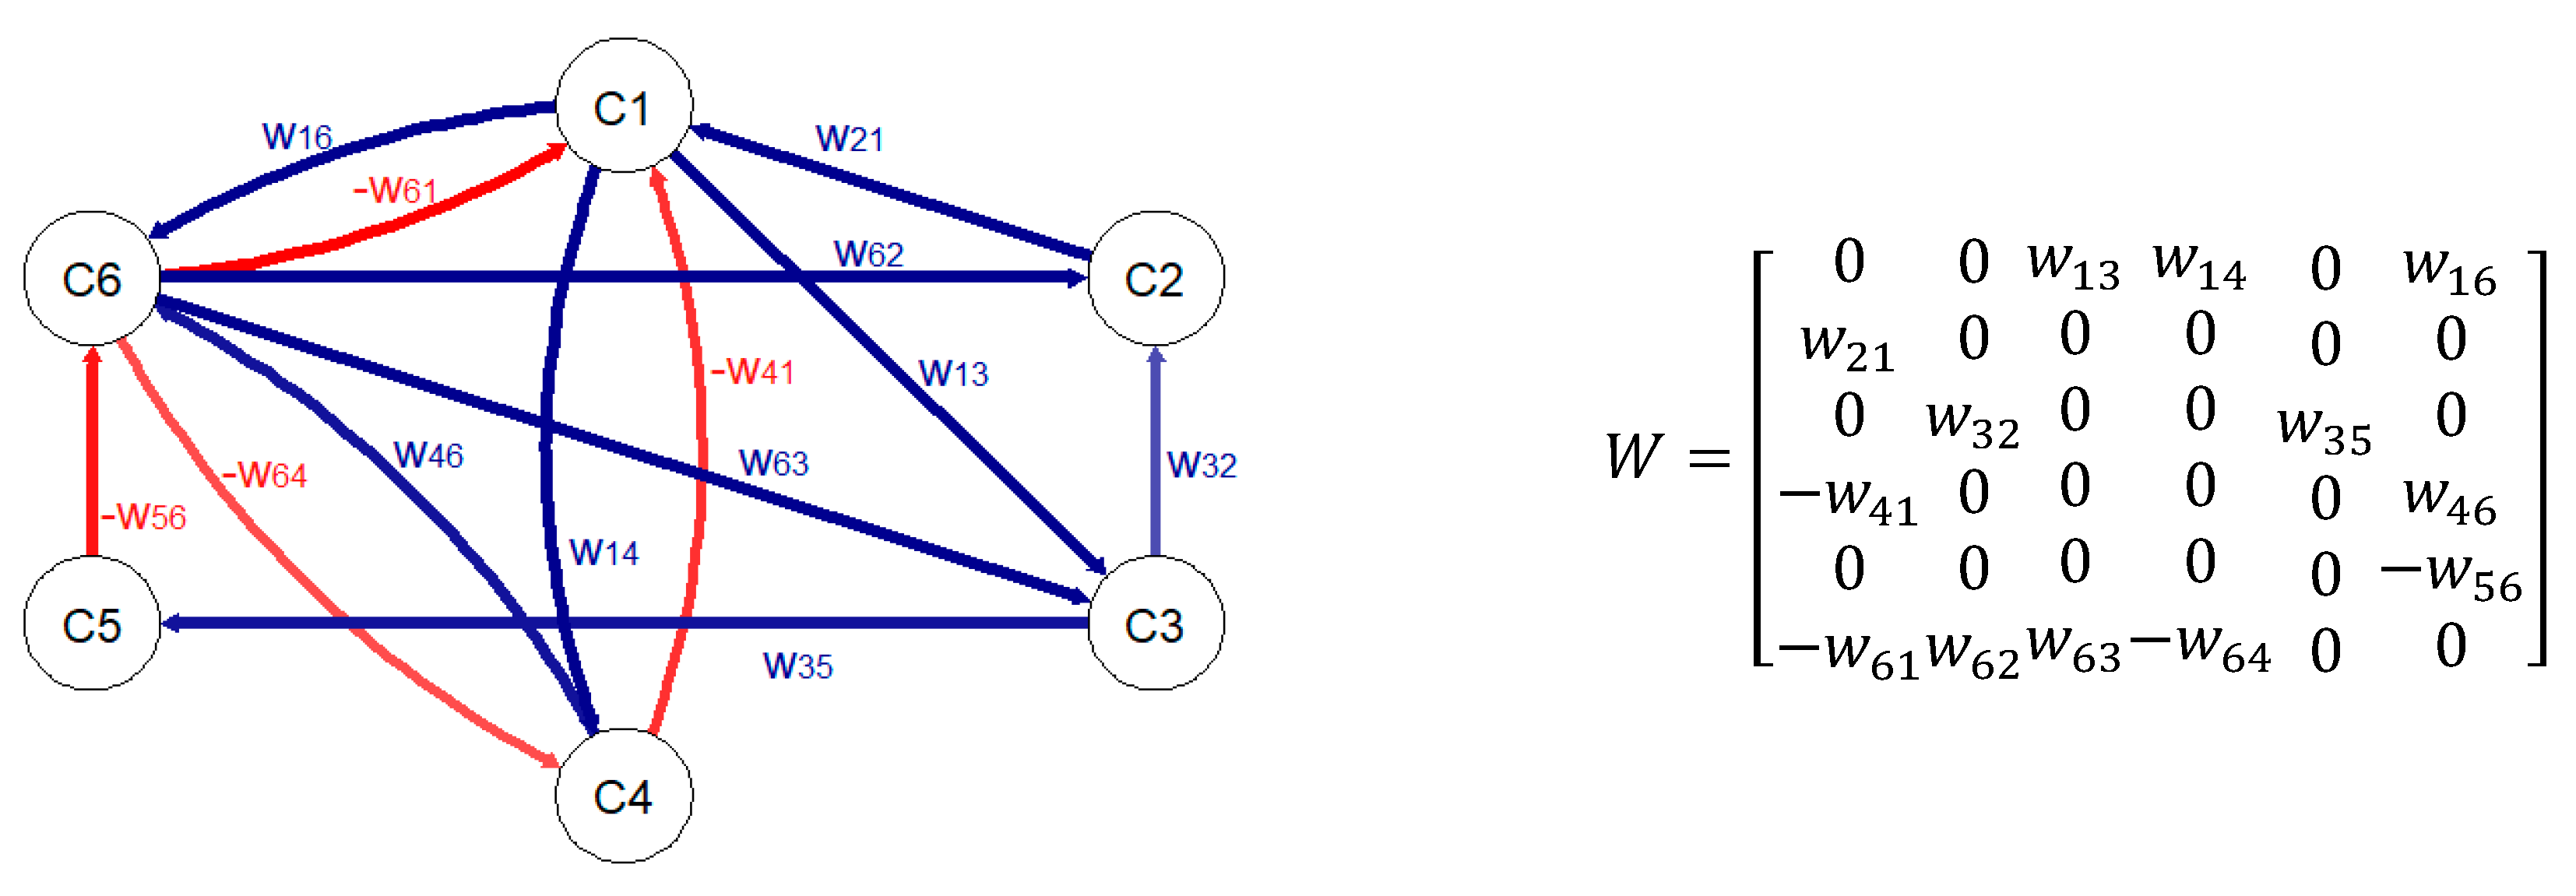
A set of nodes (concepts), representing the key elements of the given system, and directed arcs (links), defining the causal relationships between the nodes, form an FCM [
35]. Each concept is indicated by
Ci,
i = 1, …,
N (where
N is the number of concepts in the problem domain) and is also specified by an activation value
Ai in [0, 1]. The links are labeled with fuzzy weights in the interval of [0, 1] or [−1, +1], which show the strength of the impact between the concepts [
36]. Weights of links are associated with a weight value matrix E NxN, where each element of the matrix
wij takes values in [−1, +1]. There are three types of weights:
wij = 0 indicates no causality between concepts;
wij > 0 indicates a causal increase (i.e., Cj increases as Ci increases, and Cj decreases as Ci decreases);
wij < 0 indicates a causal decrease (i.e., Cj decreases as Ci increases, and Cj increases as Ci decreases).
Word weights like “little” or “somewhat” can be used instead of numeric values [
37].
Figure 1 shows an example of a FCM with its corresponding adjacency weight matrix.
An FCM is not a static representation of the world; FCM’s graph structure facilitates causal reasoning, where calculations can be made to assess the consequences of a specific system state. In [
38],
auto-associative neural network mechanisms were used to study the system dynamics of FCM models and produce projections for different possible scenarios.
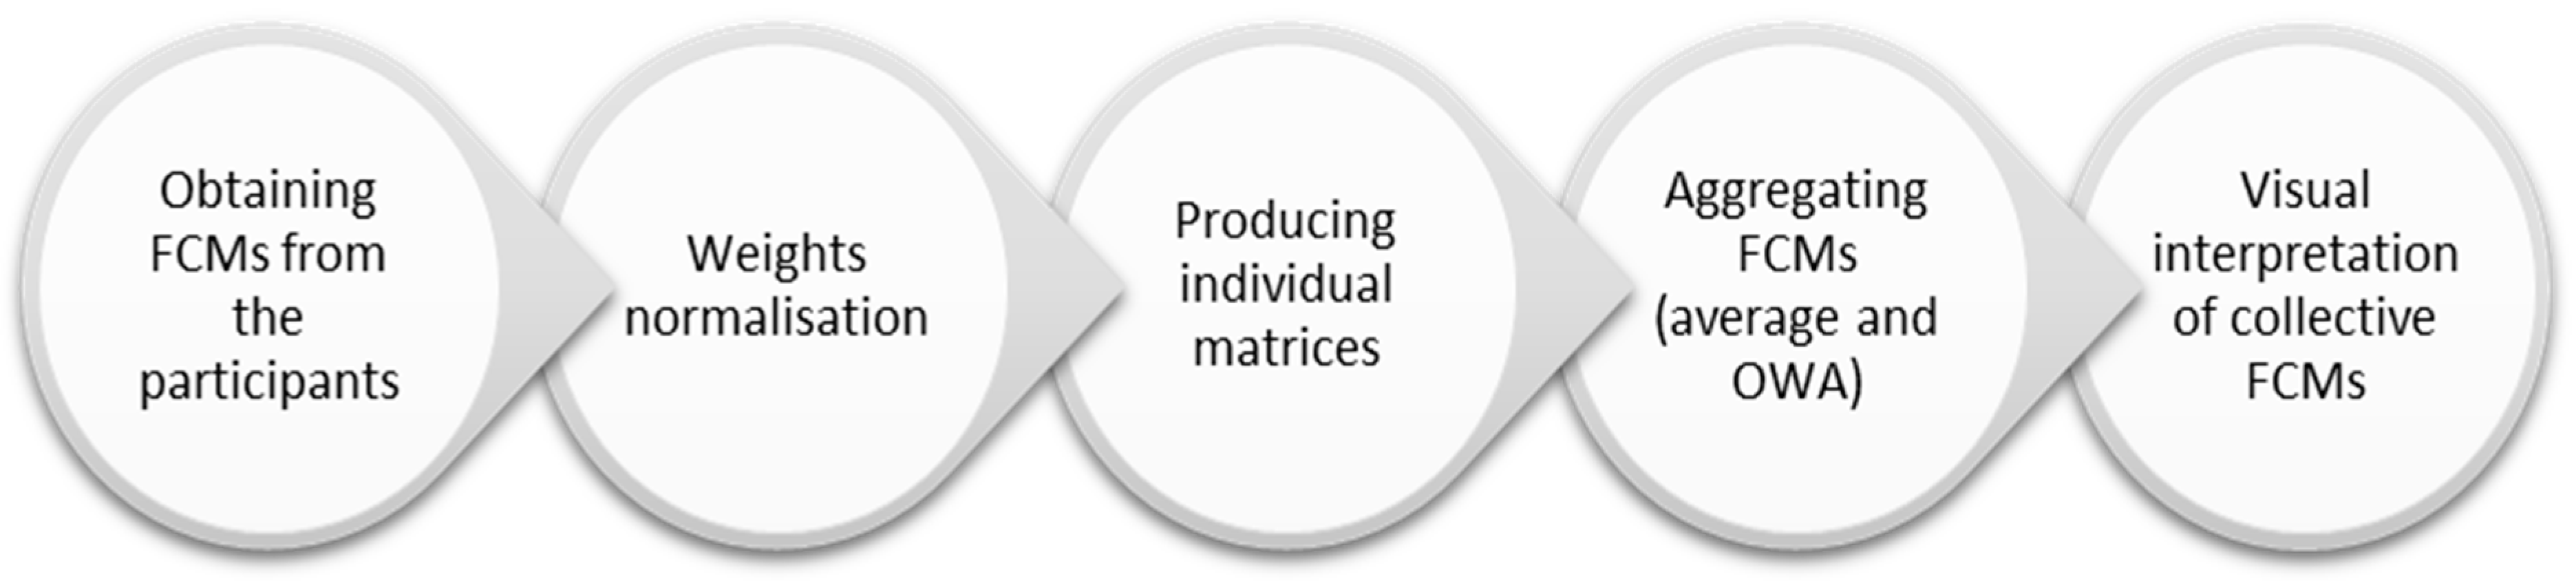
We used a multi-step FCM development process, as shown in
Figure 2.
2.2. Obtaining Cognitive Maps from the Participants
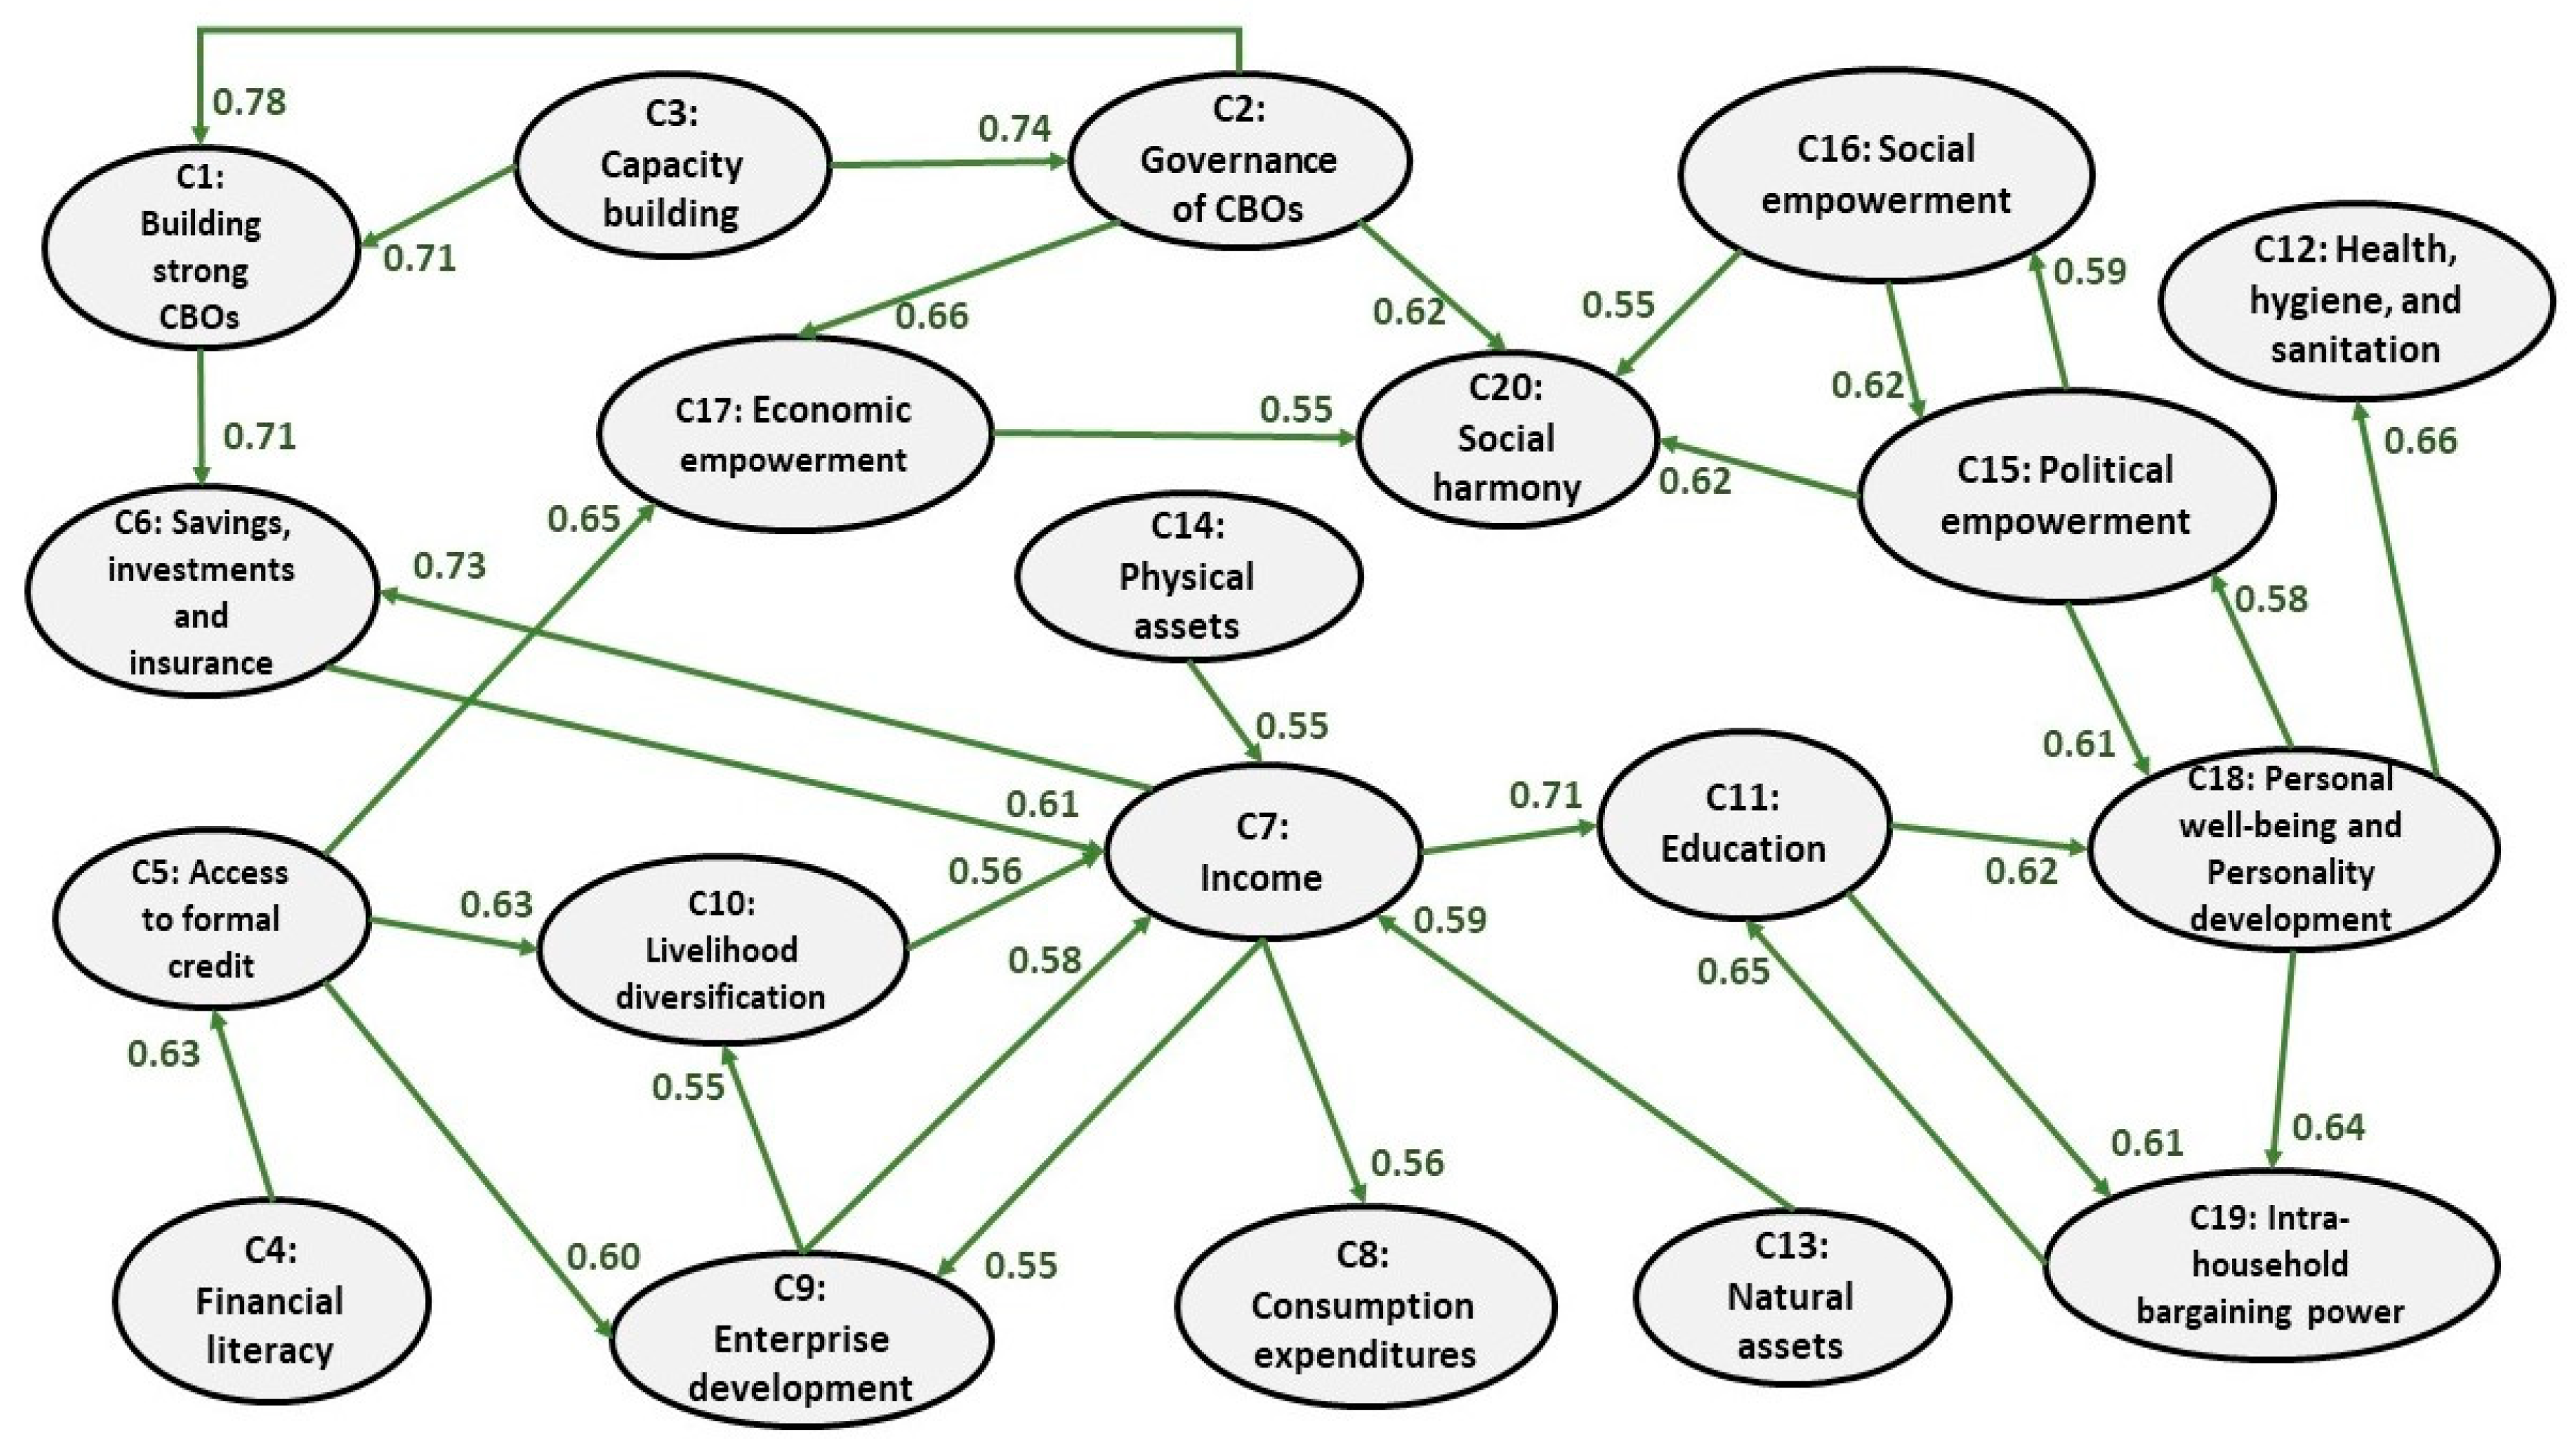
This study adopted a mixed-concept design approach for obtaining cognitive maps involving open-concept design followed by closed-concept design. Expert-based FCM was obtained using open-concept design. A total of 31 national and state-level implementers identified 20 categories of main concepts and 129 sub-concepts. The visual representation of this expert-based FCM model is depicted in
Figure 3, which will be further compared with the models derived from the aggregation processes in order to help this study meet its goals.
We prepared a protocol/instrument based on the expert-based FCM model drawing all the 20 categories of main concepts and 129 sub-concepts on the paper.
Four different groups of women functionaries of DAY-NRLM of Jammu and Kashmir state of India―The Self-Help Groups (SHGs), the Village Organization (VOs), the Cluster Level Federations (CLFs), and the Community Resource Persons (CRPs) constructed FCMs in groups of 4–5 members. The SHGs group consists of 36 participants, the VOs have 52 participants, and the CLFs comprise 60 participants, whereas the CRPs include 31 participants. We generated a list of SHGs, VOs, and CLFs, to be interviewed for the FCM exercise, using “Microsoft Excel RAND function” from the 10 districts of Jammu and Kashmir, 5 districts from each region. In total, 179 individual fuzzy cognitive maps were collected during the FCM exercise from approximately 600 participants coming from 10 districts of the state of Jammu and Kashmir in India.
Every key concept was formed from a list of certain sub-concepts that define it well. The sub-concepts were introduced by the experts and policymakers to offer a deeper understanding of the examined problem, making it clear to the participants.
Table 1 illustrates all the sub-concepts for each key concept.
Meanwhile, participants of all the four groups (SHG, VO, CLF, and CRP) were asked to assign a numerical value (degree of significance) to every sub-concept on a scale of 1–10 in order to assess the impact of each sub-concept to the corresponding key concept. An overall average degree of significance was calculated for every key concept to estimate the significance of each concept in the examined FCM model. This process also helped us in the next step, with the selection of the most important concepts for policy-making for the scenario analysis.
Table 2 illustrates an example regarding the mean values of the degree of significance for the three sub-concepts of the key concept C1, from each group of the Kashmir region, along with the calculated average value (degree of significance) that corresponds to the key concept C1.
2.3. Coding Individual Cognitive Maps into an Adjacency Matrix
Individual fuzzy cognitive maps were coded into separate excel sheets to form adjacency matrices [
39,
40]. The values were coded into the square matrix only when a connection existed between two concepts [
39]. Weights given to each link were then normalised between 0 and +1 (the value 7 was normalised to 0.7) for coding into the adjacency matrix [
40,
41,
42].
2.4. Aggregating Individual Fuzzy Cognitive Maps from Each Group to Produce Aggregated FCMs
All coded maps from each group were aggregated using the two aggregation methods, the weighted average, and the OWA, to make collective fuzzy cognitive maps. Two collective FCMs were created for every group of participants for each aggregation method, named as the average-FCM and OWA-FCM.
2.4.1. Average Aggregation
We aggregated individual FCMs to form collective-FCM through matrix addition [
39,
41,
43,
44,
45]. The collective-FCM represents the perception of all members of a particular stakeholder group.
Considering
n stakeholders assign a weight value
between the nodes
and
on individual FCMs, then the aggregated weight
between the average value of the
n weights
:
2.4.2. OWA Aggregation
An OWA operator [
19] of dimension n is a mapping:
that has an associated weighting vector
W
such that
where
where
is the jth largest element of the collection of the aggregated objects
. The function value
determines the aggregated value of arguments
.
A fundamental aspect of the OWA operator is the re-ordering step, in particular, an argument is not associated with a particular weight but rather a weight is associated with a particular ordered position of the arguments. A known property of the OWA operators is that they include the , and arithmetic mean operators for the appropriate selection of the vector :
For ,
For ,
For .
It can be easily seen [
46] that the OWA operators are aggregation operators, satisfying the commutativity, monotonicity, and idempotency properties and are bounded by the
and
operators, for OWA operators:
Because this class of operators runs between the
and the
the author of [
24] introduced a measure to characterise the type of aggregation being performed for a particular value of the weighting vector. This measure, called the
of the aggregation, is defined as:
As suggested by Kosko [
24], this measure, which lies in the unit interval, characterises the degree to which the aggregation is like an
operation. It can be shown as follows:
Therefore, the, , and arithmetic mean operators can be regarded as OWA operators with degree of orness, respectively, 1, 0, and 0.5.
2.4.3. Learning OWA Operators for Aggregating FCM Weights
This study took into consideration a previously conducted preliminary research [
47] about an alternative FCM aggregation method using OWA operators and made it one step further. Specifically, learning OWA operators’ weights were introduced for aggregating FCM connections/links defined by multiple experts and/or stakeholders. This work focused on developing an alternative aggregation methodology for the FCM modelling, in order to fill the absence of learning OWA operators in aggregation of weights in FCMs, considering that FCMs have been proposed as a unique methodology able to aggregate diverse sources of knowledge to represent a “scaled-up” version of individuals’ knowledge and beliefs [
39,
48]. Moreover, learning operators were used in this study for defining weights among the concepts, so that the studying of the OWA aggregation approach would be strengthened in terms of performance. This method has particularly broad applicability and had high effectiveness when a large number of participants/stakeholders were present. A complex real-life strategic decision-making problem was studied, in which the proposed methodology was applied in order to examine/validate this approach. Specifically, the studied problem dealt with the aggregation and modeling of communities’ perception, as well as scenario analysis using the FCM-based simulation process implemented by the new FCMWizard tool [
31].
In this study, we present an algorithm that can be used for aggregating weights assigned by experts/stakeholders’ opinion in designing FCMs. The proposed algorithm learns the weights associated with a particular use of the OWA operator from a group of experts and/or stakeholders of the specific scientific domain. The OWA weights can be obtained through the following procedure:
At first, experts’ opinions are considered as argument values ().
Step 1: Generate slightly different parameters ρ for each argument which represents the optimism of the decision-maker, .
Step 2: Calculate the aggregated values for each sample using the Hurwics method, according to which the aggregated value
d obtained from a tuple of n arguments,
is defined as a weighted average of the
Max and
Min values of that tuple.
Step 3: Reorder the objects .
Step 4: Calculate the current estimate of the aggregated values
dk
with initial values of the OWA weights
w1 = 1/
n.
Step 5: Calculate the total
for each
i. The parameters
determine the weights of OWA and are updated with the propagation of the error
between the current estimated aggregated value and the actual aggregated value [
39].
Step 6: Calculate the current estimates of the
with initial values
(0)=0,
and a learning rate of
β = 0.35.
Step 7: Use
,
, to provide a current estimate of the weights
Step 8: Update wi and at each iteration until the estimates for all the converge to, that is, Δ = | − |, are small.
In what follows, an explanatory paradigm considering three experts will better illustrate the proposed FCM construction approach in an environmental domain.
As mentioned above, the experts’ opinions are considered as argument values
and the weight between two concepts as a sample. Zero values for weights were not considered in the aggregation process. An FCM model consisting of 7 concepts and 14 weighted connections among concepts was selected to show how the above steps are implemented (
Table 3).
We calculated the aggregated values using various values for parameter ρ within ρ . For example, ρ = 0.153; 0.131; 0.181; 0.075; 0.055.
Using
min and
max values of ρ, the aggregated value of weight was calculated as follows.
We initialised
and
. The estimated values of
after 108 iterations were
The following OWA weights were calculated considering the above
:
We followed the same process for parameter ρ for and
Table 4 depicts the calculated values for OWA aggregated weights for all interrelationships among FCM concepts, as well as the deviations between the benchmark weight Wb (average method) and the Wowa, weight produced by learning OWA operators.
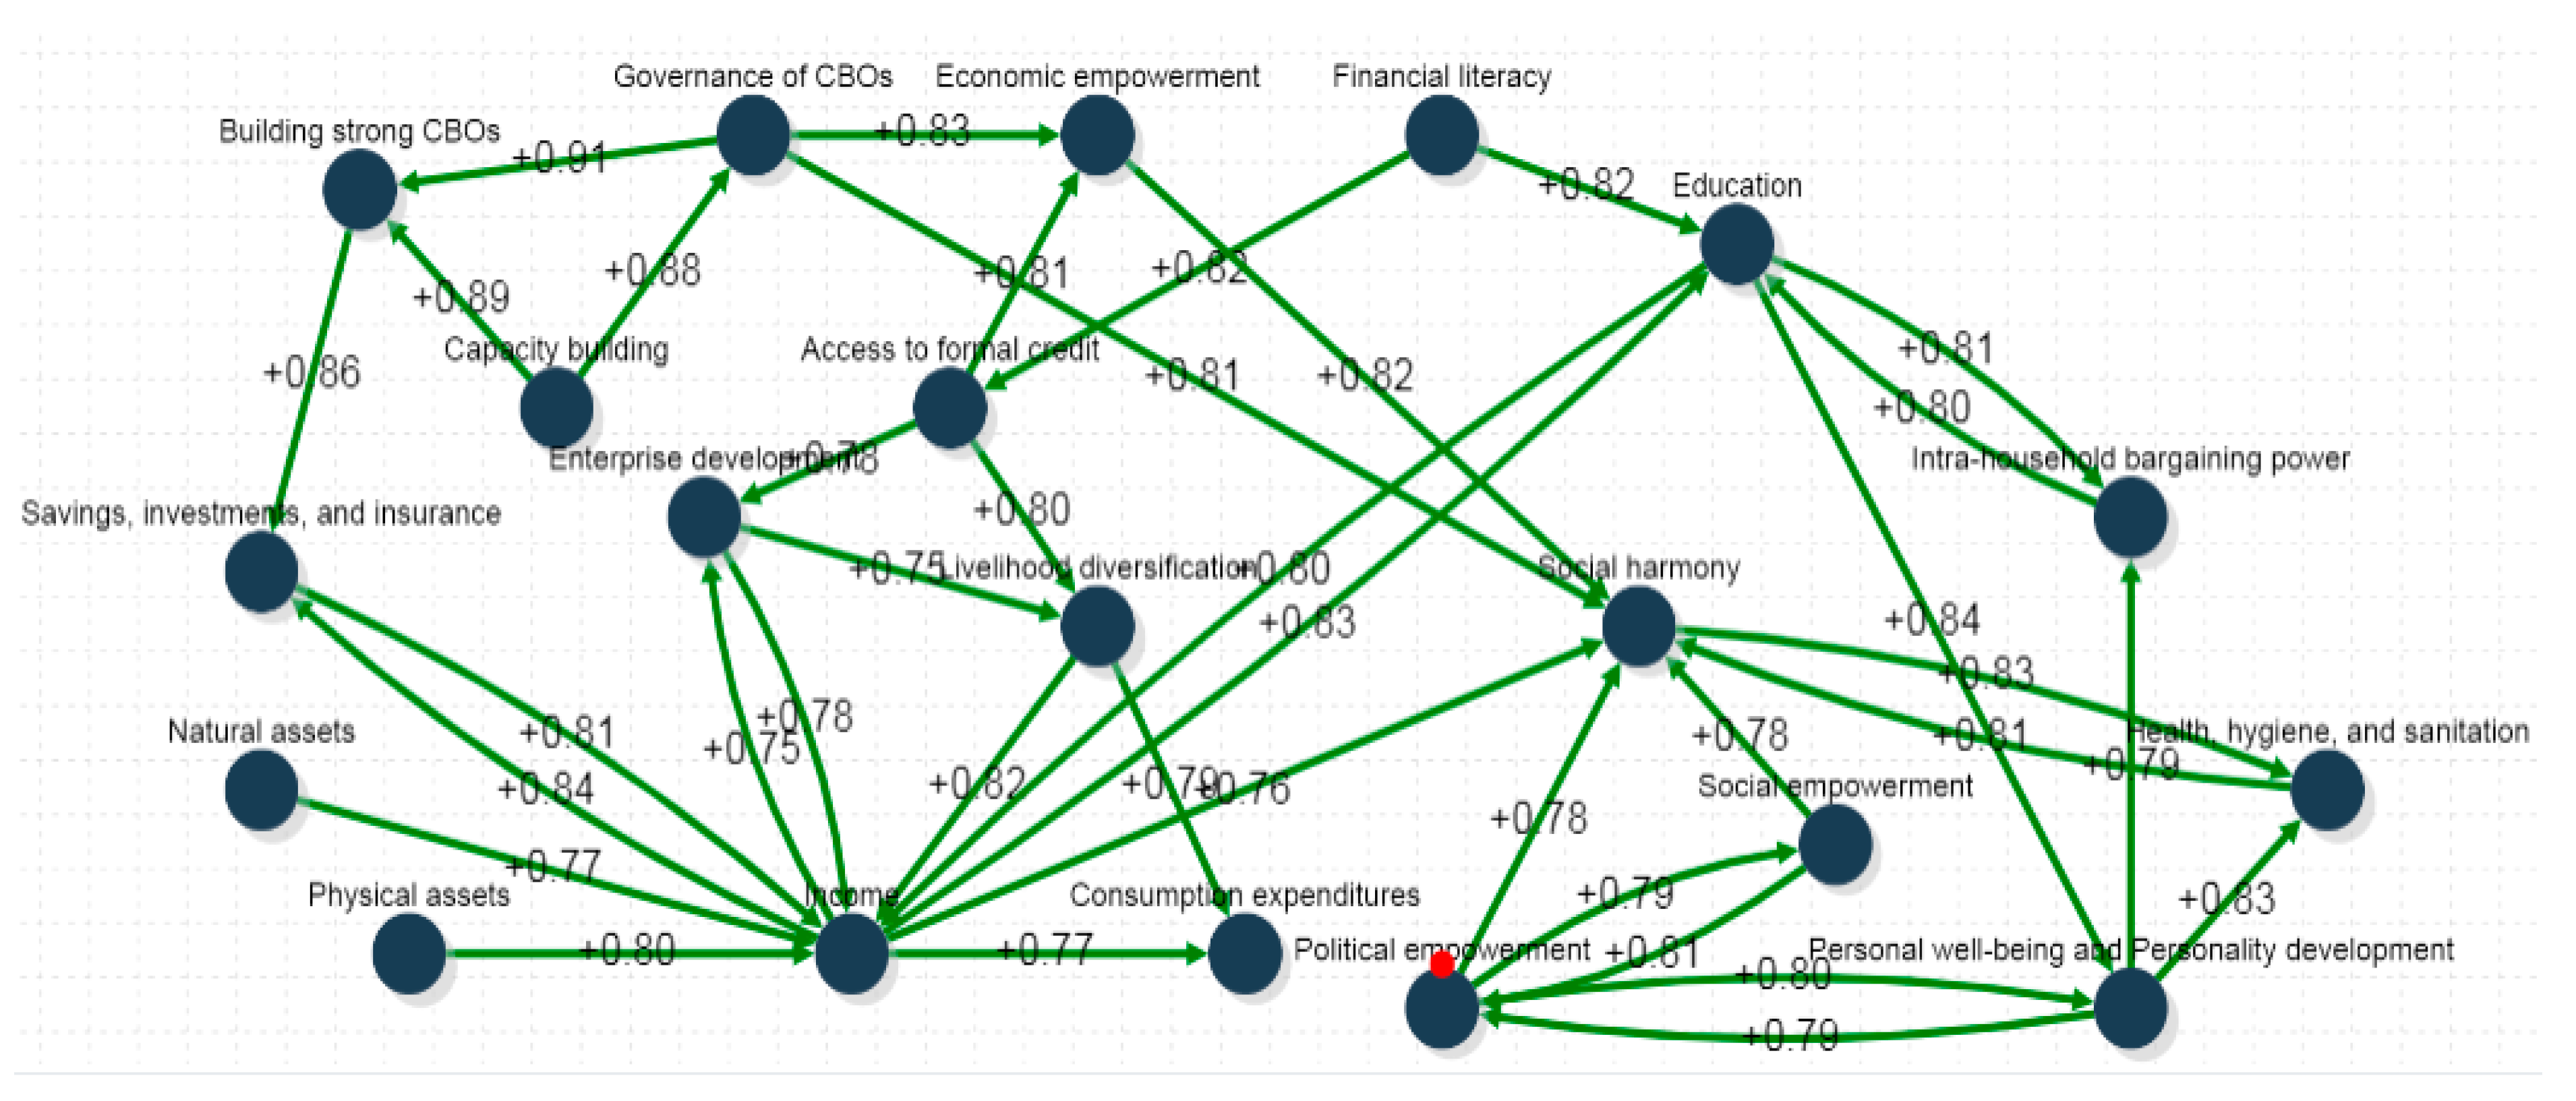
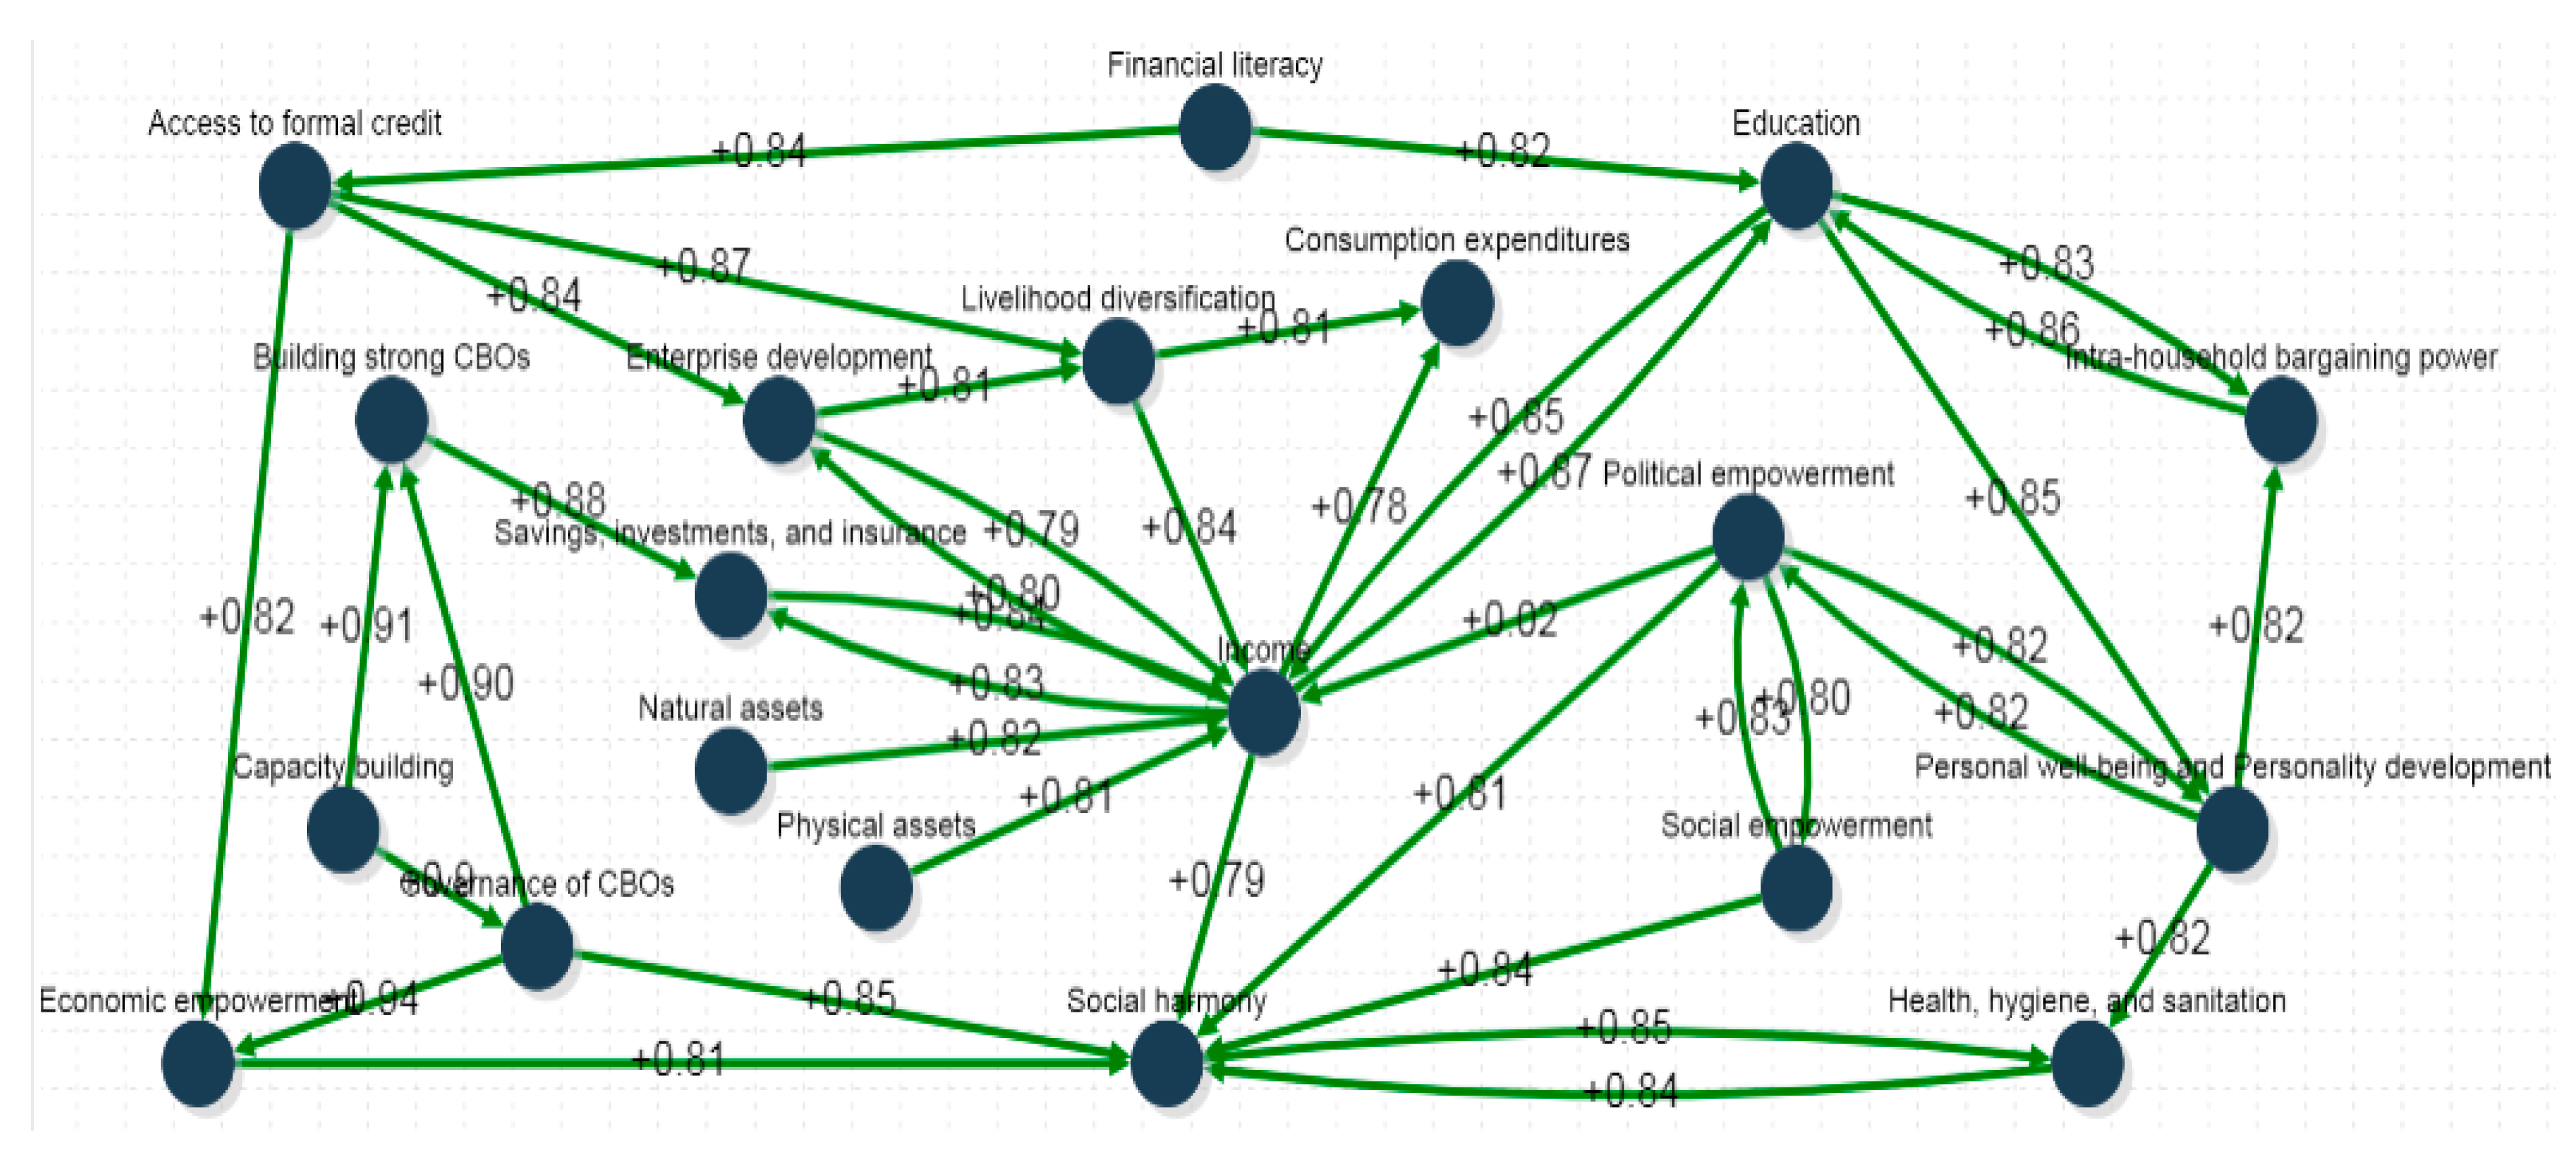
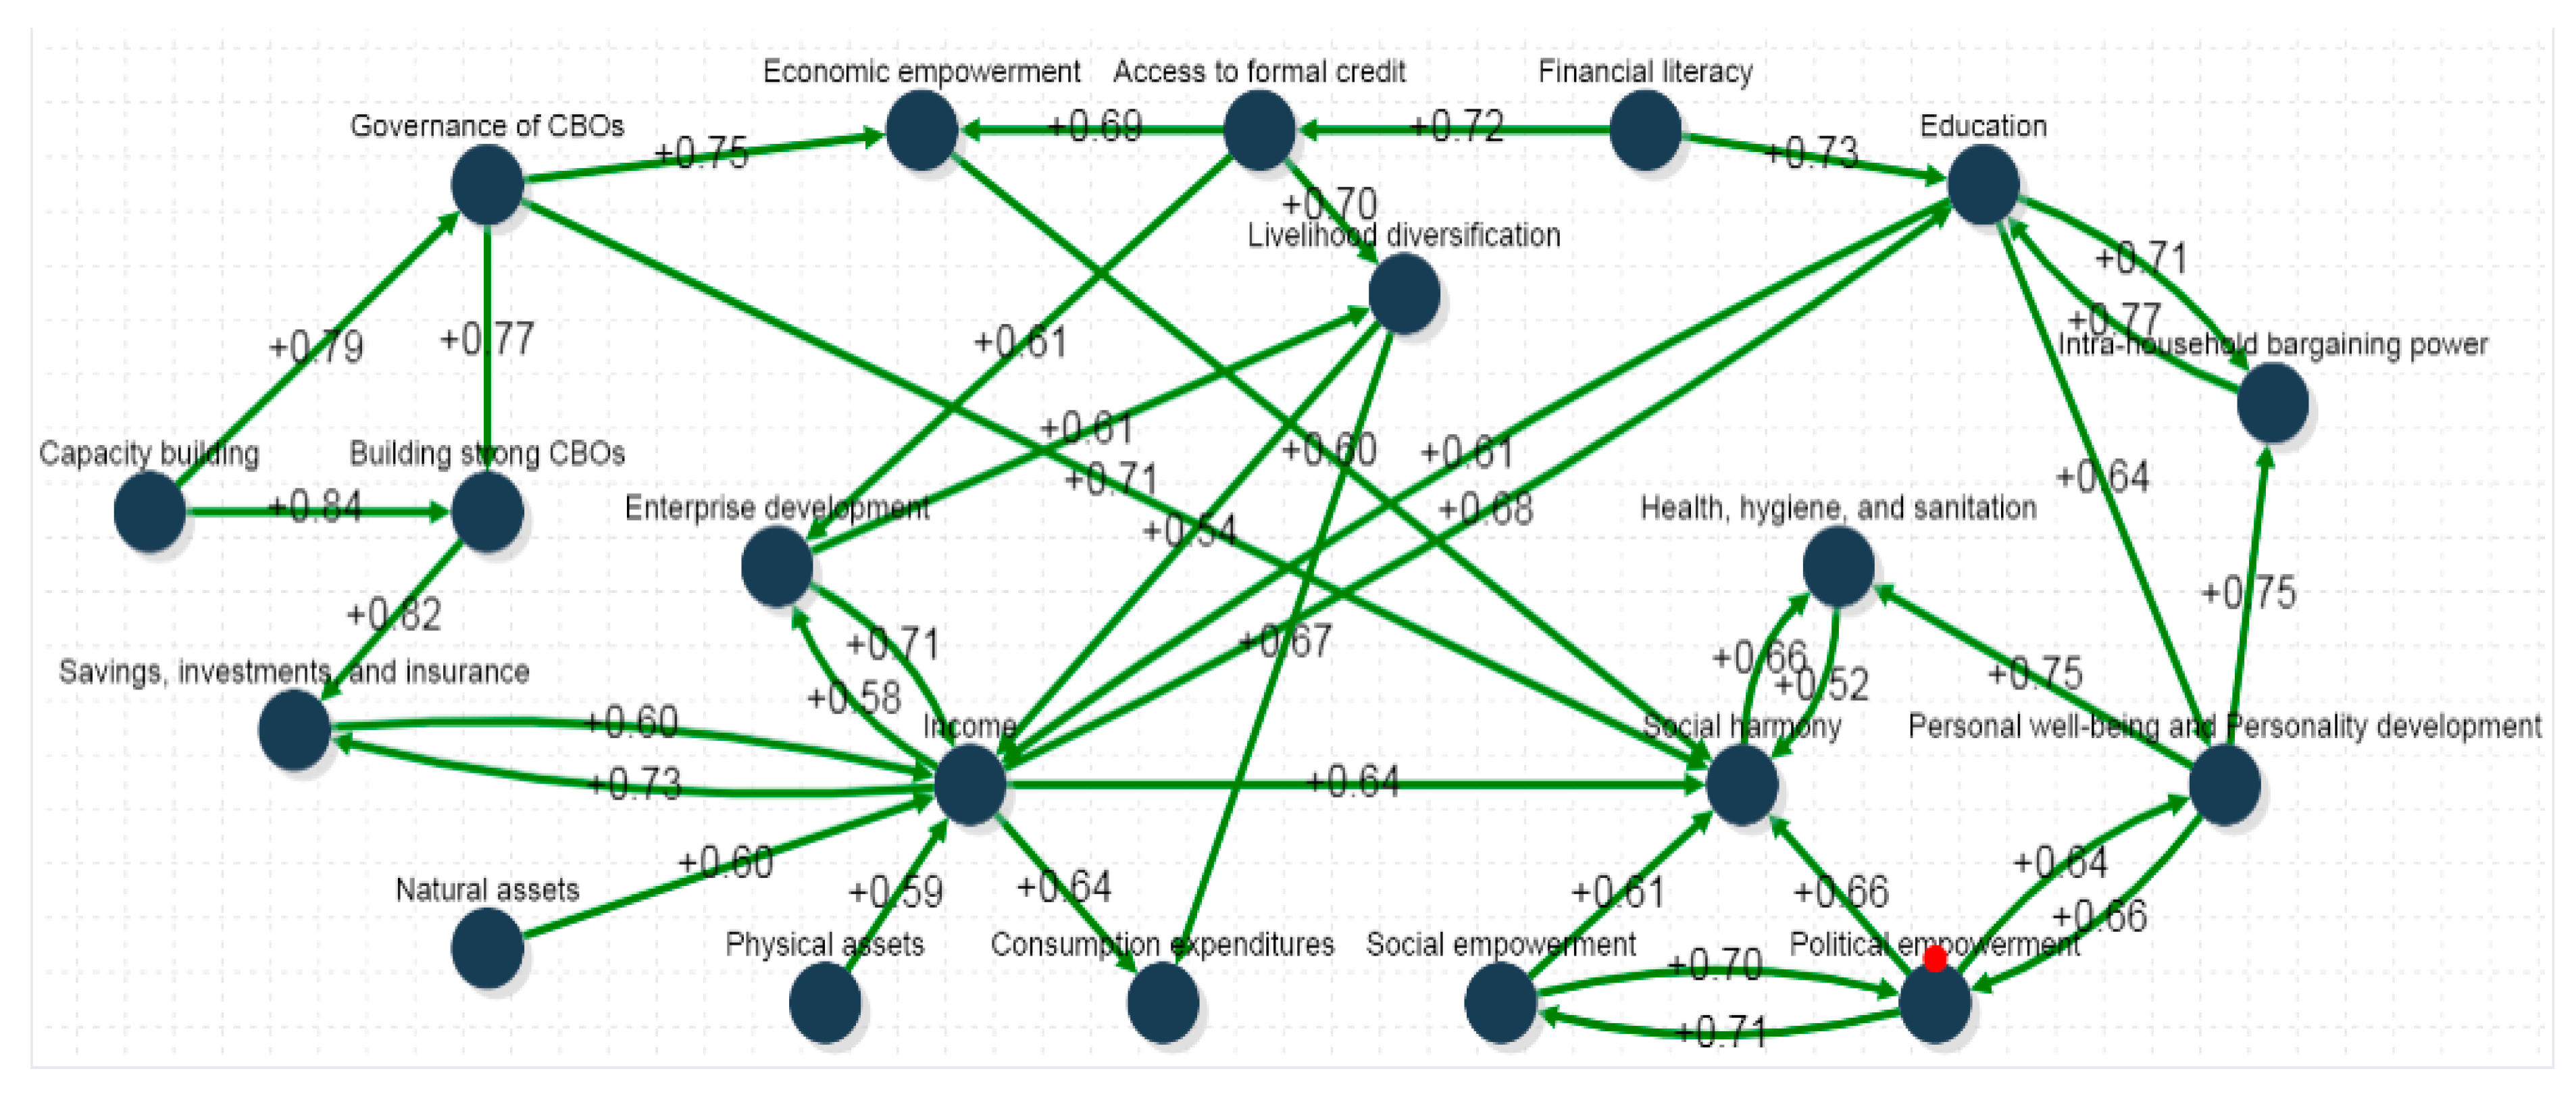
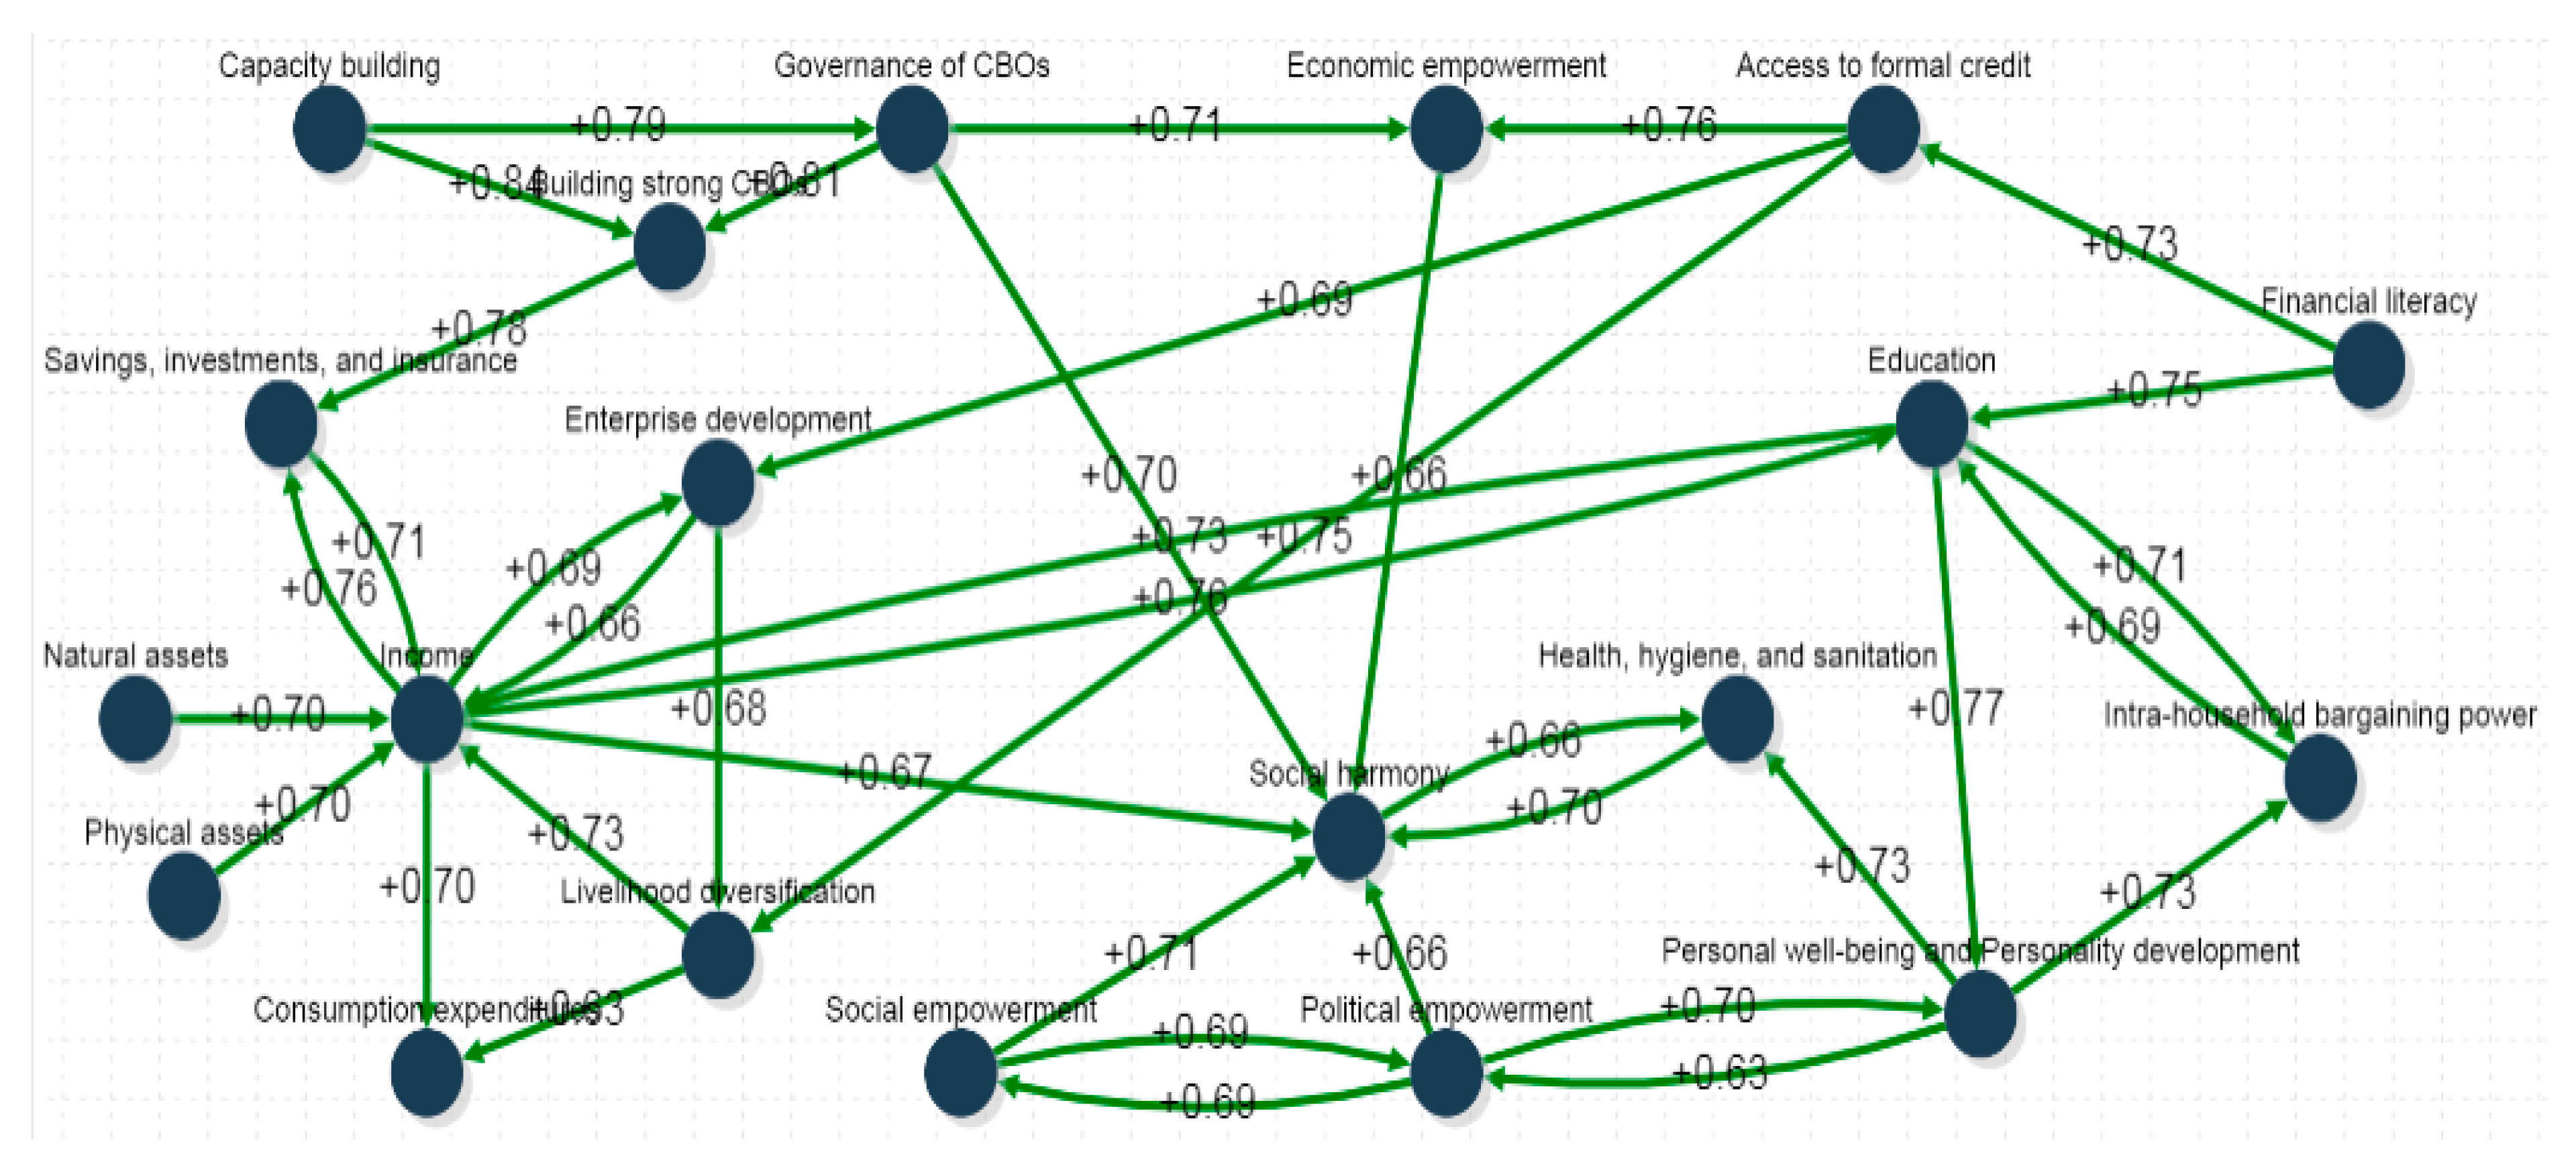
2.5. Visual Interpretation of Collective FCM
The collective FCMs were analysed using the FCMWizard software tool (
www.fcmwizard.com) [
31]. The tool includes modelling and visualisation capabilities for the consensus FCM models, depicting the connections among the factors and also reflecting the importance of different concepts within various asset classes [
43]. The average-FCM models designed by each group (SHG, VO, CLF, CRP) and produced by the FCMWizard tool are illustrated in the figures below (
Figure 4,
Figure 5,
Figure 6 and
Figure 7).
2.6. FCM-Based Simulations
Typically, an FCM of
concepts could be represented mathematically by an
weight matrix (
). By feeding the fuzzy cognitive map with an initial stimulus state vector
X(k) (state vector at time (
k)), it can model the evolution of a scenario over time by evolving forward and letting concepts interacting with one another. Each subsequent value of the concept state
X(k+1) can be computed as previous state
X(k) and weight matrix multiplication, according to Equation (14):
Based on the literature, two other equations were proposed for FCM inference, the modified Kosko (Equation (15)) and the rescaled Kosko (Equation (16)):
where
is the value of concept
at simulation step
is the value of concept
at the simulation step
is the weight of the interconnection between concept
and concept
and
is the threshold transfer function used to retain the values within the range of [0, 1] or [−1, +1]. Generally, the most commonly used transfer function is Sigmoid [
49], as shown by Equation (17).
where
is a real positive number (
, which determines the steepness of the continuous function
, and
is the value
for a given iteration.
The simulation stops when the system reaches equilibrium, that is, a limit vector is reached as Xt = Xt−1 or when Xt − Xt−1 ≤ e, where e is a residual, describing the minimum error difference among the subsequent concepts. Its value depends on the application type and it is typically set to 0.001.
3. Results and Discussion
3.1. Characteristics of the Key Concepts of the DAY-NRLM Programme
When there are a large number of concepts that need to be studied individually, then it is necessary to keep only the most influential ones. The filtering technique of key concepts is common in scenario planning and helps linking storylines to the quantitative model, as well as to pay attention to pivotal concepts that can influence, directly or not, the outcome of the examined system, or even significantly change its balance [
50]. Key concepts were mainly identified by the experts in the FCM-based scenario analysis or emerged by certain characteristics of the studied model. There were three indicators, based on the connection weights, which help researchers to recognise the important key concepts of the system―indegree (weight of inbound links), outdegree (weight of outbound links), and degree centrality. The first two indicate to what extent a concept is a transmitter (influential) or receiver (dependent). This is similar to the bi-dimensional categorisation of influence-dependence axes in cross-impact analysis [
51]. Degree centrality is the relative importance of a concept within the FCM structure, which is calculated by the sum of the corresponding absolute indegree and outdegree causal weights [
52]. These calculated indices for the collective average-FCM, along with the concepts identified previously, are summarised in
Table 5. Additionally, the overall specifications of the above FCM model are presented in
Table 6.
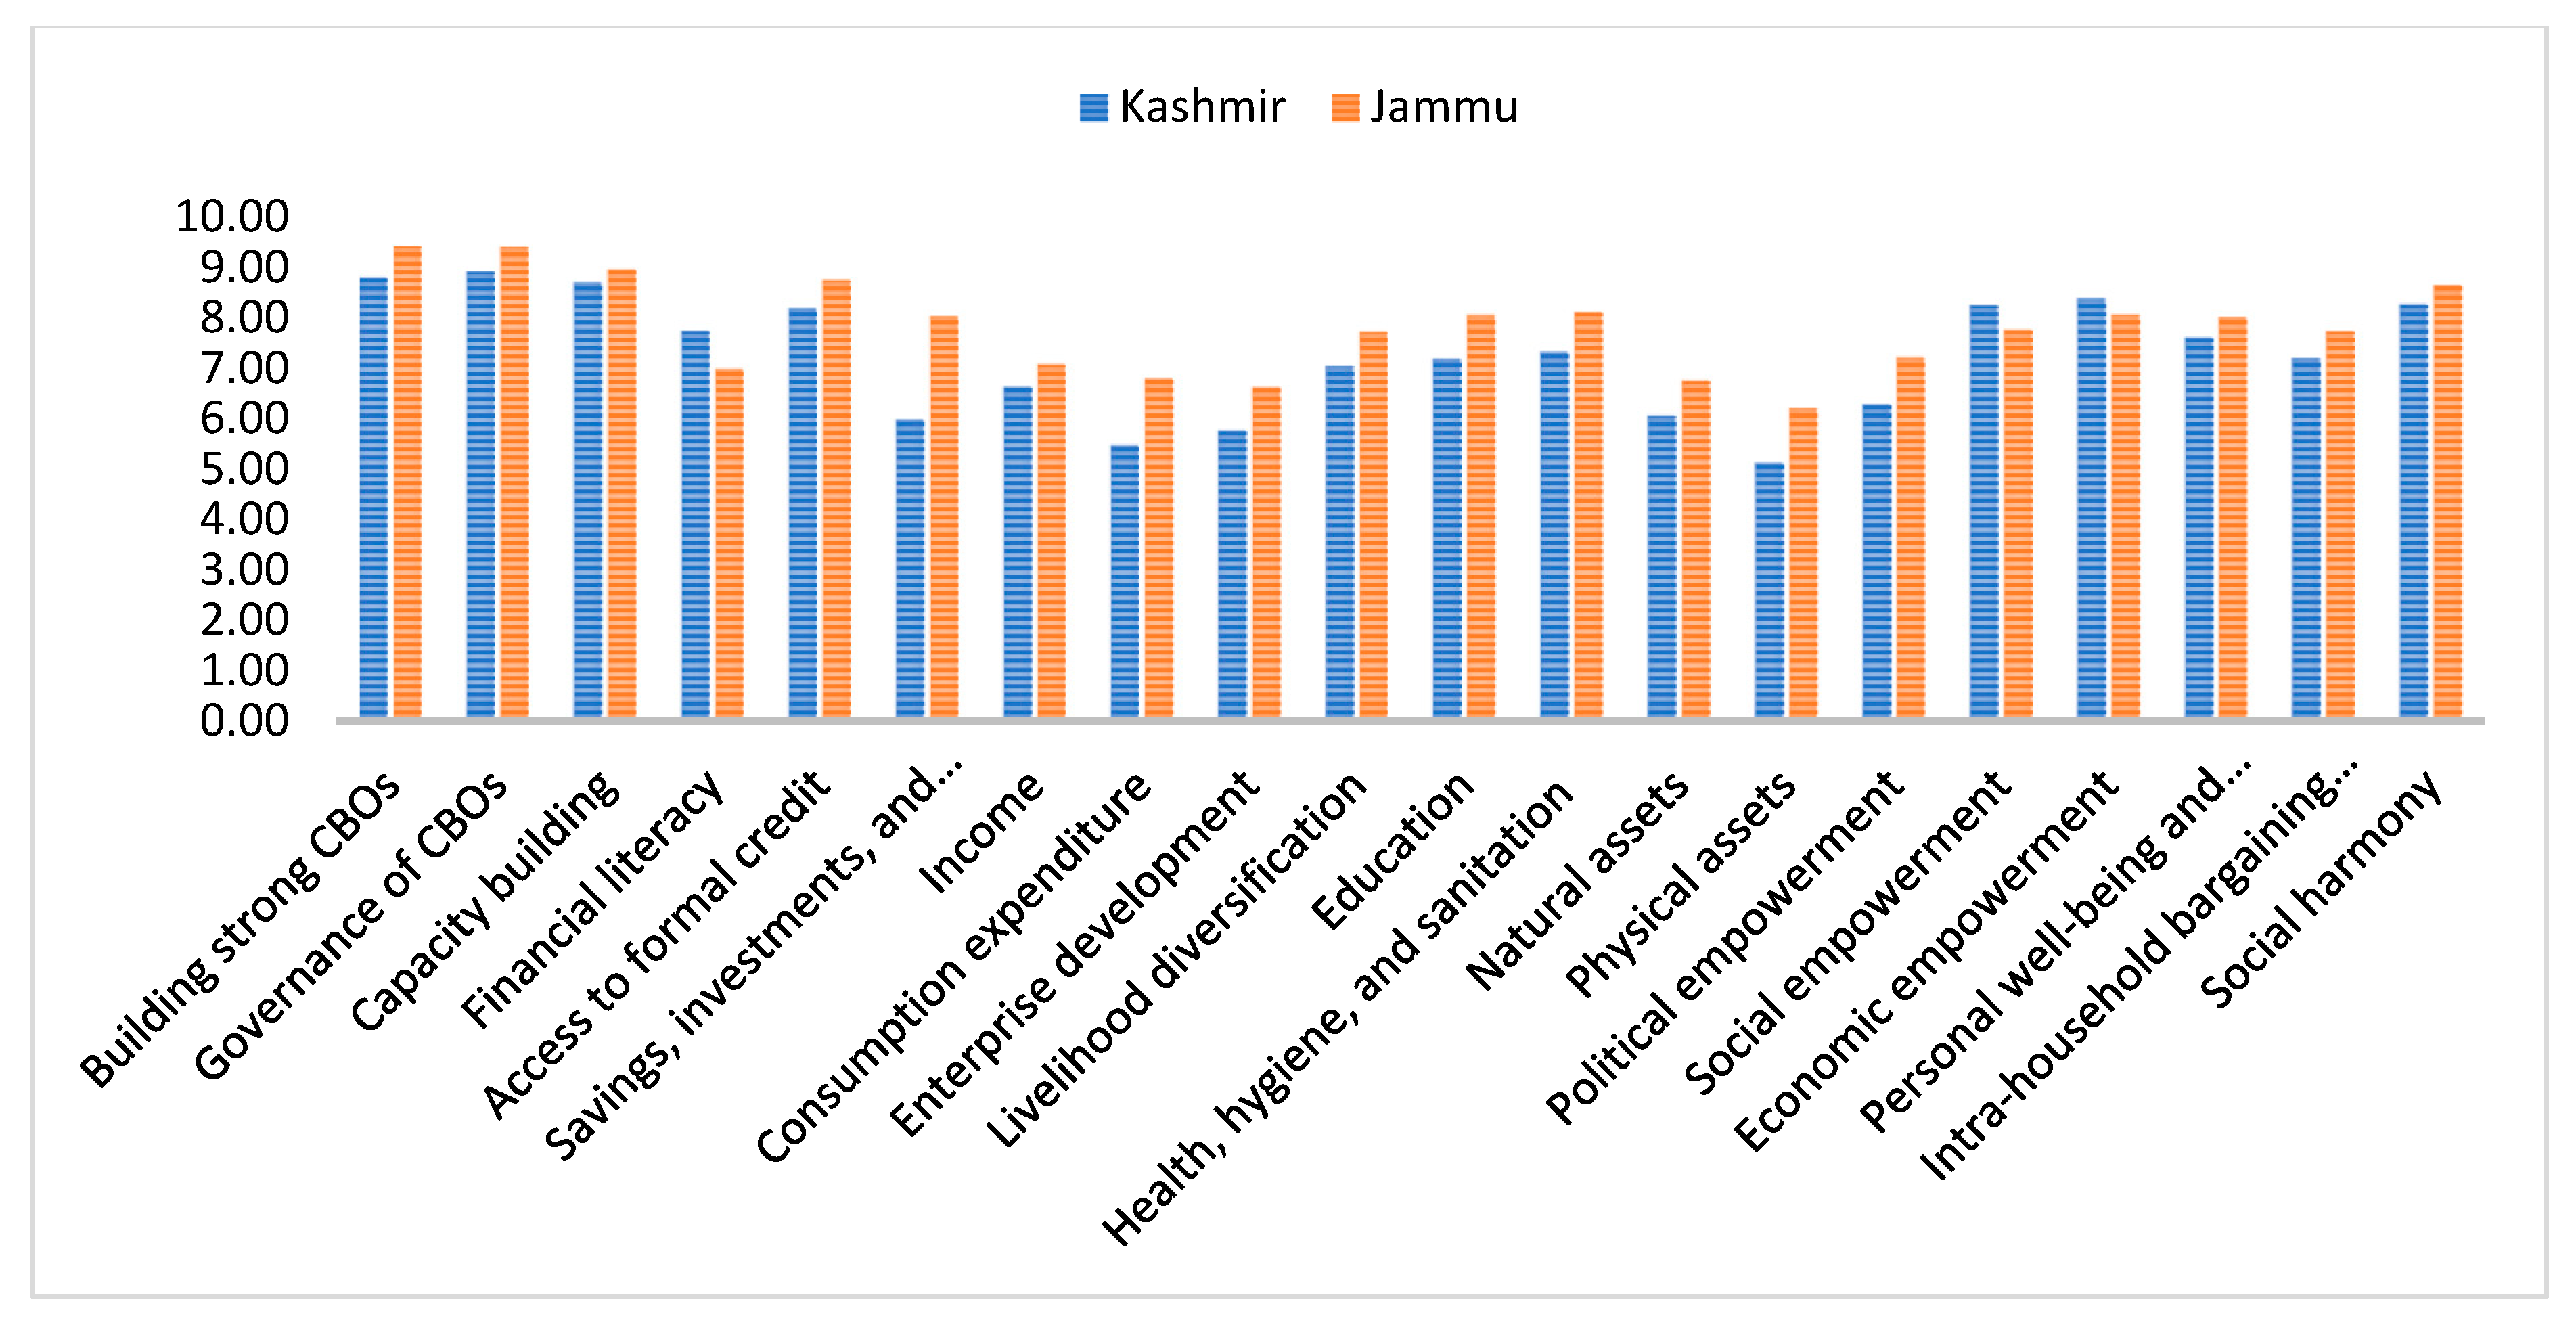
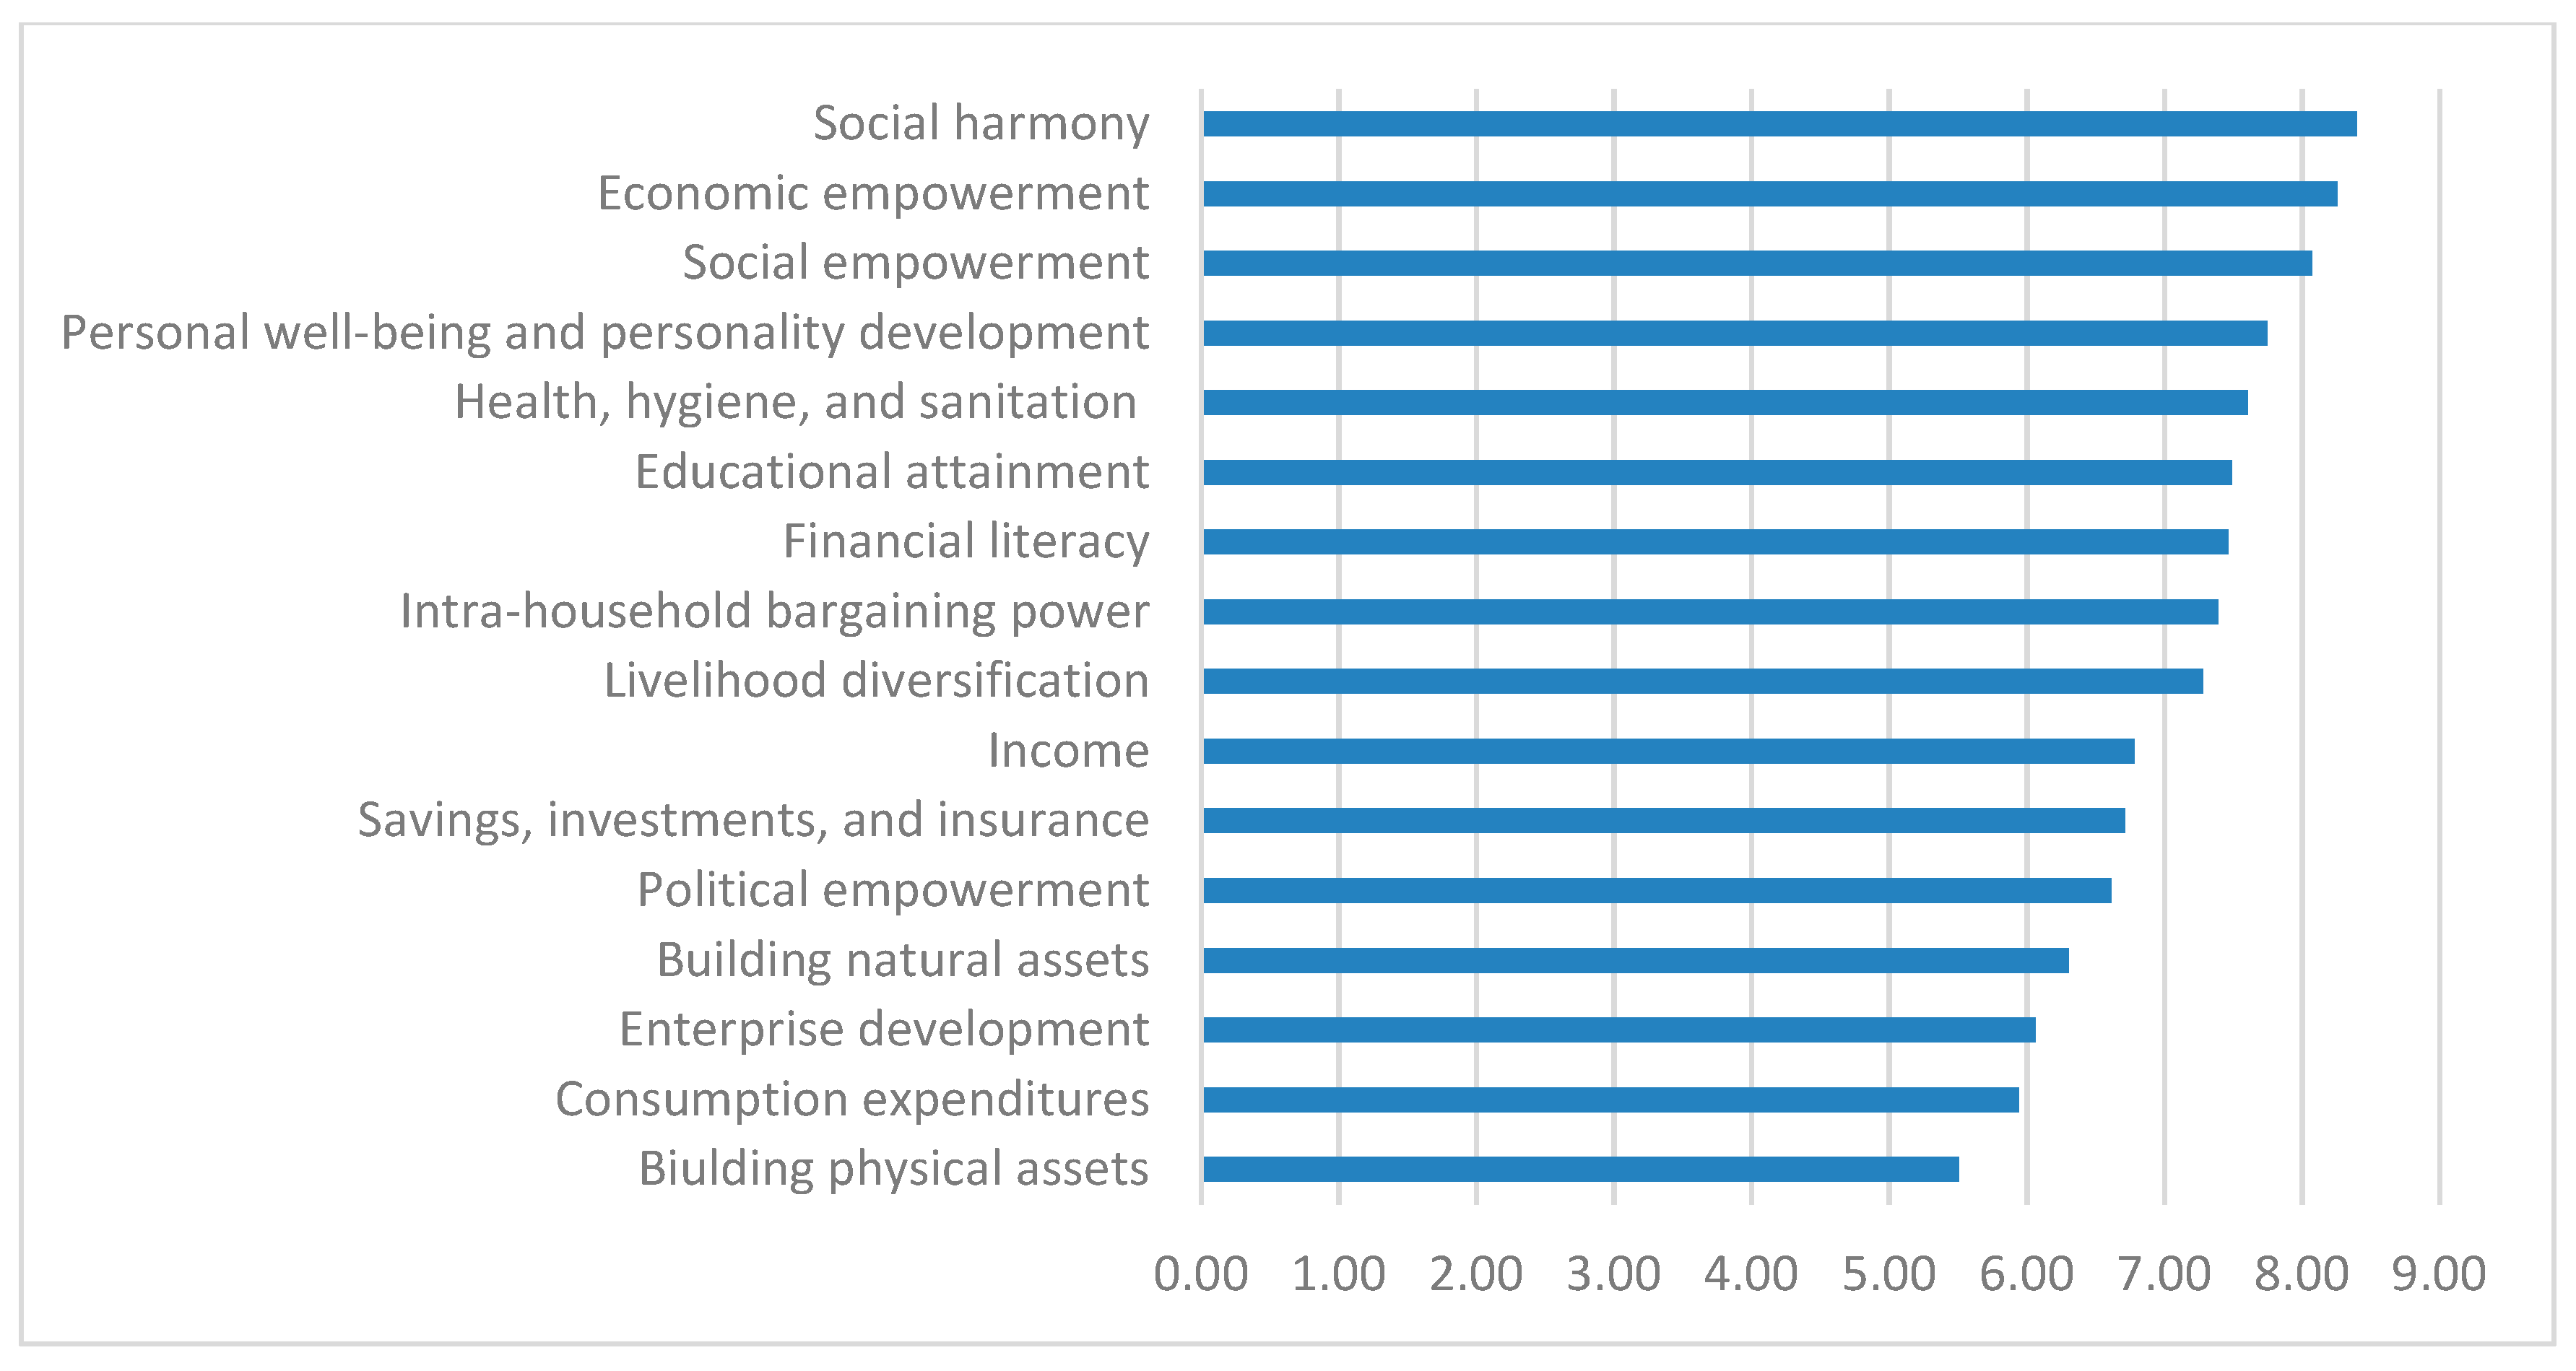
3.2. Characteristics of the Sub-Concepts of the DAY-NRLM Programme
Every participant was given a list of sub-concepts for each key concept (as presented in
Table 1) to assign a degree of significance on the scale of 1–10, where 10 is the most significant sub-concept and 1 the least significant. This procedure was followed for two regions, Jammu and Kashmir.
Table 7 includes the key concepts with the respective mean values for both regions, as well as the overall average value of the degree of significance, whereas the next figure (
Figure 8) illustrates these values in a graph for better visual interpretation of the results.
Having a thorough look at the values presented in
Table 8, it was observed that the concepts C1, C2, C3, C15, C17, C18, and C20 were among concepts with the highest values for both degree centrality and degree of significance. Moreover, comparing these values with the corresponding degree centrality of the aggregated and the expert-based FCM model, we can verify that the key concepts mentioned earlier can be indeed selected as the most significant ones, and will be further used in the scenario analysis.
3.3. Aggregation Results
In this section, the results produced from the application of the two aggregation methods on the FCM models are presented. The FCM models constructed by every participant group (SHG, VO, CLF, and CRP) were aggregated using the two aggregation methods, the average, and the OWA. A collective FCM was produced from each of these methods. The aggregation process was delivered with the help of the OWA tool that was developed for this purpose.
From the comparative analysis that was conducted among the aggregated average-FCM, OWA-FCM, and experts-based FCM, it was observed that the minimum mean deviation value (= 0.12) was located between the OWA-FCM and the experts-based FCM. This means that the OWA-FCM model resembles the structure of the Expert-based FCM and consequently can present a similar performance to the model constructed by the experts.
3.4. Scenario Results
3.4.1. Scenario Development
For the scenario analysis, the researchers identified the most important concepts (called decision concepts) that affected the status of the system being examined. During the FCM exercise, we also recorded the degree of significance of every key concept on the basis of the perception of over 600 participants of SHGs, VOs, CLFs, and CRPs. During the FCM exercise, the participants also identified the most significant concepts in the system. On the basis of the FCM models prepared by the participants, we can infer that social harmony (C20), women’s socio-economic empowerment (C16 and C17), and personal well-being and personality development (C18) were the most significant concepts, which are likely to have considerable impacts on the system. The results for the same analysis are presented in
Figure 9. The first established approach in scenario planning was the selection of the most important concepts. The seven concepts that were selected are C1—“Building strong CBOs”, C2—“Governance of CBOs”, C3—“Capacity building”, C5—“Access to formal credit”, C15—“Political empowerment”, C16—“Social empowerment”, and C17—“Economic empowerment”. These concepts, assigned by the programme participants and implementers, were selected properly as they were among concepts with the highest degree centrality, having both in/out-degree values, whereas their degree of significance was the highest among all key concepts (see
Table 8). Thus, they could significantly influence the dynamics of the system. The selected scenarios with their concepts are briefly presented in the following
Table 9.
Scenario 1 examined the effects of building CBOs (C1), whereas scenario 2 presented the effects of governance of CBOs (C2) in terms of SHGs, VO, and CLFs.
Scenario 3 presented the effects of capacity building of the CBOs (C3) in terms of governance and management.
Scenario 4 highlighted the effects of capacity building of the CBOs (C3) in terms of governance and management, along with access to formal credit (C5) in terms of micro-finance and SHG-bank linkage.
Scenario 5 showed the effects of governance of CBOs (C2) in terms of SHGs, VO, and CLFs, along with the capacity building of the CBOs (C3) in terms of governance and management.
Scenario 6 illustrated the effects of building strong CBOs (C1) in terms of SHGs, VO, and CLFs, and capacity building of the CBOs (C3) in terms of governance and management.
Scenarios 7 to 9 highlighted the effects of political (C15), social (C16), and economic (C17) empowerment of women, respectively. These empowerments represent political inclusion, political justice, participation in various village-level committees, savings, financial self-sufficiency, universal social mobilization, and social inclusion, among others.
3.4.2. FCM-Based Simulations/Scenario Analysis
FCM-based simulations can offer a deeper understanding of the concepts’ behavior and their relations in terms of how one concept affects others. The researchers conducted FCM-based simulations/scenario analyses for the respective case study. The simulation process was performed by “clamping” the initial values of the key concepts one-by-one (Equation (14)). This outcome was compared against a baseline scenario where the system (output vector) reached the steady-state through clamping all the initial values to zero. Exploring the dynamic change of concepts’ values between the baseline steady-state and outcome of the clamping procedure enabled quantitative interpretation of the impact of the key concepts on the system. The simulation process entailed the application of a sigmoid function with lambda = 1 as a threshold function on the adjacency matrix after it was multiplied with the input vector. The process was iterated until the system reached a steady-state. The FCMWizard, a web-based software tool, was used for the simulation purposes, as it has the unique ability to construct an FCM using data that come from experts or stakeholders’ knowledge and can perform simulations for different possible scenarios, in different scientific domains, using a very intuitive graphical user interface [
31]. The impact of the conducted scenarios on the selected decision concepts was examined, further identifying which key concepts affect the final deliverables of the program.
The scenario analysis performed simulations for the selected nine scenarios (
Table 9). For example, scenario 1 (S1) was devoted to increasing the concept C1—“Building strong CBOs by “clamping” it to one, whereas scenarios 2 (S2) and 3 (S3) studied the effects of the concepts C2—“Governance of CBOs” and C3—“Capacity building” by clamping the values of these concepts to one. The nine scenarios were conducted with the two aggregated collective FCMs, average-FCM and OWA-FCM. The expert-based FCM, which was constructed by the experts, was considered as the benchmark model that would help the researchers to further investigate the usefulness, importance, and superiority of the proposed OWA aggregation method against the average aggregation method. The results for scenario analysis for the two aggregated groups, for both average-FCM and OWA-FCM, as well as the expert-based FCM, were illustrated in the following figures. The scenario results for the expert-based FCM model, along with the corresponding scenario results for the OWA aggregated FCM, are illustrated in
Table A1 in
Appendix A.
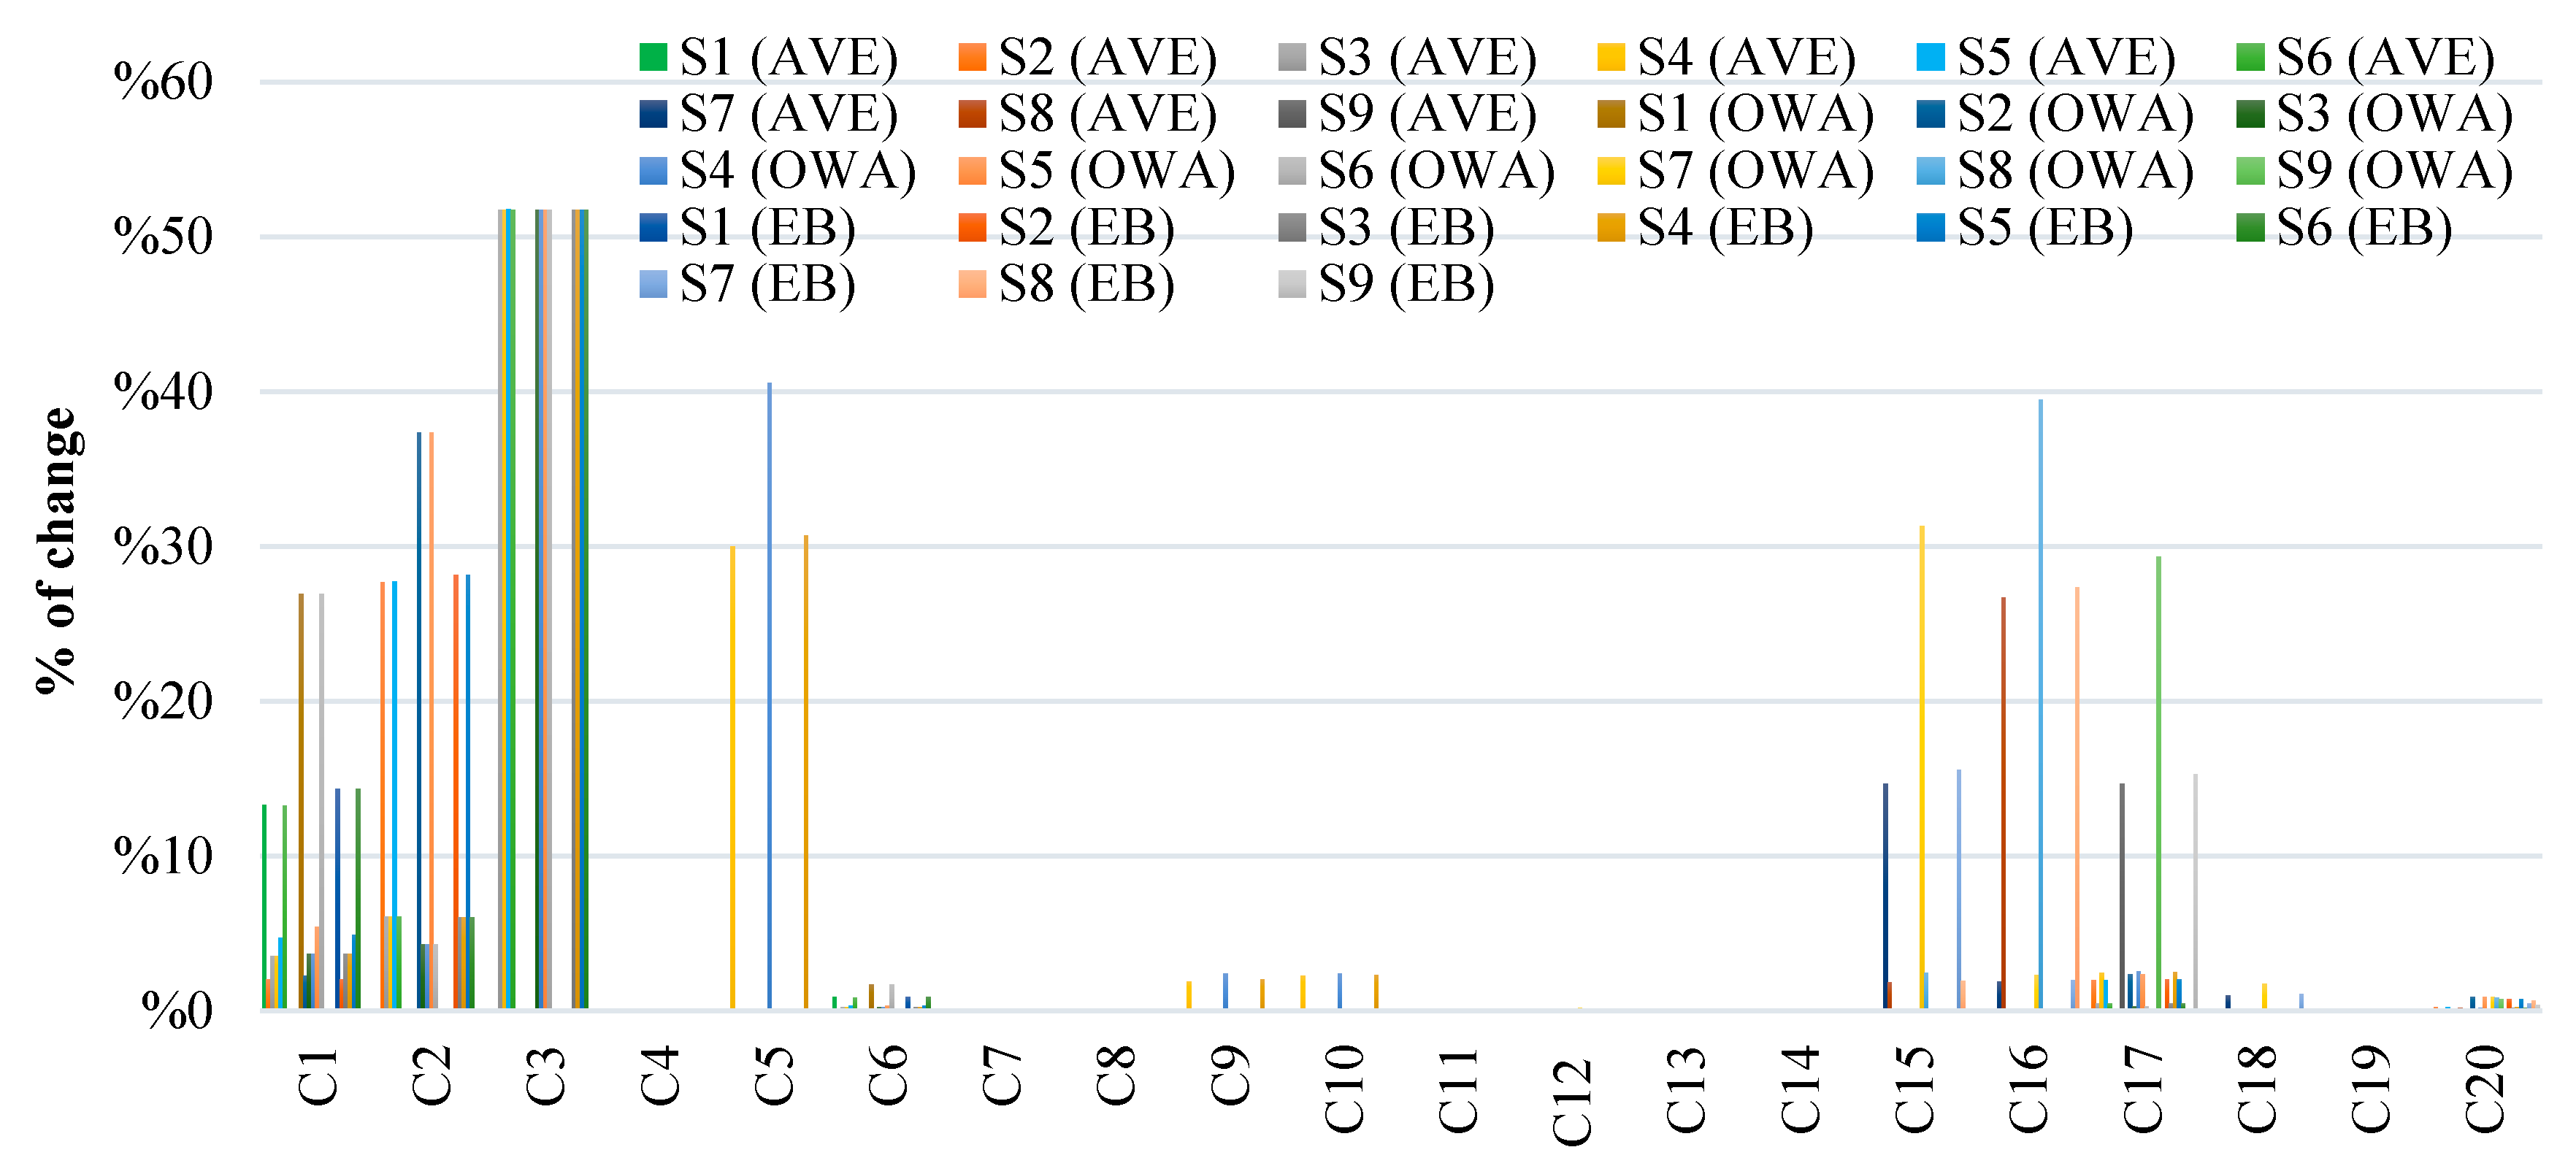
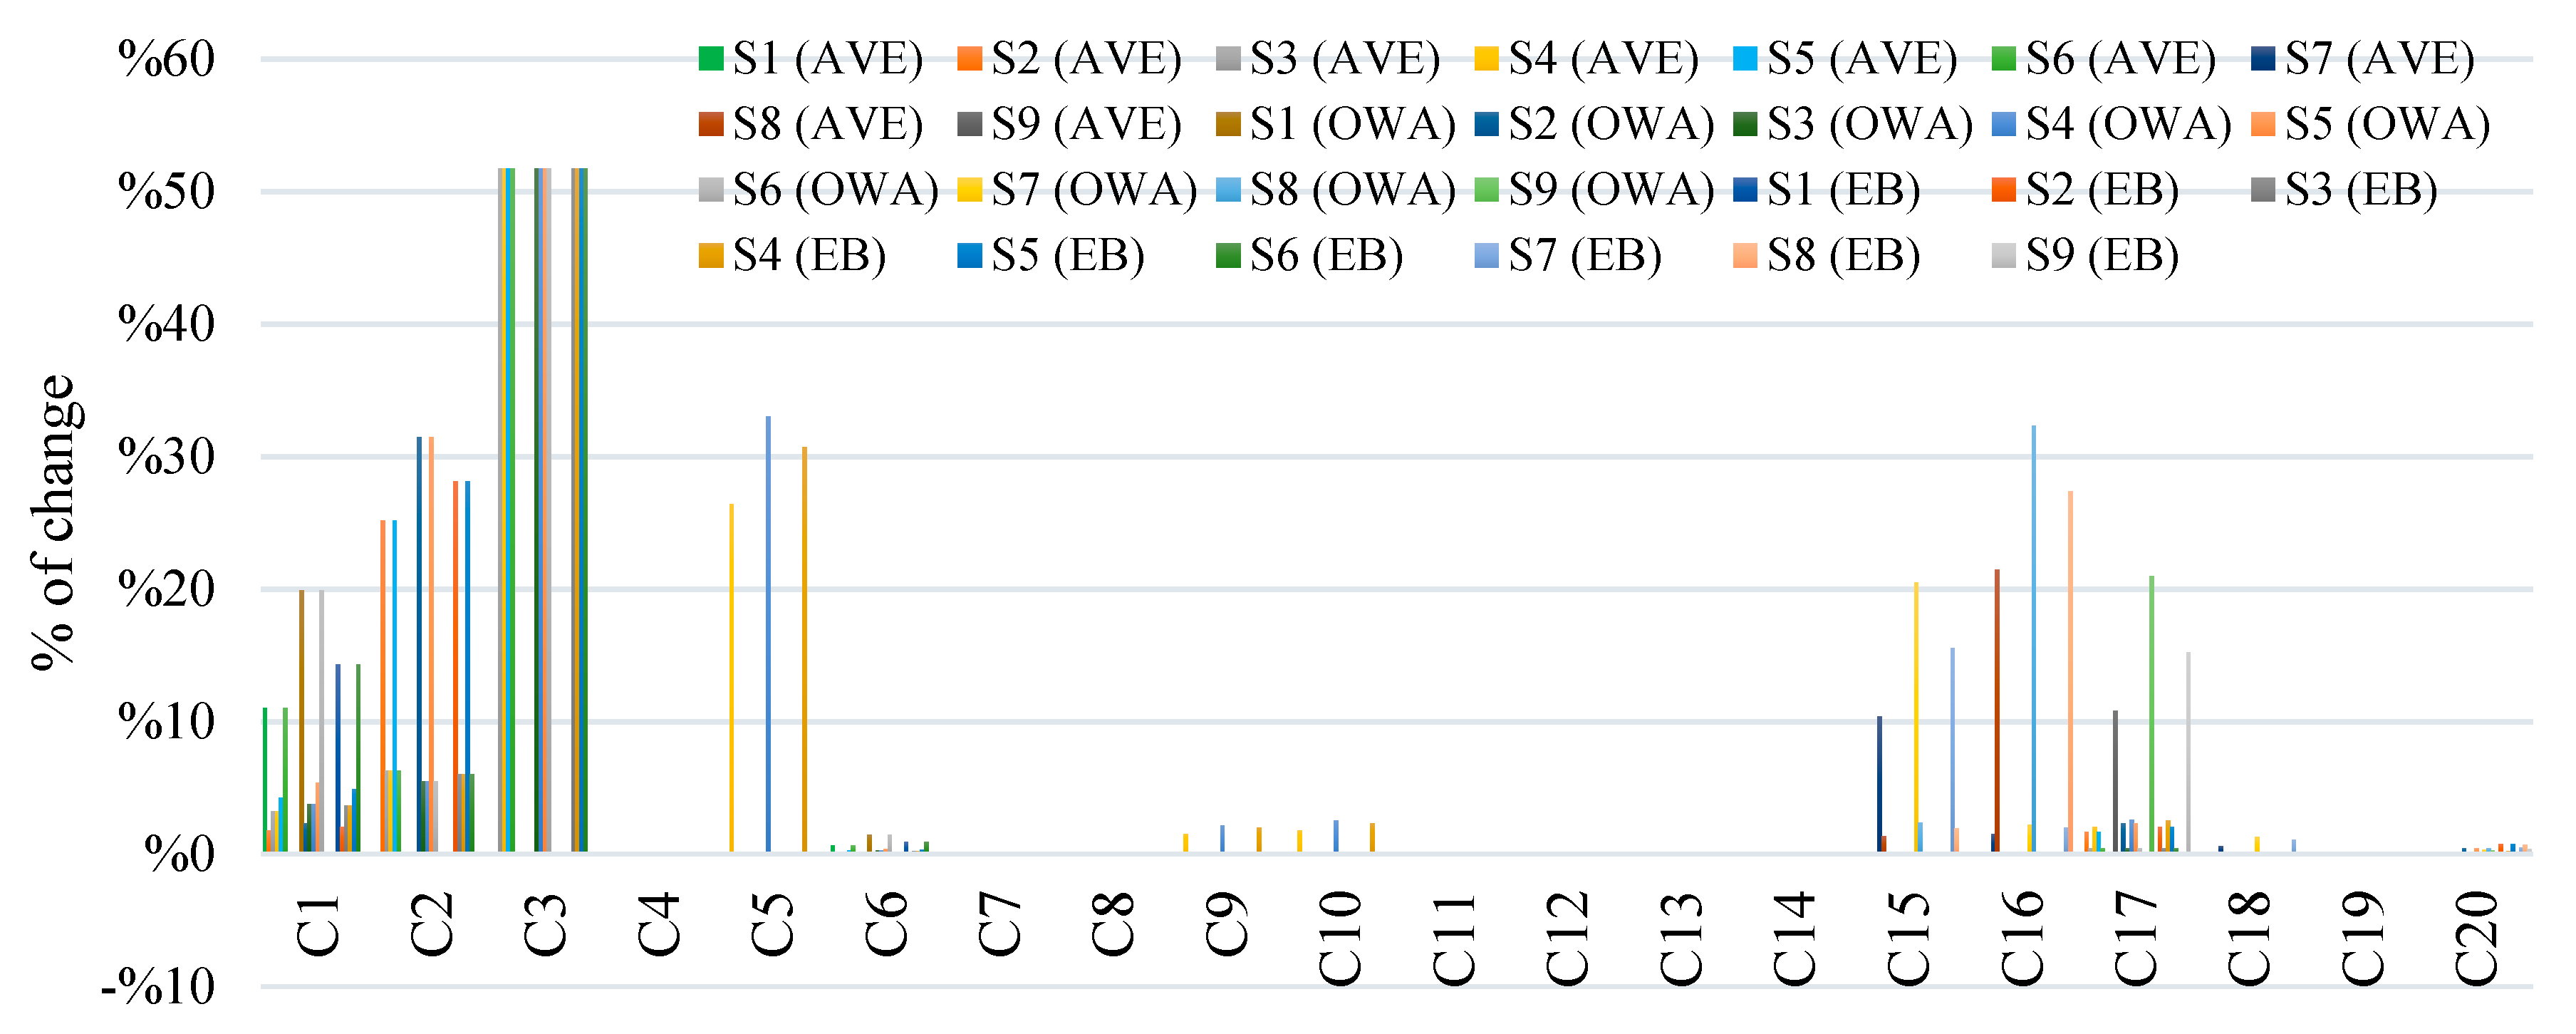
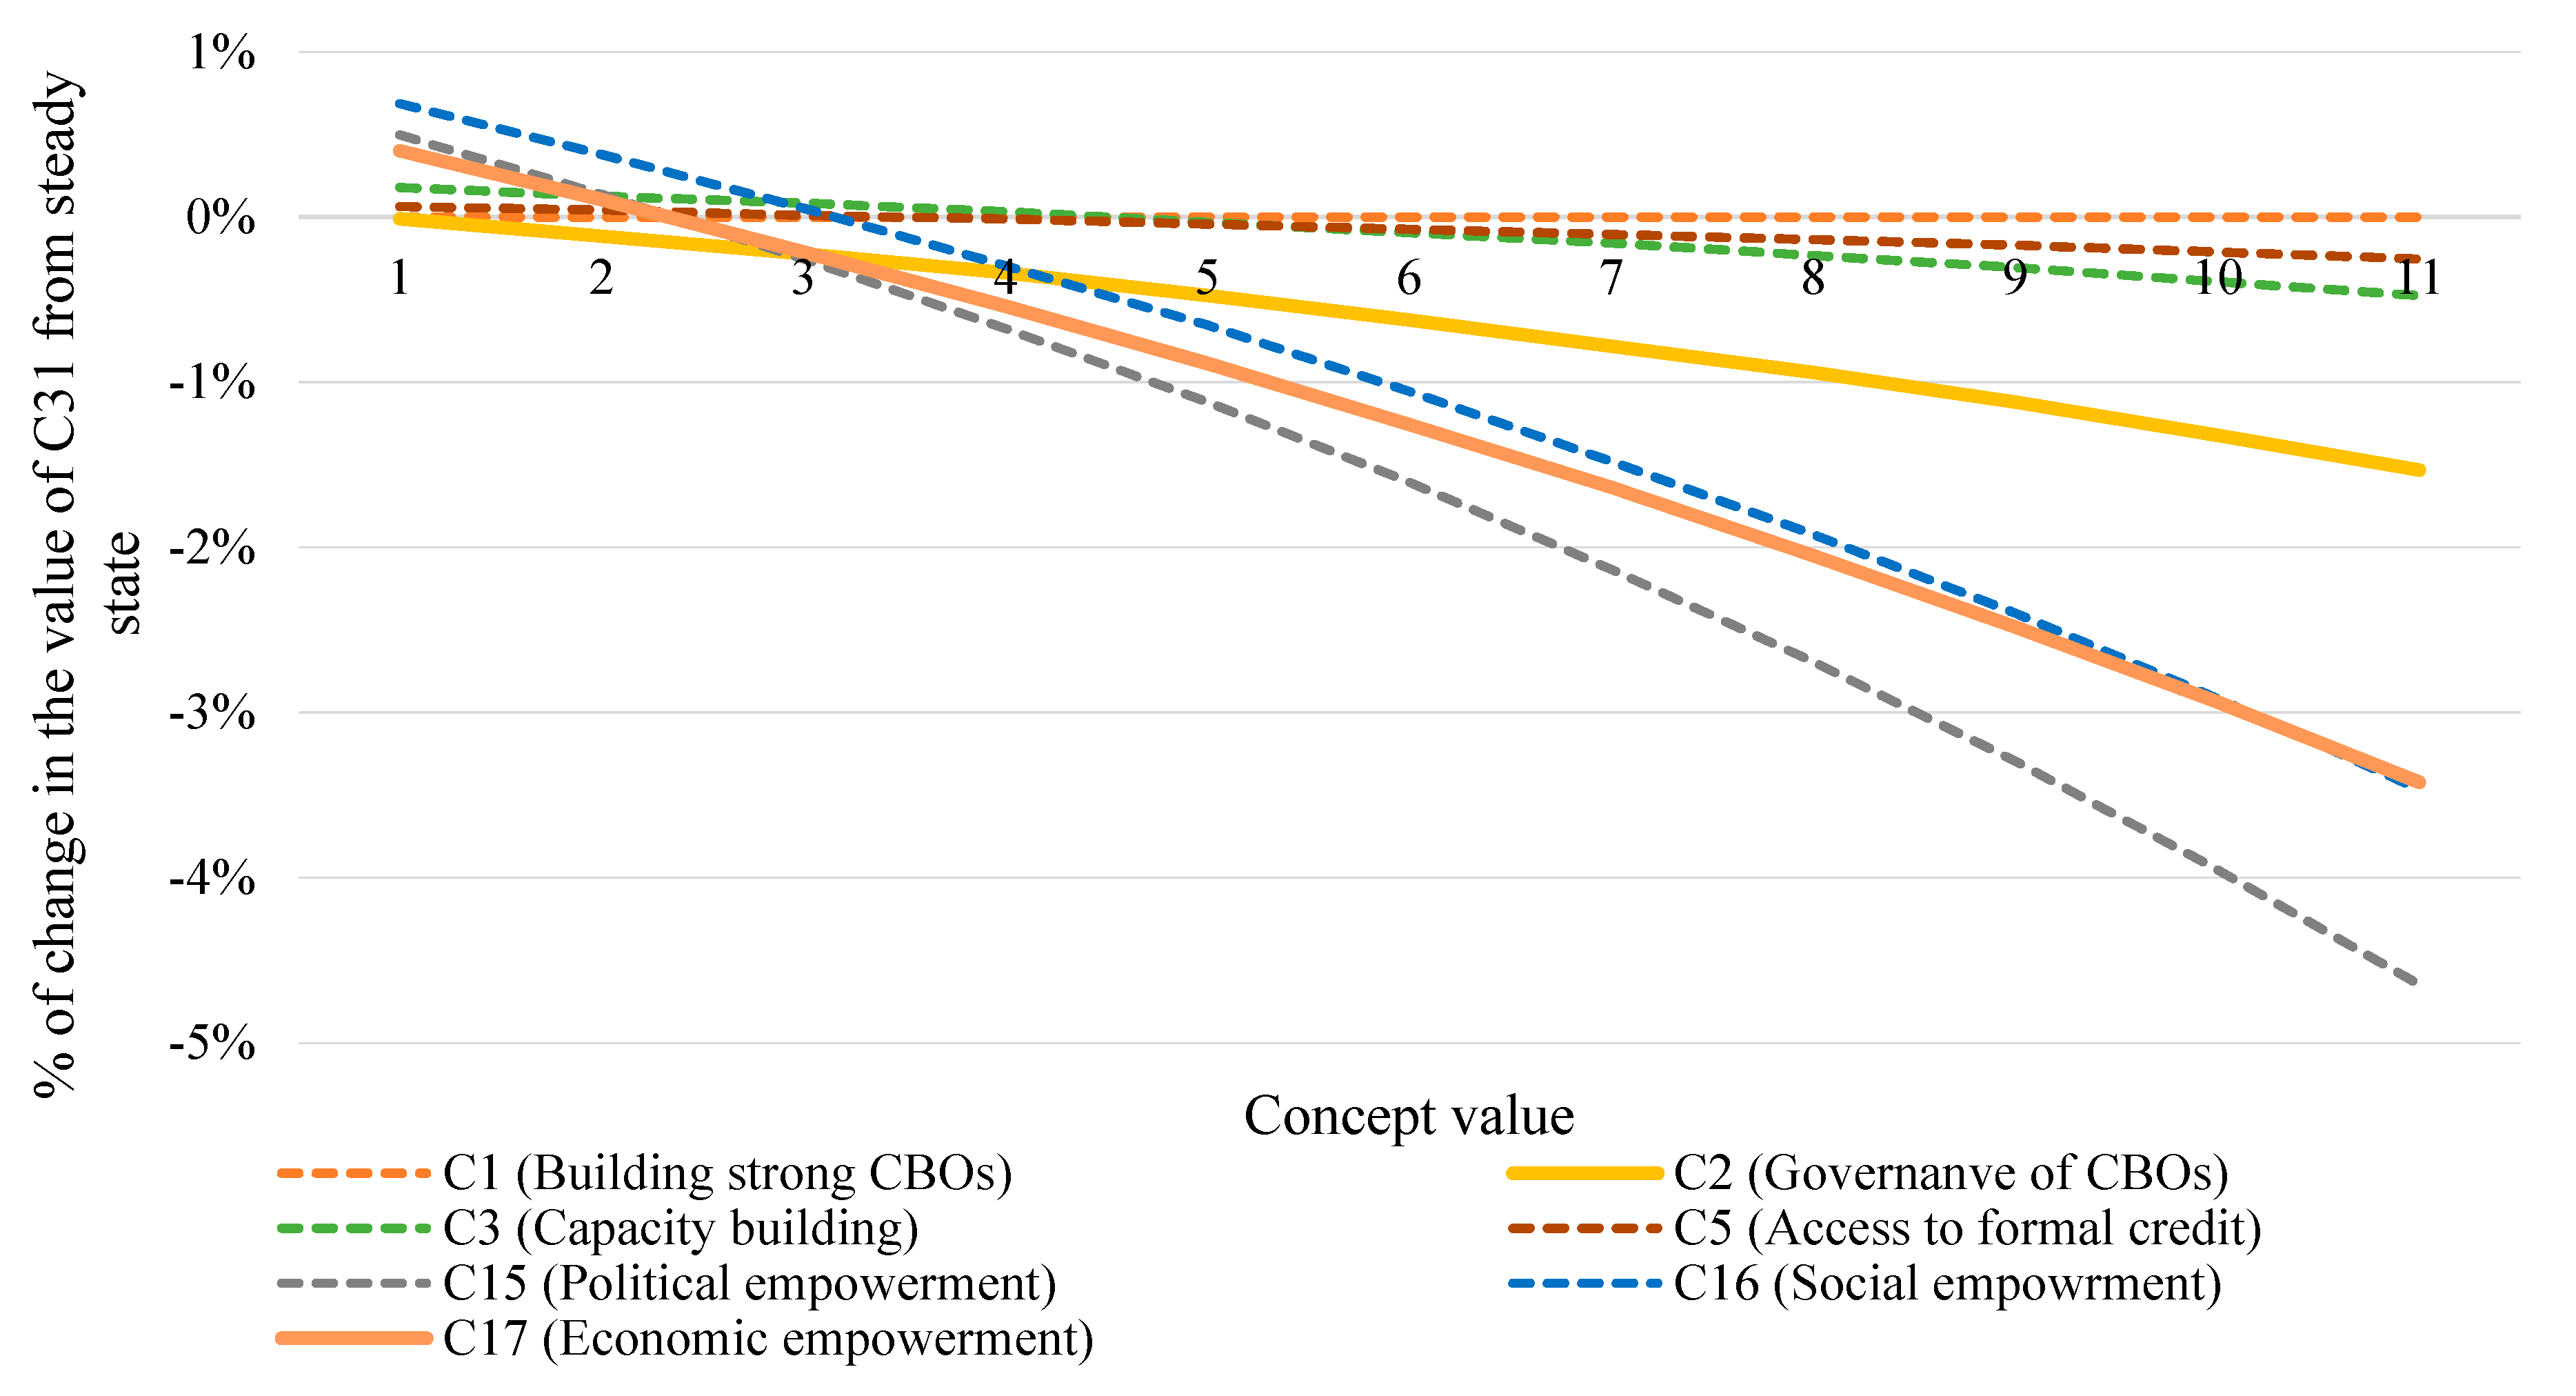
Figure 10 illustrates all three FCMs (average, OWA, and expert-based), the deviation from the steady-state for all concepts after the nine scenarios had been conducted. The following figures (
Figure 11 and
Figure 12) illustrate the outcomes regarding the percentage of change for certain key concepts, for all performed scenarios, with respect to FCMs.
Figure 13 depicts the corresponding results of the deviation from the steady-state when FCMs were used in the scenario analysis.
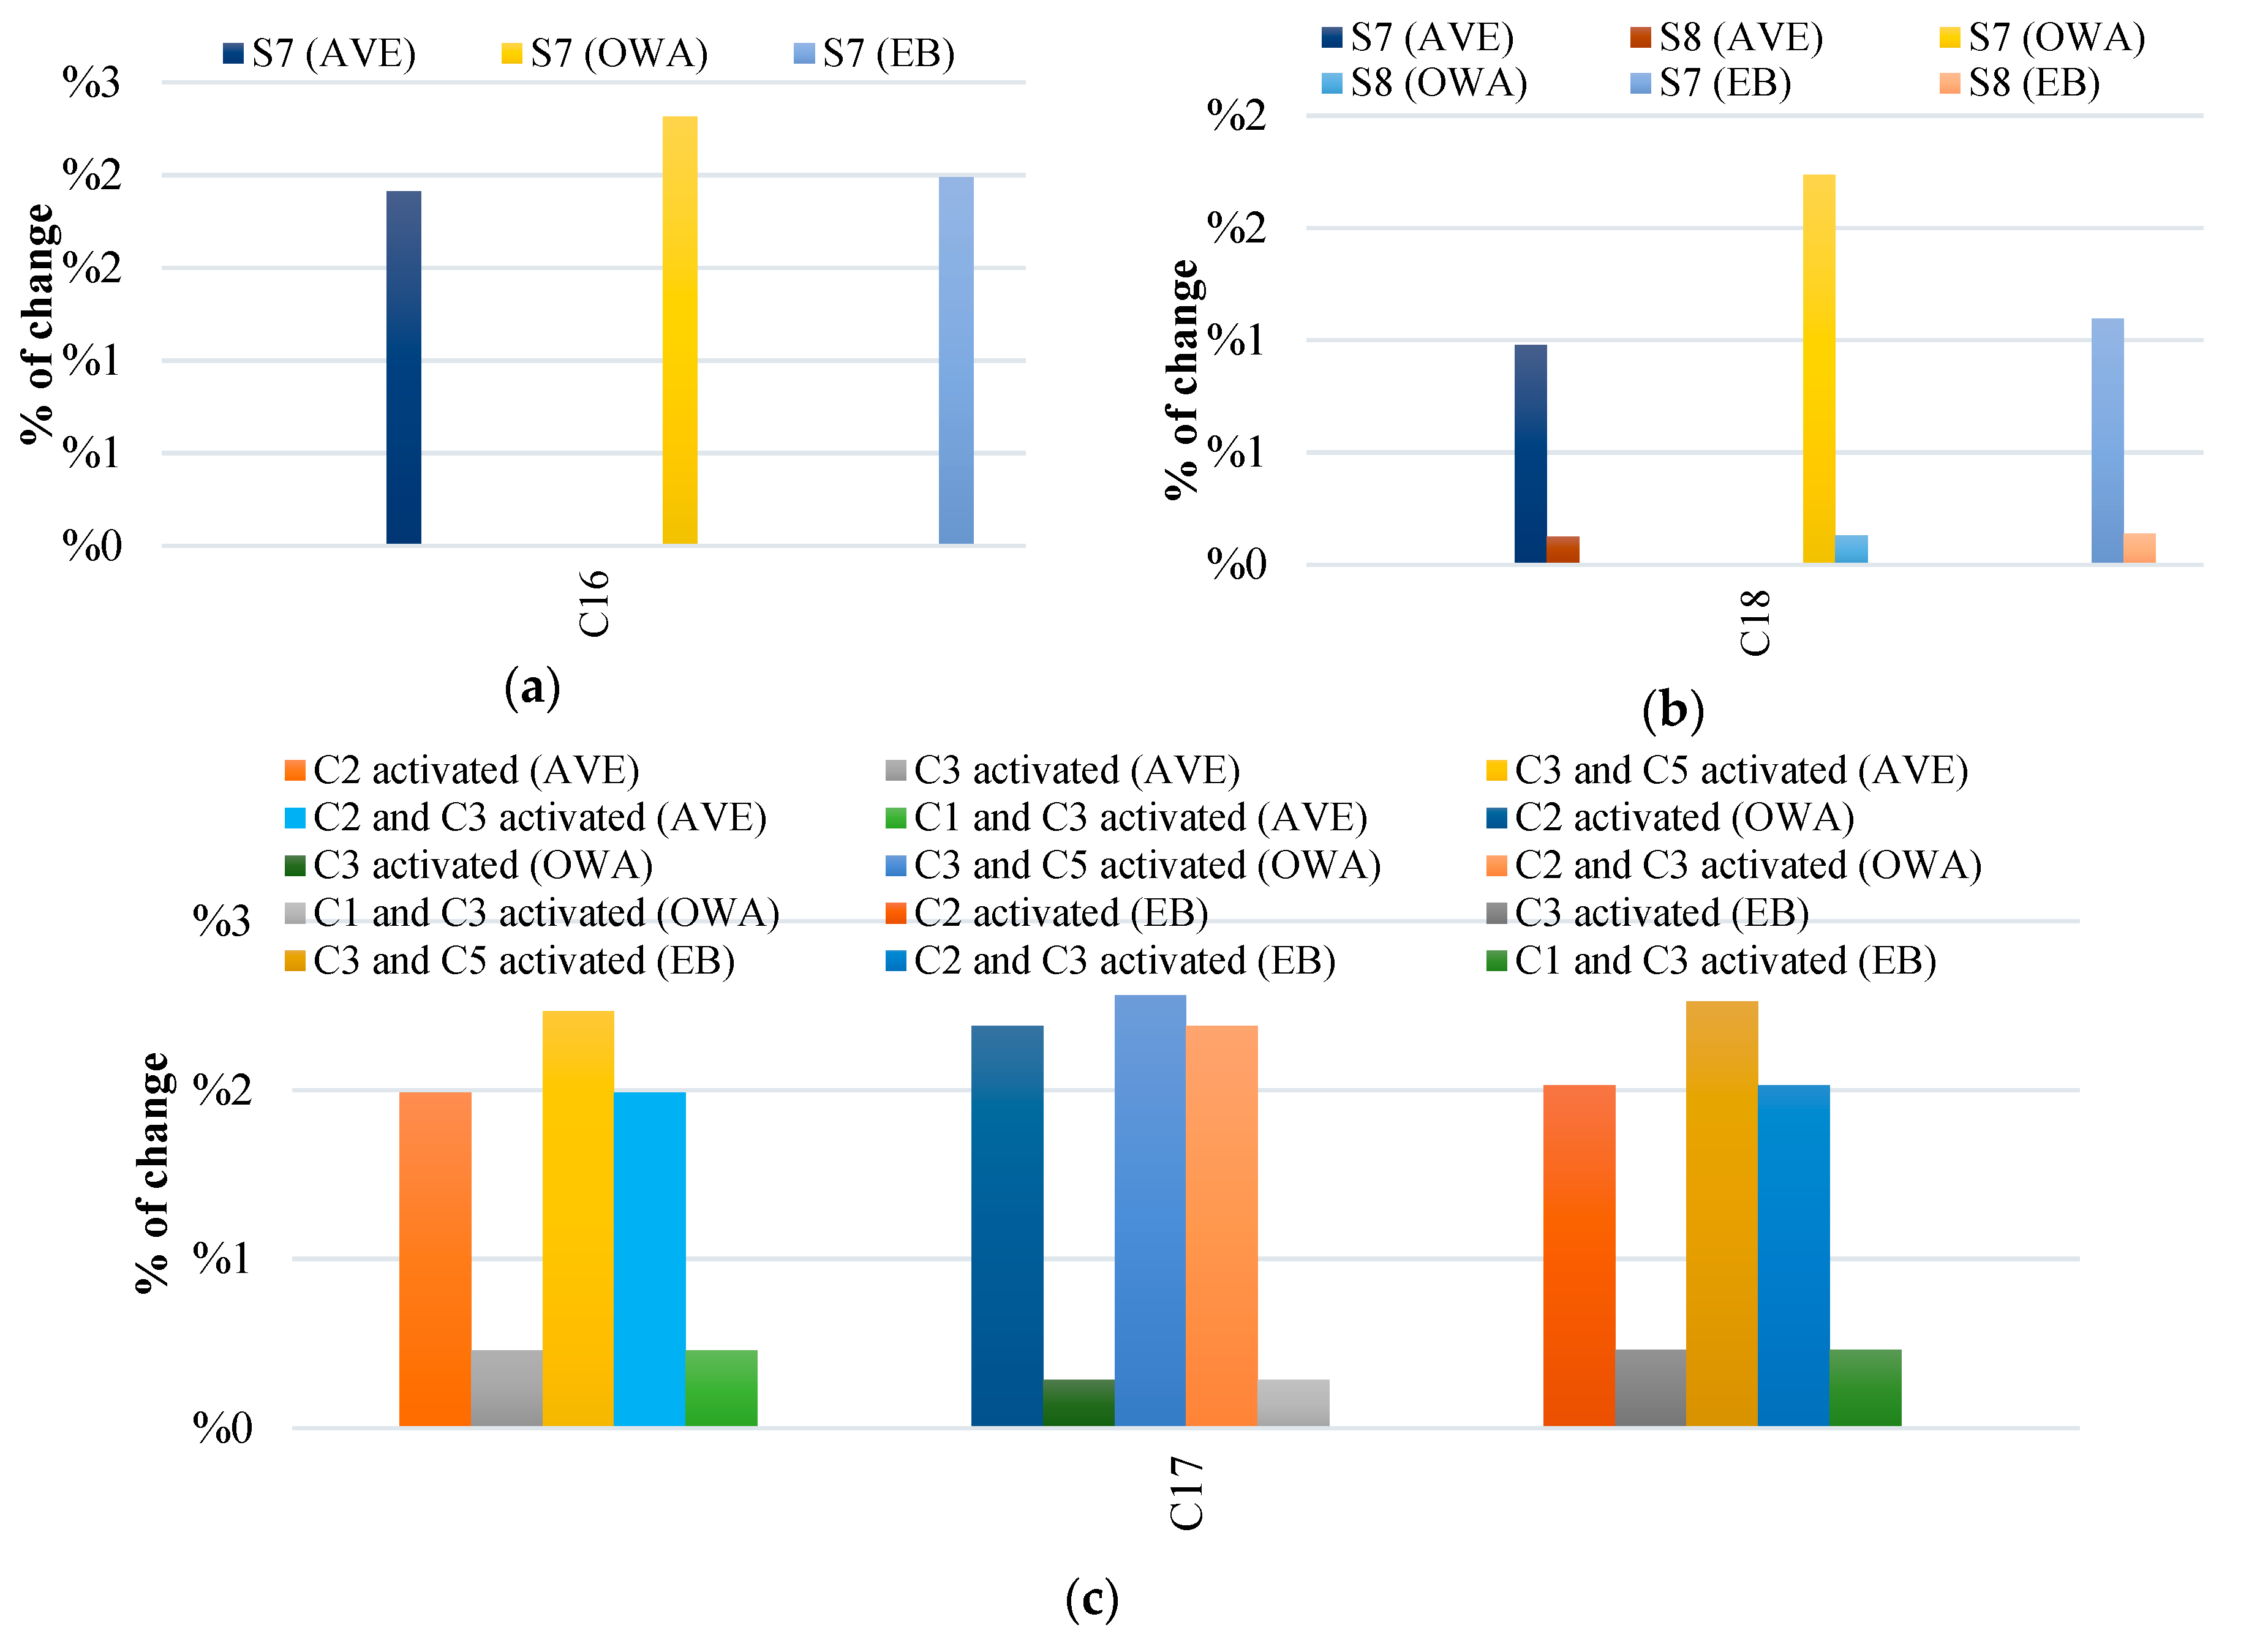
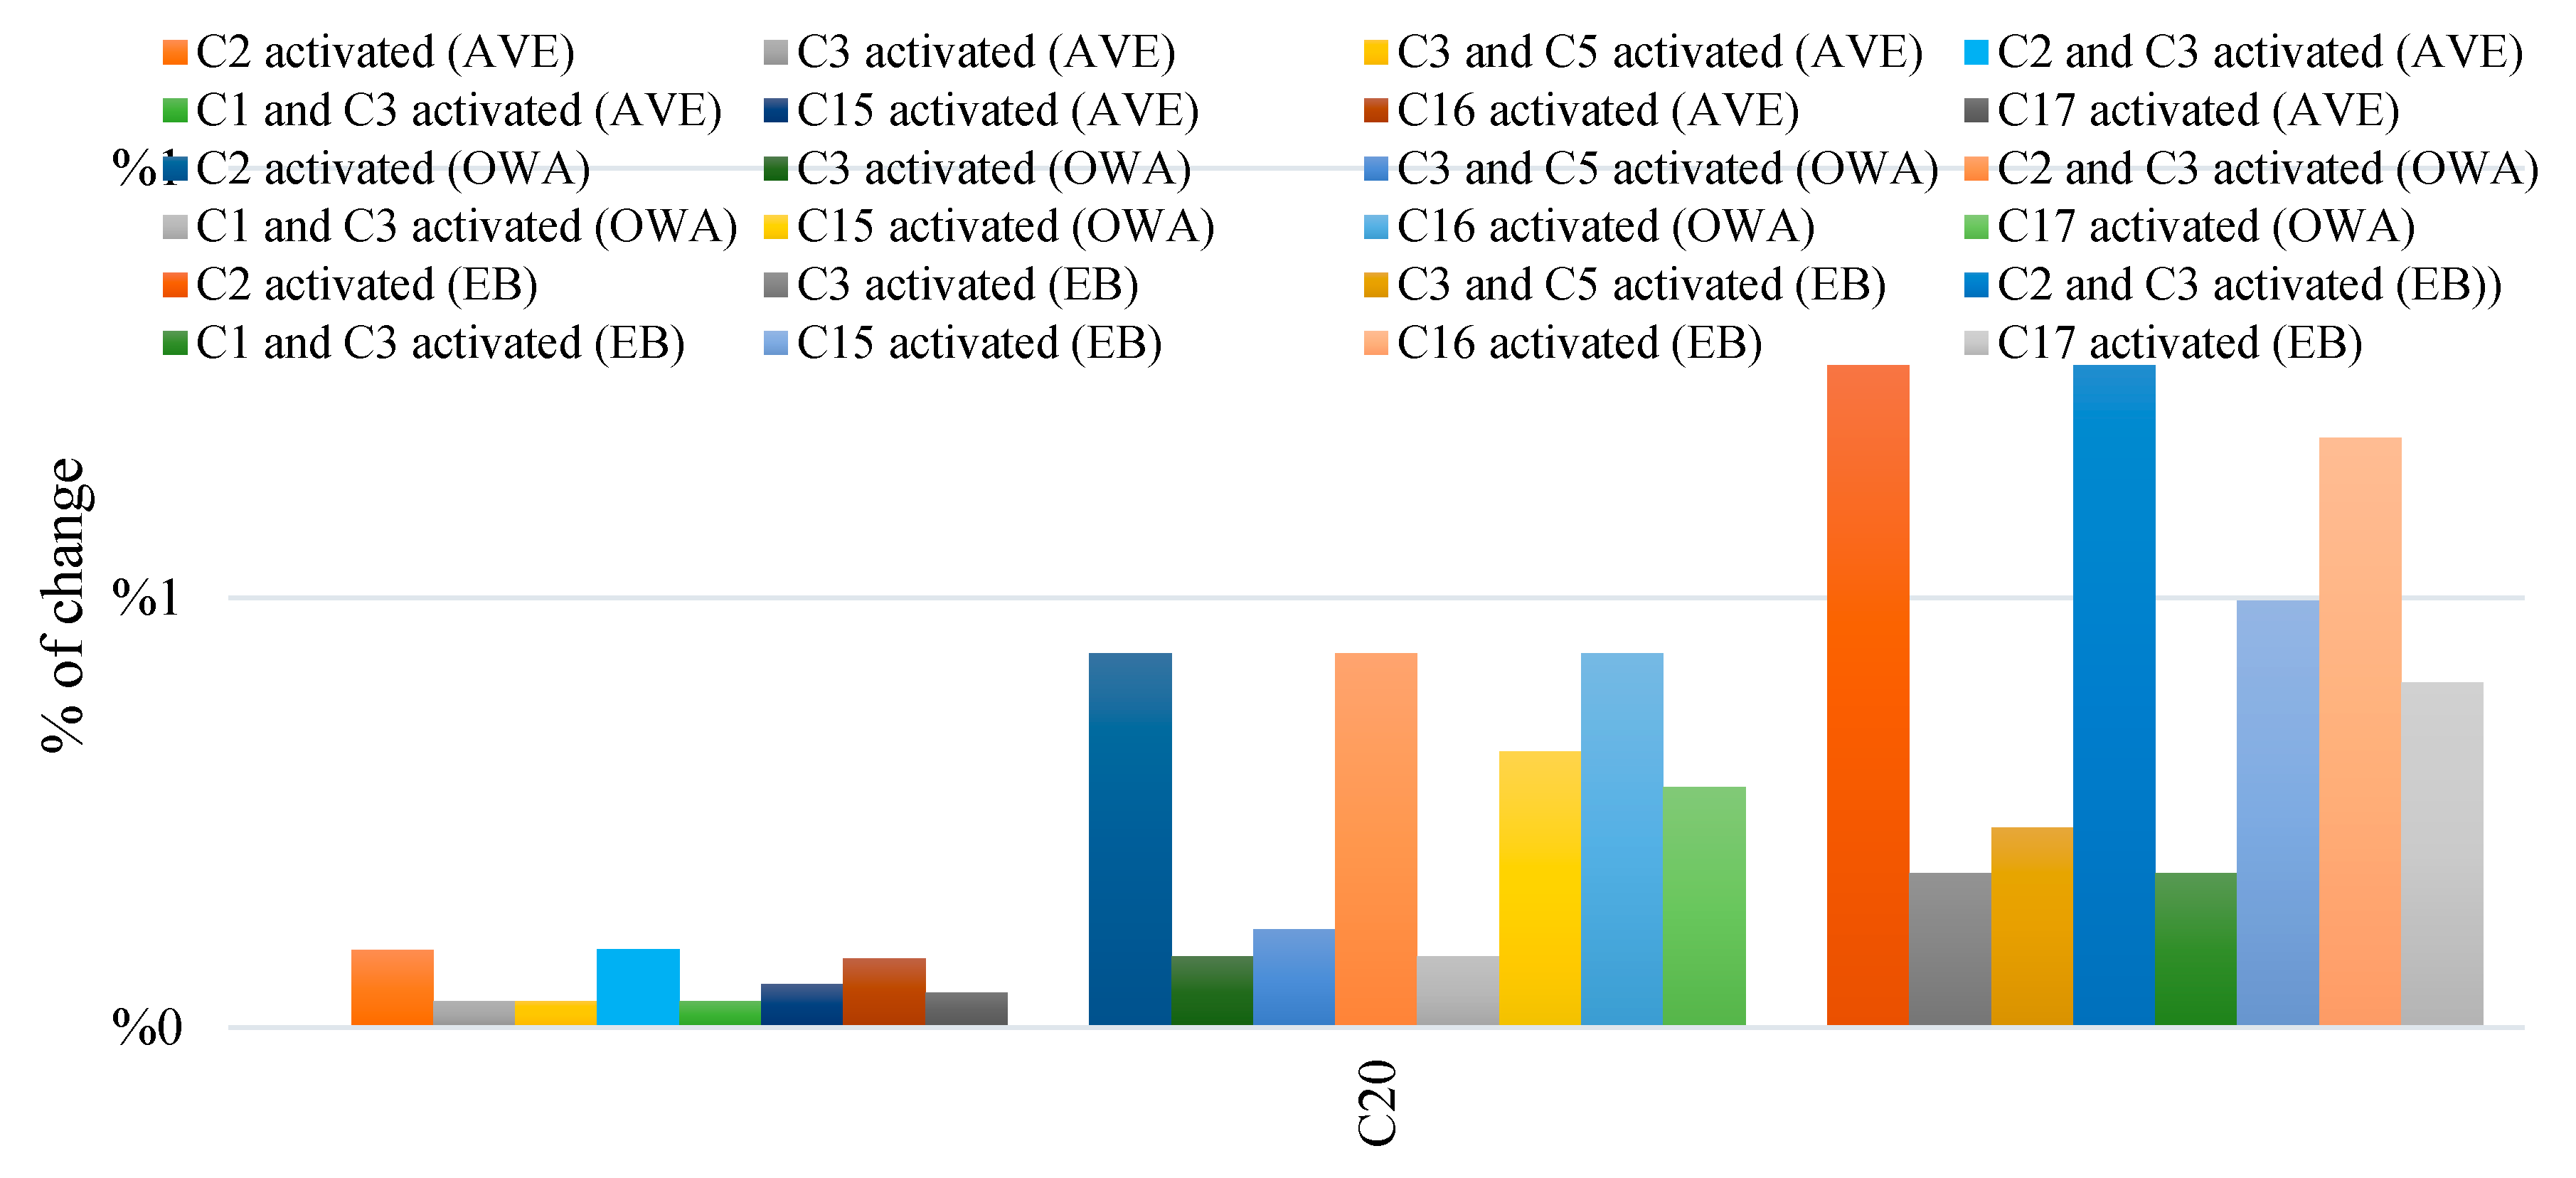
Figure 14 and
Figure 15 illustrate the outcomes regarding the percentage of change for decision concepts when the concepts for each scenario were clamped to one.
The following table (
Table 10) briefly presents the impact that the examined scenarios had on the four decision concepts of the system.
The observations that were drawn from the above figures and tables focus on the following two main points:
The impact that certain key concepts have on other concepts and how they could affect the examined system, and;
The performance of both the average and the OWA aggregation methods, comparing their outcomes with the expert-based FCM model. With respect to concepts’ potential in affecting the state of the system, the following considerable observations emerged:
The decision concept C16—“Social empowerment” was solely affected by C15—“Political empowerment” for all FCMs (average, OWA, and expert). Moreover, women’s personal well-being and personality development (decision concept C18) increased when more political and social empowerment (decision concepts C15 and C16) were offered to them.
Furthermore, it was observed that the key concept C2 (Governance of CBOs), as well as the combinations C2 (Governance of CBOs) and C3 (Capacity building), and C3 (Capacity building) and C5 (Access to formal credit), had the highest impact in the decision concept C17—“Economic empowerment” for all collective FCMs, showing a significant increase in C17, particularly when the OWA aggregation method was applied.
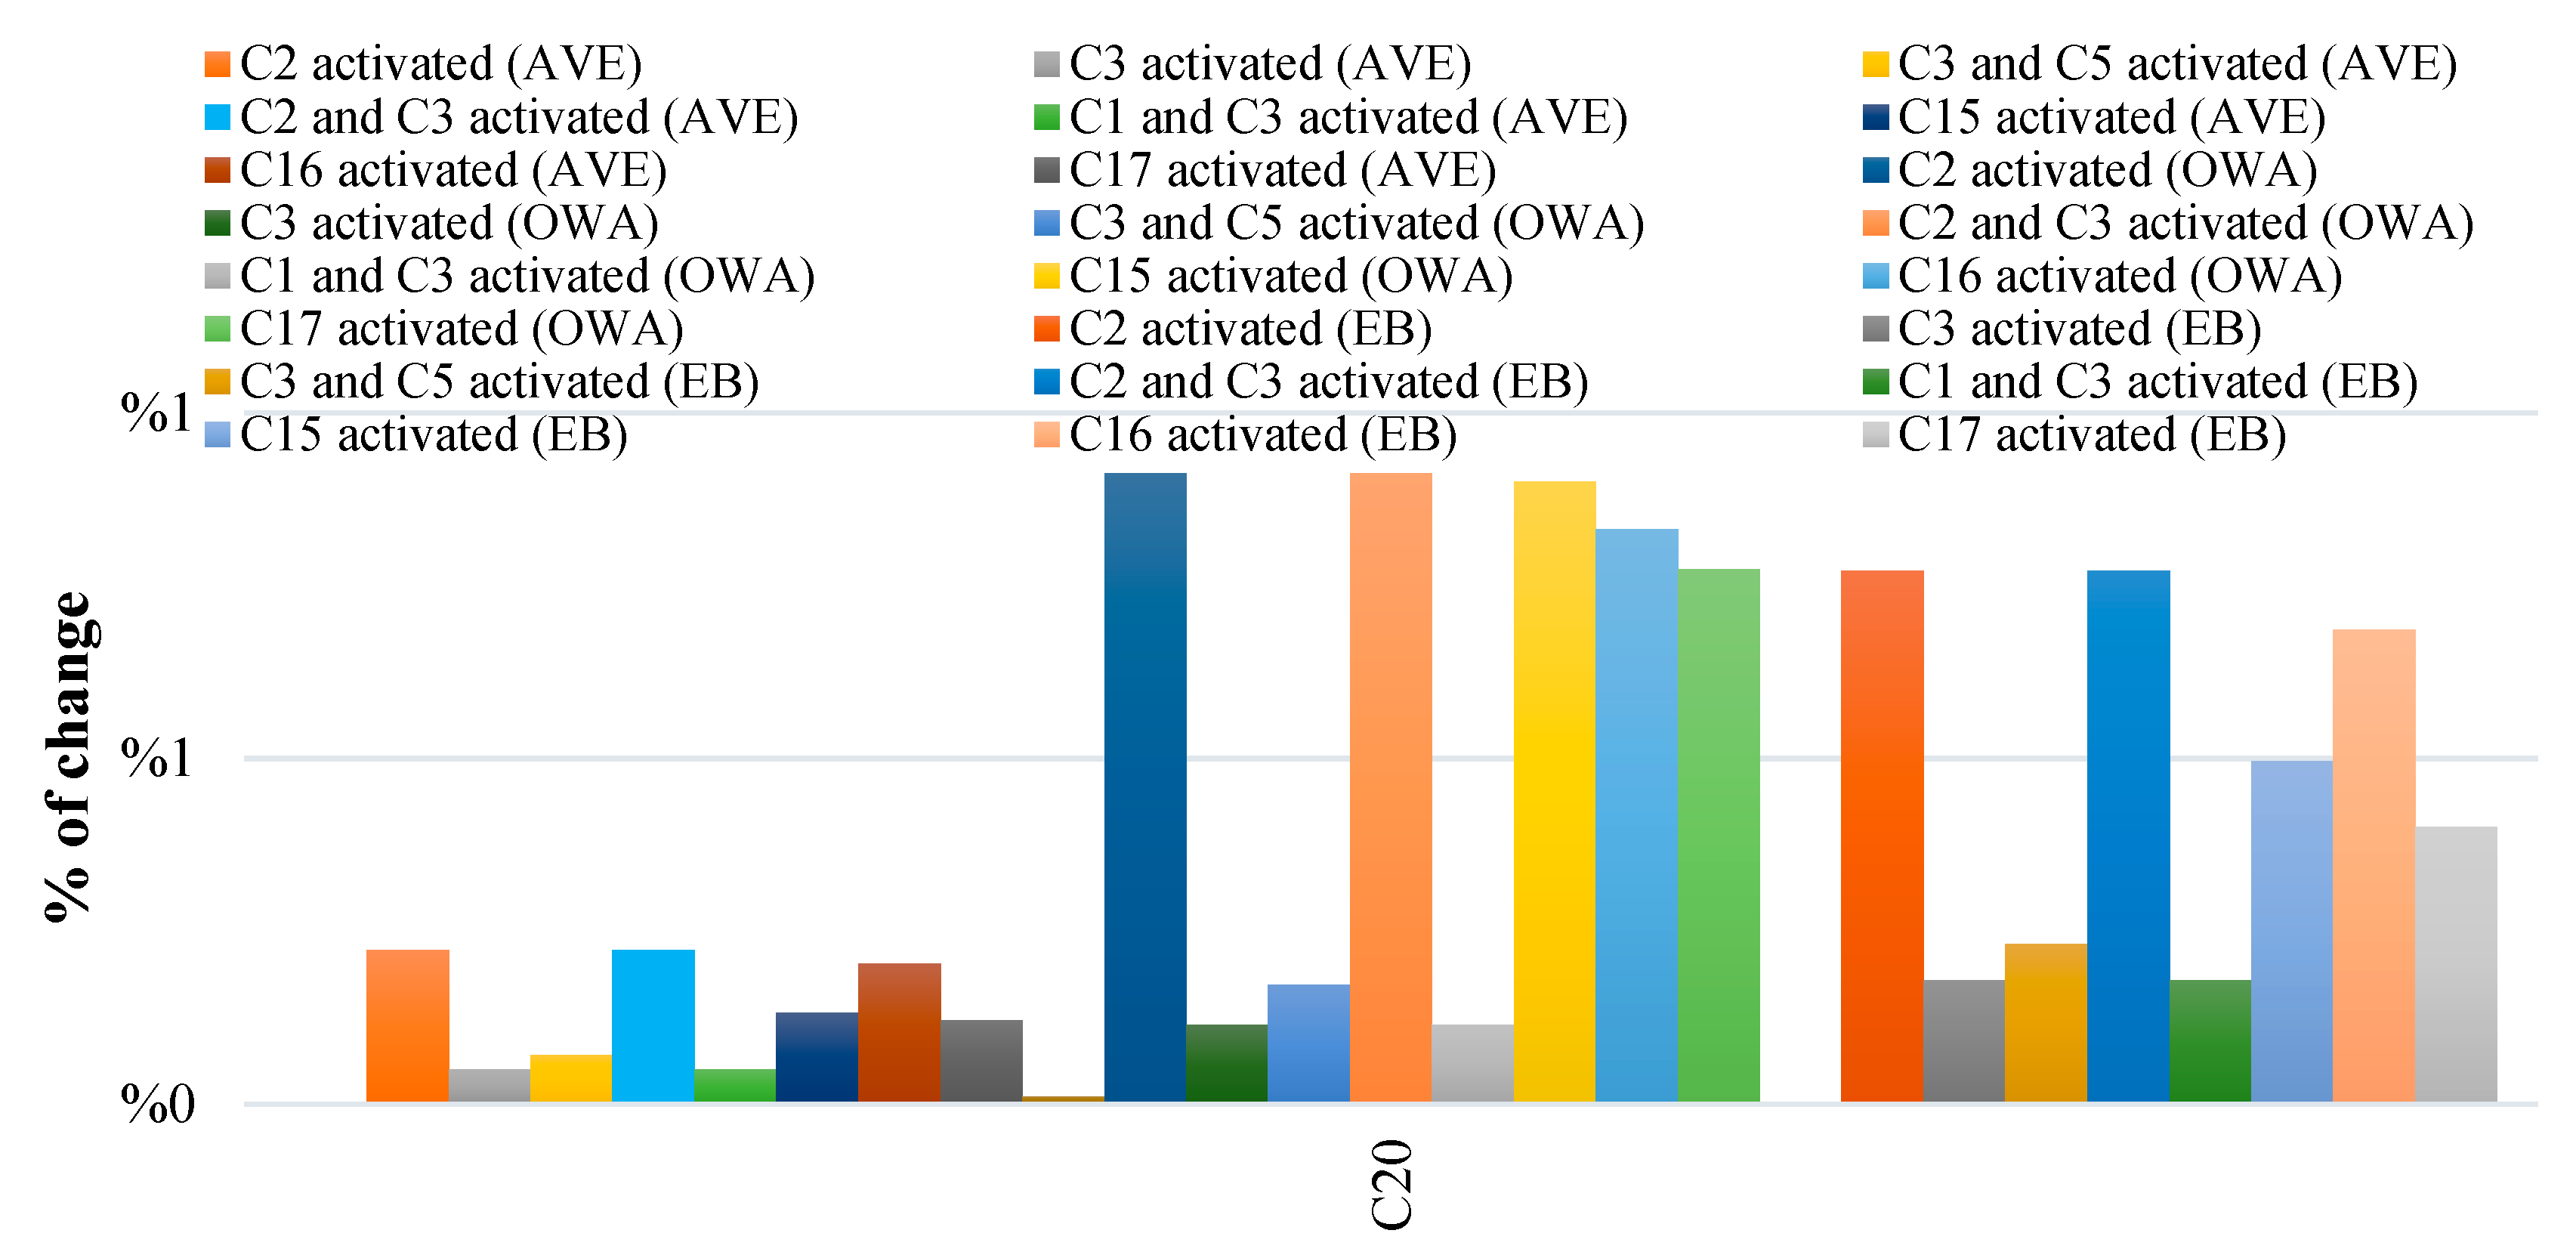
It also emerged from the above figures and
Table 10, that the increase of social harmony (C20) was directly connected to the increase of the following key concepts: C2—“Governance of CBOs”, the combination of C2—“Governance of CBOs” and C3—“Capacity building”, as well as the concepts C15—“ Political empowerment”, C16—“Social empowerment” and C17—“Economic empowerment”. Results of FCM-based simulations revealed that impacts of the DAY-NRLM programme could be realised better if strong institutions are built.
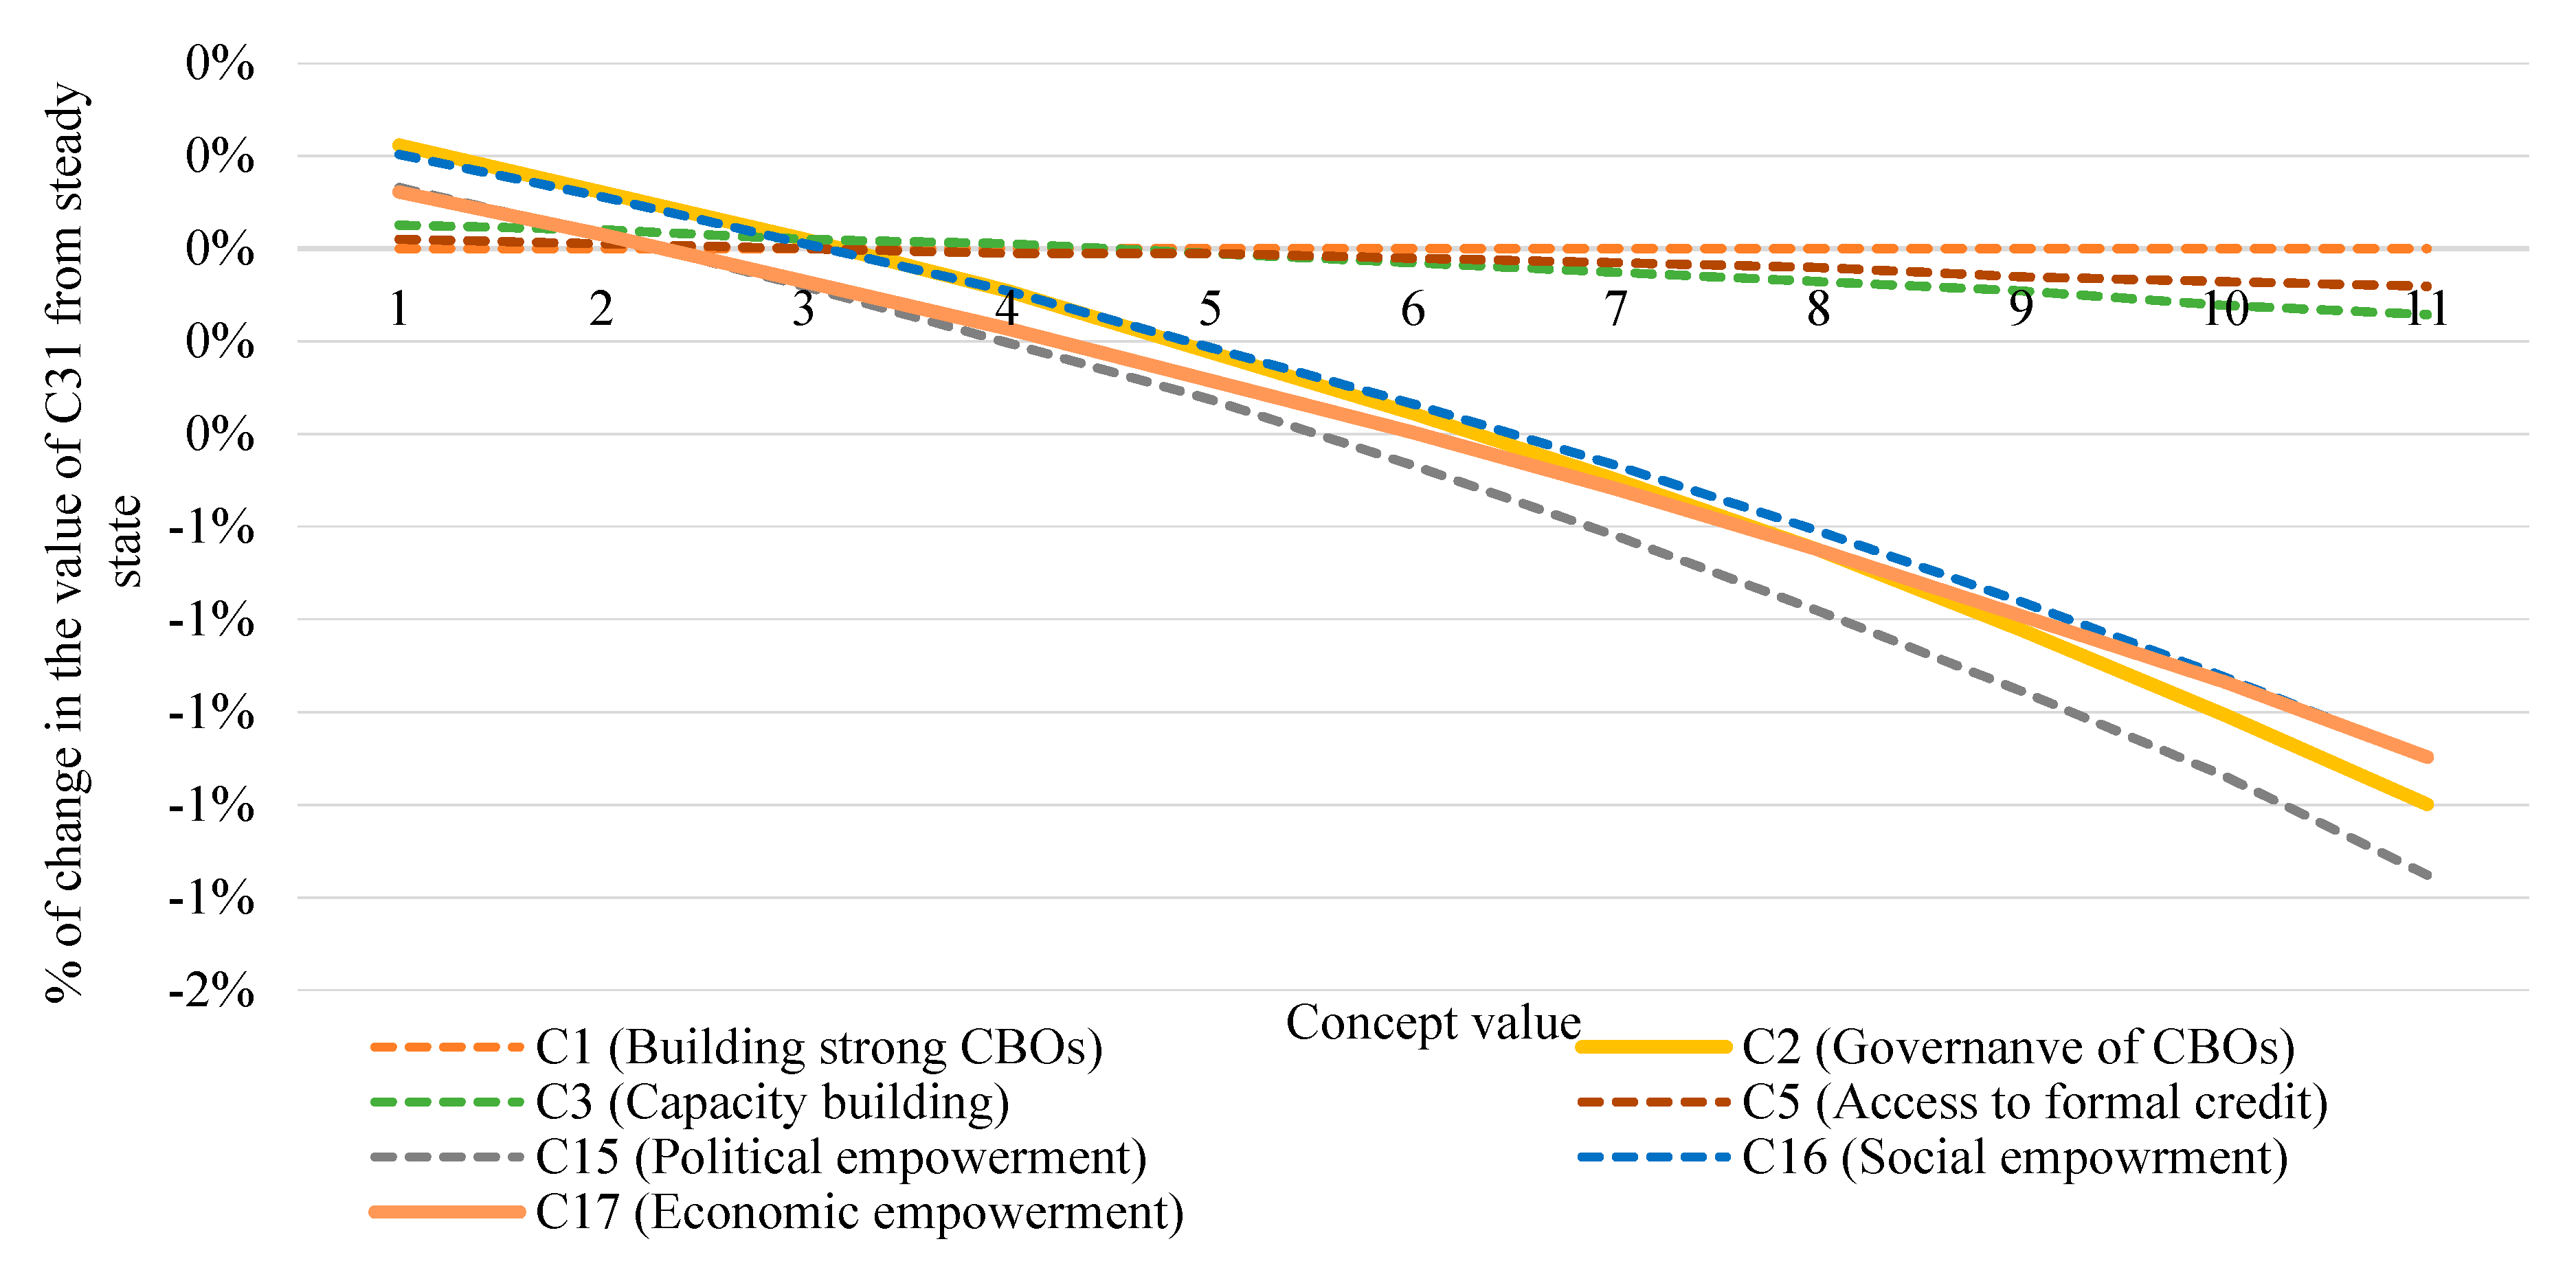
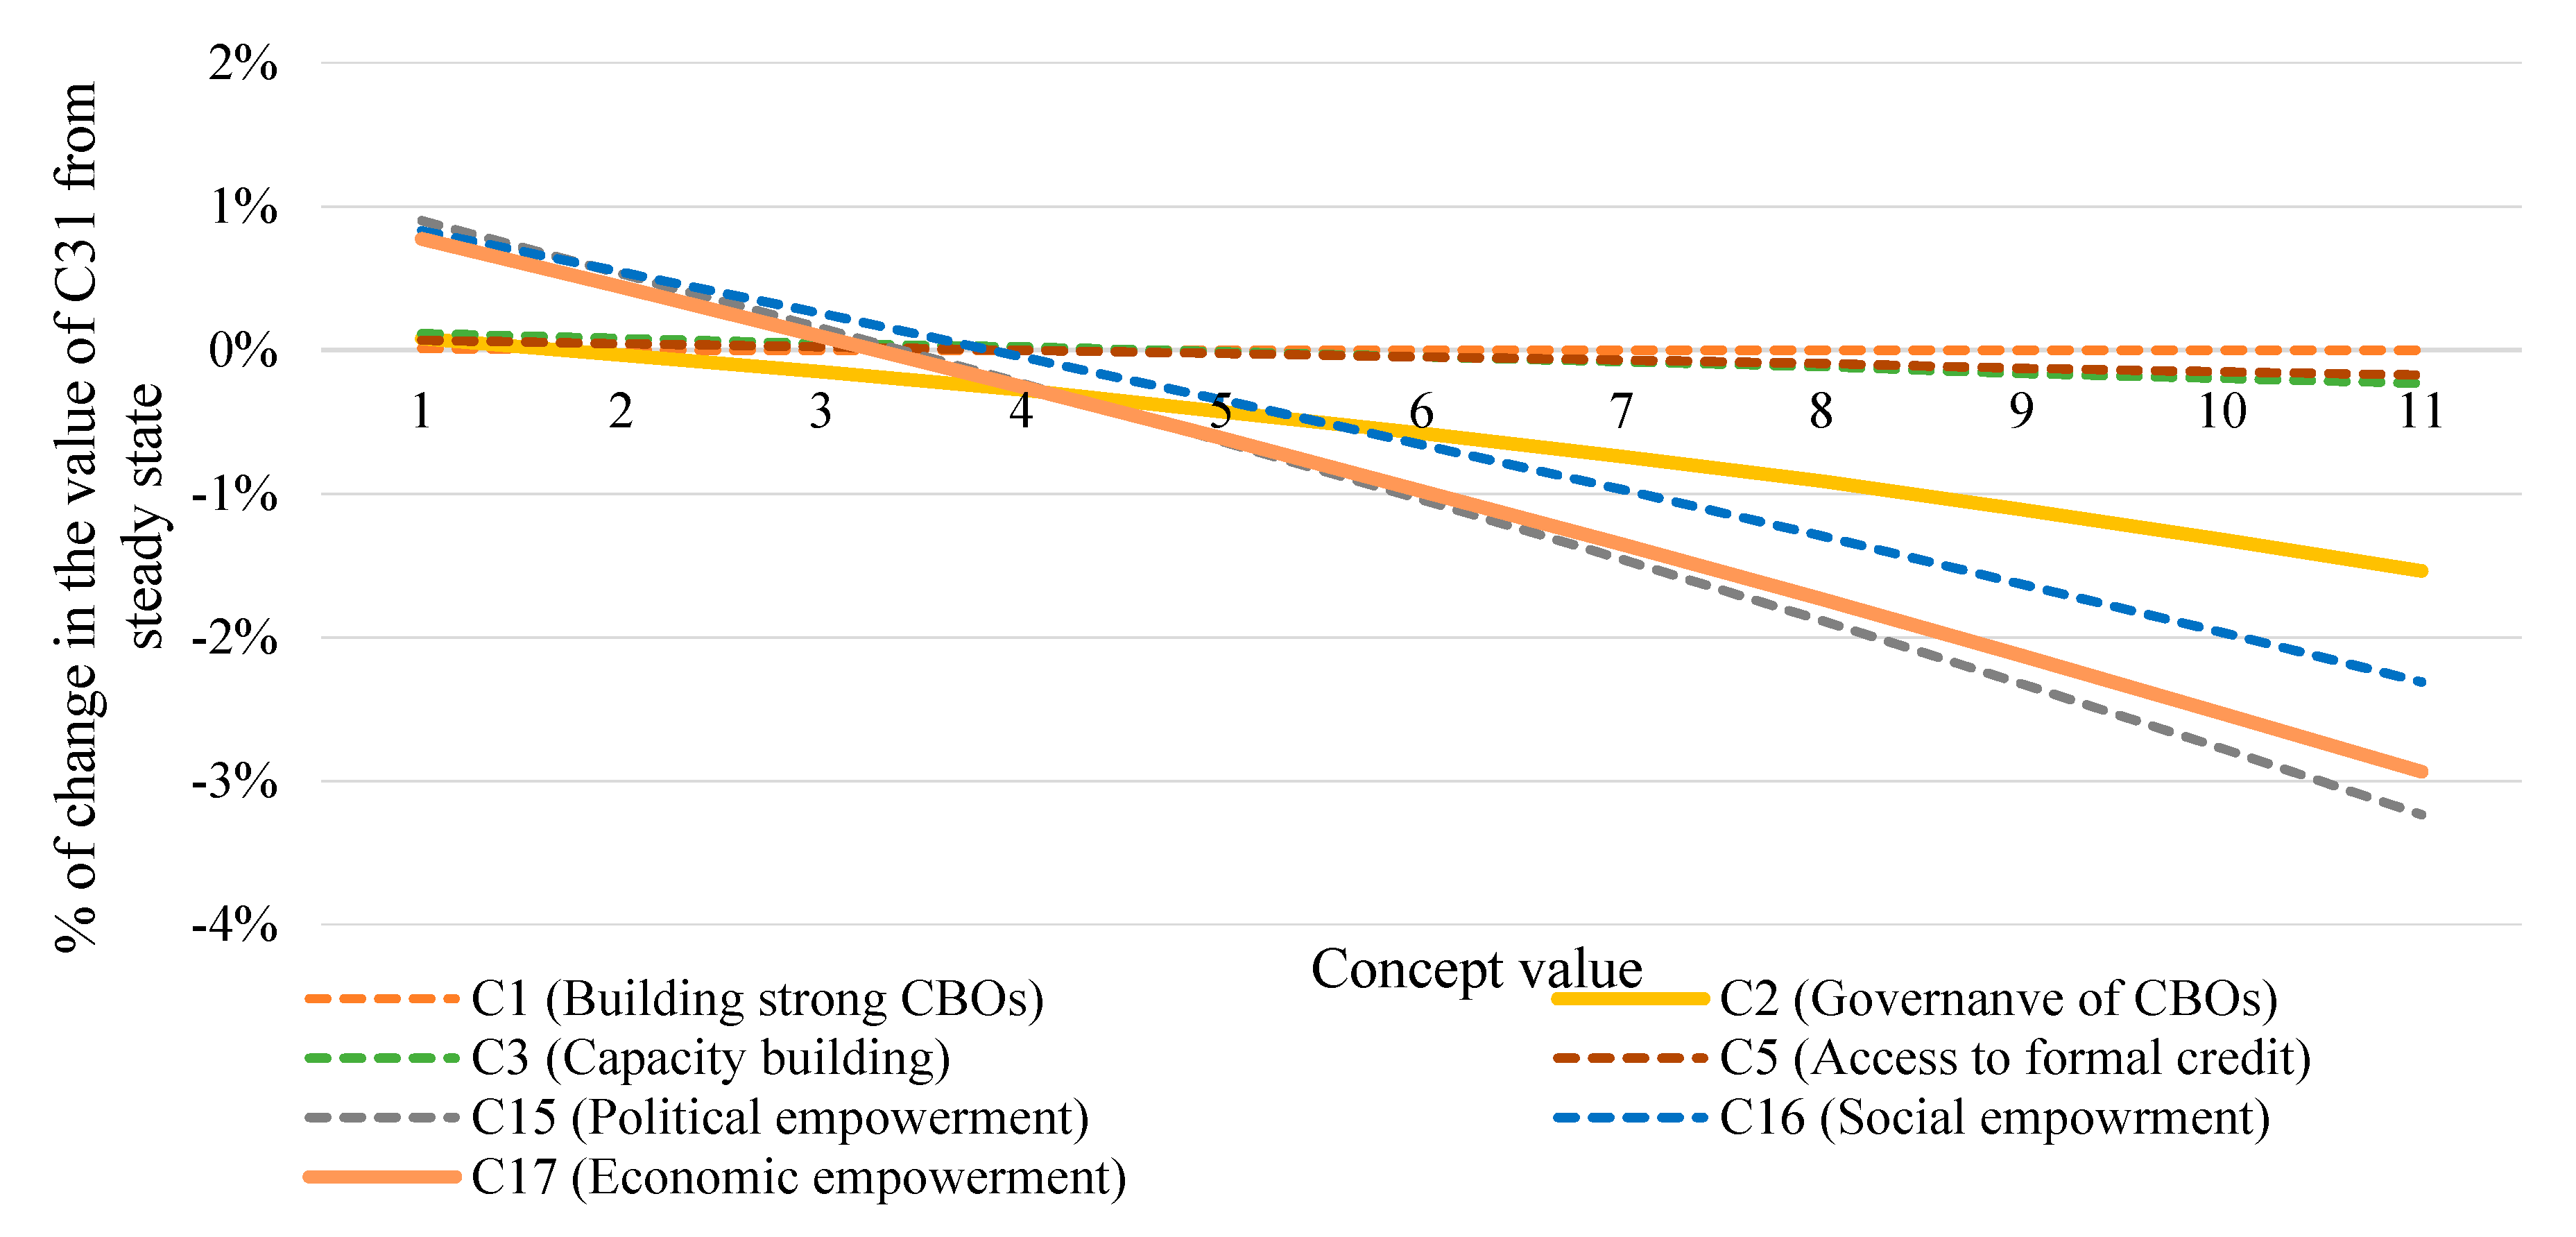
Overall, the concepts C2, C3, C5, C15, C16, and C17 had a significant impact in the policy-making and strategic planning of socio-economic sustainability of poor rural communities because they presented considerably higher deviations from the steady-state than the rest of the concepts (see
Figure 10 and
Figure 13). To further check the validity of the outcomes, a sensitivity analysis regarding the impact that these key concepts had on decision concept C20, for all three FCMs (average, OWA, and expert-based), was conducted, and the corresponding results are presented in
Appendix B (
Figure A1,
Figure A2 and
Figure A3). There seemed to be an influence from the absence of political, social, and economic empowerment, as well as from the lack of governance of CBOs, which corresponded to the concepts C2, C15, C16, and C17, affecting the community’s social harmony (C20).
Concerning the performance of the two examined aggregation methods, the following important observations were extracted in particular after a careful analysis of the tables and figures above.
The OWA aggregation method seemed to be superior to the average aggregation method, in terms of participatory modelling, when a large number of participants were involved. After a thorough view of
Figure 12,
Figure 13,
Figure 14,
Figure 15, where the scenario analysis of the three different FCMs was conducted, it can be concluded that in most cases, the deviations were higher when the OWA aggregation method was applied, compared with those resulting from the average aggregation method.
As mentioned before, we considered the expert-based FCM model as the benchmark model, as experts’ opinions produced it. When the OWA-FCM model was compared to the expert-based FCM model, we noticed that the results on decision making were better or similar to those regarding the experts’ FCM model. Thus, it can be concluded that the OWA-FCM model resembles the structure of the expert-based FCM model.
Overall, for analysis and decision-making, the OWA aggregation method was proven to be proper for policy-making and strategic decision planning, considering a large number of maps, outperforming the average aggregation method.
Some limitations of the proposed methodology that need to be considered are (i) the lack of imprecision of human perception in fuzzy form in FCM representation, as this approach cannot deal with aggregating fuzzy values of multiple FCMs into a collective FCM, and (ii) the weakness in coping with complex FCMs where a large number of concepts and weights are assigned by many participants. In this case, it is difficult to accurately define the learning parameters in OWA and handle the aggregated weighted connections.
3.5. Discussion on Scenario Results
The scenarios 1 to 6 examine how certain key concepts of the DAY-NRLM programme such as strong CBOs, good governance within CBOs, better capacity building of communities and CBOs, as well as access to formal credit, would help to achieve the final objectives of the programme, that is, alleviation of socio-economic poverty and better quality of life. In particular, increased access to formal credit and good governance would empower the SHG women economically, politically, and socially, as well as increase social harmony in the community. Consequently, income and savings would increase, and that would lead to an increase in consumption expenditure, livelihood diversification, and enterprise development. Higher-income will lead to better access to education for women and their children, consequently developing their personality, personal well-being, and overall socio-economic status.
Scenarios 7 to 9 highlight the effects of political (C15), social (C16), and economic (C17) empowerment of women, respectively. These empowerments represent political inclusion, political justice, participation in various village-level committees, savings, financial self-sufficiency, universal social mobilization, and social inclusion, among others. These scenarios also show an increase in income and savings, which would further lead to a rise in consumption expenditure, livelihood diversification, and enterprise development. Increased income will lead to better access to education for SHG women and their children; it would consequently develop the personality and personal well-being of SHG women. Better education will improve their intra-household bargaining power and health, hygiene, and sanitation. However, the result showed that empowerment alone is inadequate, and hence building strong CBOs and better access to formal credit are essential.
The outcomes of the scenario analysis highlight the importance of the simultaneous implementation of multiple concepts for the development of SHG members. Enhancing the capacities of SHG members, good governance within the CBOs and micro-finance through high-quality CBOs comprise the main aspects that should be taken into consideration in the examined case. Access to micro-finance and higher income will help community members to diversify their livelihood options and develop small enterprises. As a result, women empowerment and social safety nets will emerge, and women will improve their education, health, and develop their personality. All of the above factors will help poor rural communities and their members to alleviate socio-economic poverty while improving social resilience and promoting economic stability.
However, there is a need to incorporate resource efficiency in local and collective businesses, which can reduce pressures and impacts on the environment while contributing to socio-economic development and human well-being [
10,
11]. A shift towards the circular economy could translate into significant changes in people’s lives [
14]. Worldwide, small and medium enterprises are trying to move towards circular business models and solutions; however, the lack of consumer interest and awareness along with the lack of support from demand networks prevent the implementation of green innovations and act as the main obstacle for a transition towards the circular economy [
14].
Several concepts identified in this study have the potential to incorporate the circular economy approach. The characteristics of those concepts that can influence communities’ perceptions and attitudes towards circular solutions could include (C8) consumption―encouraging a non-materialistic environment among households and communities, supporting decisions to buy refurbished products over new ones, and increasing longevity of purchased products; (C9) enterprise development―building green enterprises, reusing/repairing/recycling resources at various levels, and more focus on product quality and service offering; (C10) livelihood diversification―a shift towards green livelihoods, and building farm and non-farm livelihood portfolios; (C12) natural assets―sustainable use and management of water and land resources, soil nutrient management through organic fertilisers, composting, and mulching, among others, and sustainable livestock management; and (C13) health, hygiene, and sanitation―changing consumer behavior, waste management at various levels, that is, households and industries, through reduction, reusing, and recycling, and wastewater treatment.
4. Conclusions
This study identified the key- and respective sub-concepts aimed at eliminating rural poverty in the developing economy. The CBOs are likely to allow the poor to overcome the social, financial, and economic exclusion responsible for perpetuating poverty. Social mobilisation and building institutions of the poor, including them in conventional financial institutions, the promotion of livelihood diversification, convergence with other development programmes, and social development are critical components designed to address the exclusion of the rural poor, eliminating their poverty and bringing them into the economic and social mainstream. The DAY-NRLM programme created the necessary implementation architecture, financial and management systems, and a conducive environment for the CBO-led model for the promotion of livelihoods and poverty alleviation. The CBOs show potential for long-term sustainability, as the programme has generated large social capital in the form of CRPs and community cadres, and thus it is likely that they will be able to sustain and nurture the community institutions.
The pathways of approaching a circular economy are strongly connected with the existing social, economic, and political systems, which could vary for every country. The following are some recommendations for moving towards a circular economy: (i) introduction of effective policy measures in order to enhance productivity and efficiency of resources; (ii) focus on research and development within enterprises to increase resource productivity and product longevity; (iii) strengthen education to raise awareness about use and limits of resources; (iv) change lifestyles to develop sustainable consumption behavior; and (v) improve communication between policymakers, communities, and businesses/industries.
Furthermore, this study also deals with the contribution of the OWA-FCM aggregation method by learning OWA operator weights in the participatory modelling domain. The innovation of this work lies in the fact that the strengths of the relationship were calculated with the proposed aggregation approach and further compared with the weights of the average method and those assigned by the experts. The results showed that the OWA-FCM resembles the structure of the expert-based FCM and, in most cases, showcased an improved performance compared to the model constructed by the experts. The FCM-based scenarios try to model the situation of livelihood enhancement through building self-managed and sustainable institutional platforms along with promoting social resilience and economic stability of the rural poor women. What makes this study important with regards to the scenario analysis results is that the OWA-FCM method presents similar trends to the other two aggregation methods examined with regards to the impact that certain key concepts such as political, social, and economic empowerment of women can have on other important key concepts such as increasing social harmony in the community. It was well demonstrated in the study that there was consistency among the impacts of the model of certain key concepts on other components, which makes the proposed method significant for policymakers.
Moreover, the proposed aggregation method can be applied by policymakers for strategic decisions in various scientific domains, validating its generic applicability and convenience when a significantly large number of experts and/or stakeholders are involved in designing FCMs. This new aggregation method, when combined with FCM-based simulations, can facilitate the preparation of more appropriate, equitable, and effective policy scenarios and responses, including shifting investment, production, distribution, and consumption towards more sustainable approaches, and the development of better governance capacities at multiple scales.

 ,
, 


