Spatiotemporal Changes in the Built Environment Characteristics and Urban Heat Island Effect in a Medium-Sized City, Chiayi City, Taiwan

Abstract
:1. Introduction
2. Materials and Methods
2.1. Measurement of UHI Intensity
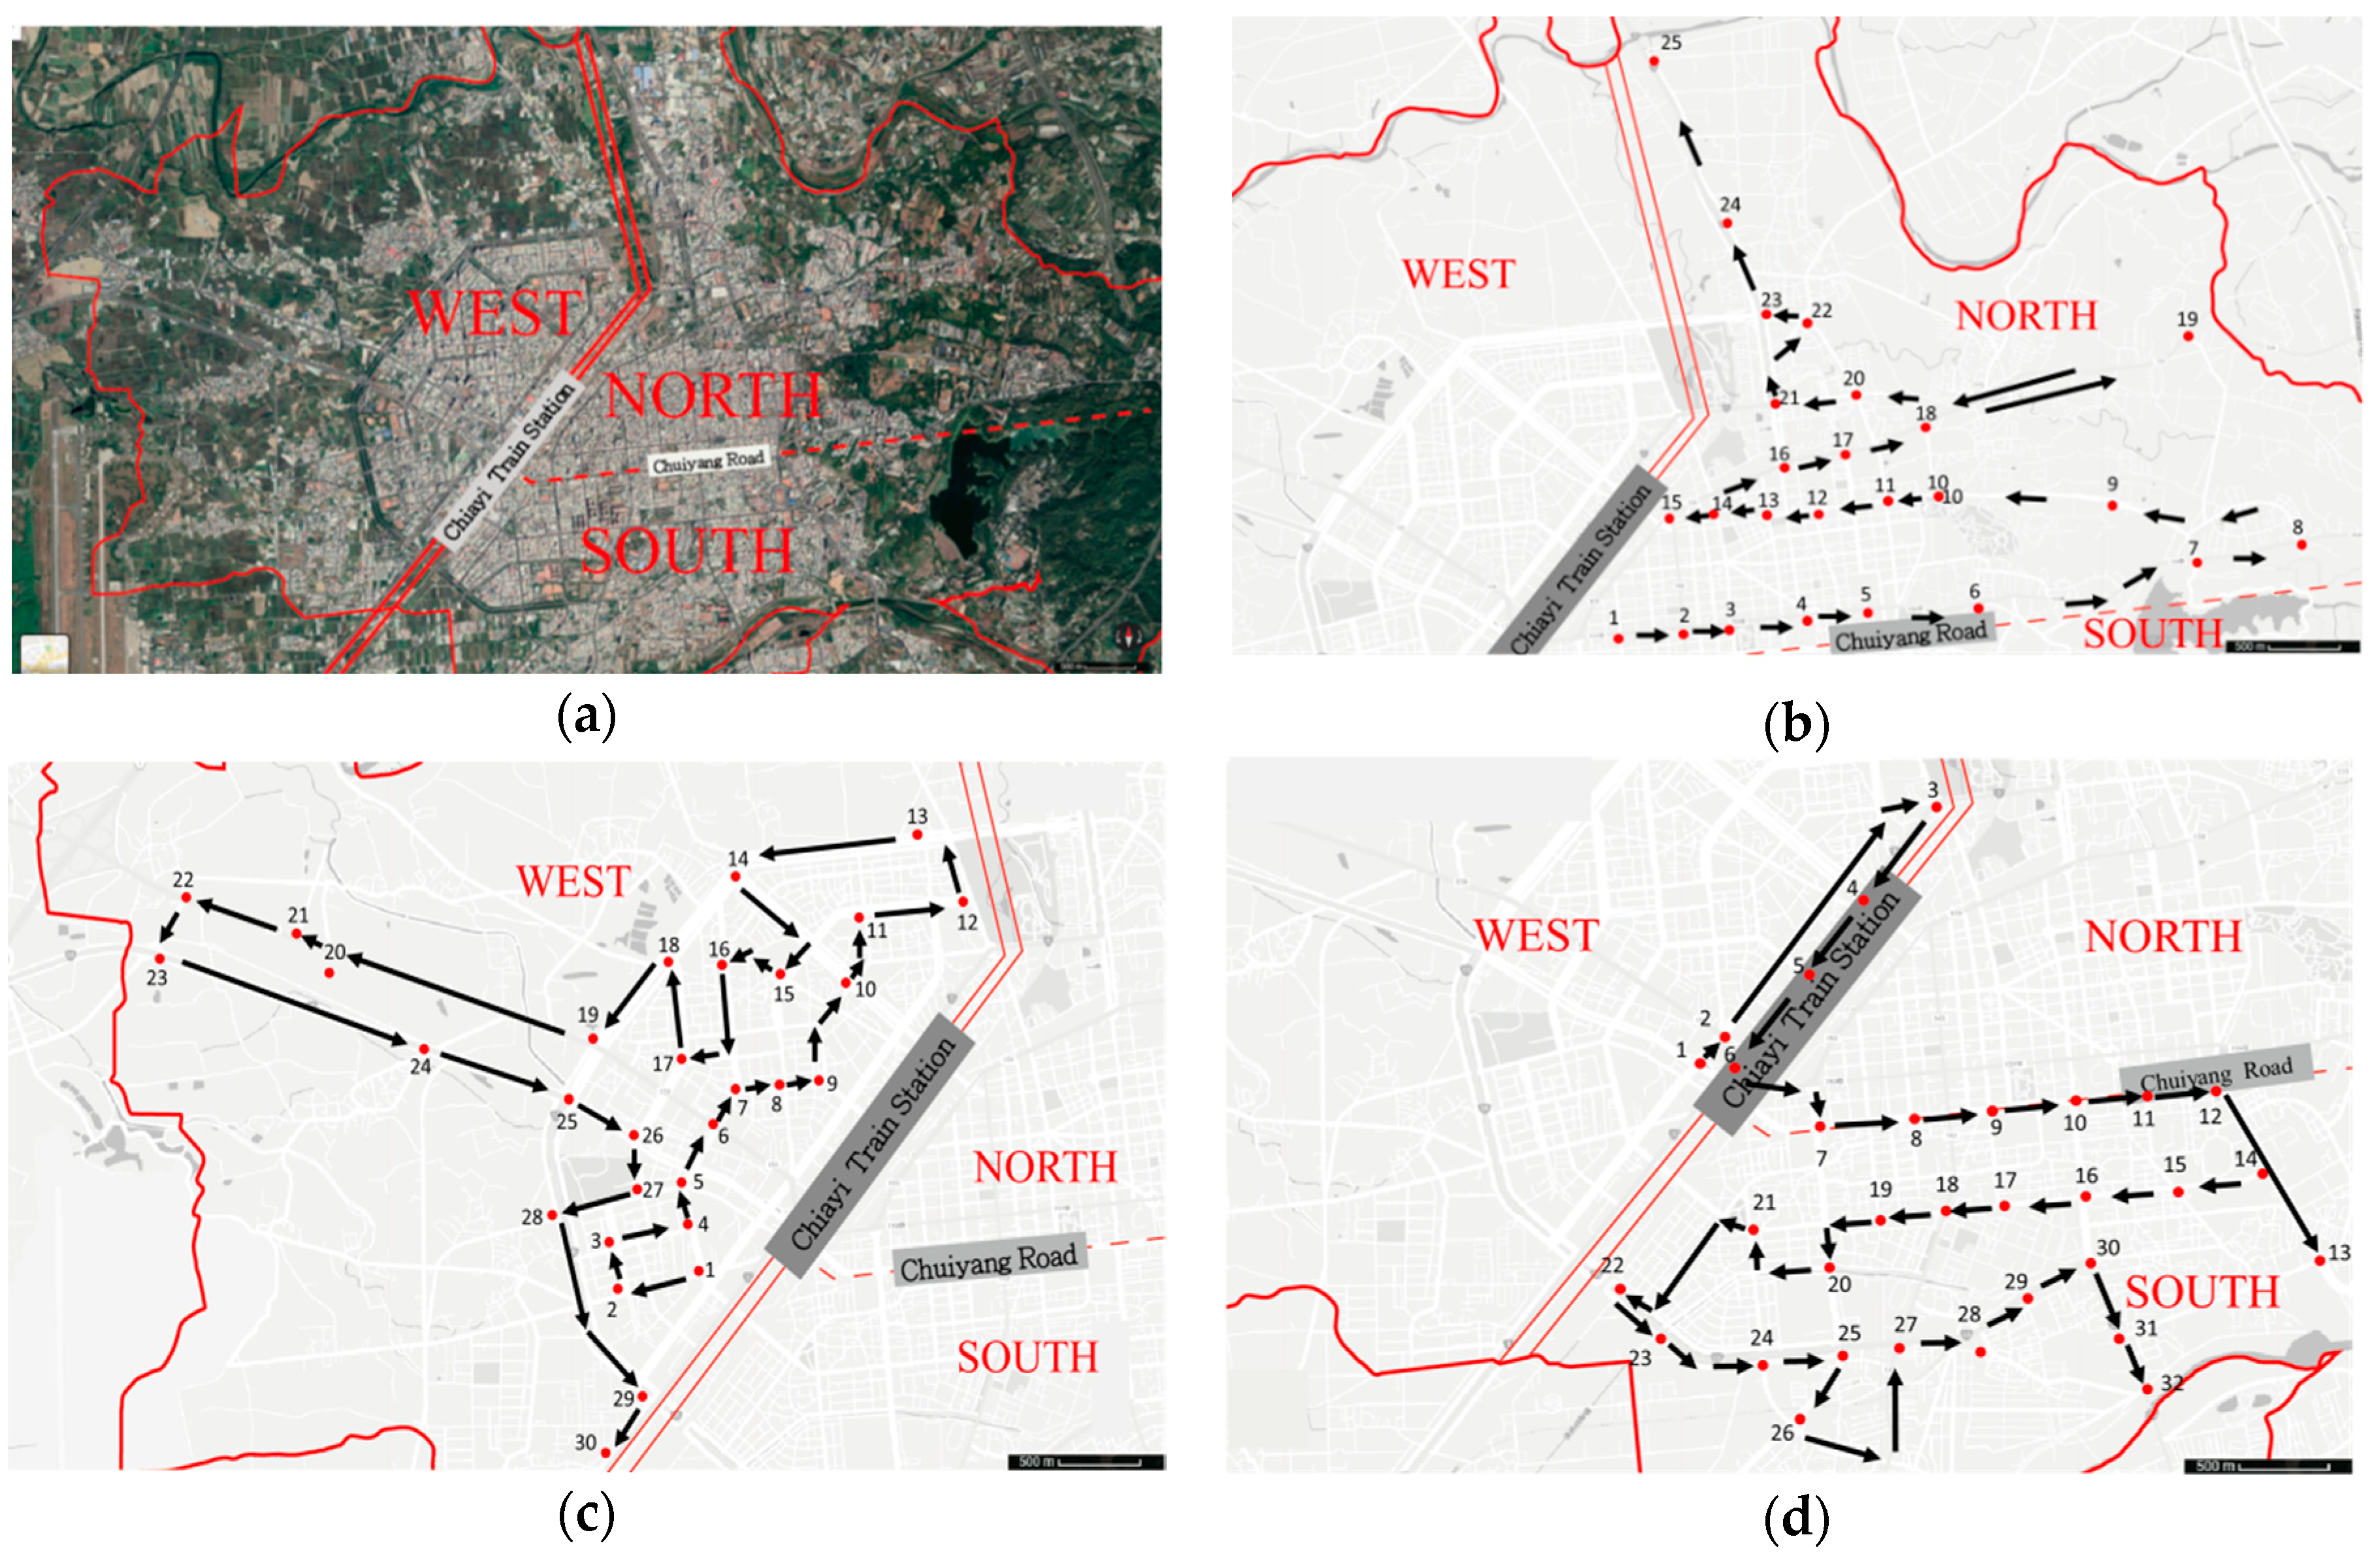
2.1.1. Study Scope and Measurement Points
2.1.2. Survey Time, Method and Measuring Instruments
2.1.3. Correction for Time Synchronization
2.1.4. Background Weather Conditions
2.2. Analysis of the Built Environment Factors
2.3. Correlation Analysis
3. Results and Discussion
3.1. UHI Temperature
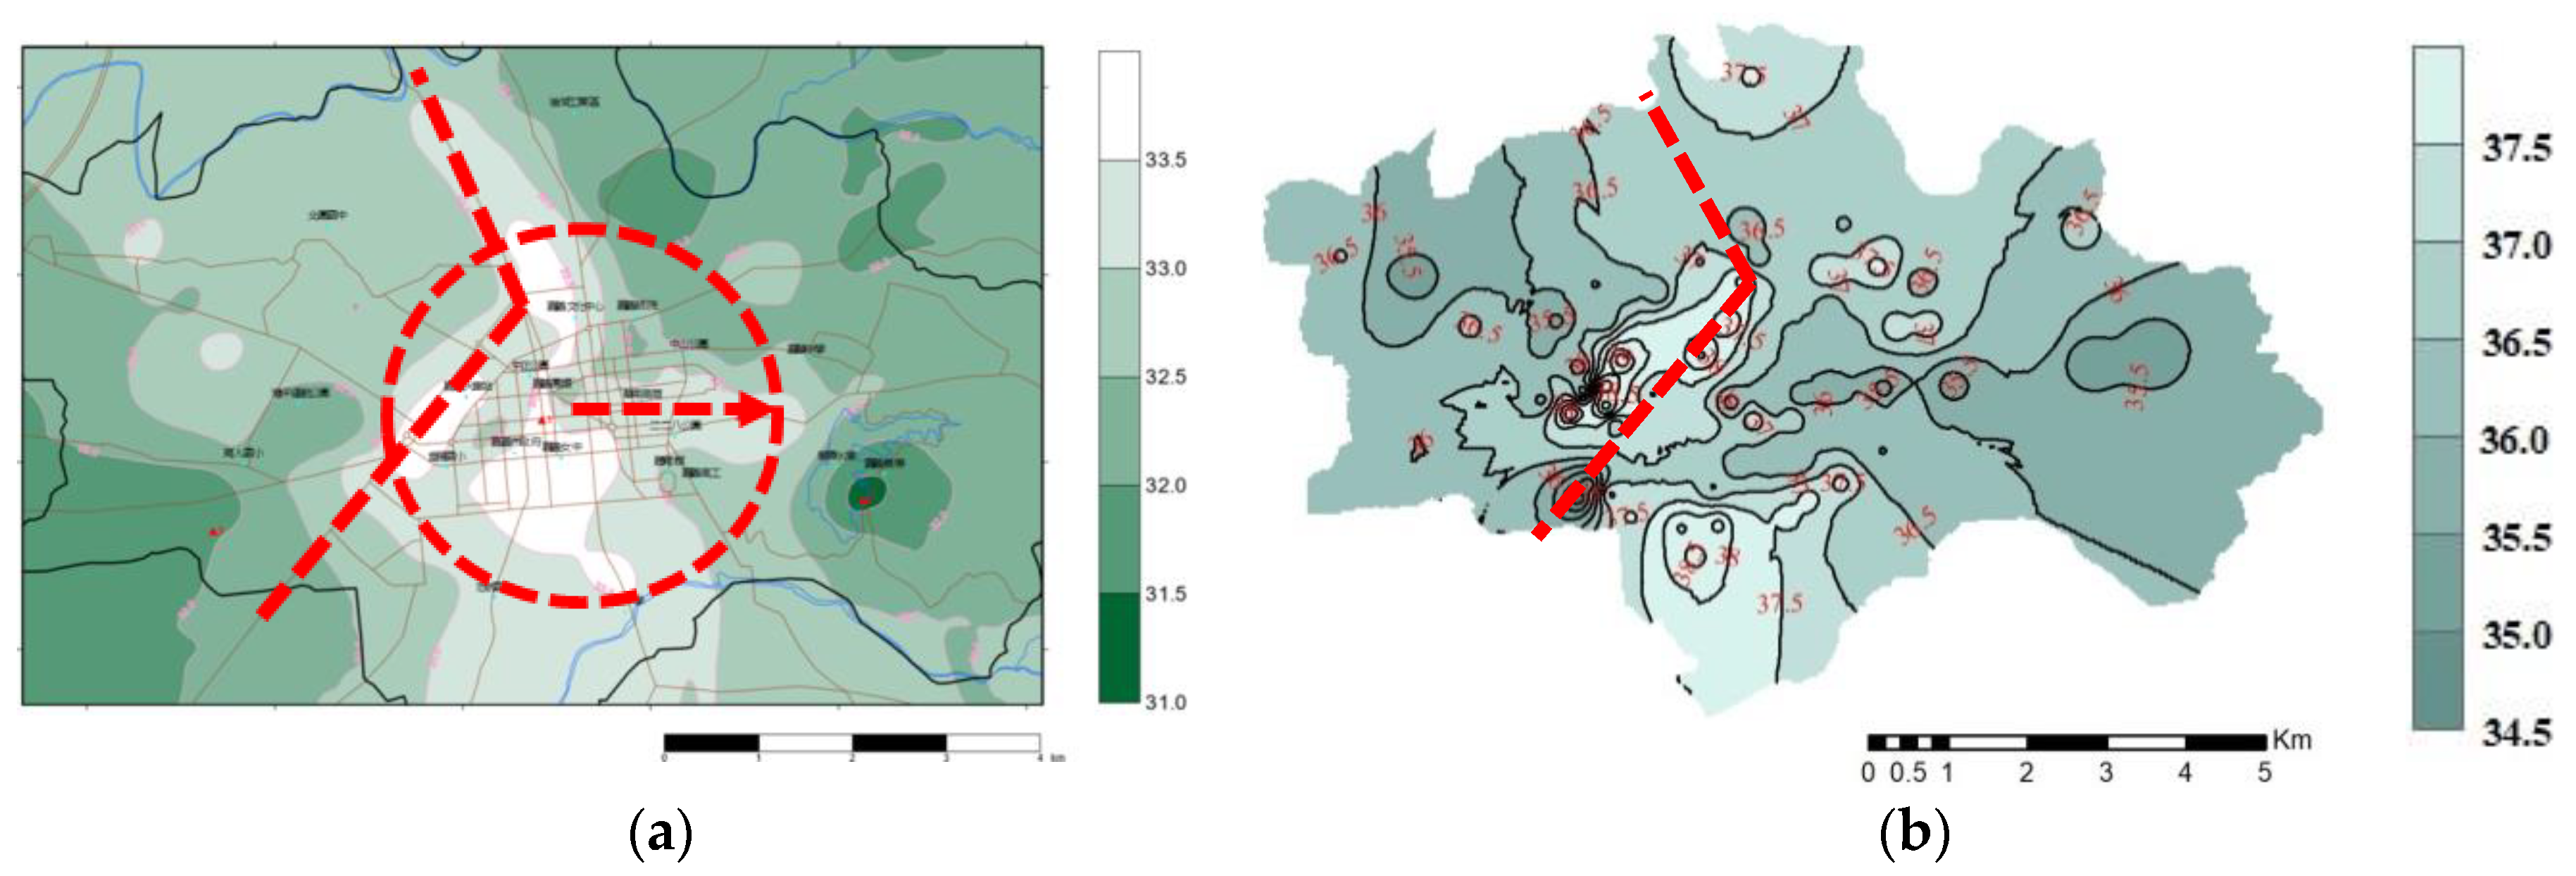
3.1.1. Daytime
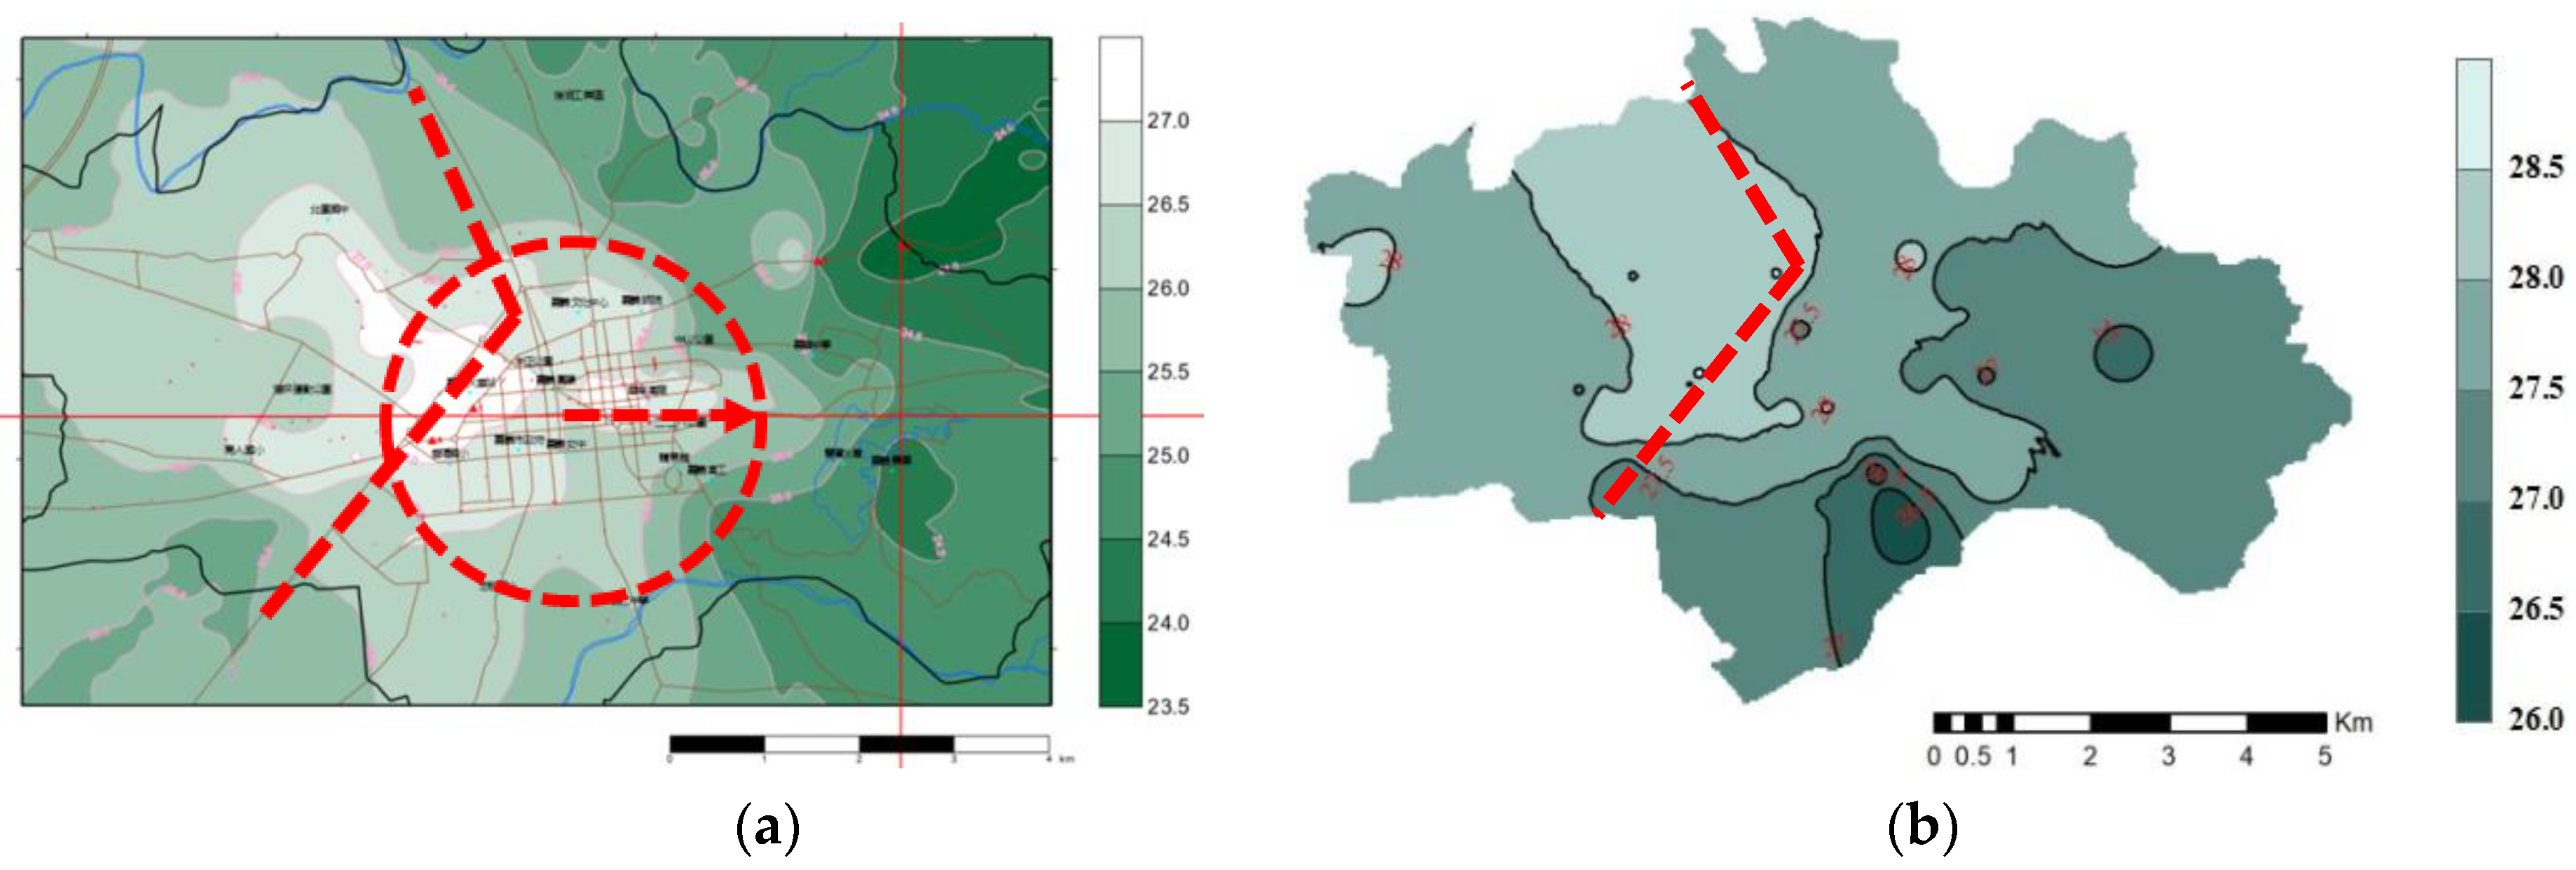
3.1.2. Midnight
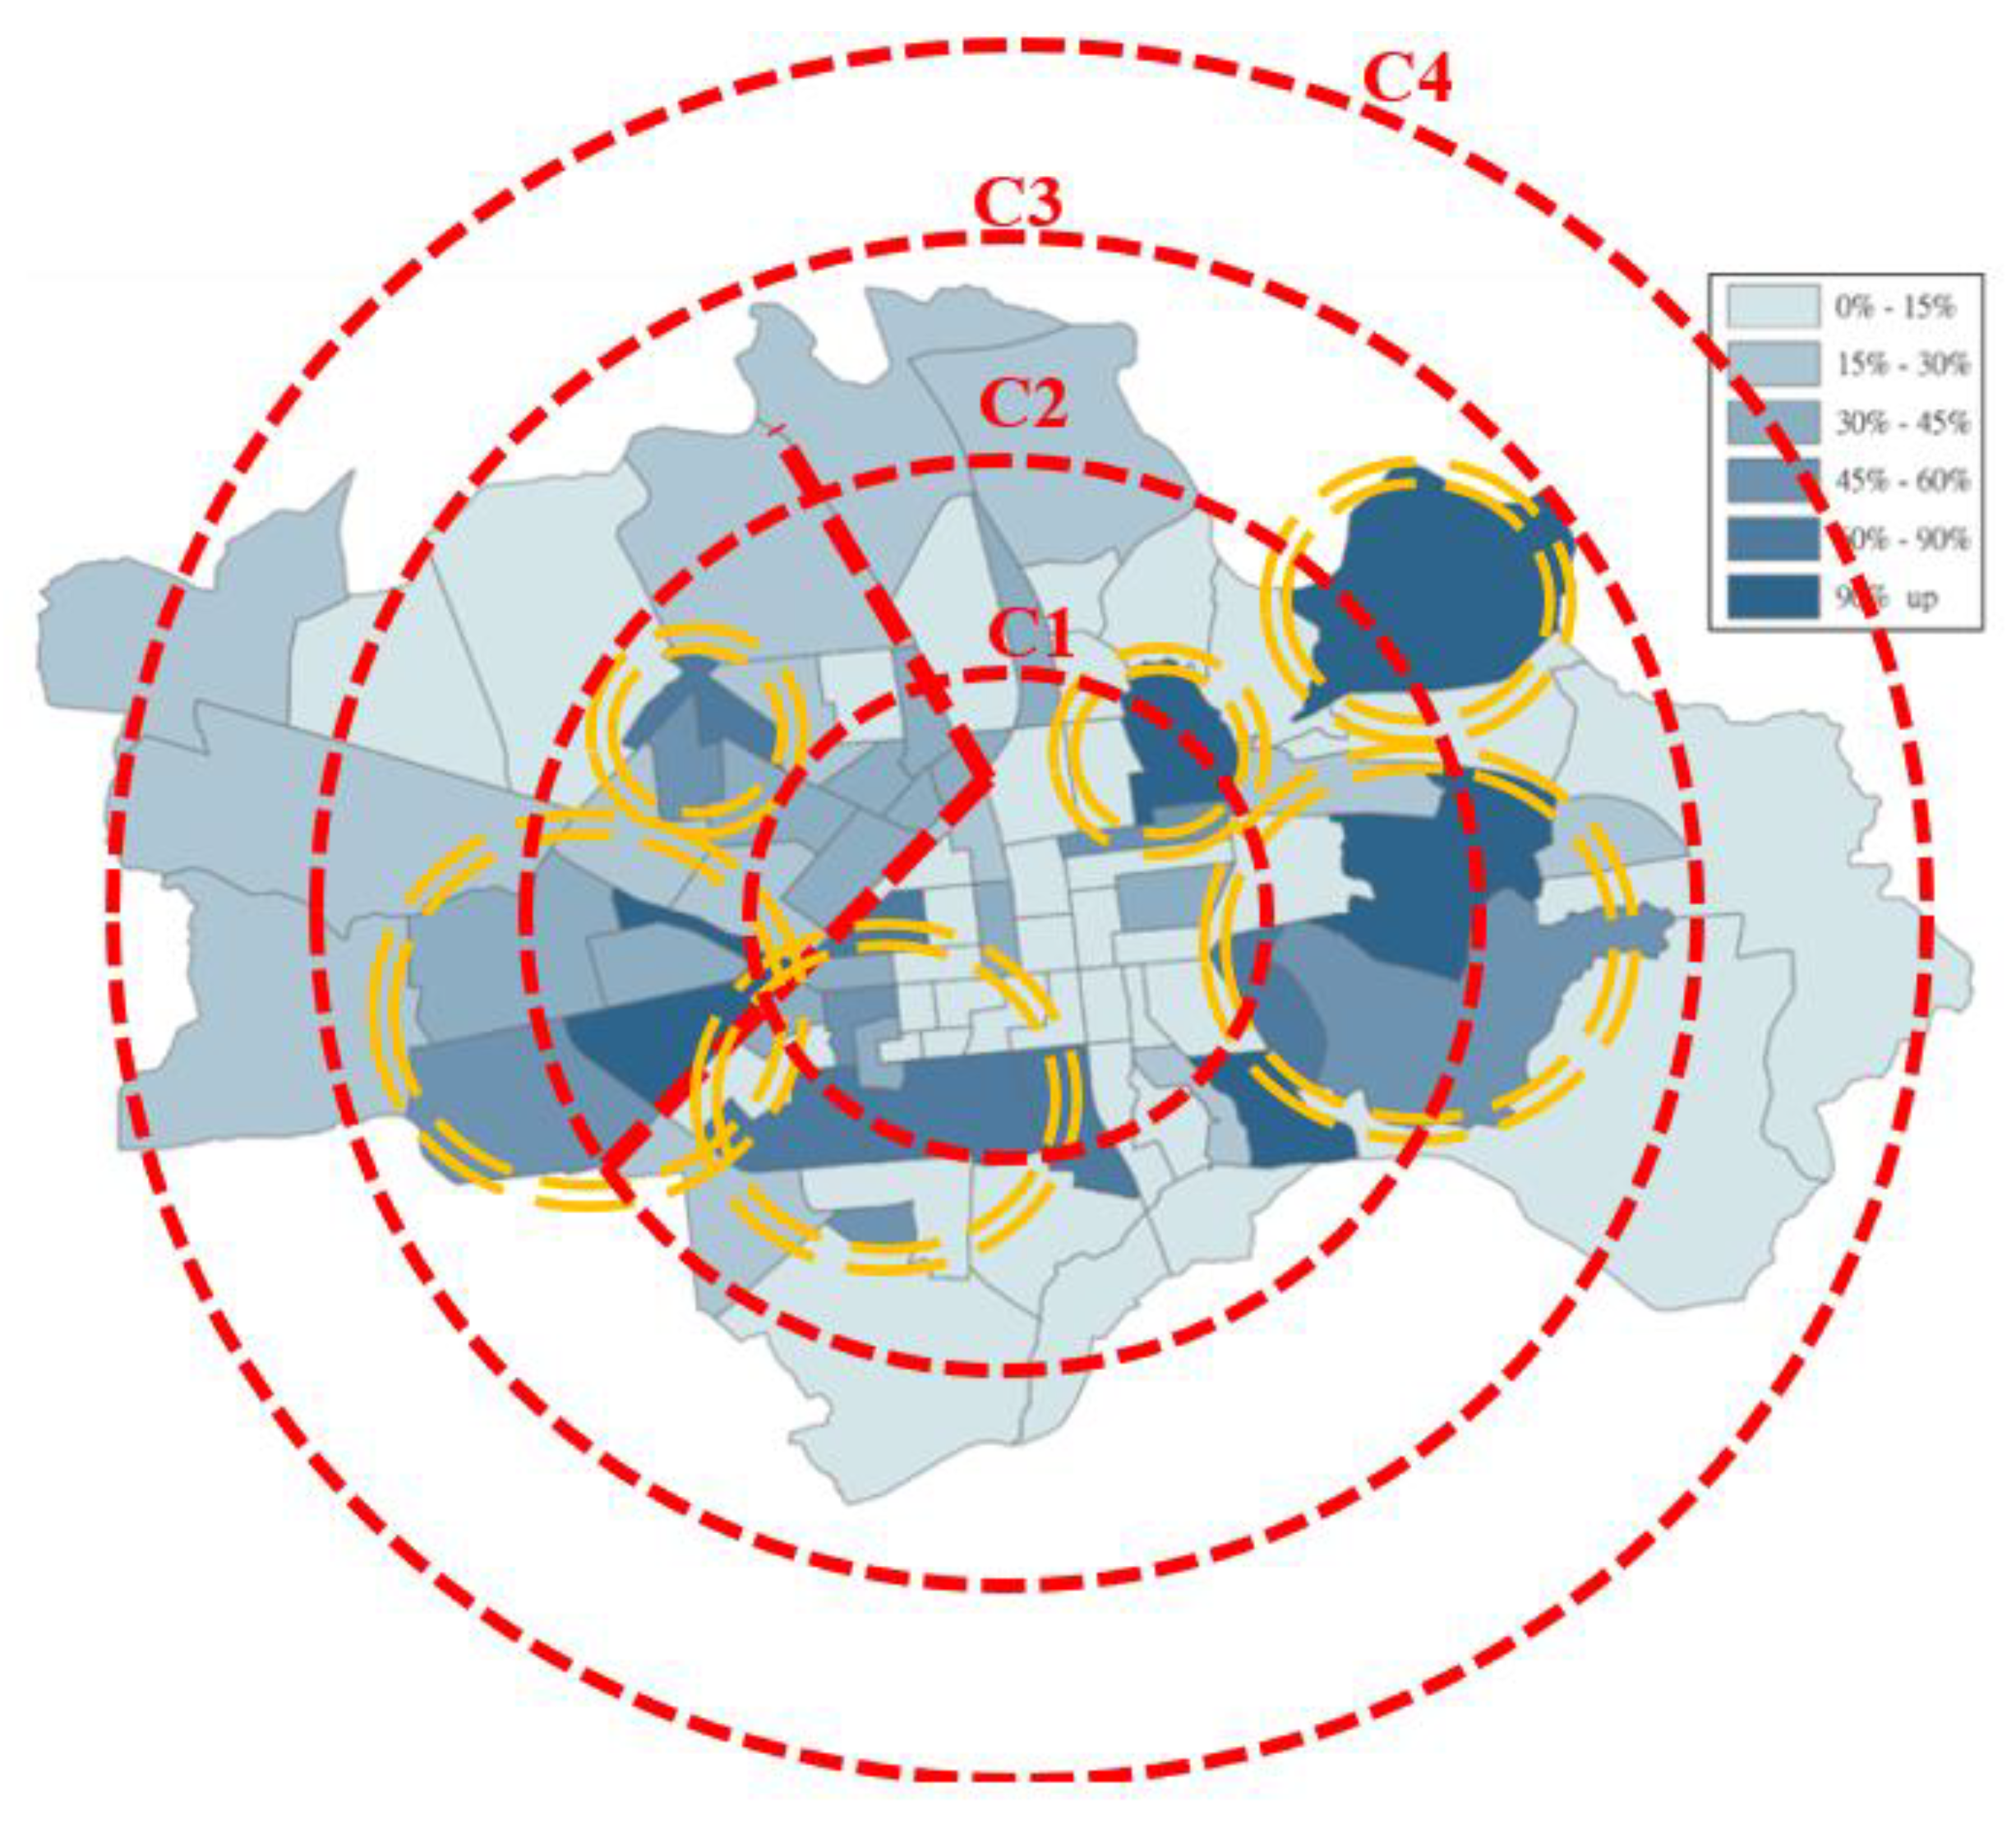
3.1.3. Changes in the Artificial Area Ratio from 20 Years Ago vs. UHI
3.1.4. Influence of Climate Change in 1999 and 2018
3.1.5. Influence of Measurement Difference in 1999 and 2018
3.2. Built Environment Factors in Chiayi City
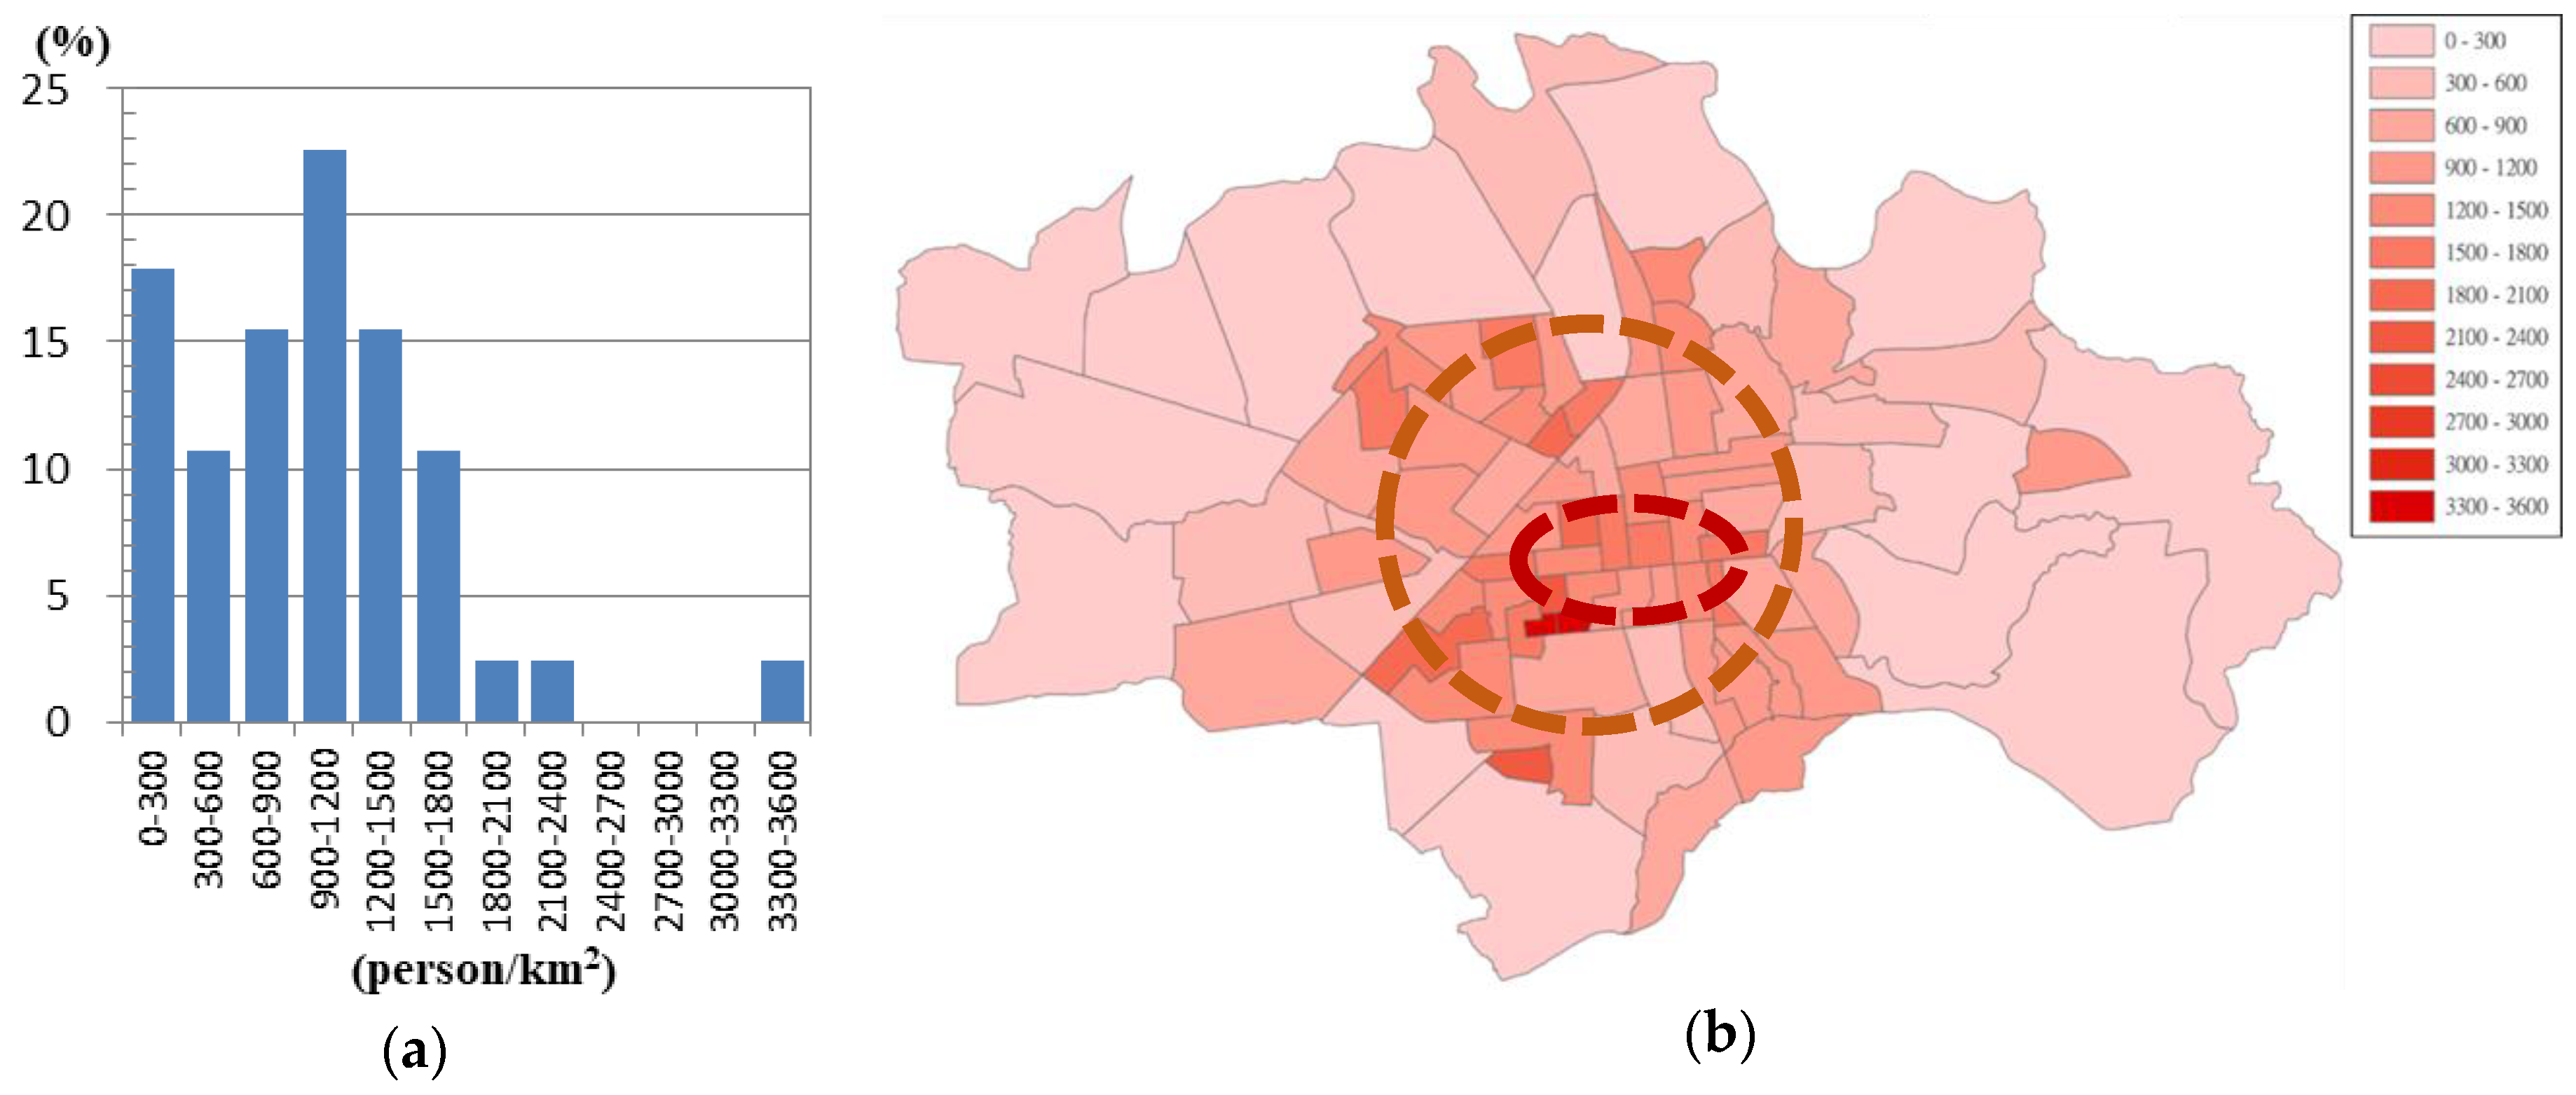
3.2.1. Population Density (PD)
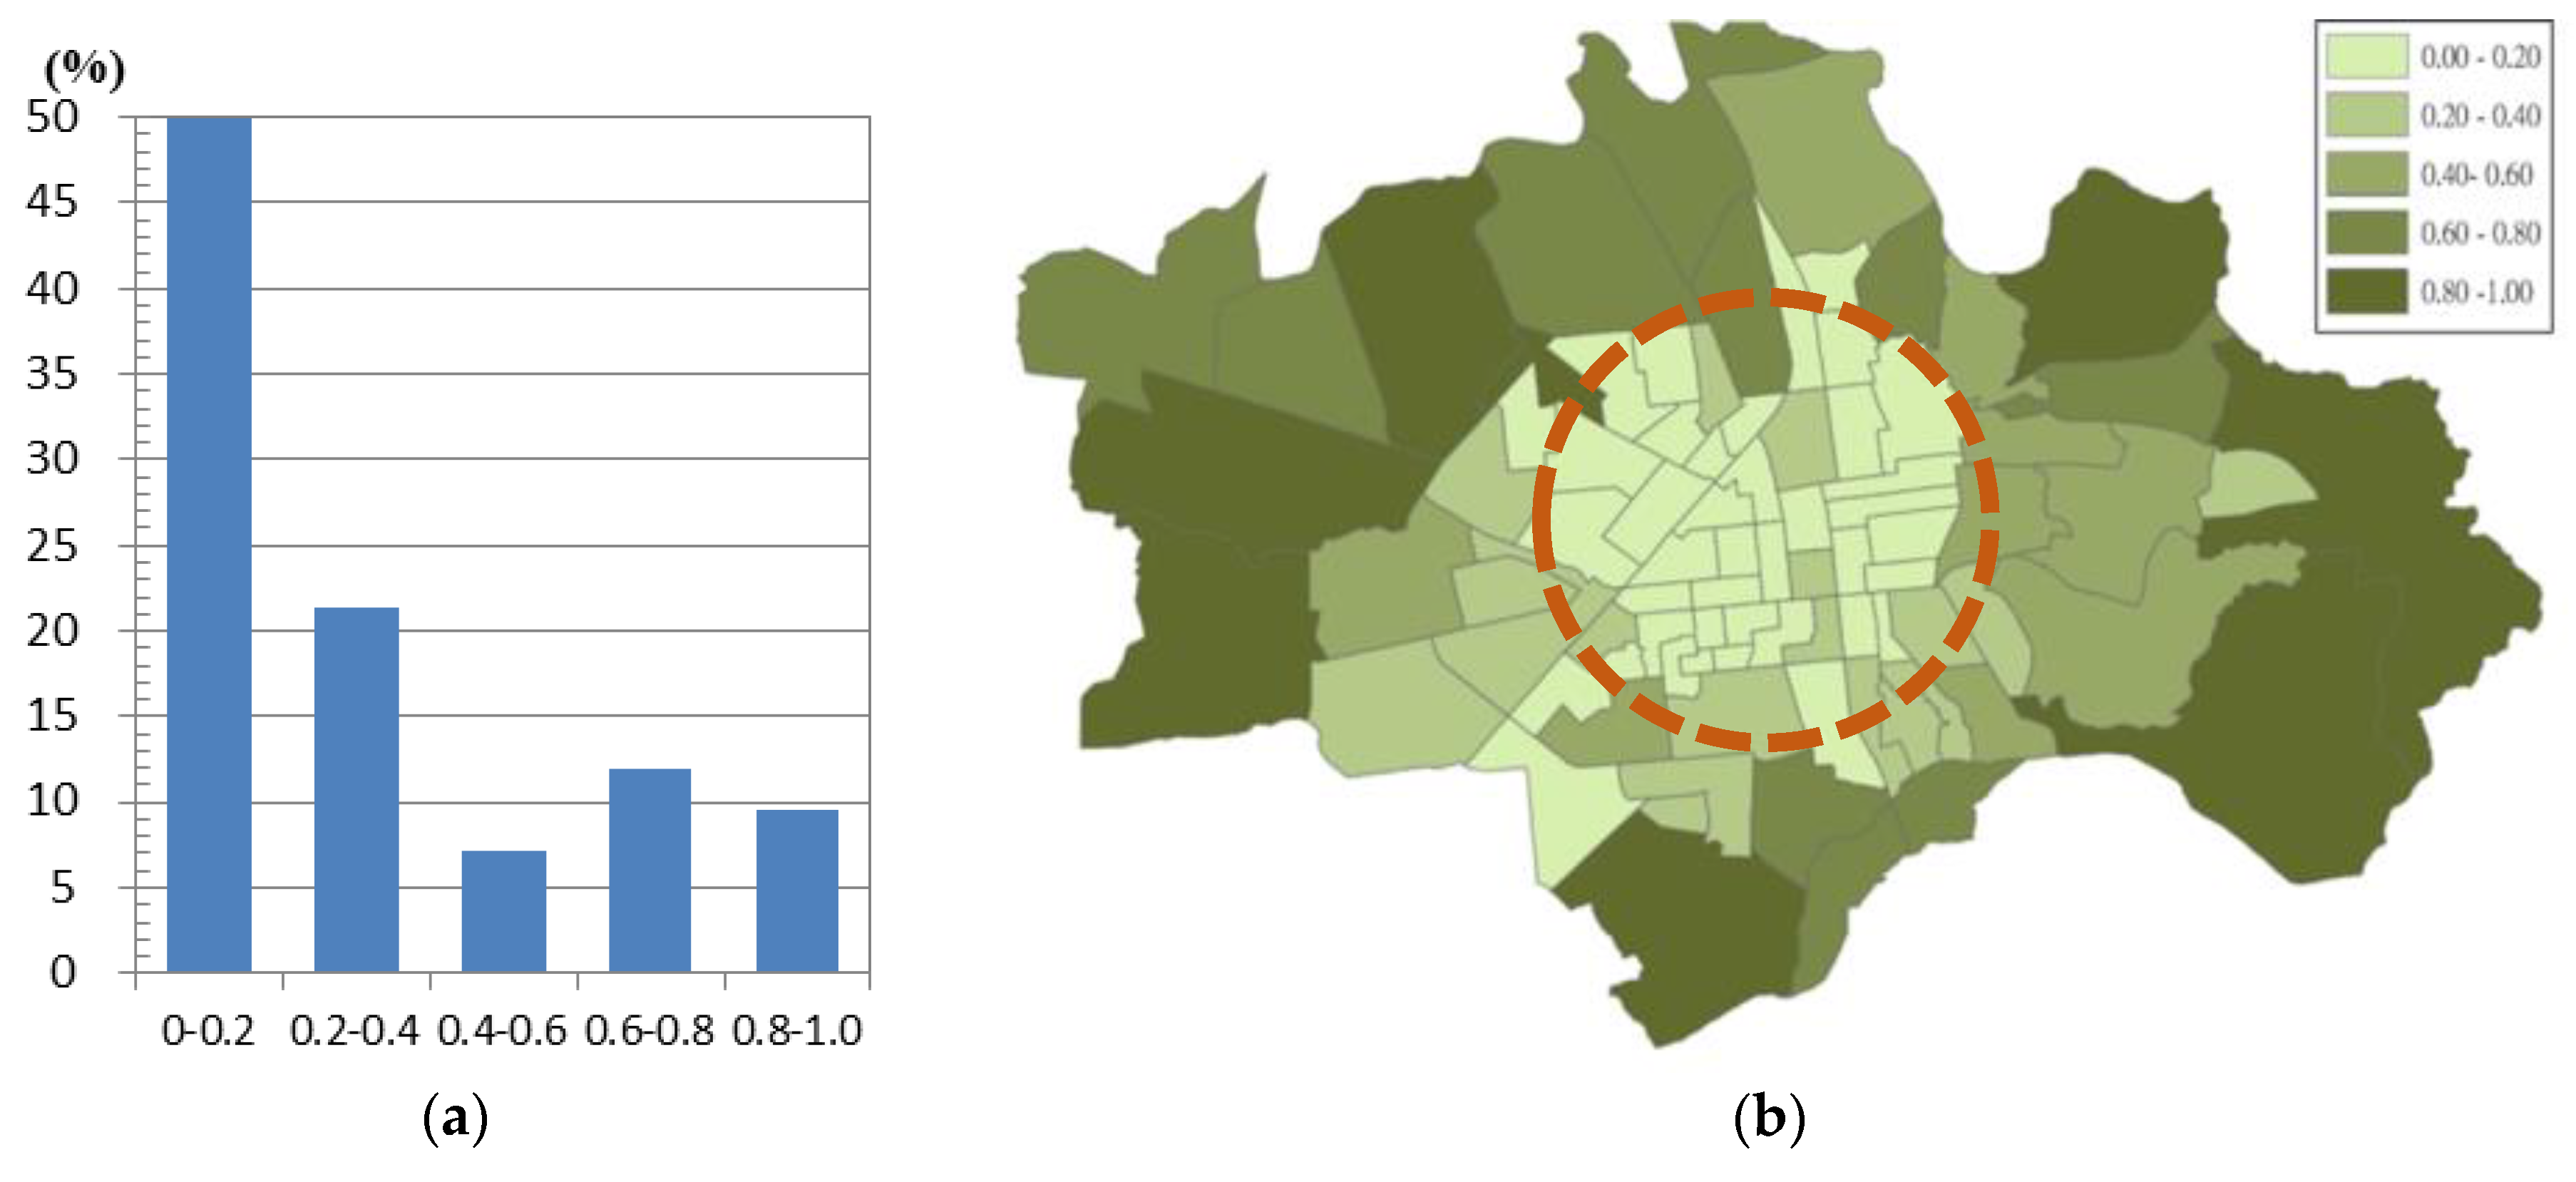
3.2.2. Green Area Ratio (GAR)
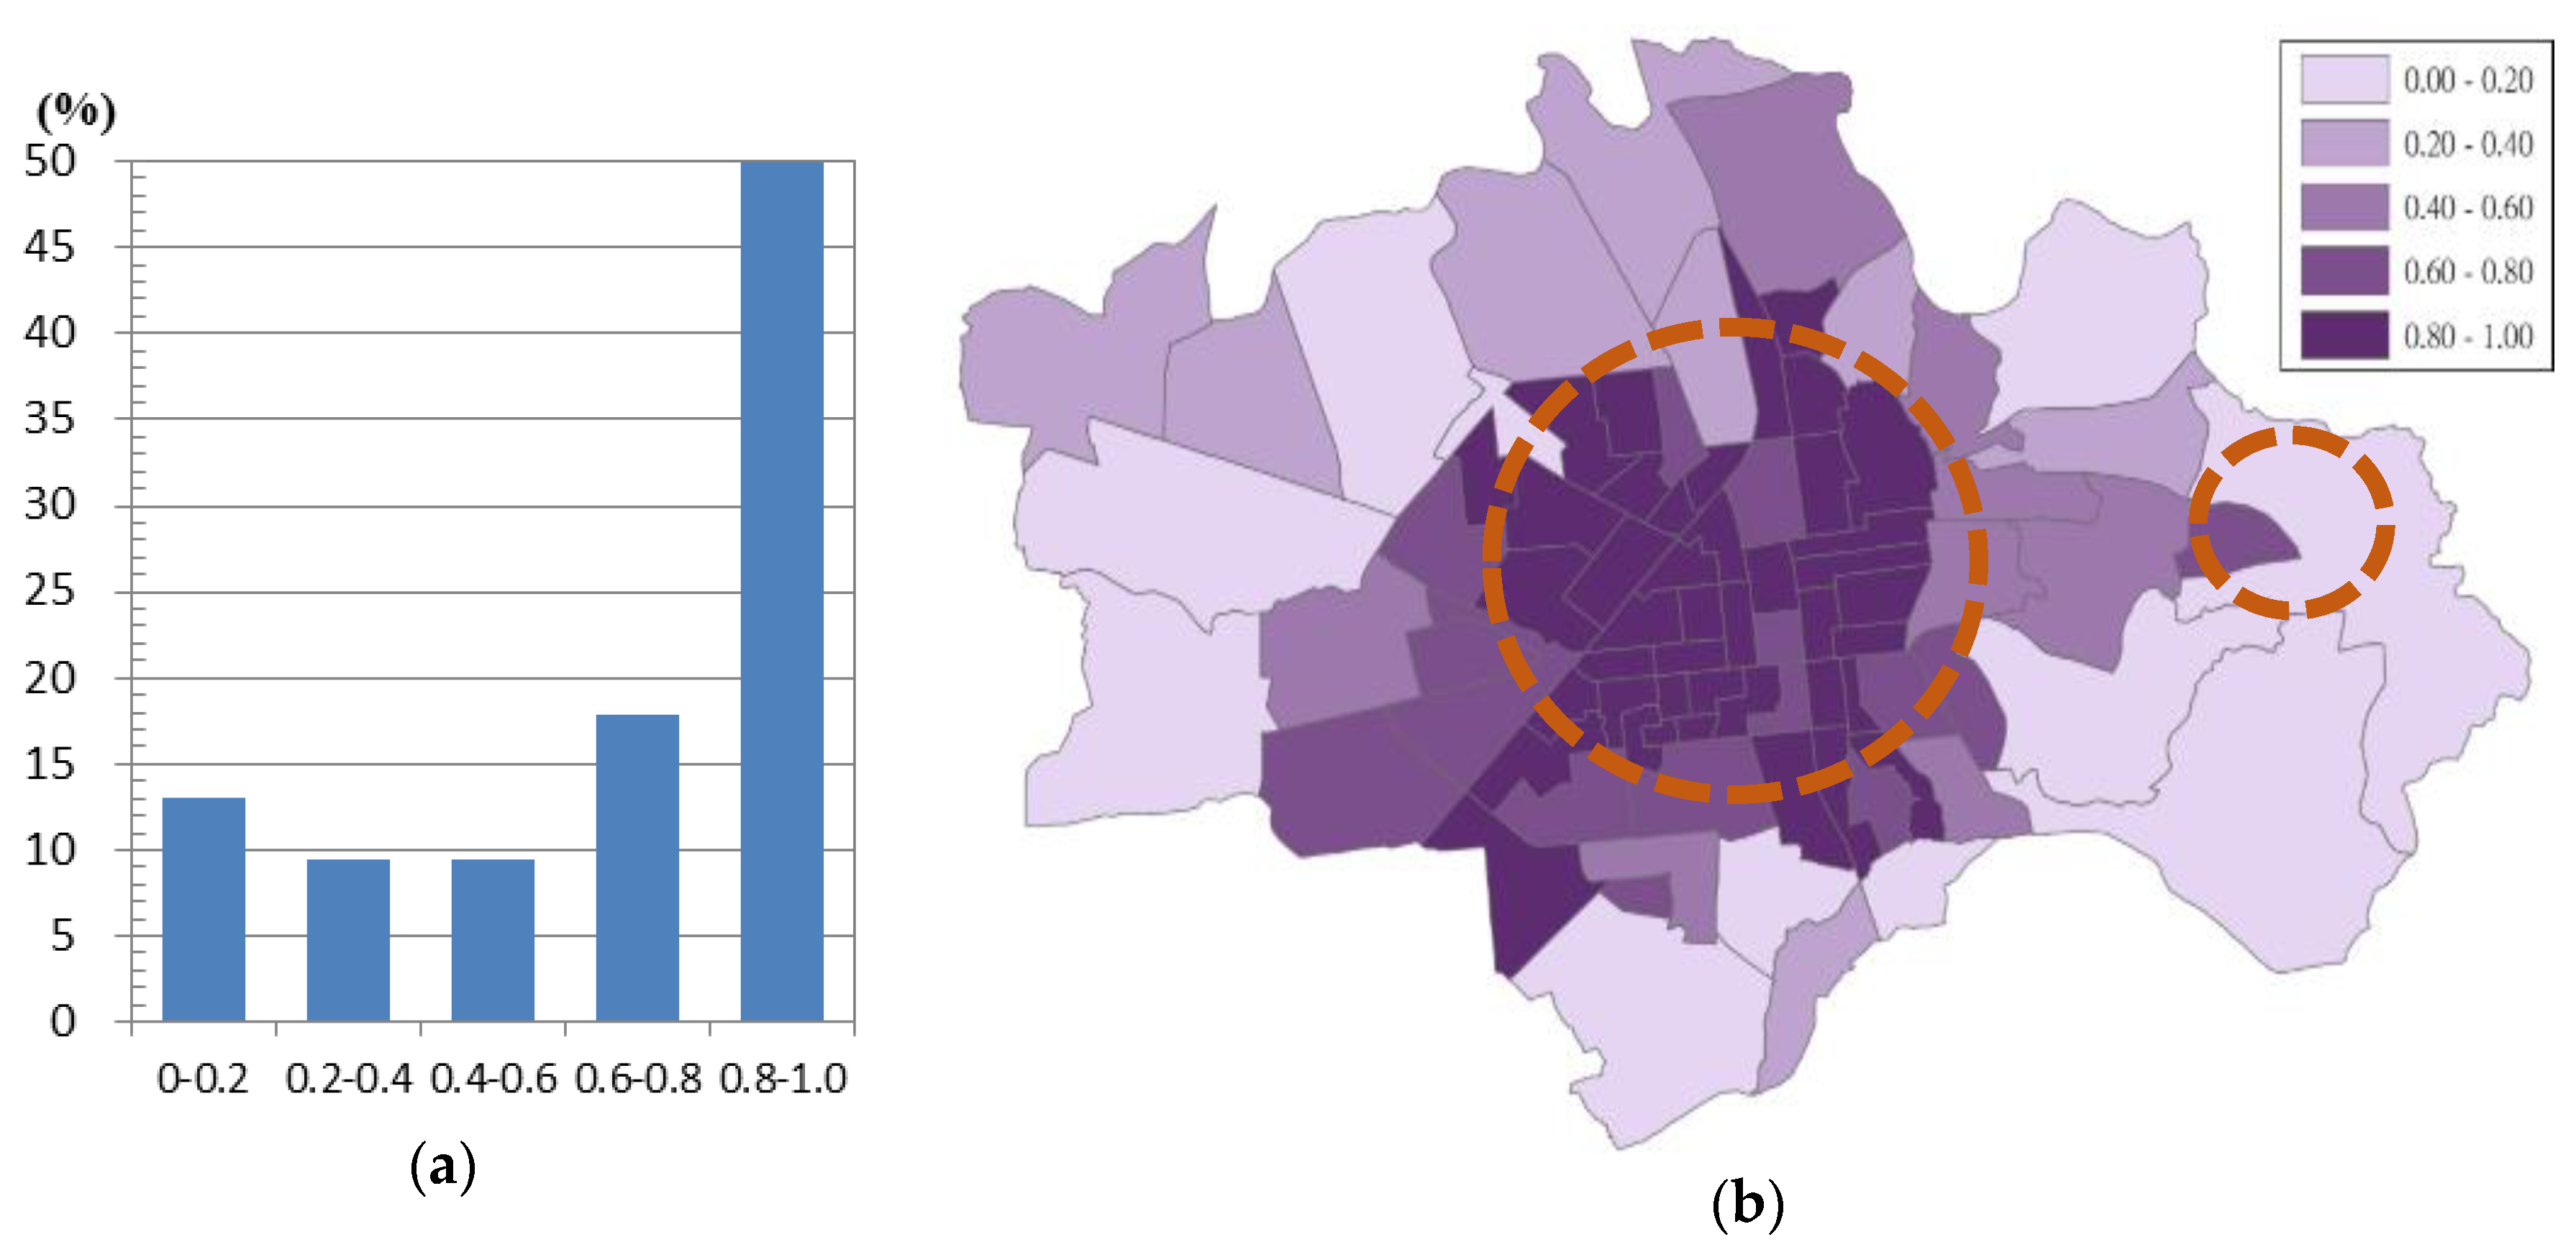
3.2.3. Artificial Area Ratio (AAR)
3.3. Coefficient of Correlation between the UHI and Built Environment Factors
3.3.1. District-Scale Analysis
3.3.2. 100 m-Scale Analysis
3.3.3. Time-Scale Analysis
4. Conclusions
- (1)
- The maximum temperature of the UHI in the day was approximately 37.5 °C, and the lowest temperature was approximately 33.5 °C. In comparison with the study in 1999, the maximum temperature difference was approximately +2.3 °C, the minimum temperature difference was approximately +1.3 °C, and the UHII was increased from 2.8 °C to approximately 4.1 °C.
- (2)
- The maximum temperature of the UHI at midnight was approximately 28.5 °C, and the lowest temperature was approximately 26.0 °C. In comparison with the study in 1999, the maximum temperature difference was approximately −0.4 °C, the minimum temperature difference was approximately +0.7 °C, and the UHII was decreased from 3.7 °C to approximately 2.5 °C.
- (3)
- The day-time UHII was consistent with those found in the other medium-sized cities with similar populations of 200,000–300,000 and was comparable to those of large cities with populations of more than one million. Otherwise, it was also found that the UHII of a medium-sized city in the mid-latitude (Padua, Italy) was approximately 2.0 °C higher than those of the medium-sized cities in the tropics (Chiayi, Taiwan and Muar, Malaysia).
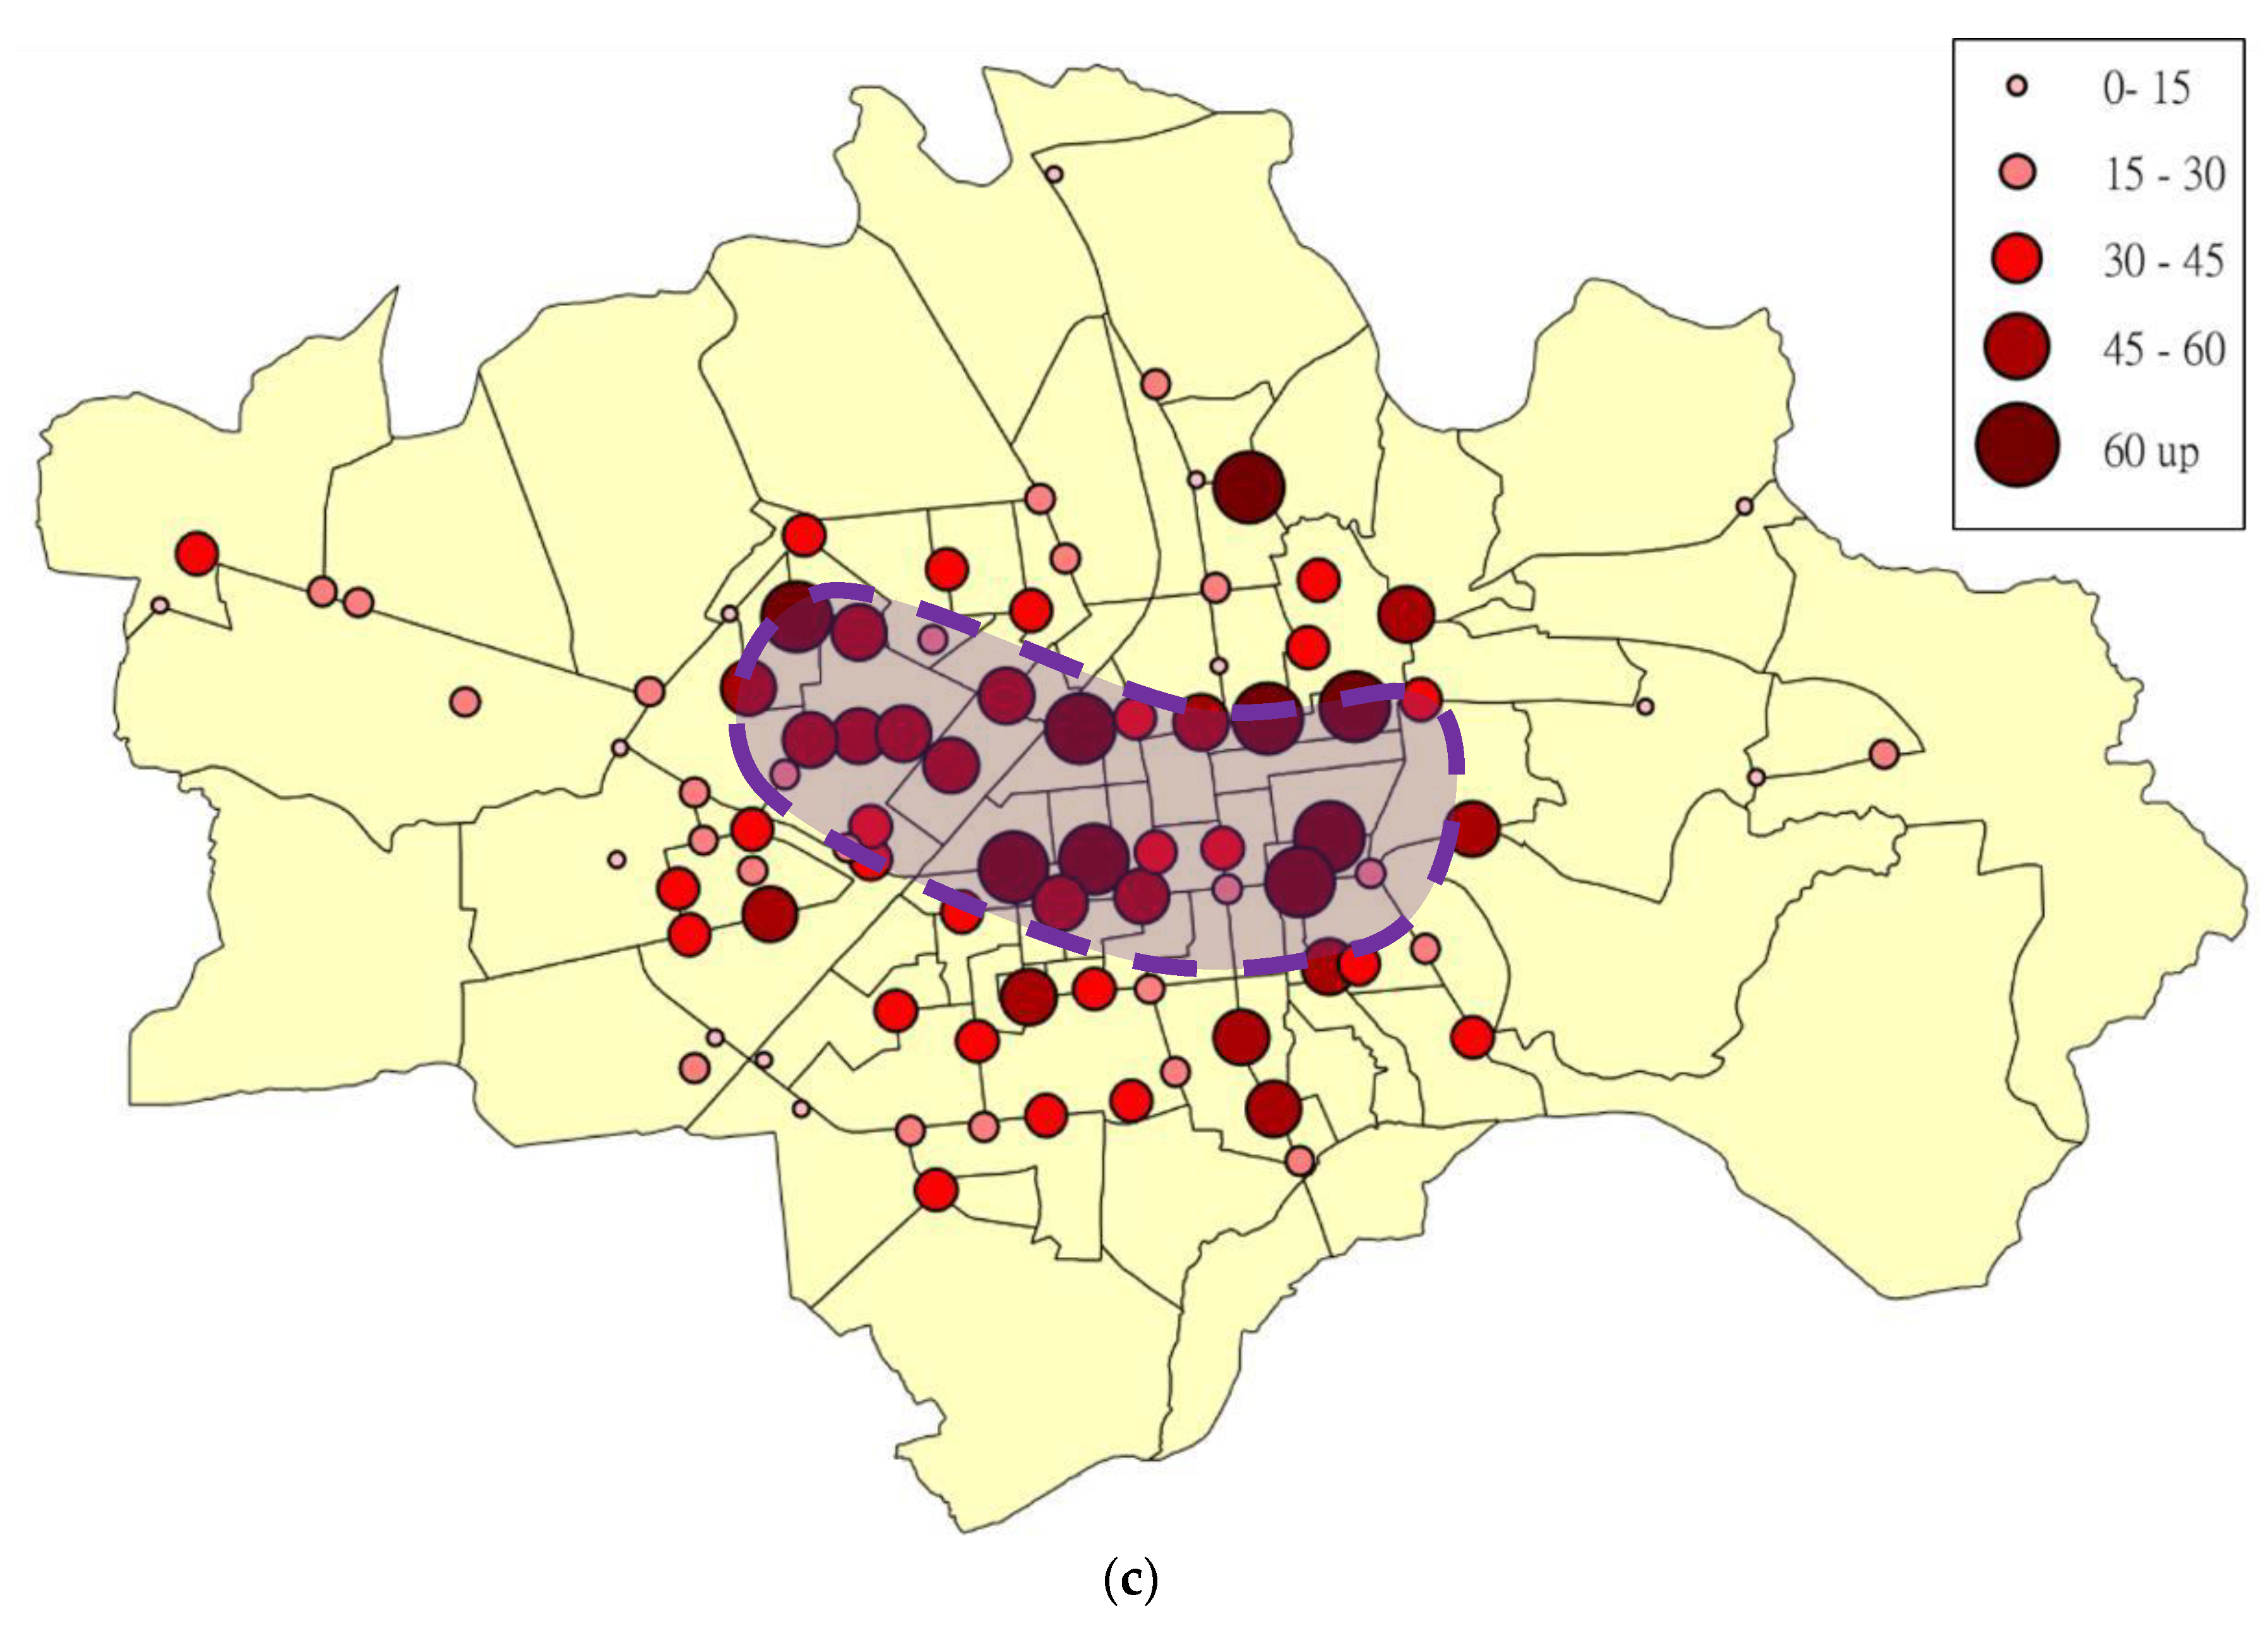
- (4)
- According to the analysis of the increase in the artificial coverage ratio between 2004 and 2015, it was found that the increase of the center area was the lowest, while the sub-central area, the outer 2 km radius of the center area, had the highest increase at approximately 45%–90%. Outside of the sub-central area, it again fell to below 30%. In the sub-central area with the highest increase, the northeast, east, northwest, west, and southwest sides had the most obvious increase ratios. This trend was consistent with the trend of the spatial changes in UHI (day-time and night-time) between 2004 and 2015, and it clearly proved the importance of the influence of urban land use expansion on UHIs.
- (1)
- The population density averaged approximately 1000 persons/km2, and its spatial distribution had a tendency to decrease outward from the central area (=900 persons/km2) to rural areas (<600 persons/km2).
- (2)
- The green coverage ratio averaged approximately 0.32, and in contrast to the population density, its spatial distribution tended to increase outward from the central area (=0.2) to the rural area (>0.6).
- (3)
- The building coverage ratio averaged of approximately 0.66, and its spatial distribution was consistent with the population density, as it tended to decrease outward from the central area (=0.6) to the rural area (<0.4).
- (1)
- The results indicated that the correlation coefficient(r) between the daytime (1:00–2:00 p.m.) urban temperatures and district-scale (approximately 200–300 m) built environment factors, population density, greening coverage ratio, and artificial coverage ratio were all above 0.3, and the temperature was positively correlated with the population density and artificial coverage ratio and negatively correlated with green coverage ratio. This trend was more obvious in the results of 2:00 pm readings, and the r reached 0.4.
- (2)
- Compared with Lin et al.’s results in 1999, the results of the analysis of the three district-scale built environment factors were consistent, and only the r decreased to 0.3–0.35. This may be due to the different analysis ranges of the built environment factors between the studies (1000 m in Lin et al.’s study, 200–300 m in this study). However, according to the analysis at the smaller scale, the 100 m-scale, artificial coverage ratio in this study, it was found that the r could be increased to 0.4–0.5. Therefore, in future analyses of data from block-scale UHI data obtained through the mobile observation method and built environment factors, the distance range of the built environment factors from measure points should be quantified, and the values could become representative. In other words, the block-scale UHI will be affected by the proximity of built environment factors, which is worthy of further research.
Author Contributions
Funding
Conflicts of Interest
References
- Oke, T.R. The energetic basis of urban heat island. J. R. Meteorol. Soc. 1982, 108, 1–24. [Google Scholar] [CrossRef]
- Oke, T.R. Boundary Layer Climates, 2nd ed.; Methuen & Co.: London, UK, 1987. [Google Scholar]
- Oke, T.R. City size and urban heat island. Atmos. Environ. 1973, 7, 769–779. [Google Scholar] [CrossRef]
- Santamouris, M. Analyzing the heat island magnitude and characteristics in one hundred Asian and Australian cities and regions. Sci. Total Environ. 2015, 512, 582–598. [Google Scholar] [CrossRef] [PubMed]
- Giridharan, R.; Rohinton, E. The impact of urban compactness, comfort strategies and energy consumption on tropical urban heat island intensity: A review. Sustain. Cities Soc. 2018, 40, 677–687. [Google Scholar] [CrossRef] [Green Version]
- Chapman, S.; Watson, J.E.; Salazar, A.; Thatcher, M.; McAlpine, C.A. The impact of urbanization and climate change on urban temperatures: A systematic review. Landsc. Ecol. 2017, 32, 1921–1935. [Google Scholar] [CrossRef]
- Tzavali, A.; Paravantis, J.P.; Mihalakakou, G.; Fotiadi, Α.; Stigka, E. Urban heat island intensity: A literature review. Fresenius Environ. Bull. 2015, 24, 4537–4554. [Google Scholar]
- Khamchiangta, D.; Dhakal, S. Physical and non-physical factors driving urban heat island: Case of Bangkok Metropolitan Administration, Thailand. J. Environ. Manag. 2019, 248, 109285. [Google Scholar] [CrossRef] [PubMed]
- Ramírez-Aguilar, E.A.; Souza, L.C.L. Urban form and population density: Influences on Urban Heat Island intensities in Bogotá, Colombia. Urban Clim. 2019, 29, 100497. [Google Scholar] [CrossRef]
- Nguyen, T.M.; Lin, T.H.; Chan, H.P. The environmental effects of urban development in Hanoi, Vietnam from satellite and meteorological observations from 1999–2016. Sustainability 2019, 11, 1768. [Google Scholar] [CrossRef] [Green Version]
- Pakarnseree, R.; Chunkao, K.; Bualert, S. Physical characteristics of Bangkok and its urban heat island phenomenon. Build. Environ. 2018, 143, 561–569. [Google Scholar] [CrossRef]
- Liu, L.; Lin, Y.; Wang, L.; Wang, D.; Shiu, T.; Chen, X.; Wu, Q. Analysis of local-scale urban heat island characteristics using an integrated method of mobile measurement and GIS-based spatial interpolation. Build. Environ. 2017, 117, 191–207. [Google Scholar] [CrossRef]
- Sun, C.Y. A street thermal environment study in summer by the mobile transect technique. Theor. Appl. Climatol. 2011, 106, 433–442. [Google Scholar] [CrossRef]
- Spencer, G.M. Economic Development Strategies for Mid-Sized Cities in the Global Knowledge Economy. Available online: https://www.evergreen.ca/downloads/pdfs/2017/14_MSC_RC_Spencer.pdf (accessed on 5 September 2019).
- Henderson, V. Medium size cities. Reg. Sci. Urban Econ. 1997, 27, 583–612. [Google Scholar] [CrossRef]
- Busato, F.; Lazzarin, R.M.; Noro, M. Three years of study of the Urban Heat Island in Padua: Experimental results. Sustain. Cities Soc. 2014, 10, 251–258. [Google Scholar] [CrossRef]
- Rajagopalan, P.; Lim, K.C.; Jamei, E. Urban heat island and wind flow characteristics of a tropical city. Sol. Energy 2014, 107, 159–170. [Google Scholar] [CrossRef]
- Peng, S.; Feng, Z.; Liao, H.; Huang, B.; Peng, S.; Zhou, T. Spatial-temporal pattern of, and driving forces for, urban heat island in China. Ecol. Indic. 2019, 96, 127–132. [Google Scholar] [CrossRef]
- Taiwan Central Weather Bureau. Available online: https://www.cwb.gov.tw/eng/ (accessed on 1 October 2018).
- Sailor, D.J. A review of methods for estimating anthropogenic heat and moisture emissions in the urban environment. Int. J. Climatol. 2011, 31, 189–199. [Google Scholar] [CrossRef]
- Oke, T.R.; Mills, G.; Christen, A.; Voogt, J.A. Introduction. In Urban Climates; Cambridge University Press: Cambridge, UK, 2017; pp. 1–13. [Google Scholar] [CrossRef] [Green Version]
- Taiwan Government Website Open Information. Available online: https://data.gov.tw/en (accessed on 1 November 2018).
- Urban and Rural Development Branch. Construction and Planning Agency Ministry of the Interior, R.O.C. Available online: http://Nsp.Tcd.Gov.Tw/Ngis/ (accessed on 1 January 2019).
- Lin, H.T.; Chen, K.T.; Kuo, H.C. Experimental Analysis on the Urban Heat Island Effect for the Middle Scale Cities in Taiwan. J. Plan. 2001, 28, 47–64. (In Chinese) [Google Scholar] [CrossRef]
- Chen, K.T. The Analysis of Urban Heat Island Effects of the Middle and Small Scale Cities in Taiwan. Master’s Thesis, Department of Architecture, National Cheng Kung University, Tainan, Taiwan, 2000. Available online: https://hdl.handle.net/11296/gr9mt8 (accessed on 1 March 2019). (In Chinese).
- Hsu, H.H. Climate Change in Taiwan: Scientific Report I 2017 (Summary); National Science Council: Taipei, Taiwan, 2017; p. 52. Available online: https://tccip.ncdr.nat.gov.tw/publish_01_one.aspx?bid=20171220135820 (accessed on 1 November 2019). (In Chinese)


| Parameter | 28 July 2018 | 29 July 2018 | |||||||||||
| 10 | 11 | 12 | 13 | 14 | 10 | 11 | 12 | 13 | 14 | ||||
| Temperature (°C) | 32.3 | 32.5 | 33.8 | 34.0 | 34.0 | 33.0 | 33.5 | 34.1 | 35.0 | 34.8 | |||
| Wind velocity (m/s) | 2.1 | 0.9 | 1.1 | 2.0 | 3.1 | 1.4 | 1.3 | 2.5 | 1.6 | 4.6 | |||
| Cloud cover (0–10) | 6 | 8 | 7 | 7 | 7 | 3 | 3 | 3 | 3 | 6 | |||
| Radiation (MJ/m2) | 2.21 | 1.90 | 1.82 | 2.43 | 2.49 | 2.51 | 3.00 | 3.02 | 3.32 | 2.52 | |||
| Rainfall (mm) | 0.0 | 0.0 | 0.0 | 0.0 | 0.0 | 0.0 | 0.0 | 0.0 | 0.0 | 0.0 | |||
| Parameter | 30 July 2018 | 30 July 2018 | 31 July 2018 | ||||||||||
| 10 | 11 | 12 | 13 | 14 | 23 | 24 | 1 | 2 | |||||
| Temperature (°C) | 32.8 | 33.1 | 33.5 | 34.7 | 34.7 | 28.7 | 28.4 | 28.1 | 27.1 | ||||
| Wind velocity (m/s) | 0.8 | 3.0 | 1.7 | 3.7 | 4.2 | 1.1 | 0.7 | 0.9 | 0.4 | ||||
| Cloud cover (0–10) | 4 | 4 | 6 | 2 | 2 | – | – | – | – | ||||
| Radiation (MJ/ m2) | 2.66 | 2.73 | 2.32 | 3.11 | 3.00 | 0.0 | 0.0 | 0.0 | 0.0 | ||||
| Rainfall (mm) | 0.0 | 0.0 | 0.0 | 0.0 | 0.0 | 0.0 | 0.0 | 0.0 | 0.0 | ||||
| Parameter | 16 August 1999 | 16 August 1999 | 17 August 1999 | ||||||||||
| 10 | 11 | 12 | 13 | 14 | 23 | 24 | 1 | 2 | |||||
| Temperature (°C) | 30 | 30.7 | 31.1 | 31.5 | 31.5 | 27.1 | 26.6 | 26.5 | 25.2 | ||||
| Wind velocity (m/s) | 2.7 | 2.3 | 2.8 | 3.9 | 3.7 | 0.7 | 0.3 | 0.9 | 0.3 | ||||
| Cloud cover (0–10) | – | 4 | – | – | 3 | 0 | – | – | 0 | ||||
| Radiation (MJ/m2) | 1.70 | 2.34 | 2.34 | 2.23 | 1.87 | 0.0 | 0.0 | 0.0 | 0.0 | ||||
| Rainfall (mm) | 0.0 | 0.0 | 0.0 | 0.0 | 0.0 | 0.0 | 0.0 | 0.0 | 0.0 | ||||
| Year | (A) Measuring Method | (B) Measuring Time | |||||
|---|---|---|---|---|---|---|---|
| Measuring Accuracy (A1) | Measuring Points (A2) | Measuring Period of Each Route (A3) | Date (Radiation (MJ/m2)) (B1) | Period (B2) | Correction Point (B3) | ||
| 1999 | ±0.5 | 208 | 1.5 h | Daytime | 16 August (1.32) | 12:00–14:00 | 14:00 |
| Midnight | August 17 (1.32) | 2:00–4:00 | 2:00 | ||||
| 2018 | ±0.2 | 87 | 1 h | Daytime | July 28 (1.51) July 29 (1.80) | 13:30–14:30 | 14:00 |
| Midnight | July 31 (1.80) | 1:00–2:00 | 1:30 | ||||
| UHI Difference between 1999 and 2018 (°C) | (A) Consideration of Climate Change Effects | (B) Consideration of the Solar Radiation Difference | Consideration of (A) + (B) | ||||
|---|---|---|---|---|---|---|---|
| Deducting Global Warming (A1) | Deducting Global Warming in Taiwan (A2) | (A1) + B | (A2) + B | ||||
| Period/Values | (−0.11) | (−0.23) | (Daytime: −0.97 Midnight: −1.22) | ||||
| Daytime | ∆Tmax | +3.5 | +3.39 | +3.27 | +2.53 | +2.42 | +2.30 |
| ∆T min | +2.5 | +2.39 | +2.27 | +1.53 | +1.42 | +1.30 | |
| Midnight | ∆T max | +1.1 | +0.99 | +0.87 | −0.12 | −0.23 | −0.35 |
| ∆T min | +2.1 | +1.99 | +1.87 | +0.88 | +0.77 | +0.65 | |
| Time | A.M. 11:00 | 12:00 | P.M. 1:00 | 2:00 |
|---|---|---|---|---|
| Population density | y = −9 × 10⁻⁵x + 34.714 | y = −6 × 10⁻⁵x + 36.112 | y = 0.0004x + 35.129 | y = 0.0003x + 34.951 |
| r = −0.10 | r = −0.10 | r= 0.36 | r= 0.28 | |
| weak correlation | weak correlation | moderate correlation | weak correlation | |
| Artificial area ratio | y = 0.4412x + 34.318 | y =0.2061x+ 35.9075 | y =0.9253x + 34.851 | y = 1.3886x + 34.33 |
| r =0.13 | r = 0.08 | r= 0.34 | r= 0.42 | |
| weak correlation | weak correlation | moderate correlation | moderate correlation | |
| Green area ratio | y = −0.4438x + 34.76 | y =−0.2117x + 36.115 | y =−0.9221x + 35.775 | y = −1.3876x + 35.719 |
| r = −0.10 | r = −0.10 | r=−0.35 | r=−0.41 | |
| weak correlation | weak correlation | moderate correlation | moderate correlation |
| Time | A.M. 11:00 | 12:00 | P.M. 1:00 | 2:00 |
|---|---|---|---|---|
| Chiayi City | y = 0.0073x + 34.303 | y = −0.0077x + 36.335 | y = 0.0189x + 34.71 | y = 0.0146x + 34.9 |
| r = 0.14 | r = −0.17 | r= 0.42 | r = 0.26 | |
| weak correlation | weak correlation) | moderate correlation | weak correlation | |
| Northern area | y = 0.0092x + 34.642 | y = 0.0025x + 36.033 | y = 0.0096x + 35.349 | y = 0.0152x + 34.703 |
| r = 0.14 | r = 0.10 | r = 0.33 | r = 0.28 | |
| weak correlation | weak correlation | moderate correlation | weak correlation | |
| Southern area | y = 0.0152x + 33.683 | y = 0.0106x + 35.362 | y = 0.019x + 34.681 | y = 0.0262x + 34.341 |
| r = 0.24 | r = 0.32 | r = 0.28 | r = 0.39 | |
| weak correlation | moderate correlation | weak correlation | moderate correlation | |
| Western area | y = −0.0057x + 34.697 | y = −0.0294x + 37.204 | y = 0.023x + 34.402 | y = 0.0152x + 35.174 |
| r = −0.14 | r =−0.46 | r= 0.58 | r = 0.30 | |
| weak correlation | moderate correlation | highly correlated | moderate correlation |
| Time | 1999 [24,25] | 2018 (the Present Study) | ||
|---|---|---|---|---|
| Daytime | Midnight | Daytime (2:00 p.m.) | Midnight (0:30 a.m.) | |
| population density | r = 0.67 | r = 0.60 | r = 0.28 | r = 0.27 |
| highly correlated | highly correlated | moderate correlation | weak correlation | |
| Artificial area ratio | r = 0.63 | r = 0.52 | r = 0.42 | r = 0.27 |
| highly correlated | highly correlated | moderate correlation | weak correlation | |
| Green area ratio | r = −0.62 | r = −0.60 | r = −0.41 | r = −0.28 |
| highly correlated | highly correlated | moderate correlation | weak correlation | |
© 2020 by the authors. Licensee MDPI, Basel, Switzerland. This article is an open access article distributed under the terms and conditions of the Creative Commons Attribution (CC BY) license (http://creativecommons.org/licenses/by/4.0/).
Share and Cite
Huang, J.-M.; Chang, H.-Y.; Wang, Y.-S. Spatiotemporal Changes in the Built Environment Characteristics and Urban Heat Island Effect in a Medium-Sized City, Chiayi City, Taiwan. Sustainability 2020, 12, 365. https://0-doi-org.brum.beds.ac.uk/10.3390/su12010365
Huang J-M, Chang H-Y, Wang Y-S. Spatiotemporal Changes in the Built Environment Characteristics and Urban Heat Island Effect in a Medium-Sized City, Chiayi City, Taiwan. Sustainability. 2020; 12(1):365. https://0-doi-org.brum.beds.ac.uk/10.3390/su12010365
Chicago/Turabian StyleHuang, Jou-Man, Heui-Yung Chang, and Yu-Su Wang. 2020. "Spatiotemporal Changes in the Built Environment Characteristics and Urban Heat Island Effect in a Medium-Sized City, Chiayi City, Taiwan" Sustainability 12, no. 1: 365. https://0-doi-org.brum.beds.ac.uk/10.3390/su12010365