Assessing Global Environmental Sustainability Via an Unsupervised Clustering Framework
by
 and
and
Aiyshwariya Paulvannan Kanmani
1, 
Renee Obringer
2,*,
Benjamin Rachunok
1 and
Roshanak Nateghi
1,2 1
School of Industrial Engineering, Purdue University, West Lafayette, IN 47907, USA
2
Environmental and Ecological Engineering, Purdue University, West Lafayette, IN 47907, USA
*
Author to whom correspondence should be addressed.
Sustainability 2020, 12(2), 563; https://0-doi-org.brum.beds.ac.uk/10.3390/su12020563
Submission received: 6 December 2019
/
Revised: 3 January 2020
/
Accepted: 7 January 2020
/
Published: 11 January 2020
Abstract
:The importance of sustainable development has risen in recent years due to the significant number of people affected by lack of access to essential resources as well as the need to prepare for and adapt to intensifying climate change and rapid urbanization. Modeling frameworks capable of effectively assessing and tracking sustainability lie at the heart of creating effective policies to address these issues. Conventional frameworks, such as the Environmental Performance Index (EPI), that support such policies often involve ranking countries based on a weighted sum of a number of relevant environmental metrics. However, the selection and weighing processes are often biased. Moreover, the ranking process fails to provide policymakers with possible avenues to improve their country’s environmental sustainability. This study aimed to address these gaps by proposing a novel data-driven framework to assess the environmental sustainability of countries objectively by leveraging unsupervised learning theory. Specifically, this framework harnesses a clustering technique known as Self-Organized Maps to group countries based on their characteristic environmental performance metrics and track progression in terms of shifts within clusters over time. The results support the hypothesis that the inconsistencies in the EPI calculation can lead to misrepresentations of the relative sustainability of countries over time. The proposed framework, which does not rely on ranking or data transformations, enables countries to make more informed decisions by identifying effective and specific pathways towards improving their environmental sustainability.
1. Introduction
Sustainable development requires an in-depth understanding of the mounting environmental challenges faced by every nation. As the global population continues to grow and critical resources become more scarce, enacting sustainable environmental policies will become increasingly important. Currently, 844 million people lack access to safe drinking water, 2.3 billion people lack access to good sanitation facilities [1], and 9 out of 10 people worldwide breathe polluted air [2]—enhancing environmental performance is thus a path towards improving the basic quality of life for billions of people. Measurements of environmental performance provide benchmarks for understanding the efficacy of sustainability related policies and action plans enacted worldwide [3]. These measurements, or metrics, of environmental performance vary widely—from ecosystem-based measures, such as biodiversity or forest cover, to health-based measures, such as water or air quality. Given the variety of metrics that contribute to the overall sustainability of a country, synthesizing the relative environmental performance of different sectors into a holistic measurement is vital for evaluating the progress of nations in the course of building sustainable futures. Environmental sustainability indices are often the mode of this synthesis, allowing for the measurement of successful policies and interventions designed to reduce environmental impact.
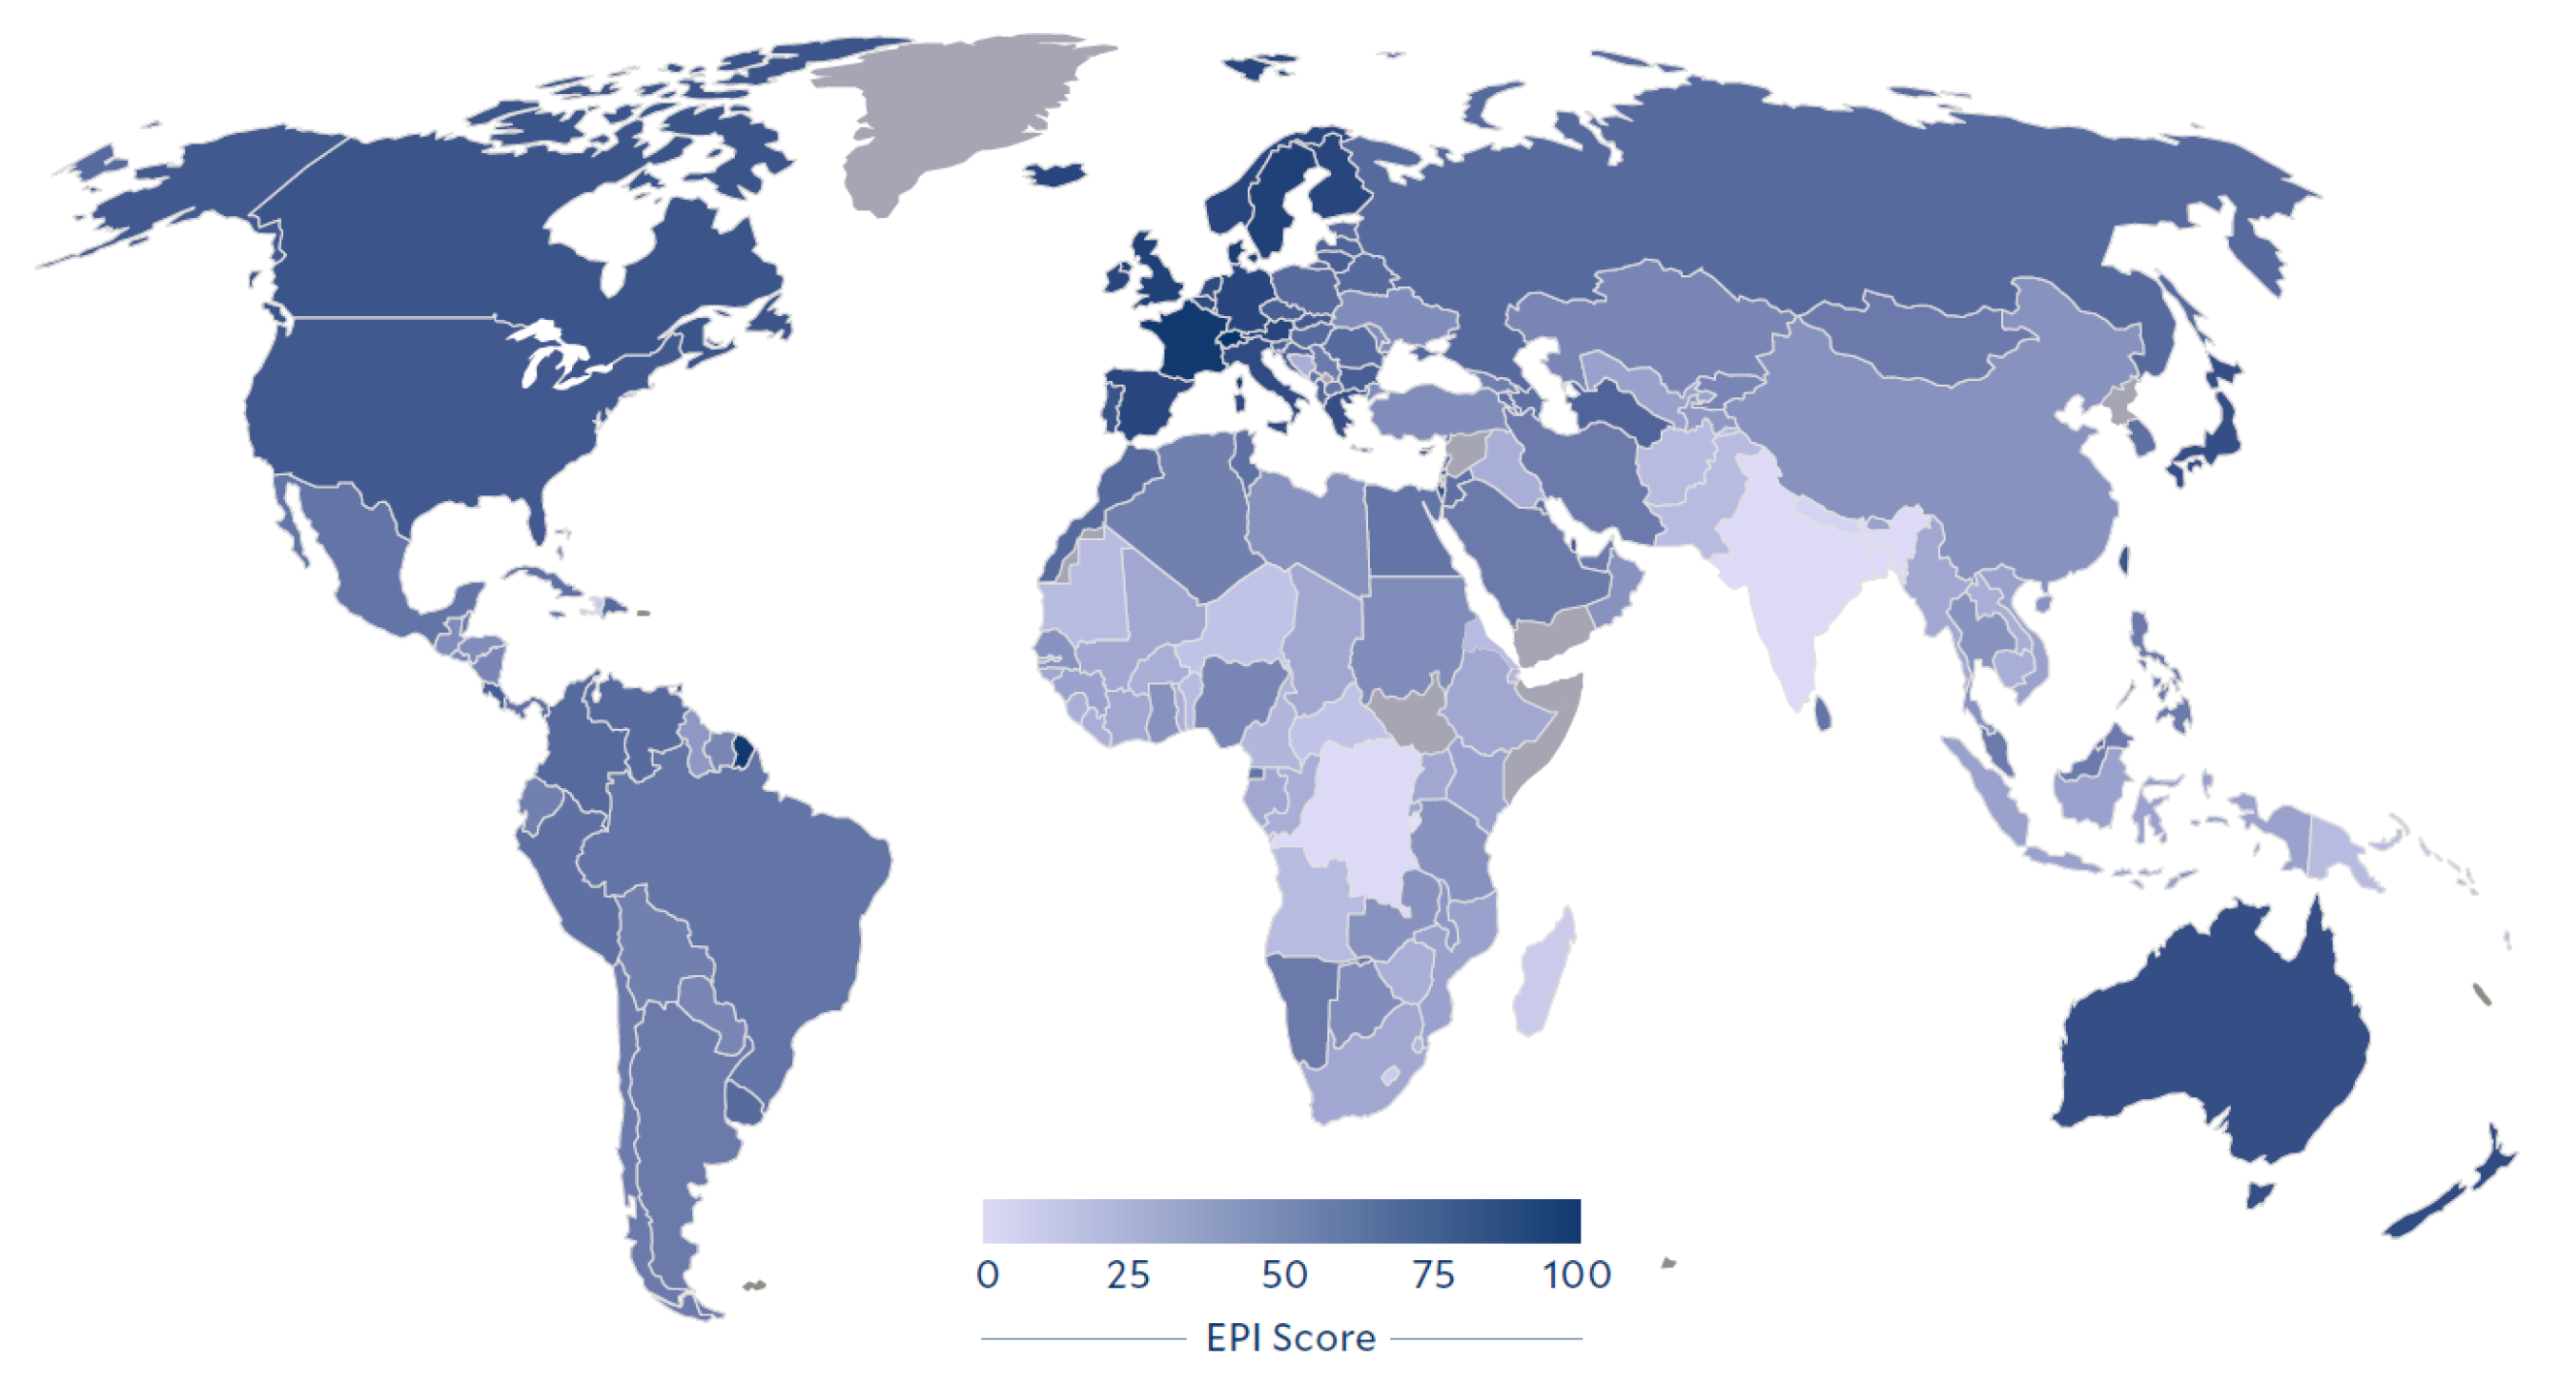
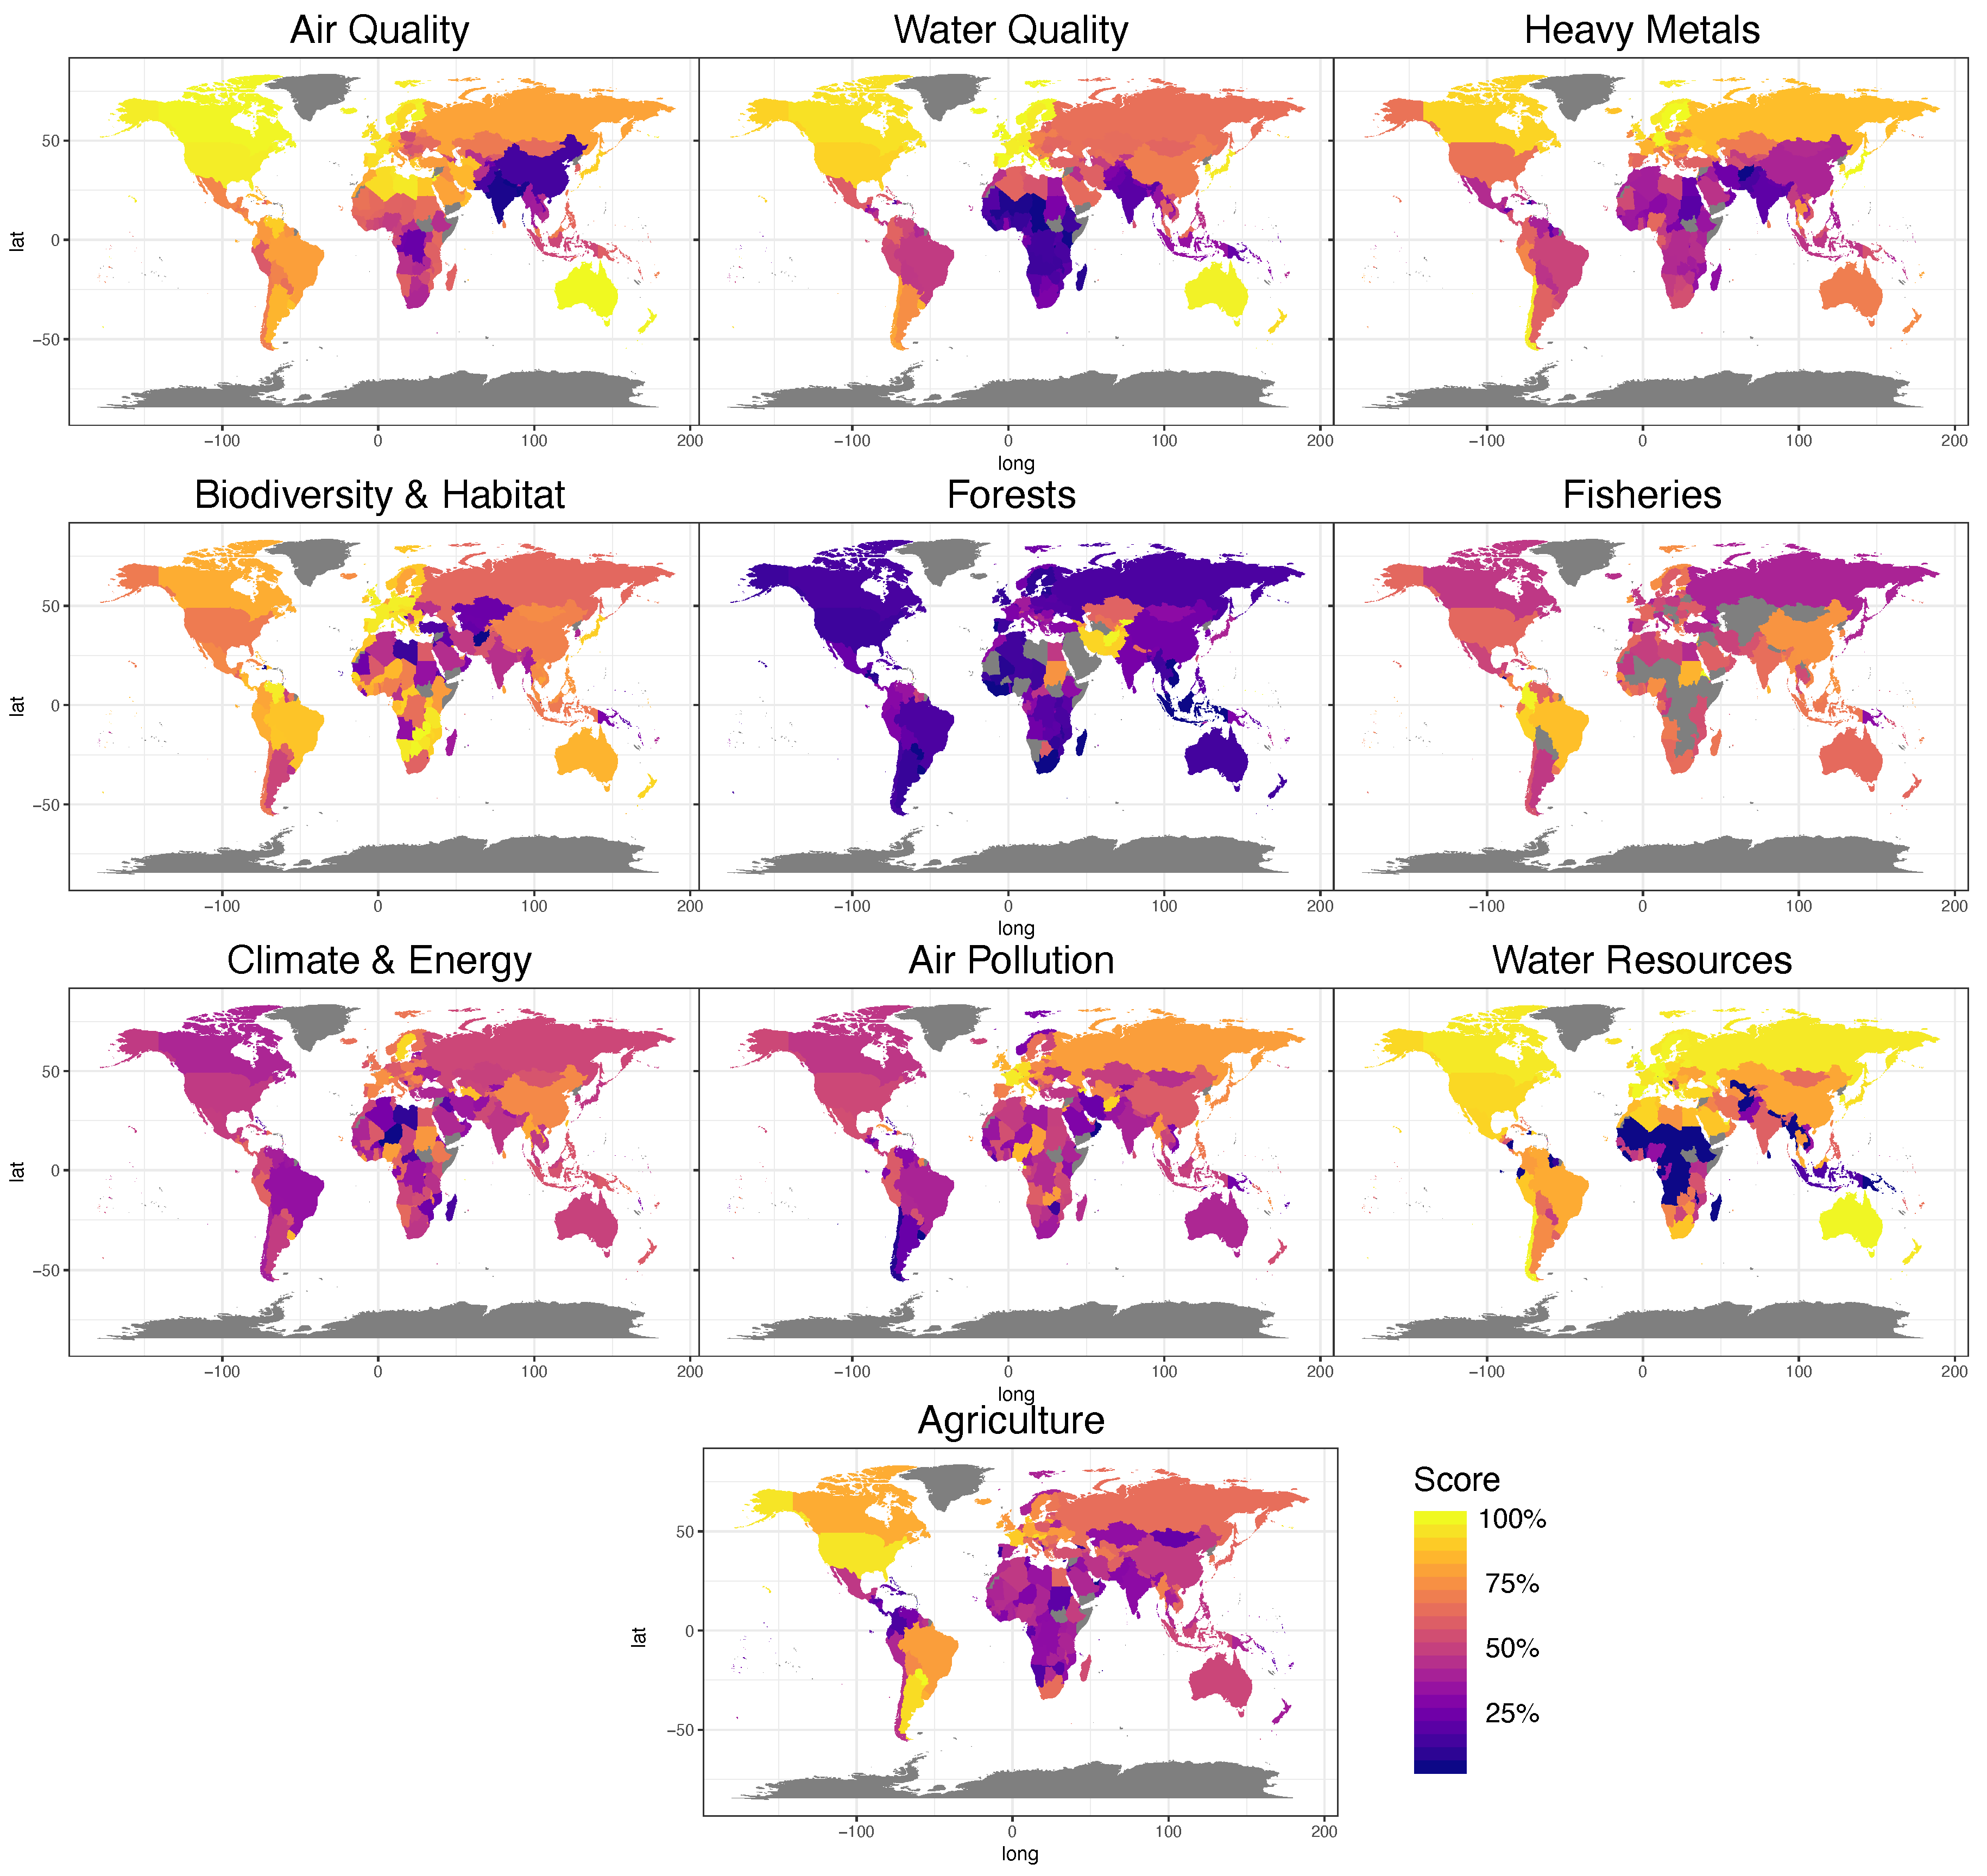
One of the most widely accepted tools for the measurement of environmental impact is the Environmental Performance Index (EPI), a composite index developed in line with the United Nations Millennium Development Goals (MDG) to rank the sustainability of each country based on a variety of metrics [4]. The EPI is calculated on a scale from 0 to 100 as a weighted combination of 10 different aspects of environmental sustainability: air quality, water quality, prevalence of heavy metal exposure, preservation of biodiversity and natural habitats, deforestation rate, exploitation of fisheries, greenhouse gas (GHG) emissions, air pollution, water treatment, and agricultural nitrogen use efficiency [4]. The total EPI score of every country in 2018 is shown in Figure 1, while the distribution within the categories for the same year can be found in Figure 2. The EPI is frequently criticized because of the inherent bias in selecting the variables to be included in the measure as well as the inconsistent weighting processes and the yearly changes in the calculation procedures [5,6]. Despite the increasing amount of credible criticism of the EPI, it continues to be used to monitor and rank environmental sustainability around the world.
In light of these deficiencies, there is significant ongoing work aimed at developing improved modes of assessing environmental sustainability, including the development of new indices. One such index was developed by leveraging structural equation modeling [7] to rank countries based on relative environmental impact [8]. Bradshaw et al. found that their ranks differed from widely used composite indices, such as the EPI, possibly due to the exclusion of human health-related indicators [8]. An additional index was developed by Kuosmanen and Kortelainen based on eco-efficiency scores [9]. The eco-efficiency index provides an alternative to the EPI, but still relies on the selection of indicators and a weighting process that could be different from year to year. Finally, a model referred to as the Sustainability Assessment by Fuzzy Evaluation (SAFE) was developed to create an index to rank the sustainability of countries, which is advantageous in environmental sustainability analyses [10]. Despite these efforts to create better environmental performance indices, there remains a reliance on weighting and aggregation.
The weighting and aggregation process in the EPI, as well as other composite indices, is often criticized for being biased and potentially under-weighting important variables due to lack of data [5]. As such, there is significant work being done to improve the weighting process. For example, many authors have leveraged data envelopment analysis (DEA), which selects weights based on an optimization scheme [11]. In one study, for example, DEA was used to develop a composite index based on the EPI indicators [12]. This resulted in slightly different rankings than the EPI, as well as being more interpretable from a decision-making standpoint. In another study, Bi et al. leveraged DEA to analyze the environmental performance of the Chinese industrial sector at the national scale [13]. Nonetheless, these weighting and aggregation methods still depend on the analyzer’s choice of method, potentially introducing bias. To reduce this bias, Gan et al. developed a cyclical process for selecting the optimal weighting and aggregation procedure with limited user intervention [14]. Although these advancements in selecting weighting and aggregation procedures have greatly reduced the inherent biases in composite indices used for evaluating environmental performance, the indicators considered within the index play an important role in the final results, making sustainability indicators another crucial area for research.
As mentioned above, indicator selection process of the EPI and other composite indices tends to be somewhat arbitrary, with potential for introducing bias [15]. To counteract this arbitrariness, researchers are working to improve the selection process. For example, several authors have proposed classifying indicators based on the Driver-Pressure-State-Impact-Response (DPSIR) [16] methodology, which provides justification for the inclusion of various indicators [17,18]. Other work has proposed a more computational approach based on the Entangled Economy Model [19]. By applying a version of the Entangled Economy Model, Vasquez et al. were able to determine the optimal sustainability indicators for a given study area without relying on expert opinions [20]. Ultimately, this model helped reduce bias introduced via the indicator selection process; however, most models still rely on ranking countries based on their environmental sustainability. Ranking countries creates difficulties for policymakers, as the rankings may change from year to year with or without improvement, making it difficult to determine potential paths forward.
Overall, the literature on global sustainability contains a number of studies outlining the problems associated with composite indices, such as the EPI, as well solutions to those problems. However, the solutions have often fallen short in terms of reducing the inherent biases of composite indices. For example, many authors have pointed to the weighting process as being a source of bias in the EPI and other composite indices. However, solutions to this weighting problem often still rely on weighting processes, albeit ones that reduce the chance for human-introduced bias via computational algorithms. Similarly, while the methodologies based on ranking lead to an easily grasped “big picture” of global sustainability, they fail to provide specific areas of environmental performance in which countries need to focus. With this in mind, this study addressed the gaps surrounding the weighting and ranking processes. First, the proposed framework does not weight indicators based on any preconceived notions of importance. Secondly, the framework does not rank countries in terms of environmental sustainability, rather clusters countries based on their similarities. Finally, through the proposed framework, the authors seek to provide specific pathways towards improving environmental performance by showing the exact indicators in which a country is doing poorly, rather than a relative rank that combines all indicators.
In particular, in this paper, we aim to leverage recent advancements in unsupervised learning, namely Self-Organized Maps (SOM) [21], to create a data-driven framework for clustering and tracking countries’ respective environmental performance based on the indicators used in the EPI analysis. Through the use of SOM, we extract the inherent relational trends within the environmental performance data of all countries worldwide, resulting in the determination of the relative similarity of countries rather than an explicit ranking. In this way, we circumvent problems faced with the arbitrary assignment of weights and ranking countries, ultimately providing a more objective tool for policymakers who are aiming to evaluate their environmental sustainability. It is hypothesized that any discrepancies between the EPI rankings and the results from our data-driven framework would demonstrate that such composite indices, especially those that rely on ranking countries, may be misleading when used for measuring countries’ environmental performance over time. This work not only represents a novel method to evaluate environmental performance, but also presents a generalizable framework for objectively assessing and tracking environmental performance.
The structure of the paper is as follows. First, we discuss the data and methods, including detailing the specific algorithm (Self-Organized Maps) and generalized modeling framework developed as part of this study. Then, we discuss the results of applying the framework before delving into a comparison between the EPI findings and the results of the proposed framework. Finally, we conclude the paper and discuss policy implications.
2. Data and Methods
In this section, we discuss the data used in this study, including the collection and pre-processing procedures. Then, we discuss the methodology, including the proposed generalized framework and the specific algorithm leveraged within the framework.
2.1. Data Description
The goal of this study was to provide a framework to analyze changes in environmental sustainability that is more practical and less biased than the EPI. To this end, we selected indicators that are also used to determine the EPI ranking (i.e., the variables that are used to calculated the EPI rankings were also considered in this study). However, it is important to note that the framework is generalizable, such that the indicators can be selected to match the study purpose (e.g., a study interested in the status of public health does not need to include all the indicators used here in order to make use of the framework). Initially, all indicators that fell into the ten EPI categories (i.e., Air Quality, Water Quality, Heavy Metals, Biodiversity and Habitat, Forests, Fisheries, Climate and Energy, Air Pollution, Water Resources, and Agriculture [4]) were considered. The global distribution of each category in 2018 is shown in Figure 2. However, to reduce the bias within the modeling framework, not all of the indicators within these initial categories were selected for the final model. For example, in 44 of the 180 countries considered, there were no data for the Fisheries category. Moreover, not every country is associated with fisheries and their related environmental sustainability issues. In this sense, an assessment of all countries based on the Fisheries indicators would ultimately be misleading. Similarly, the Biodiversity and Habitat category includes indicators that are weighted by biome or species—even if the biome or species is not found in all the countries. Therefore, to reduce the bias associated with the Biodiversity and Habitat category, the indicators were removed. One of the other sources of bias within the original indicators is found in the Water Resources category, which details the percentage of wastewater that is treated in a given country. This indicator, unfortunately, only focuses on artificial wastewater treatment, meaning that countries with more natural-based treatment will not perform well in this category. Since the framework focuses on all 180 countries, these indicators were removed. Finally, the original EPI includes multiple transformed indicators. In an effort to maintain the integrity of the raw data, any indicator that required transformation was not included in this study. This allowed us to demonstrate specific pathways toward improved environmental sustainability based on the available data. Ultimately, ten indicators were selected for the final dataset, as shown in Table 1.
Prior to starting the analysis, the indicators listed in Table 1 were normalized and scaled. Every indicator was normalized by population, with the exception of tree cover lost (FOR in the table), which was normalized by area. Each indicator was then scaled, such that they fell between 0 and 1, with lower values indicating better performance. Finally, all indicators were collected for each country on an annual basis between 2001 and 2010.
2.2. Methodology
To reduce the bias common to many composite indices (see Section 1) and provide a more transparent evaluation of environmental sustainability, we propose a framework based on statistical learning theory. In particular, the framework leverages unsupervised learning (e.g., clustering analysis) to evaluate patterns in the data and group countries based on their performance in a variety of indicators. The advantages of this framework include: (i) it is generalizable in nature, such that the indicators can be completely changed to match the purpose of the study (e.g., adding more human health indicators to evaluate the public health status around the world); (ii) there is no weighting or transforming of indicators, which leads to a more transparent evaluation of environmental sustainability; and (iii) the results are interpretable without needing to rank countries, which ultimately allows countries to enact policies based on specific indicators, rather than an overall rank.
The general outline of our environmental modeling framework contains three steps: (1) data collection and pre-processing; (2) model training; and (3) inferencing and analysis. The first step was to collect the indicator data for the time period (i.e., 2001–2010) and normalize and scale the data as discussed above.
Following the data collection, the model was trained in an unsupervised way, after which it was used to obtain the cluster to which each country belonged between the years 2001 and 2010. Unsupervised learning is a branch of statistical learning theory. In unsupervised learning, the objective is not predicting an outcome variable of interest, but rather to understand the underlying patterns and structure of the data [27]. For example, if one has a dataset of n observations with a probability density of , an unsupervised learning technique would directly infer the properties of X without prior knowledge of the “correct answer” [27]. Often, the datasets used in unsupervised learning learning have many dimensions, which makes estimating the density difficult. To get around this high-dimensionality problem, many unsupervised algorithms work to reduce the data into a lower dimensional space [27]. Ultimately, this dimensionality reduction finds any associations between variables and whether these variables may be considered as functions of a smaller subset of variables, thus limiting the number of dimensions. Finally, there is no loss function by which to measure predictive accuracy in unsupervised learning. However, it is possible to draw inferences from the patterns that emerge in the data.
Within the category of unsupervised learning, there are many algorithms, including association rules, clustering techniques, and principal component analysis [27]. In particular, clustering techniques are among the most well-known unsupervised learning methods [28], and lend themselves easily to interpretation. In this paper, we implemented a clustering technique known as Self-Organizing Maps.
Self-Organizing Maps (SOM) is a clustering technique that leverages artificial neural networks cluster data based on the underlying patterns and structure [21]. At a high level, the SOM algorithm performs a vector quantization, which reduces high-dimensional vectors into a two-dimensional space [29]. A key feature of SOM is the preservation of the relative distance between vectors in the high-dimensional space after mapping them to the two-dimensional space [21]. This two-dimensional space is represented by a neural network which is a nonlinear statistical learning model originally inspired by the human brain. As such, the model contains interconnected “neurons” or nodes. These nodes are the means through which the algorithm “learns” the weights associated with the various indicators [27].
In the proposed framework, the SOM algorithm is leveraged to reduce the dimension of the input variables while preserving their underlying topology [21]. The result of this dimensionality reduction is a mapping of each data point (here, each country is represented by a data point) to a node—shown as hexagons in Figure 3. Each node contains one or more data points based on their similarity within the underlying parameter space (i.e., each node contains data points which perform similarly in the various environmental indicators). This allows users to determine which data points are similar (i.e., in the same node) and why they are similar. The algorithm steps are described below, in Algorithm 1.
In this algorithm, training weights are initially assigned randomly to each node (). For each node, x, in the set of nodes, X, nearest node, is found based on euclidean distance. Based on the nearest node, the weights corresponding with the ith node are updated according to the following equation
where is the change in weights, refers to the learning rate (see Equation (2)), refers to the topological neighborhood function (see Equation (3)), and is the node in question. The learning rate, which is the amount the weights are updated based on the iteration, is shown below:
where t refers to iteration number. The topological neighborhood function is responsible for maintaining the structure of the input space. It is mathematically represented below:
where refers to the winning node, refers to the lateral distance between nodes (i.e., ), and refers to the neighborhood size (i.e., .

In summary, each vector in the input space is assigned to a node—the winning node—in the neural network based on its distance to other vectors (i.e., the weight vector of the node). The weights of the nodes in the neural network are continuously updated based on the relative distances between all elements in the input space associated with that specific node. In the context of this proposed framework, the raw environmental data for each country is mapped to a two-dimensional neural network such that the relative distance between each node in the network approximates the distance between the countries’ environmental performance within it. As such, we are able to look for the emergent similarities in the environmental profiles of the countries, and identify changes in the countries environmental performance by their cluster membership. For more information on the SOM model process, see Figures S1 and S2.
Unlike supervised learning, the accuracy of the SOM model output cannot be measured using a loss function as the goal is not prediction, but rather elucidating patterns in the data [27]. Since the output of SOM is a map of nodes, it is possible to visualize the clusters and make inferences based on the patterns that emerge. One such way to view the results is to evaluate the clusters on a continent basis. In this sense, one can test the level of heterogeneity in environmental sustainability within a continent. Another way we analyzed the results was by comparing the nodes of specific countries in the different years of the study (i.e., 2001–2010). Through this process, it was possible to determine if a country made progress on a given indicator over the decade. Finally, the results from the proposed framework can be compared to the EPI. This was done by comparing the node location of a given country to their EPI rank. It is possible that a country has a low EPI rank, but is in one of the nodes that represent relatively better environmental performance. The SOM algorithm has been implemented in a variety of applications from ecological to urban systems [30,31,32,33,34,35]. However, the framework presented here is one of the first studies, to our knowledge, in which SOM has been implemented as part of a larger framework aimed at evaluating environmental sustainability, rather than simply being used to classify the evaluations of other indices.
3. Results and Discussion
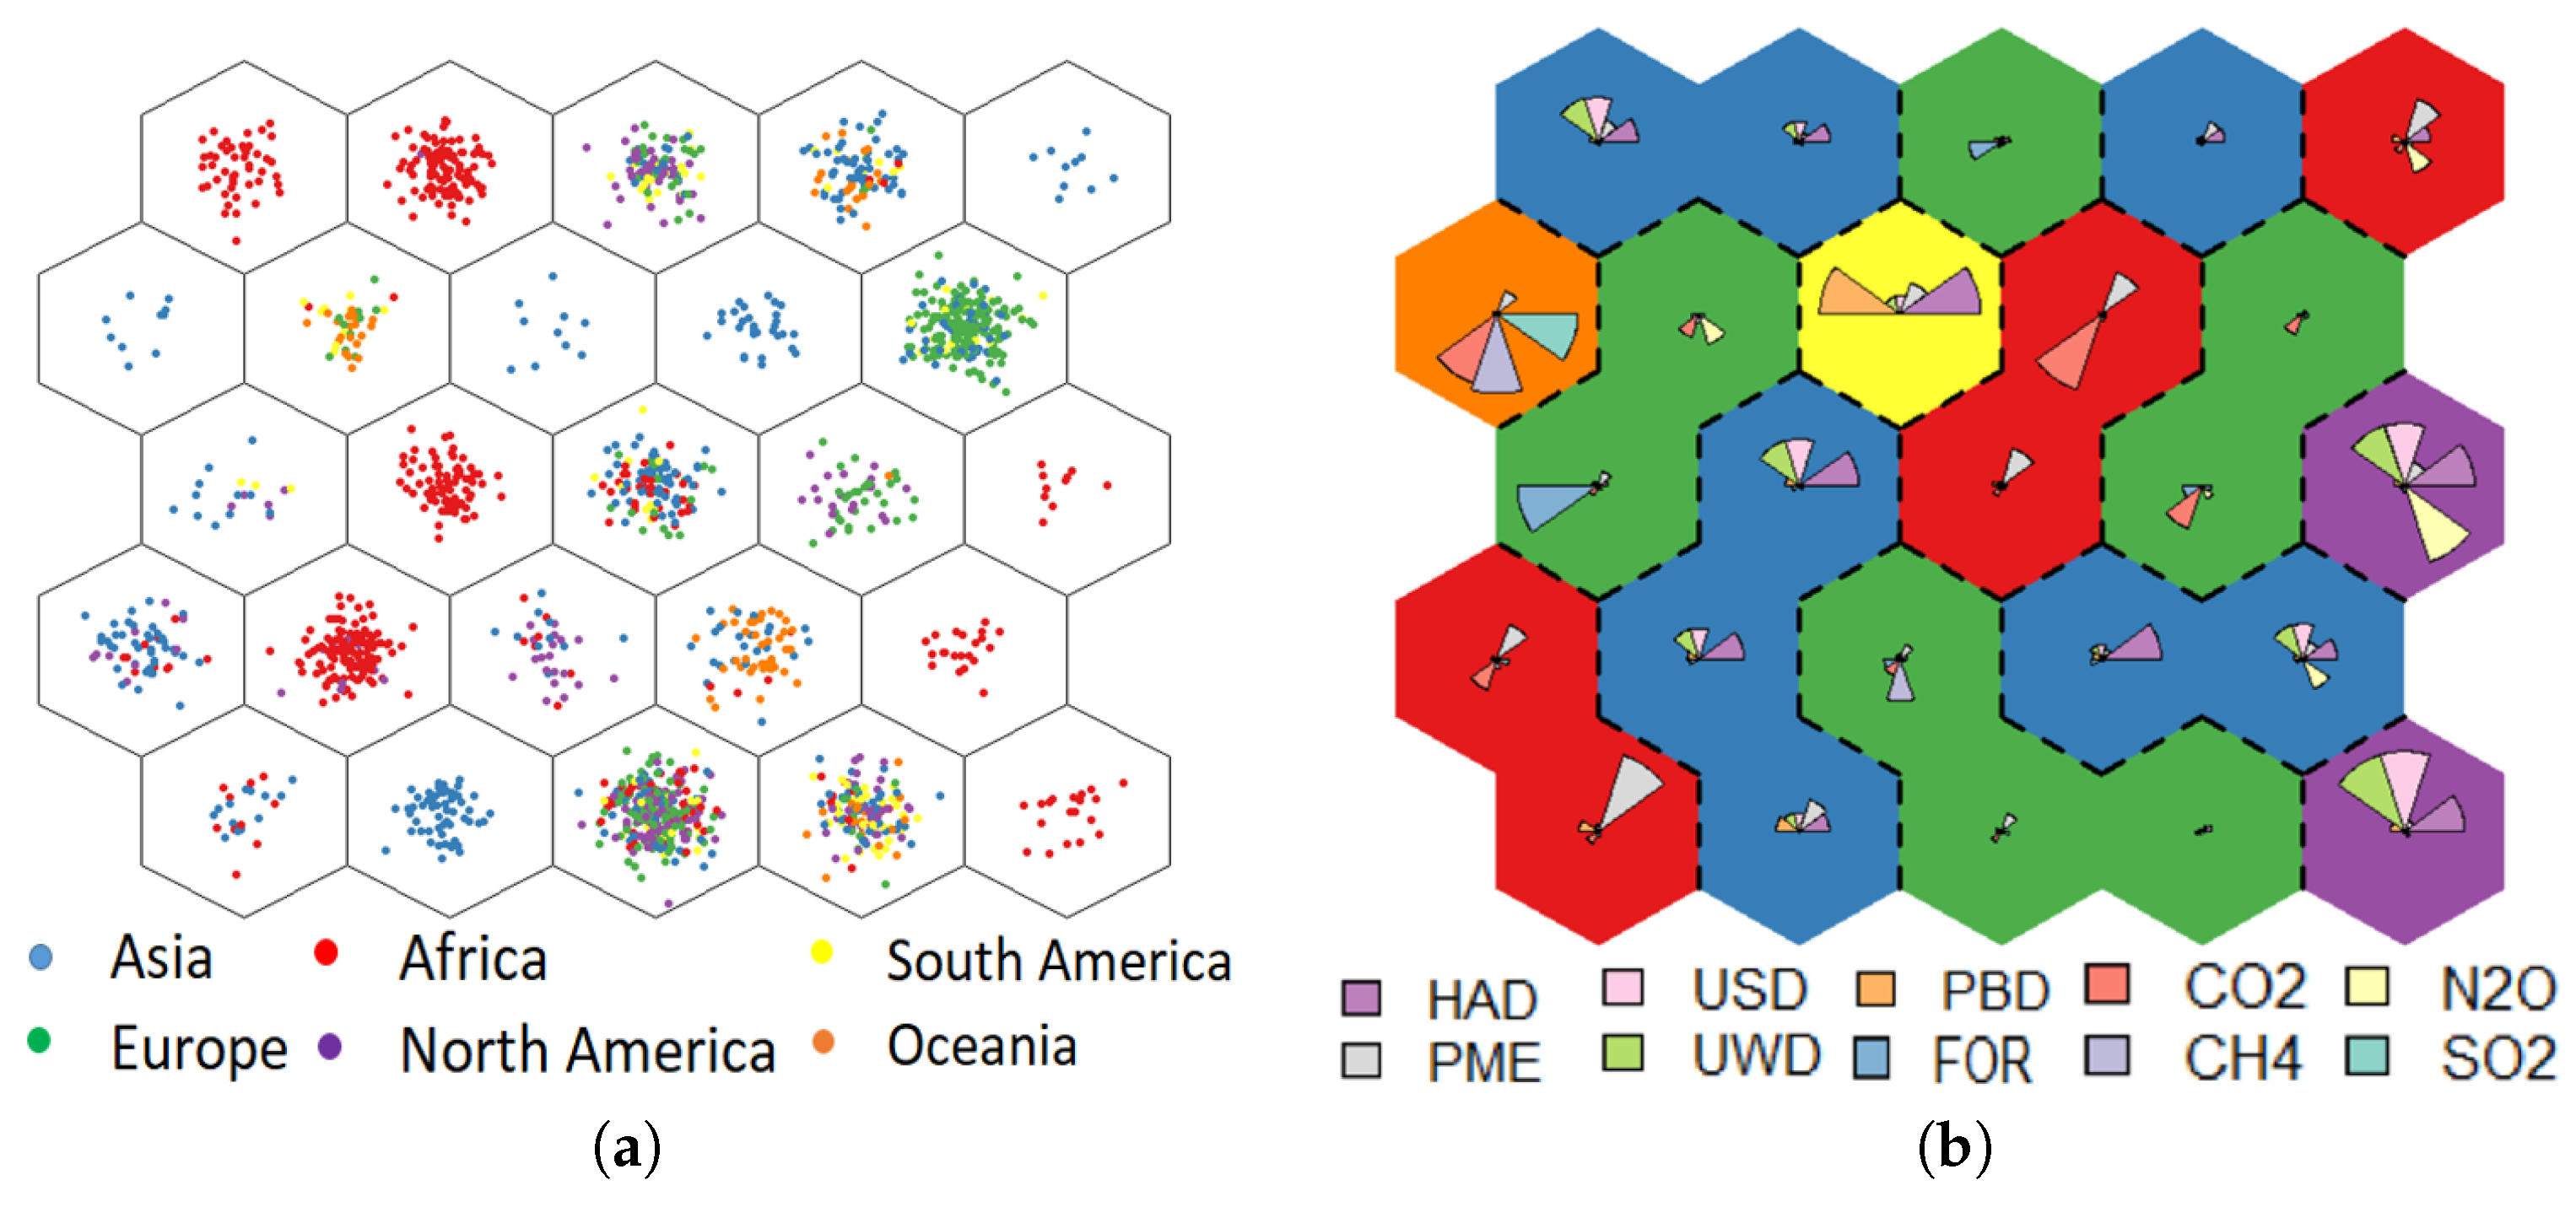
The output of the SOM algorithm is a map of nodes, which are directly related to the environmental performance data considered in the study. Each country is categorized to a node based on their performance within all the indicators. In this sense, the countries are clustered based on their similar environmental performance. The results of the modeling framework are shown in Figure 3a,b. Each hexagon in Figure 3 represents one of the SOM nodes. Accordingly, countries assigned to each node represent those which have similar performance within the various indicators. Analyzing the distribution of countries across the SOM nodes and categorizing them by their continent, there are clear trends in the environmental performance (see Figure 3a). Countries in Africa (red points), for example, tend to cluster by their environmental performance as well as countries in Europe (green points). Within each cluster, average environmental performance as measured by each indicator is shown in Figure 3b. Larger wedges indicate higher values of a given indicator, consequently indicating poorer environmental performance. In this sense, one can determine the relative environmental performance of each cluster based on the size of the wedges. This results in a snapshot of relative environmental performance, and provides a clear pathway for determining which aspects drive inclusion in a cluster.
A key benefit of this methodology is the ability for decision makers and policymakers to evaluate how one country performs relative to another and to determine the specific indicators in which a country is not performing well. For example, a country located in the bottom right node in Figure 3b would not be performing well in terms of access to clean drinking water (UWD) and sanitation facilities (USD), as indicated by the relatively high magnitude of those wedges. Policymakers, therefore, would know to focus on drinking water and sanitation to improve their overall environmental performance, as opposed to trying to focus on all aspects of sustainability at once. Additionally, it can be used to assess not only the current state of environmental sustainability, but also the level of improvement or deterioration over time. This framework, therefore, circumvents the biases inherent in weighting and ranking processes raised in Section 1, and allows for assessing the trajectory of countries’ environmental performances relative to one another. A schematic of how the method detailed above can be used to determine progression of the environmental sustainability in a given country can be seen in Figure 4.
To determine a country’s improvement over time, both with regard to specific indicators and overall environmental performance, one can use Figure 4. For example, if a country is located in the node of interest, circled in yellow, it tends to have lower life expectancy due to the use of house solid fuels (HAD), poor sanitation conditions (USD), and poor drinking water conditions (UWD). If that same country, in later years, shifts to a node circled in red, it would be considered a negative progression, as the indicators of interest (i.e., HAD, USD, and UWD) are significantly larger in those nodes than the original node. On the other hand, if the country shifts to the node circled in green, it would be a positive progression, as the magnitude of the indicators is smaller than the original node. Finally, if a country shifts to the node circled in blue, it would be difficult to track the progression (i.e., the progression is incomparable), as the country now has new challenges, namely higher CO2 emissions (CO2) and lower life expectancy due to particulate matter emissions (PME).
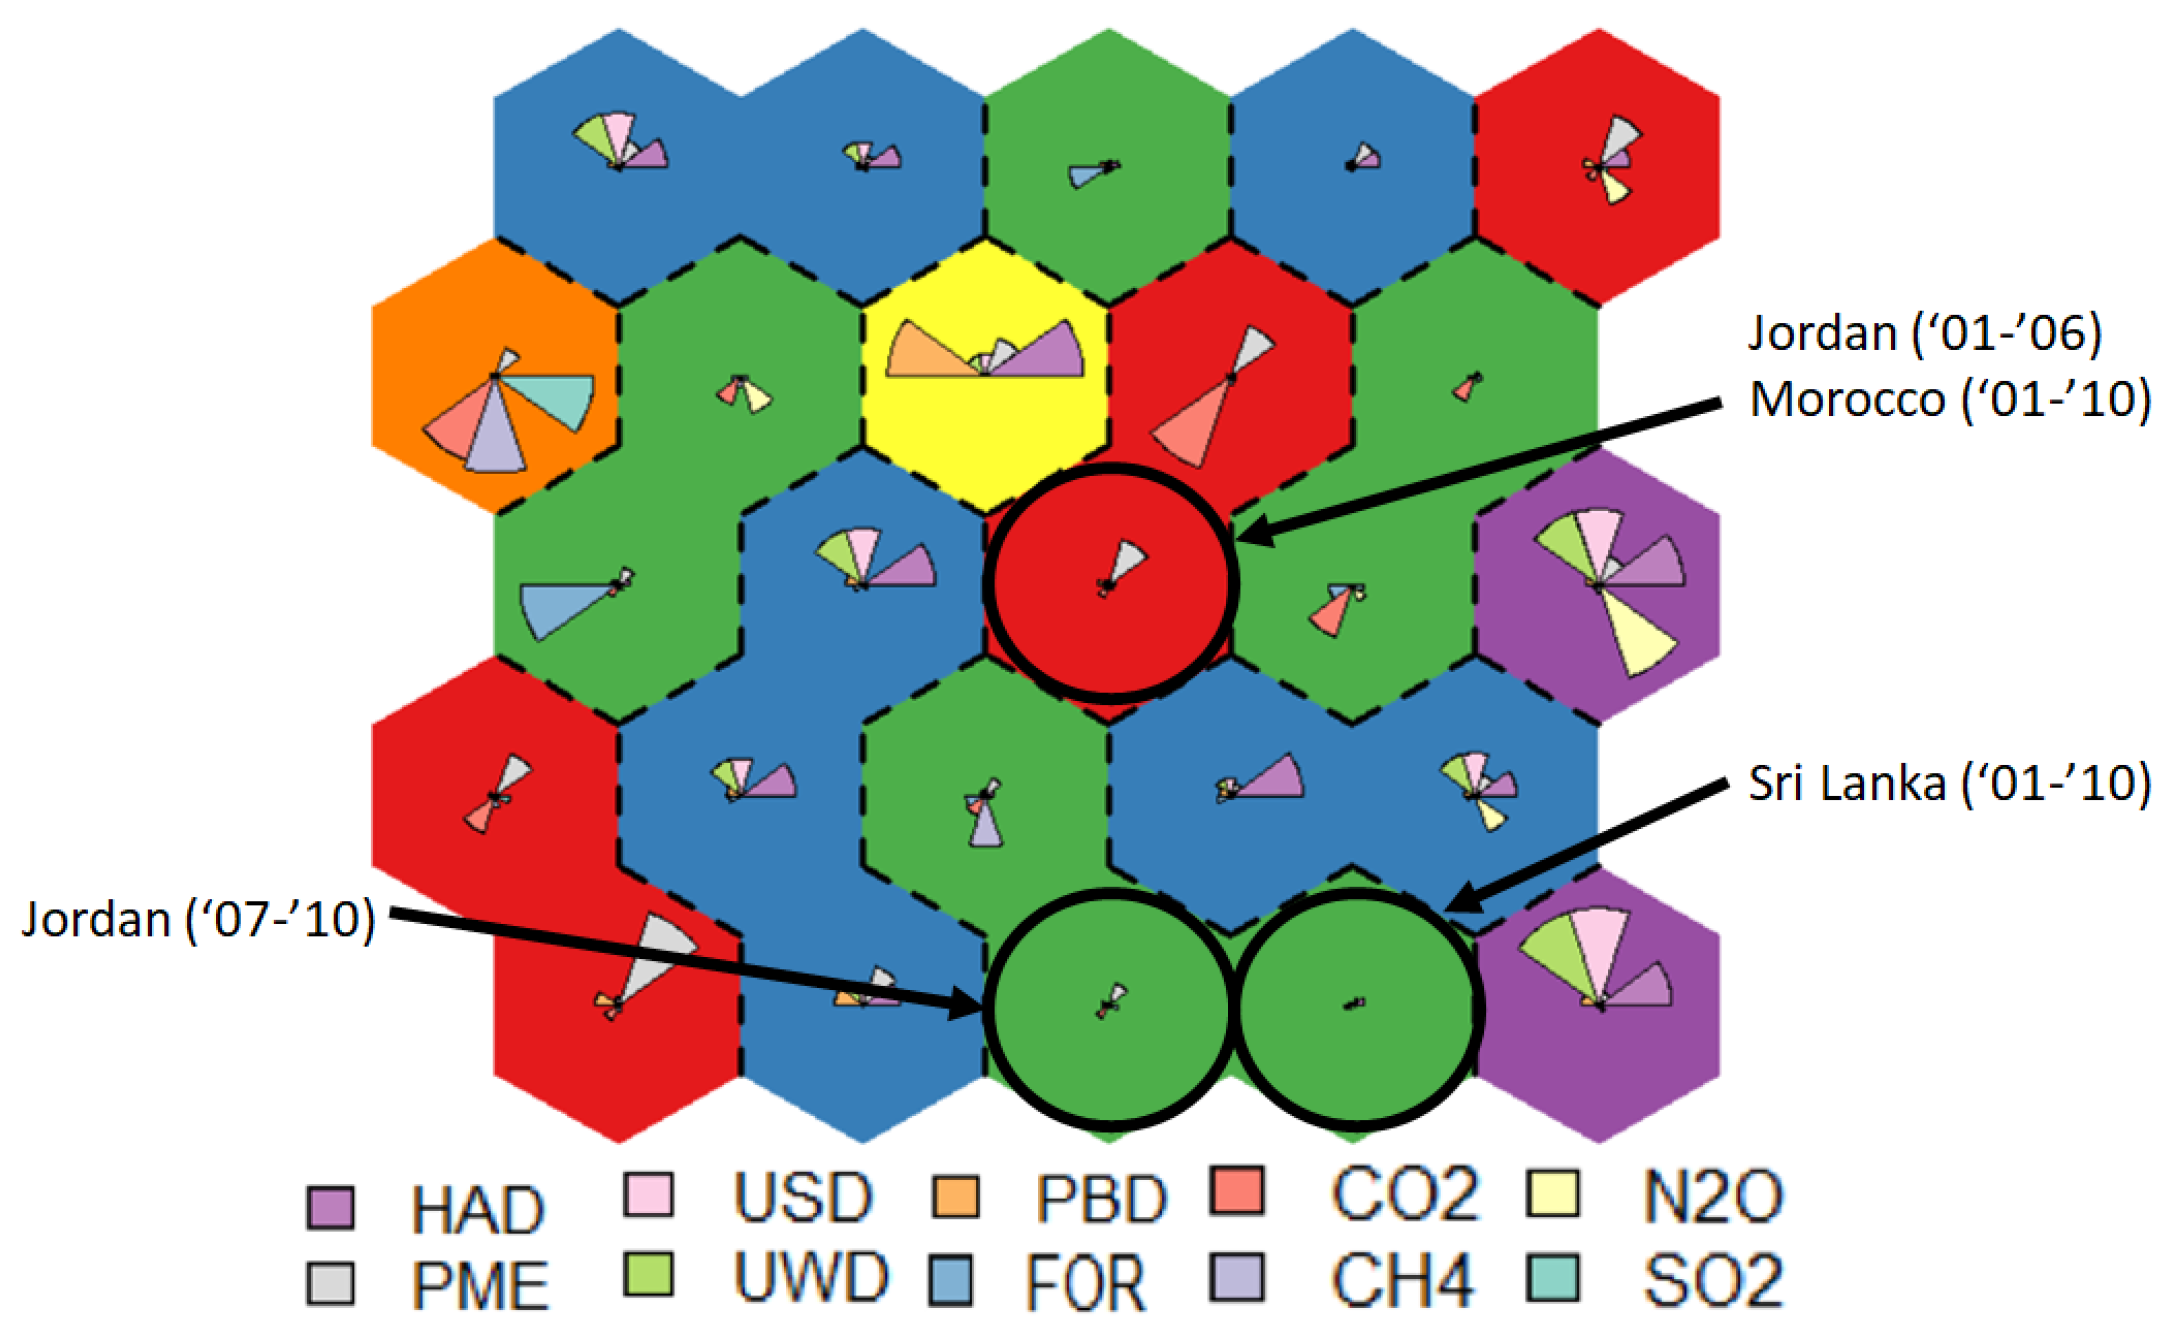
This way of evaluating changes in environmental sustainability has significant implications for countries working on developing policies aimed at improving sustainability. If one considers the countries of Jordan, Morocco, and Sri Lanka, for example, we see different progressions in the proposed framework than those of the EPI. In the EPI, Jordan was ranked 64th in 2006 and dropped to 70th in 2008, an apparent deterioration in ranking. However, as demonstrated in Figure 5, Jordan actually improved its environmental sustainability between 2006 and 2008. Specifically, Jordan spent 2001–2006 in a node represented by lower life expectancy due to particulate matter emissions (PME), but, from 2007 to 2010, the country shifted to a node with a lower PME magnitude—indicating a positive shift in overall environmental sustainability. By following the EPI ranking, the policymakers in Jordan may have assumed that their decisions between 2006 and 2008 led to a deterioration in environmental sustainability, when, in fact, the inconsistent nature of the weighting process involved in the EPI rankings is a likely cause. Similar to Jordan, Morocco dropped in rank between 2006 and 2008, falling from 68th to 72nd. However, in the method presented here, Morocco saw no change over the years; instead, they remained stagnant in the same node that Jordan was in from 2001 to 2006. This presents an opportunity for Morocco, should they wish to improve their environmental sustainability, since Jordan would make an optimal model of a country that was in their node and was able to progress to a relatively better node. Finally, between 2006 and 2008, Sri Lanka was considered to have improved in environmental sustainability, rising from 67th to 50th. The proposed method, on the other hand, shows no change for Sri Lanka over the 10-year period studied. In fact, Sri Lanka remained in one of the nodes that represent relatively better environmental sustainability for the entire period. In this sense, Sri Lanka’s increase in EPI rank does not necessarily imply an improvement on their part, but more likely the continuation of successful policies while other countries dropped. For the node locations of all 180 countries over the 10-year period, see Table S1.
4. Conclusions
The purpose of this study was to develop a framework to better assess environmental sustainability worldwide. Many of the current indices, including the Environmental Performance Index (EPI), rely on somewhat arbitrary data weighting and transformation processes that may change from year to year. This practice introduces biases to the final outcomes. Moreover, most indices present the results as ordinal rankings, which only demonstrates environmental performance relative to other countries. The framework presented here aimed to circumvent these shortcomings (i.e., weighting, transformations, and ranking) by leveraging an unsupervised data clustering technique known as Self-Organized Maps to extract the inherent patterns present in the environmental performance data. In contrast with traditional ranking measures such as the EPI, the proposed framework for analyzing the environmental performance of countries does not use arbitrary rankings or data transformations and instead constructs a data-driven representation of the underlying similarity between the respective environmental performance of countries. The results demonstrate significant discrepancies between the EPI rankings and cluster membership. For example, the country of Jordan dropped in EPI rank over time; however, our analysis showed that Jordan had a positive progression through the clusters, based on key improvements in a few critical environmental performance indicators. This is indicative that the EPI might not be the optimal measure of environmental sustainability, especially given the criticisms of the weighting and transformation processes.
The proposed framework can be utilized by decision-makers and policymakers to not only determine their level of environmental sustainability, but also which particular indicators they need to work on (if any). This ability to see which indicators are impacting their environmental performance is crucial to using the framework to enact real change, and something that ranked indices do not provide. Additionally, the nature of the clustering map provides the opportunity for sustainability role models, so to speak. For example, Jordan and Morocco were initially in the same cluster, but Jordan improved over time and eventually moved into a relatively better cluster. In this sense, Morocco could use Jordan as a role model for developing and implementing policies. Finally, the presented framework was developed for the purposes of environmental sustainability and included indicators that were relevant to that topic. These indicators, however, are interchangeable depending on the application, making the framework itself generalizable across a variety of different disciplines and research areas. In conclusion, the framework presented here evaluates environmental performance in a way that is both practical for policymakers working to improve environmental sustainability in their country, as well as researchers and practitioners interested in objectively evaluating environmental performance.
Supplementary Materials
The following are available online at https://0-www-mdpi-com.brum.beds.ac.uk/2071-1050/12/2/563/s1, Figure S1: SOM Model Training and Convergence, Figure S2: Hierarchical clustering evaluation, Figure S3: Node location reference numbers, Table S1: List of countries and their respective node locations from 2001 to 2010.
Author Contributions
Conceptualization, A.P.K.; methodology, A.P.K.; software, A.P.K.; validation, A.P.K.; formal analysis, A.P.K.; investigation, A.P.K.; resources, A.P.K. and R.N.; data curation, A.P.K.; writing—original draft preparation, A.P.K., R.O., and B.R.; writing—review and editing, A.P.K., R.O., B.R., and R.N.; visualization, A.P.K.; supervision, R.N.; project administration, R.N.; and funding acquisition, R.N. All authors have read and agreed to the published version of the manuscript.
Funding
This research was funded by the Purdue Center for the Environment and NSF grants Nos. 1826161 and 1832688. The authors would also like to acknowledge support from the Graduate School at Purdue University and the Bilsland Dissertation Fellowship.
Conflicts of Interest
The authors declare no conflict of interest.
References
- World Health Organization; UNICEF. Progress on Drinking Water, Sanitation and Hygiene: 2017 Update and SDG Baselines; World Health Organization: Geneva, Switzerland, 2017. [Google Scholar]
- World Health Organization. 9 out of 10 People Worldwide Breathe Polluted Air; World Health Organization: Geneva, Switzerland, 2018. [Google Scholar]
- Marchese, D.; Reynolds, E.; Bates, M.E.; Morgan, H.; Clark, S.S.; Linkov, I. Resilience and sustainability: Similarities and differences in environmental management applications. Sci. Total Environ. 2018, 613, 1275–1283. [Google Scholar] [CrossRef]
- Wending, Z.A.; Emerson, J.W.; Etsy, D.C.; Levy, M.A.; de Sherbinin, A. 2018 Environmental Performance Index; Technical Report; Yale Center for Environmental Law & Policy: New Haven, CT, USA, 2018. [Google Scholar]
- Böhringer, C.; Jochem, P.E. Measuring the immeasurable-A survey of sustainability indices. Ecol. Econ. 2007, 63, 1–8. [Google Scholar] [CrossRef] [Green Version]
- Barnett, J.; Lambert, S.; Fry, I. The hazards of indicators: Insights from the environmental vulnerability index. Ann. Assoc. Am. Geogr. 2008, 98, 102–119. [Google Scholar] [CrossRef]
- Kaplan, D. Structural Equation Modeling: Foundations and Extensions; Sage Publications: Thousand Oaks, CA, USA, 2008; Volume 10. [Google Scholar]
- Bradshaw, C.J.; Giam, X.; Sodhi, N.S. Evaluating the relative environmental impact of countries. PLoS ONE 2010, 5. [Google Scholar] [CrossRef] [PubMed] [Green Version]
- Kortelainen, M. Dynamic environmental performance analysis: A Malmquist index approach. Ecol. Econ. 2008, 64, 701–715. [Google Scholar] [CrossRef]
- Phillis, Y.A.; Grigoroudis, E.; Kouikoglou, V.S. Sustainability ranking and improvement of countries. Ecol. Econ. 2011, 70, 542–553. [Google Scholar] [CrossRef]
- Charnes, A.; Cooper, W.W.; Rhodes, E. Measuring the efficiency of decision making units. Eur. J. Oper. Res. 1978, 2, 429–444. [Google Scholar] [CrossRef]
- Zanella, A.; Camanho, A.S.; Dias, T.G. Benchmarking countries’ environmental performance. J. Oper. Res. Soc. 2013, 64, 426–438. [Google Scholar] [CrossRef]
- Bi, G.; Luo, Y.; Ding, J.; Liang, L. Environmental performance analysis of Chinese industry from a slacks-based perspective. Ann. Oper. Res. 2015, 228, 65–80. [Google Scholar] [CrossRef]
- Gan, X.; Fernandez, I.C.; Guo, J.; Wilson, M.; Zhao, Y.; Zhou, B.; Wu, J. When to use what: Methods for weighting and aggregating sustainability indicators. Ecol. Ind. 2017, 81, 491–502. [Google Scholar] [CrossRef]
- Burgass, M.J.; Halpern, B.S.; Nicholson, E.; Milner-Gulland, E. Navigating uncertainty in environmental composite indicators. Ecol. Ind. 2017, 75, 268–278. [Google Scholar] [CrossRef]
- Smeets, E.; Weterings, R. Environmental Indicators: Typology and Overview; European Environment Agency: Copenhagen, Denmark, 1999.
- Zuo, X.; Hua, H.; Dong, Z.; Hao, C. Environmental performance index at the provincial level for China 2006–2011. Ecol. Ind. 2017, 75, 48–56. [Google Scholar] [CrossRef]
- Dong, Y.; Hauschild, M.Z. Indicators for Environmental Sustainability. Procedia CIRP 2017, 61, 697–702. [Google Scholar] [CrossRef]
- Robalino, J.D.; Jensen, H.J. Entangled economy: An ecosystems approach to modeling systemic level dynamics. Phys. A Stat. Mech. Appl. 2013, 392, 773–784. [Google Scholar] [CrossRef] [Green Version]
- Vázquez, P.; del Río, J.A.; Cedano, K.G.; van Dijk, J.; Jensen, H.J. Network characterization of the Entangled Model for sustainability indicators. Analysis of the network properties for scenarios. PLoS ONE 2018, 13, e0208718. [Google Scholar] [CrossRef]
- Kohonen, T. Self-organized formation of topologically correct feature maps. Biol. Cybern. 1982, 43, 59–69. [Google Scholar] [CrossRef]
- Forouzanfar, M.H.; Afshin, A.; Alexander, L.T.; Anderson, H.R.; Bhutta, Z.A.; Biryukov, S.; Brauer, M.; Burnett, R.; Cercy, K.; Charlson, F.J.; et al. Global, regional, and national comparative risk assessment of 79 behavioural, environmental and occupational, and metabolic risks or clusters of risks, 1990–2015: A systematic analysis for the Global Burden of Disease Study 2015. The Lancet 2016, 388, 1659–1724. [Google Scholar] [CrossRef] [Green Version]
- SEDAC. For International Earth Science Information Network CIESIN Columbia University, C. In Gridded Population of the World, Version 4 (GPWv4): Population Count; SEDAC: New York City, NY, USA, 2016. [Google Scholar] [CrossRef]
- Hansen, M.C.; Potapov, P.V.; Moore, R.; Hancher, M.; Turubanova, S.; Tyukavina, A.; Thau, D.; Stehman, S.; Goetz, S.; Loveland, T.R.; et al. High-resolution global maps of 21st-century forest cover change. Science 2013, 342, 850–853. [Google Scholar] [CrossRef] [Green Version]
- CAIT Climate Data Explorer. Technical Report; CAIT Country GHG Emissions, Updated 2 October; World Resources Institute: Washington, DC, USA, 2017. [Google Scholar]
- Crippa, M.; Janssens-Maenhout, G.; Dentener, F.; Guizzardi, D.; Sindelarova, K.; Muntean, M.; Van Dingenen, R.; Granier, C. Forty years of improvements in European air quality: Regional policy-industry interactions with global impacts. Atmos. Chem. Phys. 2016, 16, 3825–3841. [Google Scholar] [CrossRef] [Green Version]
- Hastie, T.; Tibshirani, R.; Friedman, J. The Elements of Statistical Learning, 2nd ed.; Springer: New York, NY, USA, 2009; arXiv:1011.1669v3. [Google Scholar]
- Celebi, M.E.; Aydin, K. Unsupervised Learning Algorithms; Springer: New York, NY, USA, 2016. [Google Scholar]
- Nasrabadi, N.M.; Feng, Y. Vector quantization of images based upon the Kohonen self-organizing feature maps. In Proceedings of the IEEE 1988 International Conference on Neural Networks, San Diego, CA, USA, 24–27 July 1988; Volume 1, pp. 101–105. [Google Scholar]
- Taczanowska, K.; González, L.M.; García-Massó, X.; Zięba, A.; Brandenburg, C.; Muhar, A.; Pellicer-Chenoll, M.; Toca-Herrera, J.L. Nature-based Tourism or Mass Tourism in Nature? Segmentation of Mountain Protected Area Visitors Using Self-Organizing Maps (SOM). Sustainability 2019, 11, 1314. [Google Scholar] [CrossRef] [Green Version]
- Mendoza-Carranza, M.; Ejarque, E.; Nagelkerke, L.A. Disentangling the complexity of tropical small-scale fisheries dynamics using supervised Self-Organizing Maps. PLoS ONE 2018, 13, e0196991. [Google Scholar] [CrossRef] [PubMed] [Green Version]
- Mayaud, J.R.; Anderson, S.; Tran, M.; Radić, V. Insights from self-organizing maps for predicting accessibility demand for healthcare infrastructure. Urban Sci. 2019, 3, 33. [Google Scholar] [CrossRef] [Green Version]
- Lu, D.; Tian, Y.; Liu, V.; Zhang, Y. The performance of the smart cities in China—A comparative study by means of self-organizing maps and social networks analysis. Sustainability 2015, 7, 7604–7621. [Google Scholar] [CrossRef] [Green Version]
- Mostafa, M.M. Clustering the ecological footprint of nations using Kohonen’s self-organizing maps. Exp. Syst. Appl. 2010, 37, 2747–2755. [Google Scholar] [CrossRef]
- Tambouratzis, T. An investigation of the environmental sustainability index in terms of its prediction and clustering capabilities. In Proceedings of the IEEE 2014 International Joint Conference on Neural Networks (IJCNN), Beijing, China, 6–11 July 2014; pp. 1784–1791. [Google Scholar]
Figure 1.
Environmental Performance Metric (EPI) score variation around the world in 2018.

Figure 2.
Global visualization of the distribution within the EPI categories for 2018.

Figure 3.
SOM Model: (a) breakdown of countries by nodes and by continents in the SOM Model; and (b) weight vectors and clusters in the SOM model.
Figure 3.
SOM Model: (a) breakdown of countries by nodes and by continents in the SOM Model; and (b) weight vectors and clusters in the SOM model.

Figure 4.
Schematic showing the progression (positive, negative, or incomparable) between nodes.

Figure 5.
Positions of Jordan, Morocco, and Sri Lanka in the SOM grid structure during 2001–2010.


Table 1.
Description of indicators used in this study. Note that the data for all indicators was originally collected by the Yale University Center for Environmental Law & Policy as part of the Environmental Performance Index [4]. See https://epi.envirocenter.yale.edu for more details.
Table 1.
Description of indicators used in this study. Note that the data for all indicators was originally collected by the Yale University Center for Environmental Law & Policy as part of the Environmental Performance Index [4]. See https://epi.envirocenter.yale.edu for more details.
| Indicator | Description | Source |
|---|---|---|
| HAD | Age-Standardized Disability-Adjusted Life Years (DALY) Lost Due to the Use of House Solid Fuels | [22] |
| PME | Age-Standardized Disability-Adjusted Life Years (DALY) Lost Due to Particulate Matter Emissions | [23] |
| USD | Age-Standardized Disability-Adjusted Life Years (DALY) Lost Due to Lack of Access or Use of Improved Sanitation Facilities | [22] |
| UWD | Age-Standardized Disability-Adjusted Life Years (DALY) Lost Due to Lack of Access or Use of Improved Drinking Water Facilities | [22] |
| PBD | Age-Standardized Disability-Adjusted Life Years (DALY) Lost Due to Lead Exposure | [22] |
| FOR | Tree Cover Loss (hectares) | [24] |
| CO2 | CO2 Emissions (kt) | [25] |
| CH4 | CH4 Emissions (kt of CO2 equivalent) | [25] |
| N2O | N2O Emissions (kt of CO2 equivalent) | [25] |
| SO2 | SO2 Emissions (kt of CO2 equivalent) | [26] |
© 2020 by the authors. Licensee MDPI, Basel, Switzerland. This article is an open access article distributed under the terms and conditions of the Creative Commons Attribution (CC BY) license (http://creativecommons.org/licenses/by/4.0/).
Share and Cite
MDPI and ACS Style
Paulvannan Kanmani, A.; Obringer, R.; Rachunok, B.; Nateghi, R. Assessing Global Environmental Sustainability Via an Unsupervised Clustering Framework. Sustainability 2020, 12, 563. https://0-doi-org.brum.beds.ac.uk/10.3390/su12020563
AMA Style
Paulvannan Kanmani A, Obringer R, Rachunok B, Nateghi R. Assessing Global Environmental Sustainability Via an Unsupervised Clustering Framework. Sustainability. 2020; 12(2):563. https://0-doi-org.brum.beds.ac.uk/10.3390/su12020563
Chicago/Turabian StylePaulvannan Kanmani, Aiyshwariya, Renee Obringer, Benjamin Rachunok, and Roshanak Nateghi. 2020. "Assessing Global Environmental Sustainability Via an Unsupervised Clustering Framework" Sustainability 12, no. 2: 563. https://0-doi-org.brum.beds.ac.uk/10.3390/su12020563
Note that from the first issue of 2016, this journal uses article numbers instead of page numbers. See further details here.