Article

A BIM-LCA Approach for Estimating the Greenhouse Gas Emissions of Large-Scale Public Buildings: A Case Study

1
School of Civil Engineering, Anhui Jianzhu University, Hefei 230601, China
2
School of Built Environment, Western Sydney University, Locked Bag 1797, Penrith, NSW 2751, Australia
3
School of Civil Engineering, Hefei University of Technology, Hefei 230601, China
4
Department of Civil Engineering, Guangzhou University, Guangzhou 510006, China
*
Author to whom correspondence should be addressed.
Sustainability 2020, 12(2), 685; https://0-doi-org.brum.beds.ac.uk/10.3390/su12020685
Submission received: 6 January 2020 / Revised: 11 January 2020 / Accepted: 14 January 2020 / Published: 17 January 2020
(This article belongs to the Special Issue The Circular Economy as a Promoter of Sustainability)

Abstract

:
Exiting green building assessment standards sometimes cannot work well for large-scale public buildings due to insufficient attention to the operation and maintenance stage. This paper combines the theory of life cycle assessment (LCA) and building information modeling (BIM) technology, thereby proposing a green building assessment method by calculating the greenhouse gas emissions (GGE) of buildings from cradle to grave. Life cycle GGE (LCGGE) can be divided into three parts, including the materialization stage, the operation and maintenance stage, and the demolition stage. Two pieces of BIM software (Revit and Designbuilder) are applied in this study. A museum in Guangdong, China, with a hot summer and warm winter is selected for a case study. The results show that BIM can provide a rich source of needed engineering information for LCA. In addition, the operation and maintenance stage plays the most important role in the GGE reduction of a building throughout the whole life cycle. This research contributes to the knowledge body concerning green buildings and sustainable construction. It helps to achieve the reduction of GGE over the whole life cycle of a building. This is pertinent to contractors, homebuyers, and governments who are constantly seeking ways to achieve a low-carbon economy.

1. Introduction

Climate change and energy shortage have become world concerns. Facing severe environmental problems, developing green buildings is an essential part of resolving resource constraints and achieving sustainability [1]. This is mainly because the construction industry is responsible for over 40% of total global energy consumption, as well as 33% of greenhouse gas emissions (GGE) [2], and it has lots of room for energy saving and emission reduction through sustainable design compared with other industries [3,4]. Public buildings refer to buildings for people to carry out public activities. It generally includes office buildings, commercial buildings, education buildings, health buildings, transportation buildings, etc. [5]. In China, public buildings account for about 17% of the total construction area and the rate is still rapidly increasing. Public buildings account for 25% of total building energy consumption. In addition, energy consumption per unit area of large public buildings is as high as 70–300kW·h, which is 5–15 times of that of ordinary residential buildings [6,7]. Therefore, improving energy efficiency as well as the environmental performance of public buildings is a significant part of developing green buildings and low carbon eco-cities, which should be given additional attention.
At present, there have been many countries proposing their green building assessment standards. As early as 1990, the British Building Research Establishment proposed the earliest green building assessment method in the world called Building Research Establishment Environmental Assessment Method (BREEAM) [8]. The United States Green Building Council developed and promoted leadership in an Energy and Environmental Design Building (LEED) rating system from 2000. It is regarded as the most perfect and influential assessment standard in various green building assessment standards around the world because of its high maneuverability and good market mechanism [9]. The new green building assessment standard (GB-T50378-2014), implemented in China since 2015, adopts the scoring method to conduct assessments to strengthen the maneuverability, which reflects concepts consistent with the LEED system [10,11]. Although different standards have different emphases, they all revolve around the principle of energy saving and emissions reduction [12,13]. However, some buildings selected as green buildings are far from the expected effect [14]. For example, the Bank of American Building, the first office building achieving the LEED Platinum certification in America, consumes a surprising level of energy. The main reason causing this embarrassing situation is that most current assessment standards mainly focus on the planning, design, and materialization stages of the construction project but rarely involve the operation and maintenance stage after project delivery [15]. The unpredictable, high energy consumption caused by building users in the operation and maintenance stage is a drag on the overall environmental performance, particularly for public buildings, which cannot be ignored [16]. Therefore, the whole life cycle assessment (LCA), including the operation stage, is necessary for green building assessments.
LCA is a method to assess environmental effects associated with all the stages of a product’s whole life cycle, including its production, use, and disposal. It usually includes four steps: (1) goal and accounting scope definition, (2) inventory analysis, (3) impact assessment, and (4) results interpretation [17,18]. It has widely been applied to assess the sustainability of buildings on a variety of levels from raw materials to the entire construction project [19,20,21]. However, most previous studies just focused on a specific section of the building’s life cycle; few truly addressed the entire building throughout its whole life cycle because it is difficult to obtain accurate quantities of used materials and data about building performance, which includes energy consumption. Building information modeling (BIM) can represent the physical and functional characteristics of buildings in a digital form and offer a source for generating rich data, including project-material quantities, because of its advantages in visualizations, coordination, simulation, and optimization [17,18,19,20,21]. It helps to address data accessibility problems for a LCA of green buildings. Based on BIM, designers can conduct a LCA of the building and optimize design schemes at an early stage. [22,23,24,25,26]. With rapid BIM technology development, there are many different pieces of BIM software with different main functions and invented strengthens [27,28]. For example, Autodesk Revit provides powerful tools for supporting architectural design, building service engineering design, and structural engineering design. Designbuilder is a comprehensive simulation software for building energy consumption. It can simulate and analyze the total energy consumption of building heating, cooling, lighting, and ventilation, etc. [29,30,31]. However, research on the comprehensive application of different pieces of BIM software for green building assessment throughout the whole life cycle is still limited.
This paper aims to present a method for green building assessment through calculating the generated life cycle greenhouse gas emissions (LCGGE) of a building based on the combination of LCA and BIM. A museum building in Guangdong, China, was analyzed in this paper to demonstrate and validate the method. Some similar studies have been conducted in China but most of them focused on residential buildings, and there is limited research on large-scale public building, such as museums. Compared with other buildings, museums usually have lots of specialized equipment for collection protection, which influences the energy consumption and GGE during the operation and maintenance stage [32]. The LCA-BIM method proposed in this paper helps to investigate the importance of the operation and maintenance stage for museums and other large-scale public buildings on GGE reduction. In addition, although previous studies cover various geographical locations as well as climate types, studies on regions with a hot summer and a warm winter are still lacking. This paper helps to address these research gaps and provide references for sustainable construction design and green building assessments particularly for large-scale public buildings.

2. Materials and Methods
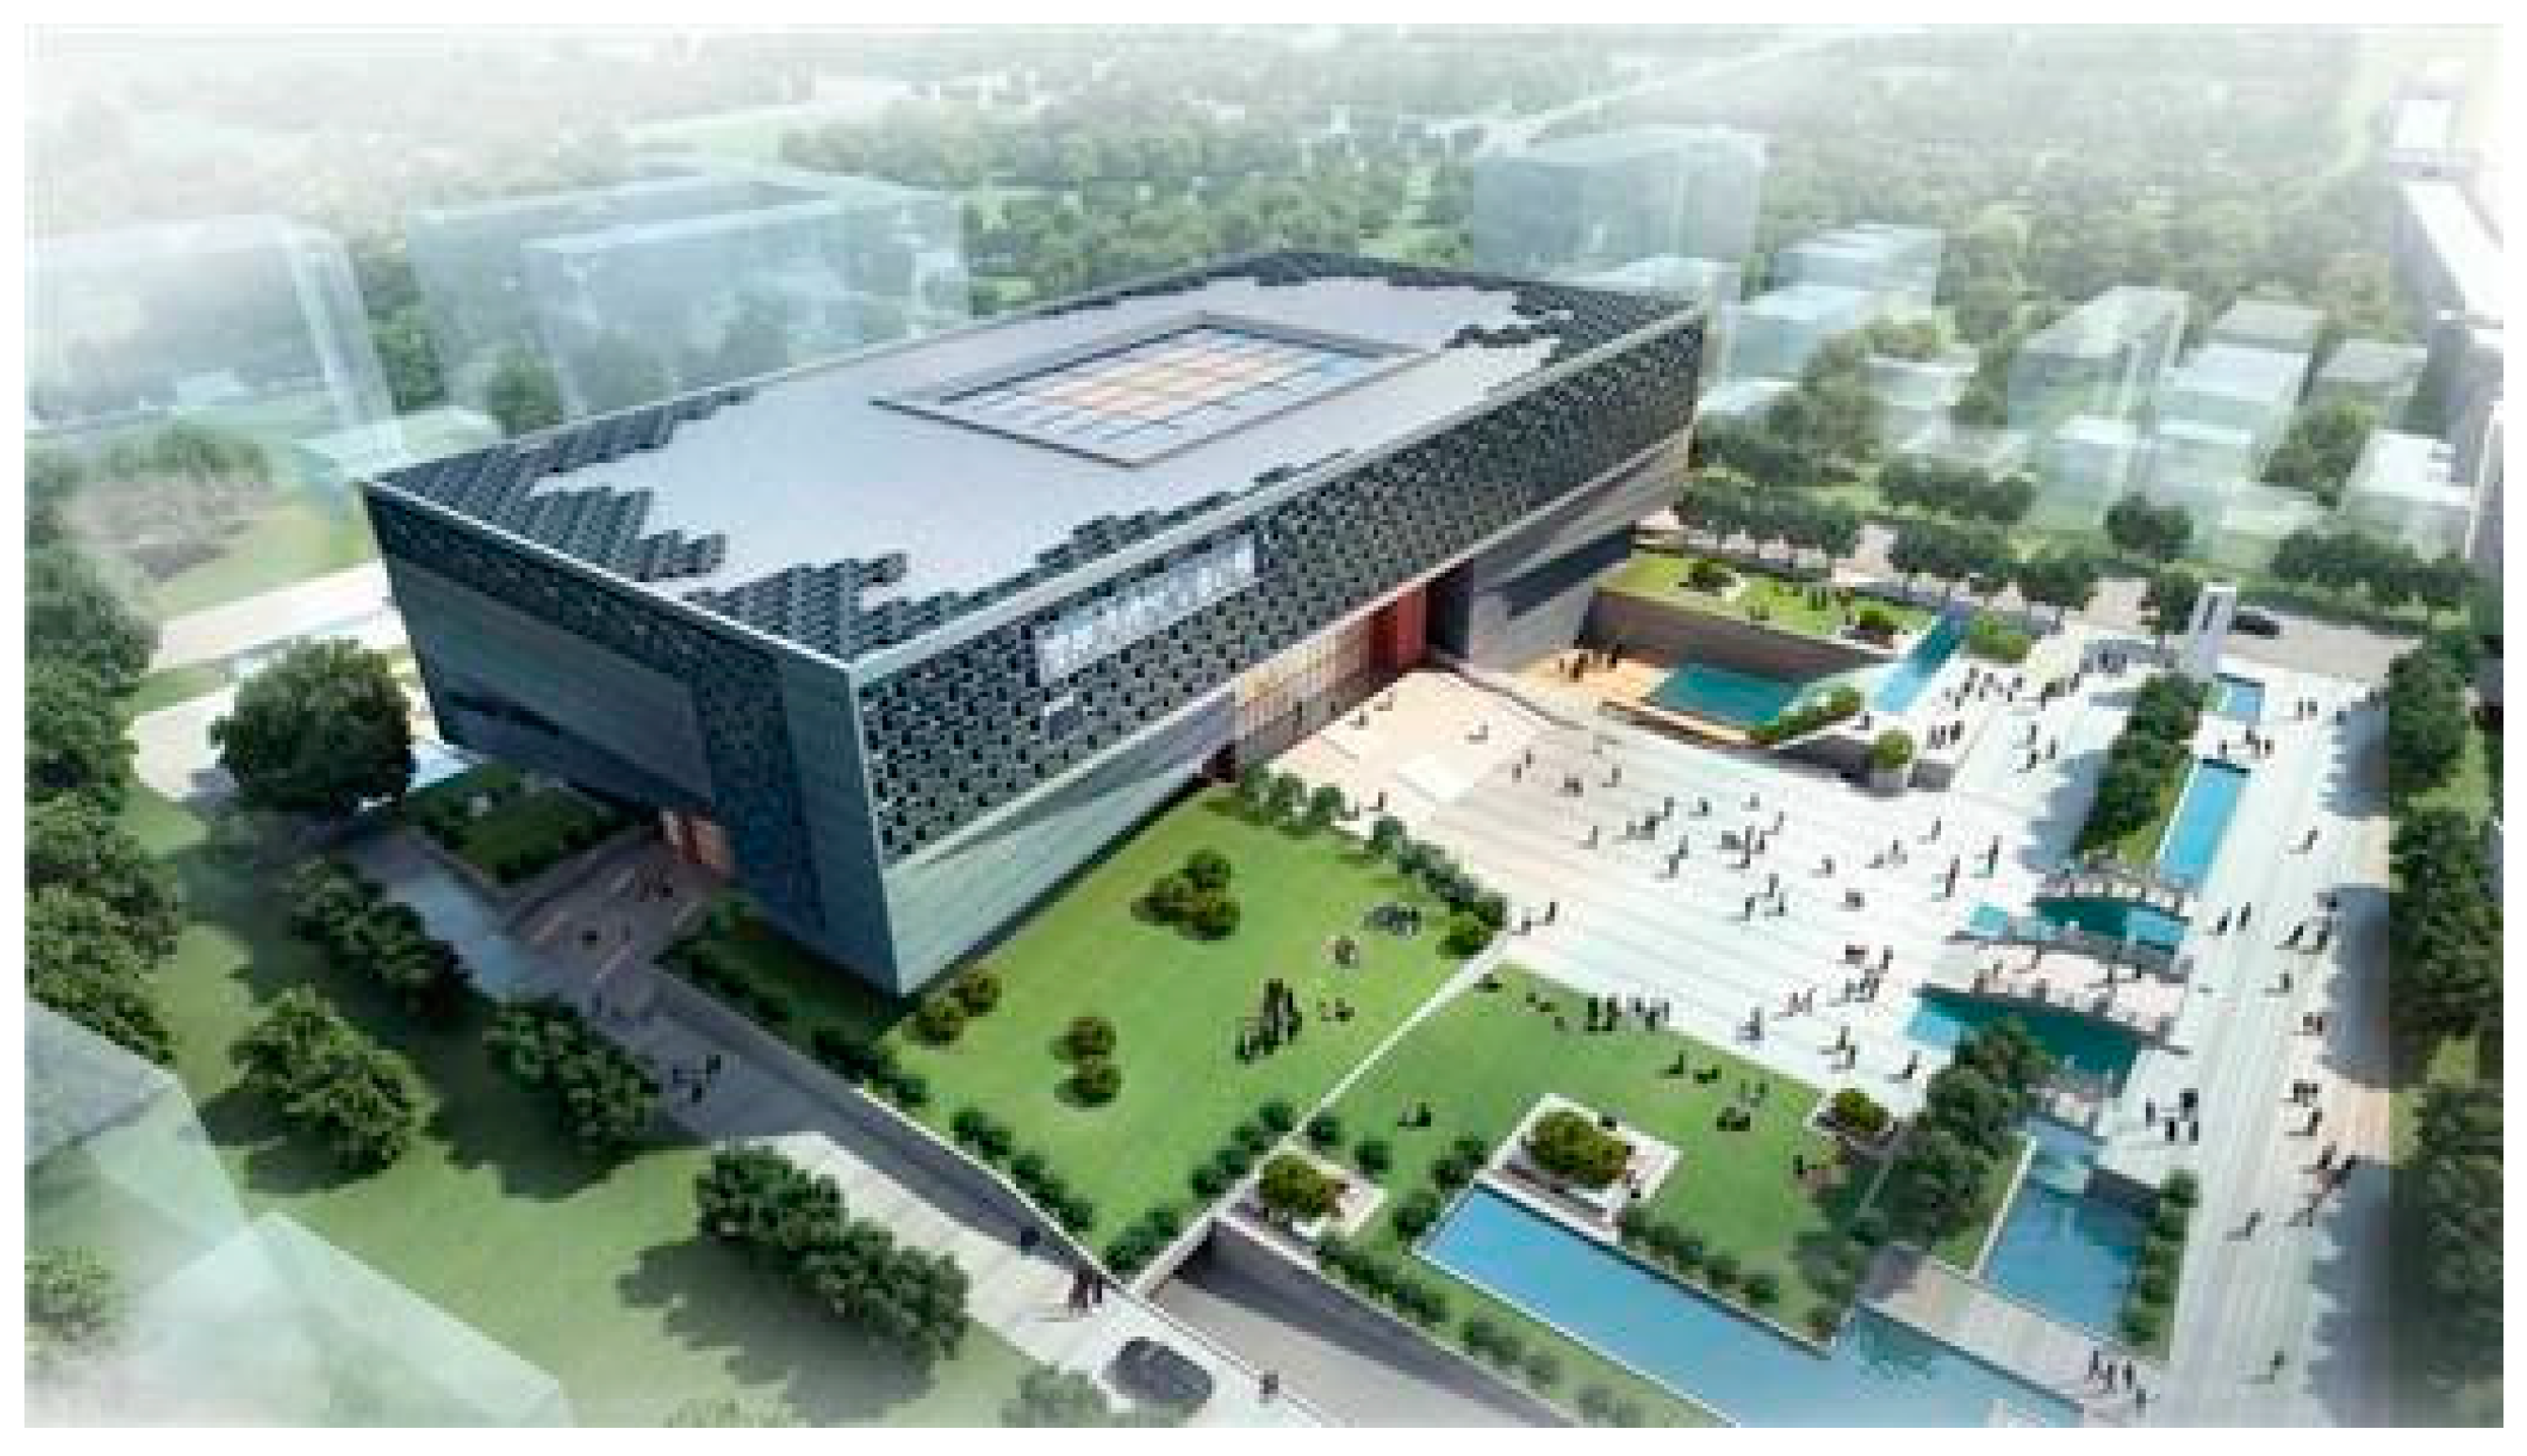
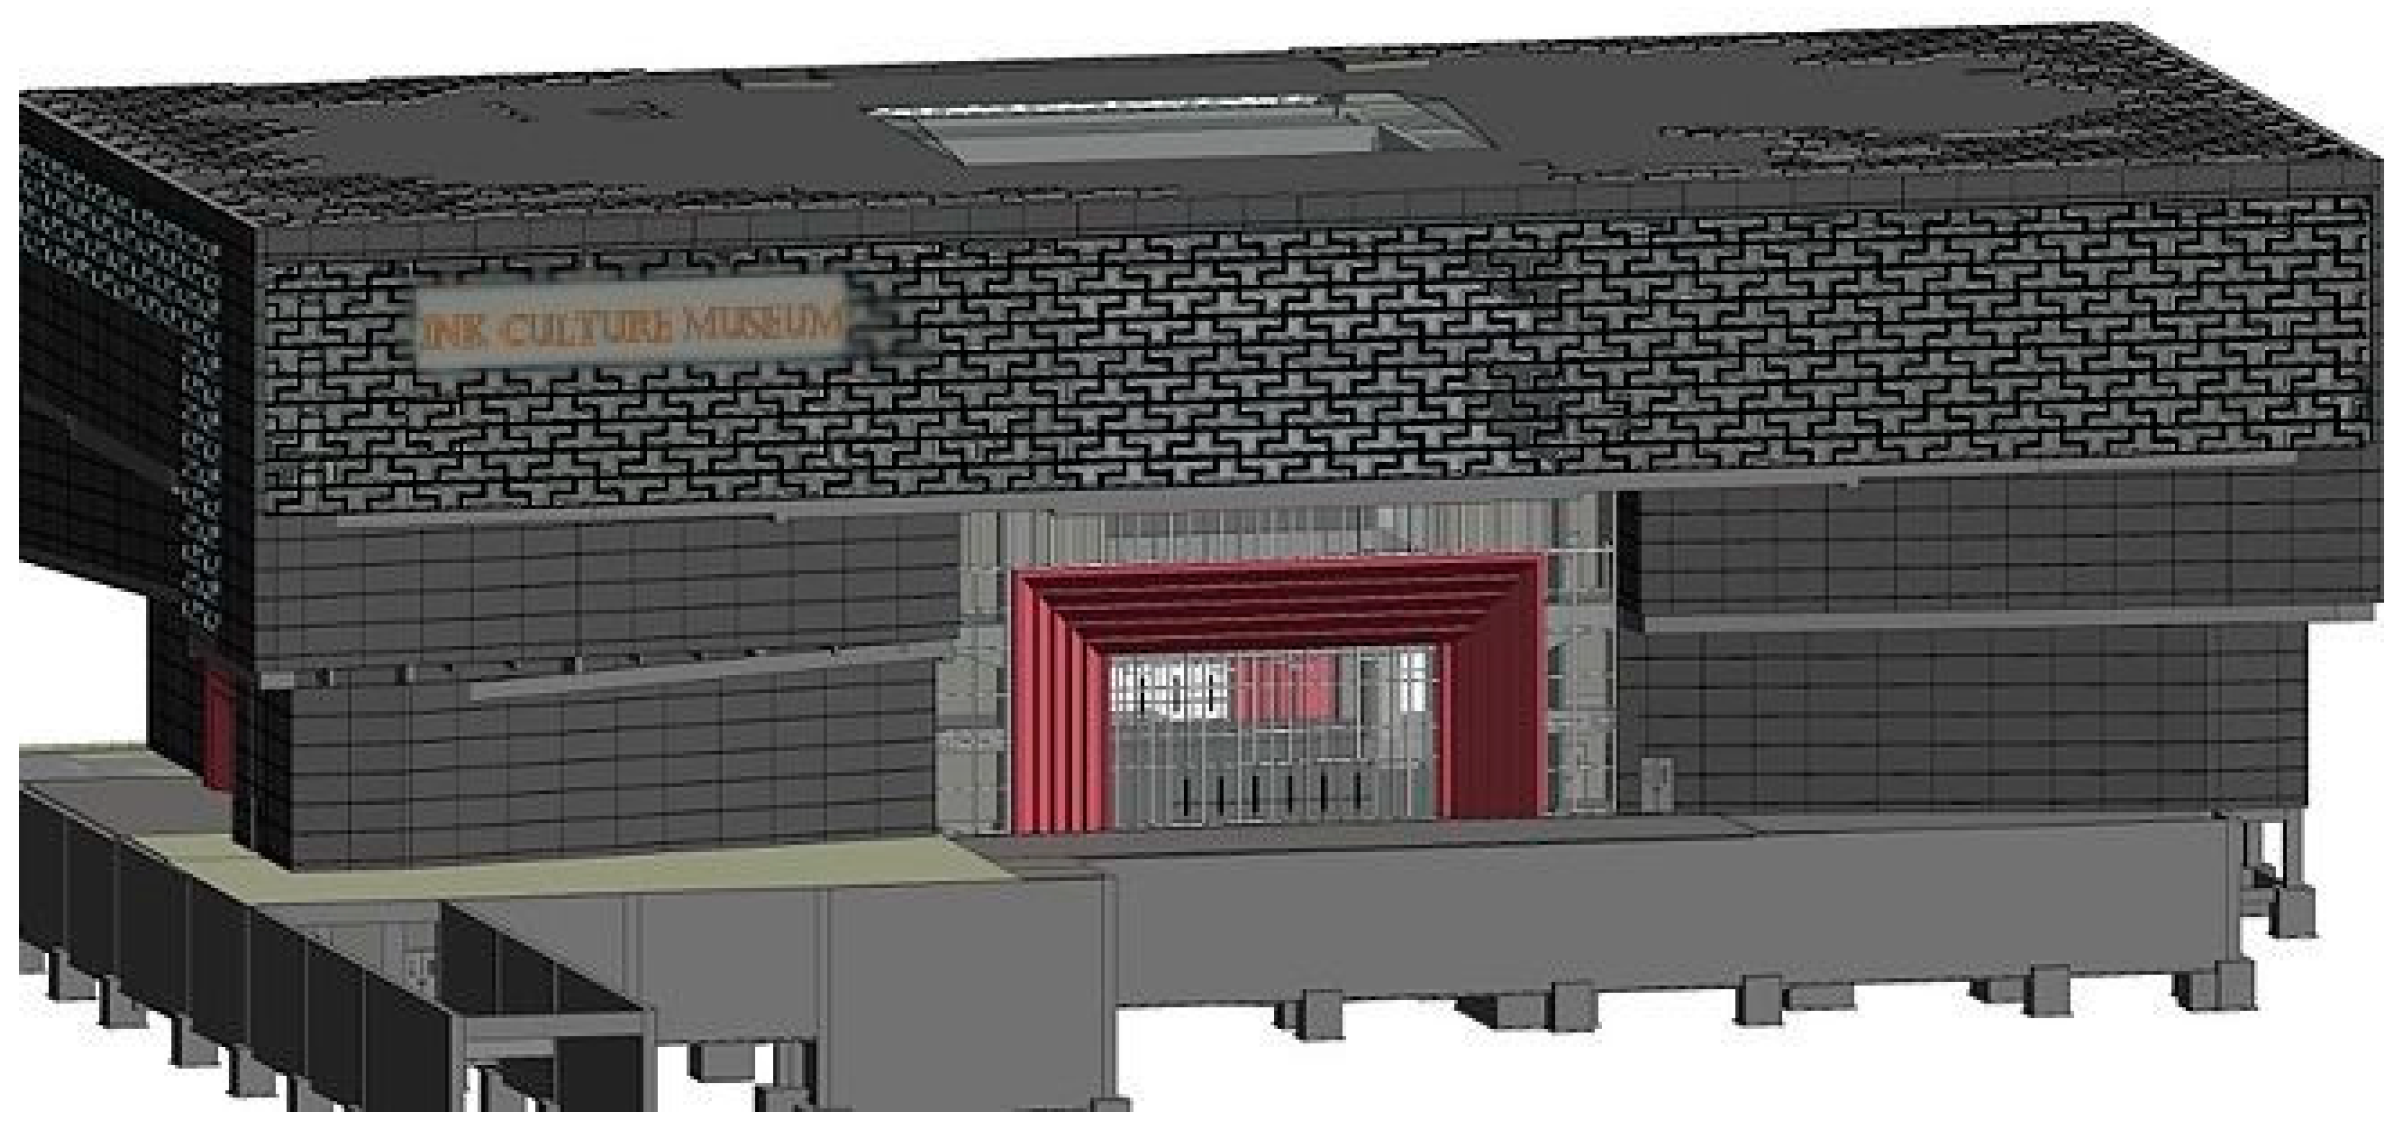
Guangdong Inkstone Culture Museum (GICM) is selected as for this case study. It efficiently combines the theory of LCA and BIM technology. First and foremost, LCA provides a framework to assess the GGE of a building throughout its life cycle. Revit and Designbuilder are then applied as tools for simulating building’s LCGGE.

2.1. Case Project

Guangdong Inkstone Culture Museum (GICM) is selected as an example in this study (Figure 1), which is located at Guangdong province, China. The museum building is a reinforced concrete structure with glass curtain walls as the external walls. The building has four floors above ground and one underground. The total construction area is 17,856.5 m2, among which the above-ground construction area is 13,733.2 m2. It is a typical large-scale building in China.

2.2. Goal and Accounting Scope Definition

Figure 2 shows the goal and accounting scope of this study. The goal of this study is to assess the LCGGE of a building based on BIM. The LCGGE can be divided into three parts according to the theory of LCA: (1) the materialization stage (mainly including GGE from material production, material transportation, and on-site construction); (2) the operation and maintenance stage (mainly including GGE from air conditioning, lighting, and other building equipment, such as elevators and water pumps); and (3) the demolition stage (including GGE from demolition activities and waste material disposal). The GGE of maintenance work is excluded because previous studies found that the sum of material and energy consumption for maintenance work usually accounts for below 1% of the total LCGGE of a building [33], which can be negligible.

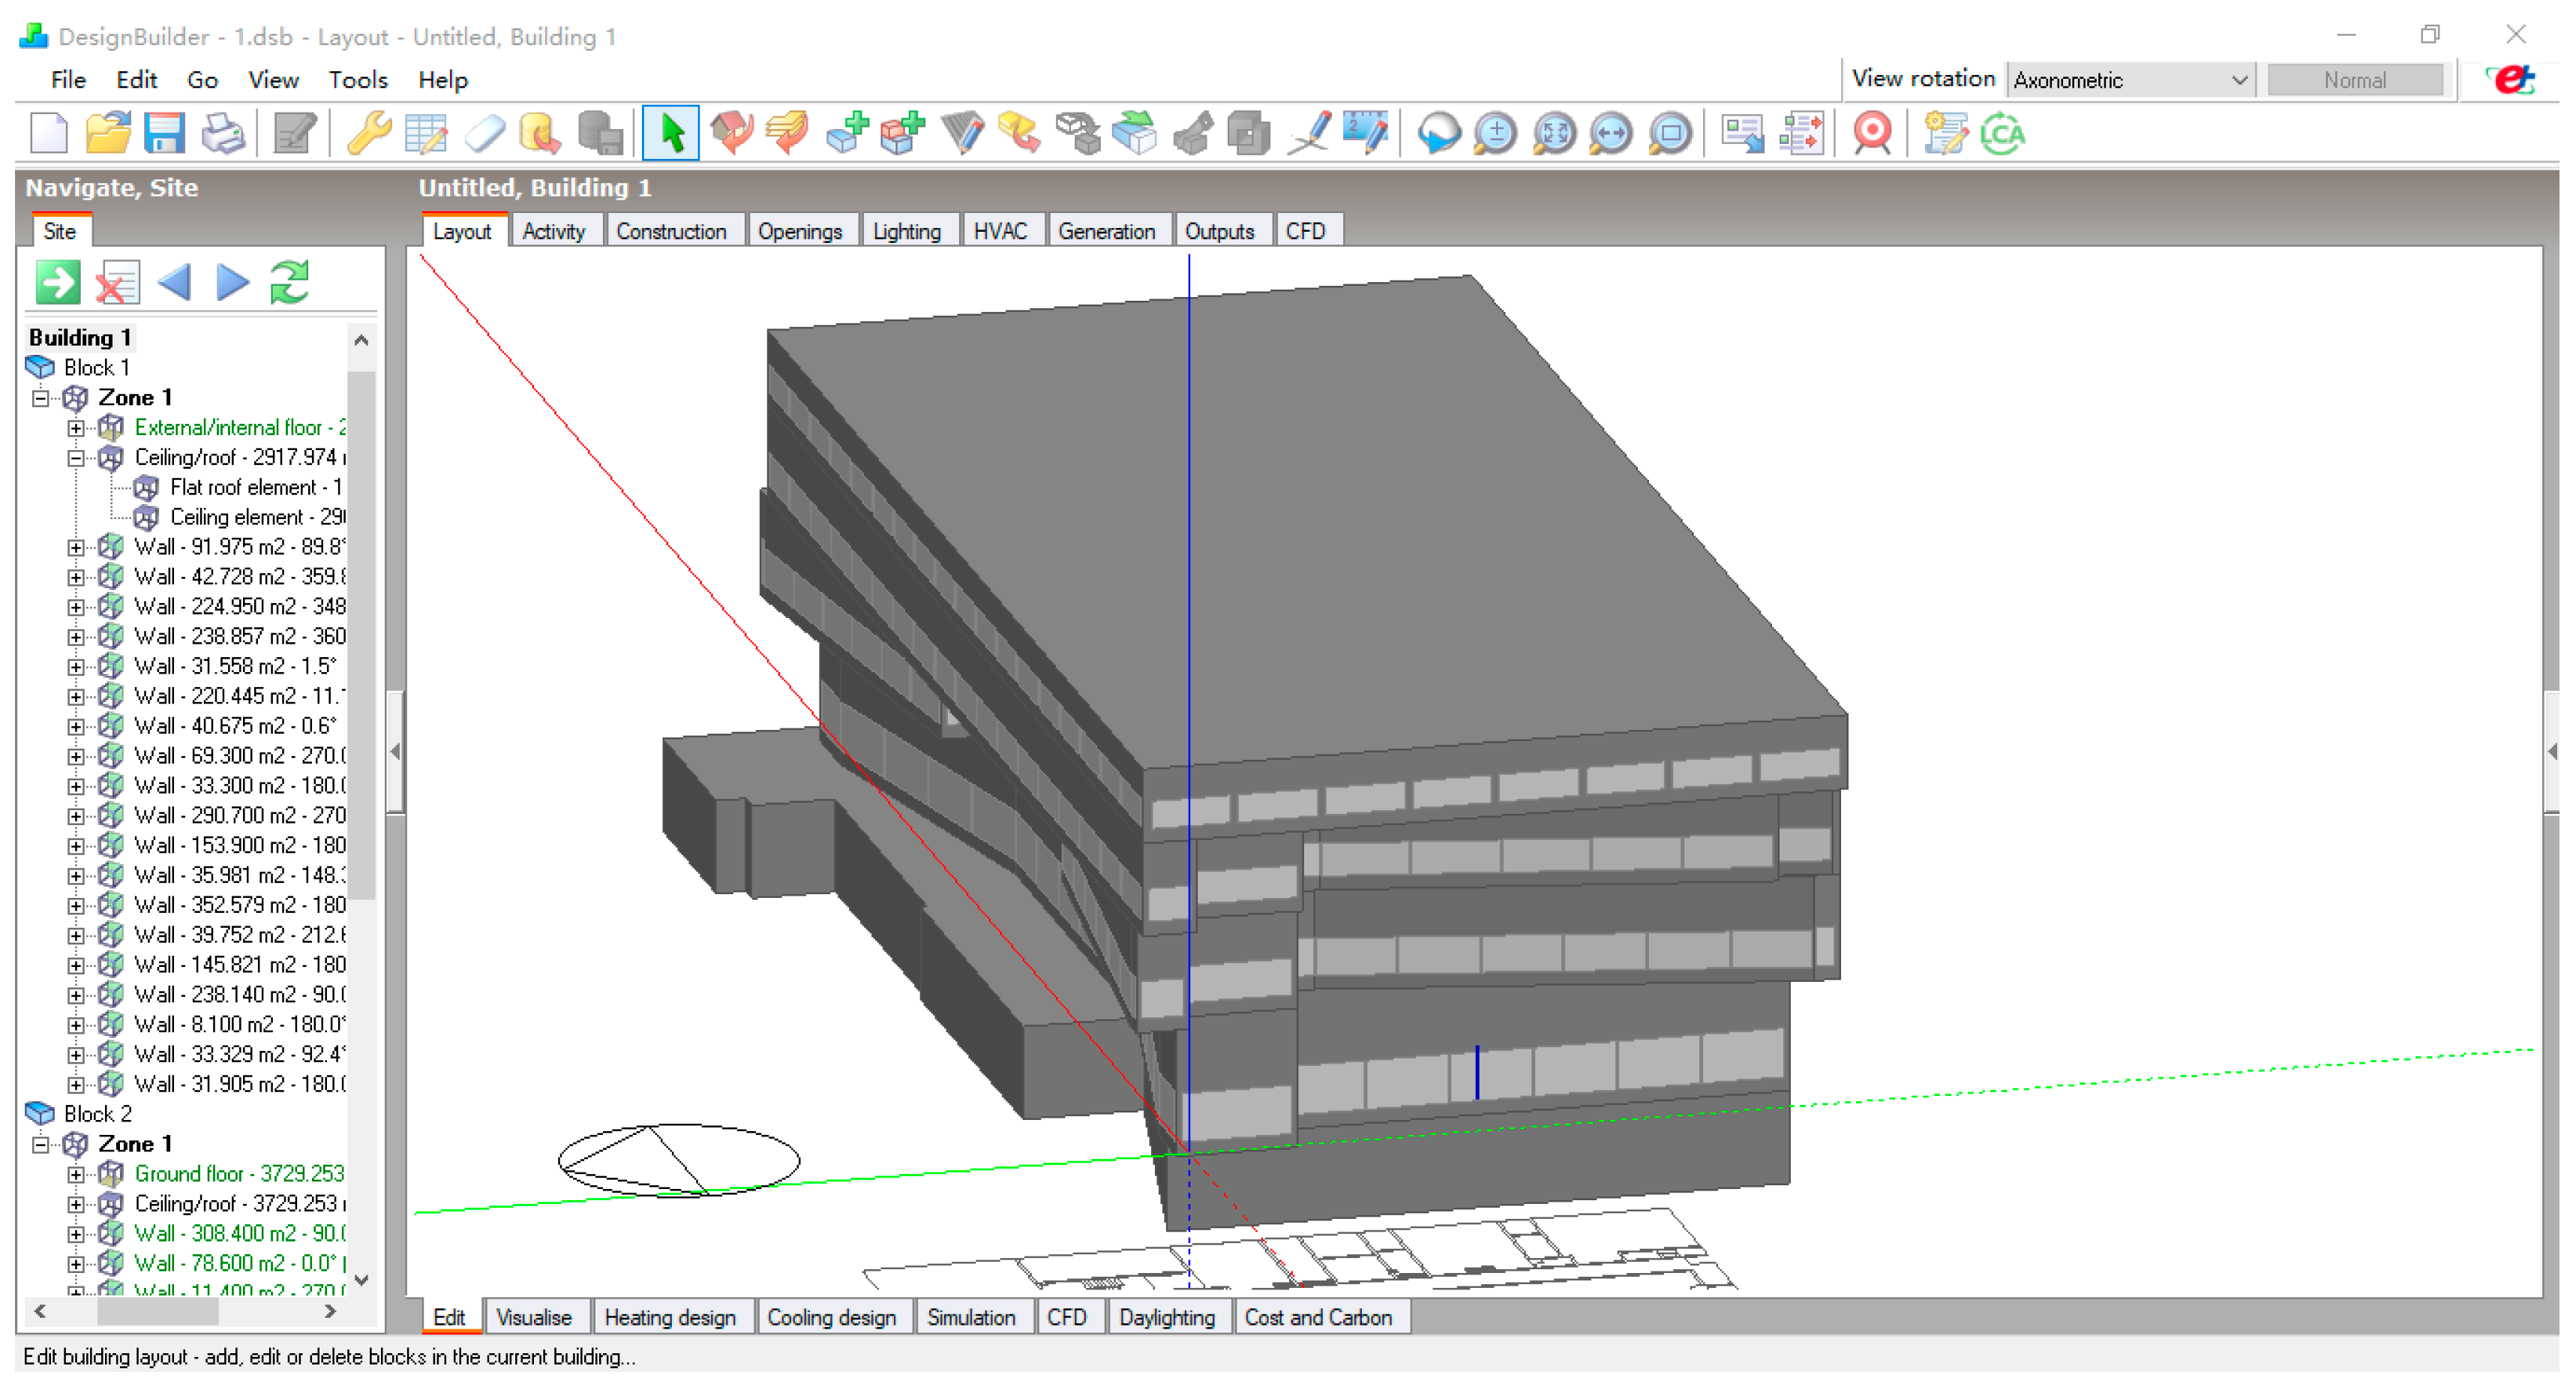
2.3. BIM-Based Inventory Analysis

An inventory of the construction project should be compiled, including the consumption of resources and pollution emissions to air, water, and land. This process of quantity surveying is the key to the assessment of the LCGGE of a building. It necessitates a precise interpretation of designs and an accurate accounting of work quantities. Because a traditional computer aided design (CAD) platform is not able to store the information used for the automatic accounting of resource consumption, quantity surveying has to be conducted in a manual way. This is likely to cost additional time and cause mistakes. BIM, a database storing rich and reliable engineering information, can be used to automate the quantity surveying process and mitigate time waste and mistakes [34].
Revit is one of the most popular pieces of BIM software in China. Due to its rich database of materials and modeling process based on “Revit Family”, designers can establish a BIM model with Revit easily and quickly. It can not only help to provide engineering information that cannot be stored in CAD, but it can also export the model in a normal format, which can be used in other pieces of BIM software, such as Glodon and Designbuilder. Therefore, Revit is adopted in this study for BIM modeling and inventory analysis. A BIM model of the GICM was established in Revit (Figure 3).
Once the basic BIM model has been established, Revit can perform an automatic work quantity survey after inputting the information of various materials and components into the program. In this way, the bill of work quantities can be obtained through the report preview function and the results are shown in Table 1.

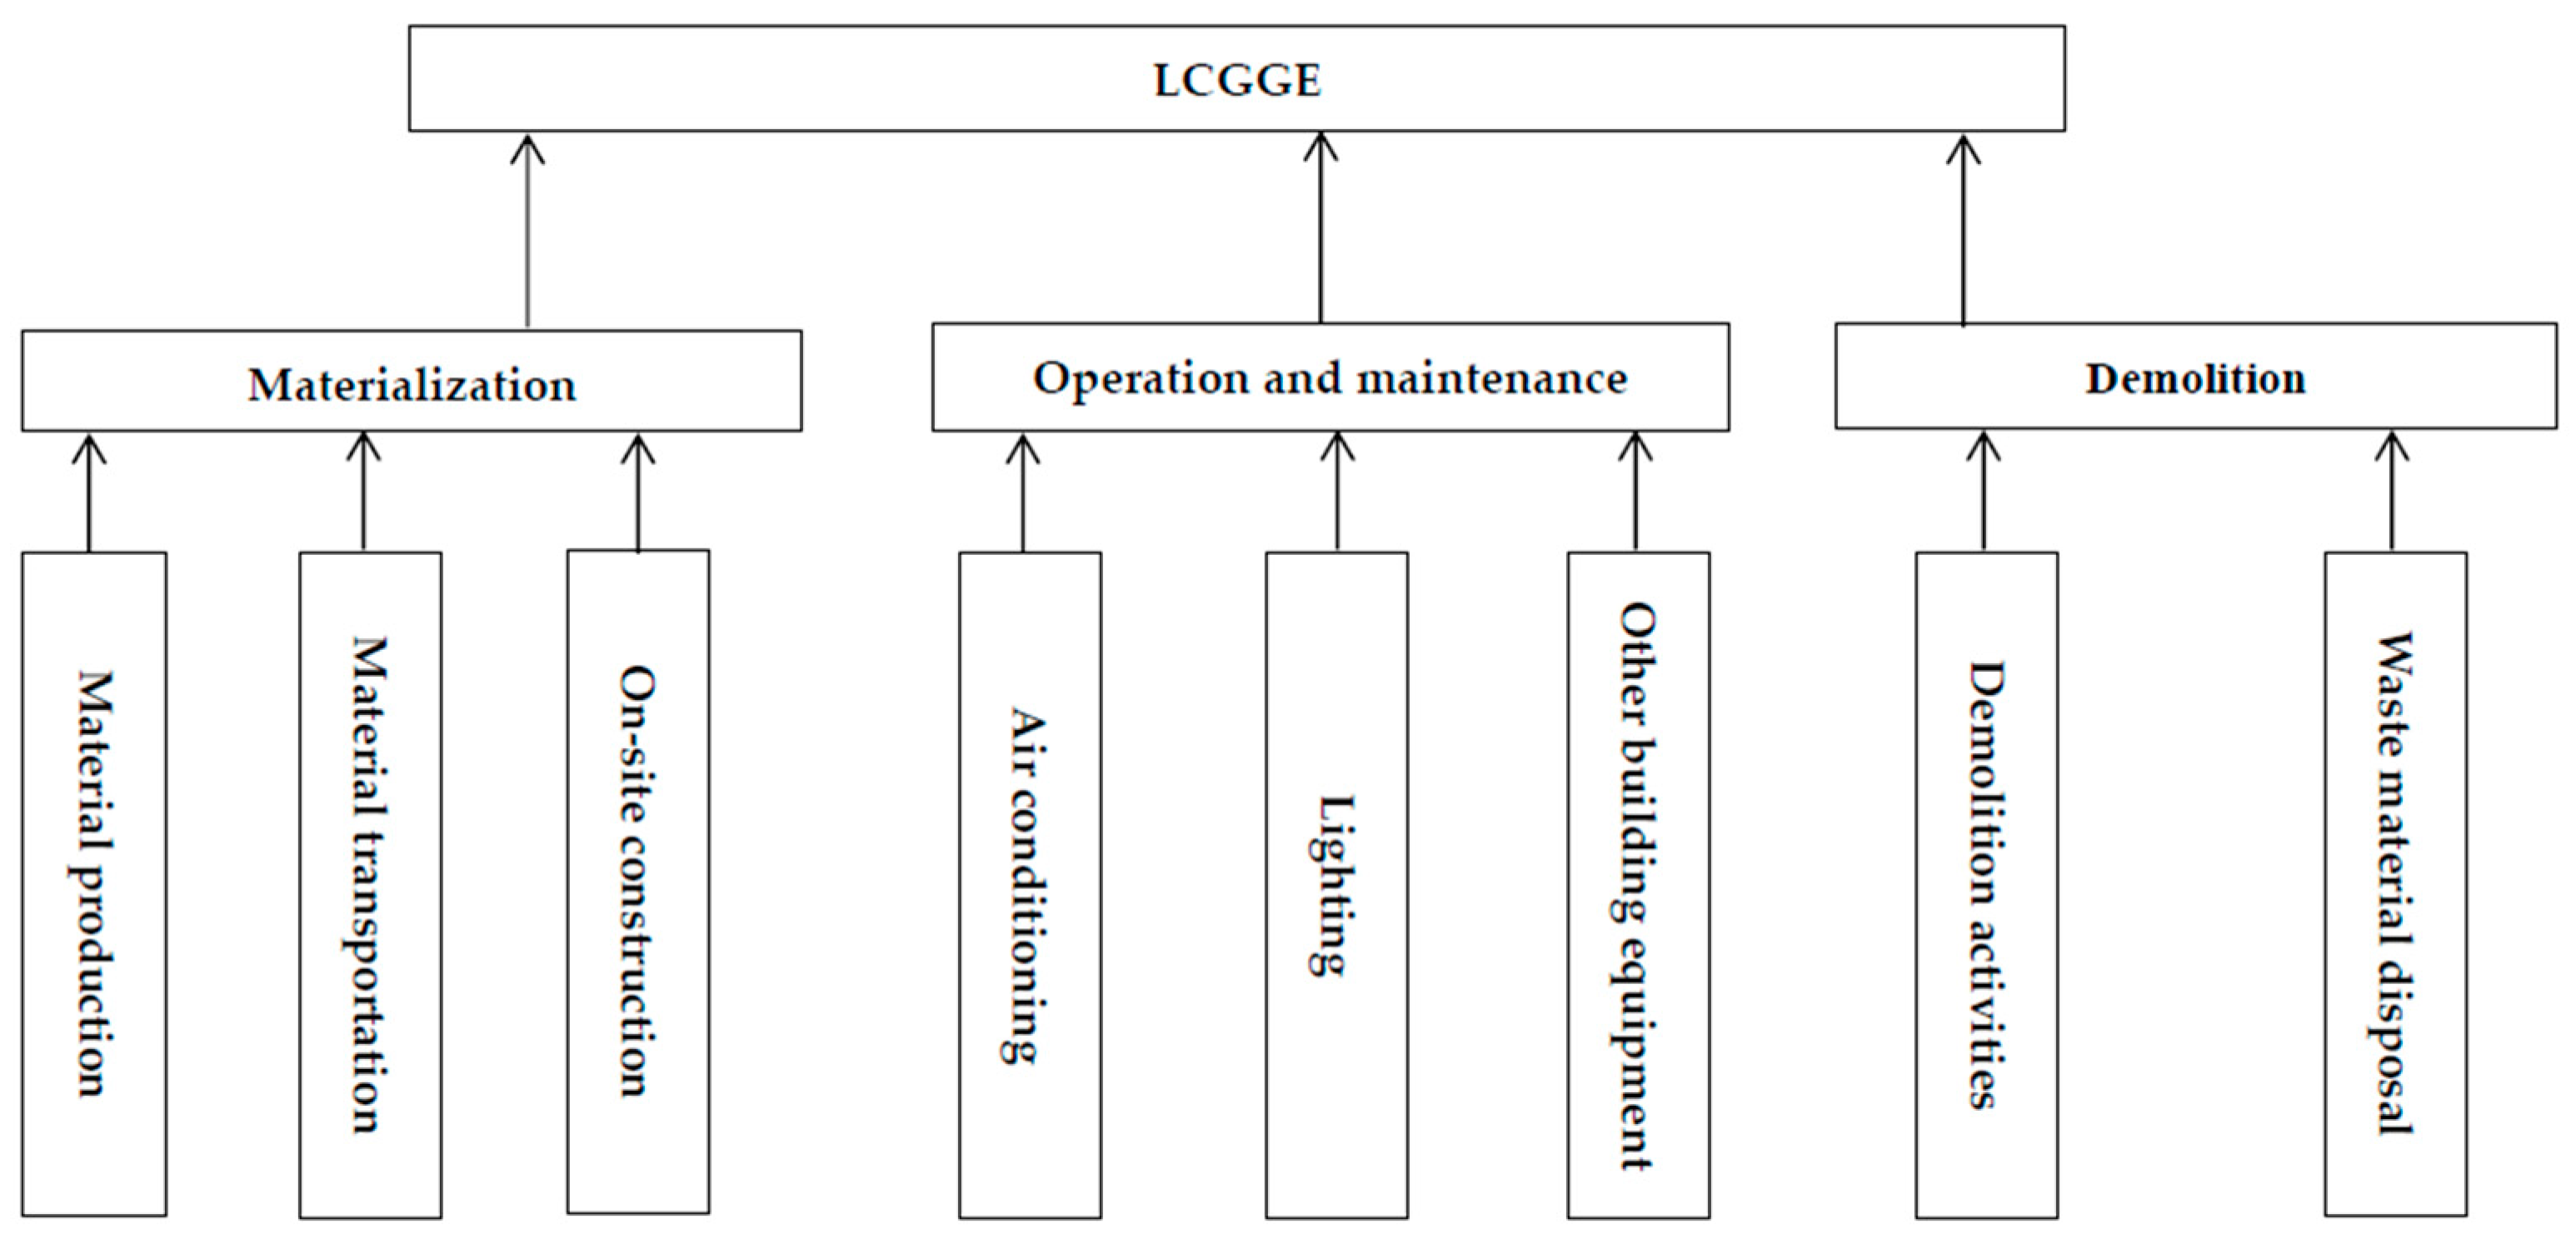
2.4. LCGGE Estimation Model

According to the identified goal and accounting scope, the LCGGE of a building can be expressed as the sum of GGE from the materialization stage, the operation and maintenance stage, as well as the demolition stage, which is shown in Equation (1):
G = G m + G o + G d
where G is the total GGE throughout the life cycle of the building; G m is GGE from the materialization stage; G o is the GGE from the operation and maintenance stage; G d is GGE from the demolition stage.

2.4.1. Estimation of GGE from the Materialization Stage— G m

The GGE from the materialization stage includes GGE from material production, material transportation, and on-site construction, which can be calculated through Equation (2):
G m = G m p + G m t + G m c
where G m p is the GGE generated by material production; G m t is the GGE generated by material transportation; and G m c is the GGE generated by on-site construction.
The G m p can be calculated using Equation (3) [35]:
G m p = i Q m p , i · E F m p , i
where Q m p , i refers to the quantity of the i-th building material consumption, and E F m p , i refers to the corresponding carbon emission factor; the information about building material consumption is collected with Revit. Data on both energy consumption and generated GGE during the production process of building materials are determined through literature review and are listed in Table 2 [26,34,35,36,37].
The G m t can be calculated using Equation (4):
G m t = i Q m t , i · E F m t , i · D i
where Q m t , i refers to the quantity of the transported building material; E F m t , i refers to the carbon emission factor for the building material transportation mode; and D i refers to the distance between the production factory and the construction site. To simplify the calculation, the transportation distance of all materials in this study is set at 100 km. In this project, road freight is the only adopted transportation mode. The corresponding carbon emission factor is set to be 3.46 × 10⁻⁵ t/(t · km ) . [38].
The G m c can be calculated through Equation (5):
G m c = A m c · E F m c
where A m c refers to the gross floor area (GFA) of the building (17,856.5 m 2 ); E F m c is the carbon emission factor for on-site construction of the unit floor area. It varies by the construction method. In this study, the main bearing members, such as columns, beams, and plates are all cast in place. Prefabricated components are adopted for other members like windows, stairs, and nonbearing walls. According to the research data of the Chinese Academy of Engineering, the value of E F m c is set to be 34.78 t/ m 2 [34].

2.4.2. Estimation of GGE from the Maintenance and Operation Stage— G o

The case project is located in Guangdong, China, which is hot in the summer and warm in winter. The only energy source during the operation and maintenance stage is electricity. Thus, only the GGE generated by electricity consumption needs to be considered. It can be estimated using Equation (6):
G o = G o a + G o l + G o e = ( P o a + P o l + P o e ) × E F e l e
where G o a is the GGE generated by air conditioning;   G o l is the GGE generated by lighting; G o e is the GGE generated by other building equipment; P o a is the amount of electricity used by air conditioning; P o l is the amount of electricity used by lighting; P o e is the amount of electricity used by other building equipment. E F e l e is the carbon factor of electricity consumption. According to the data from the Department of Climate Change, National Development and Reform Commission, China, the E F e l e is set to be 0.9344 t C O 2 /MWh [39]. In addition, 50 years is set to be the service life time for this case study. The calculation parameters of outdoor temperature in Guangdong is listed in Table 3.

2.4.3. Estimation of GGE from the Demolition Stage— G d

The GGE from the demolition stage includes the GGE generated by demolition activities and waste material disposal. It can be calculated through Equation (7):
G d = G d d + G d w
where G d d is the GGE generated by demolition activities and G d w is the GGE generated by waste materials disposal.
The G d d can be calculated through Equation (8):
G d d = A × E C d c × E F e l e
where A is the GFA of the building; E C d c is the energy consumption of demolition activities used for the unit GFA of the reinforced concrete structure. In this case study, E C d c is set to be 107.7 kWh/ m 2 [34,37].
The G d w can be calculated through Equation (9):
G d w = Q d w × D d w × E F d w
where Q d w represents the amount of waste when the building is demolished;   D d w refers the distance from the construction site to the landfill site; and E F d w is the carbon emission factor for waste material transportation. In this study, it is assumed that all materials selected in Table 1 are not recyclable and are completely discarded (i.e., Qw = 41,381.18 t). The D d w is set to be 50 km. E F d w is set to be the same as the carbon emission factor of road freight at 3.46 × 10⁻⁵ t/(t · km ) .

2.5. LCGGE Assessment

A LCGGE estimation model has been established in Section 2.4. Then, the data of the GICM is used to demonstrate the established model.

2.5.1. GGE from the Materialization Stage— G m

According to Equation (3) and the data in Table 1 and Table 2, the GGE generated by the production of different materials is shown in Table 4:
The total amount of GGE generated by material production is:
G m p = i Q m p , i · E F m p , i = 16108.38 t
The GGE generated by material transportation is
G m t = 16108.38 × 1.68 × 10 4 × 100 = 270.62   t  
The GGE generated by on-site construction is
Gmc = 17856.5 × 34.78 = 621.05 t
Therefore, the total amount of GGE generated from the materialization stage is
G m = G m p + C m t + C m c = 17000.05   t

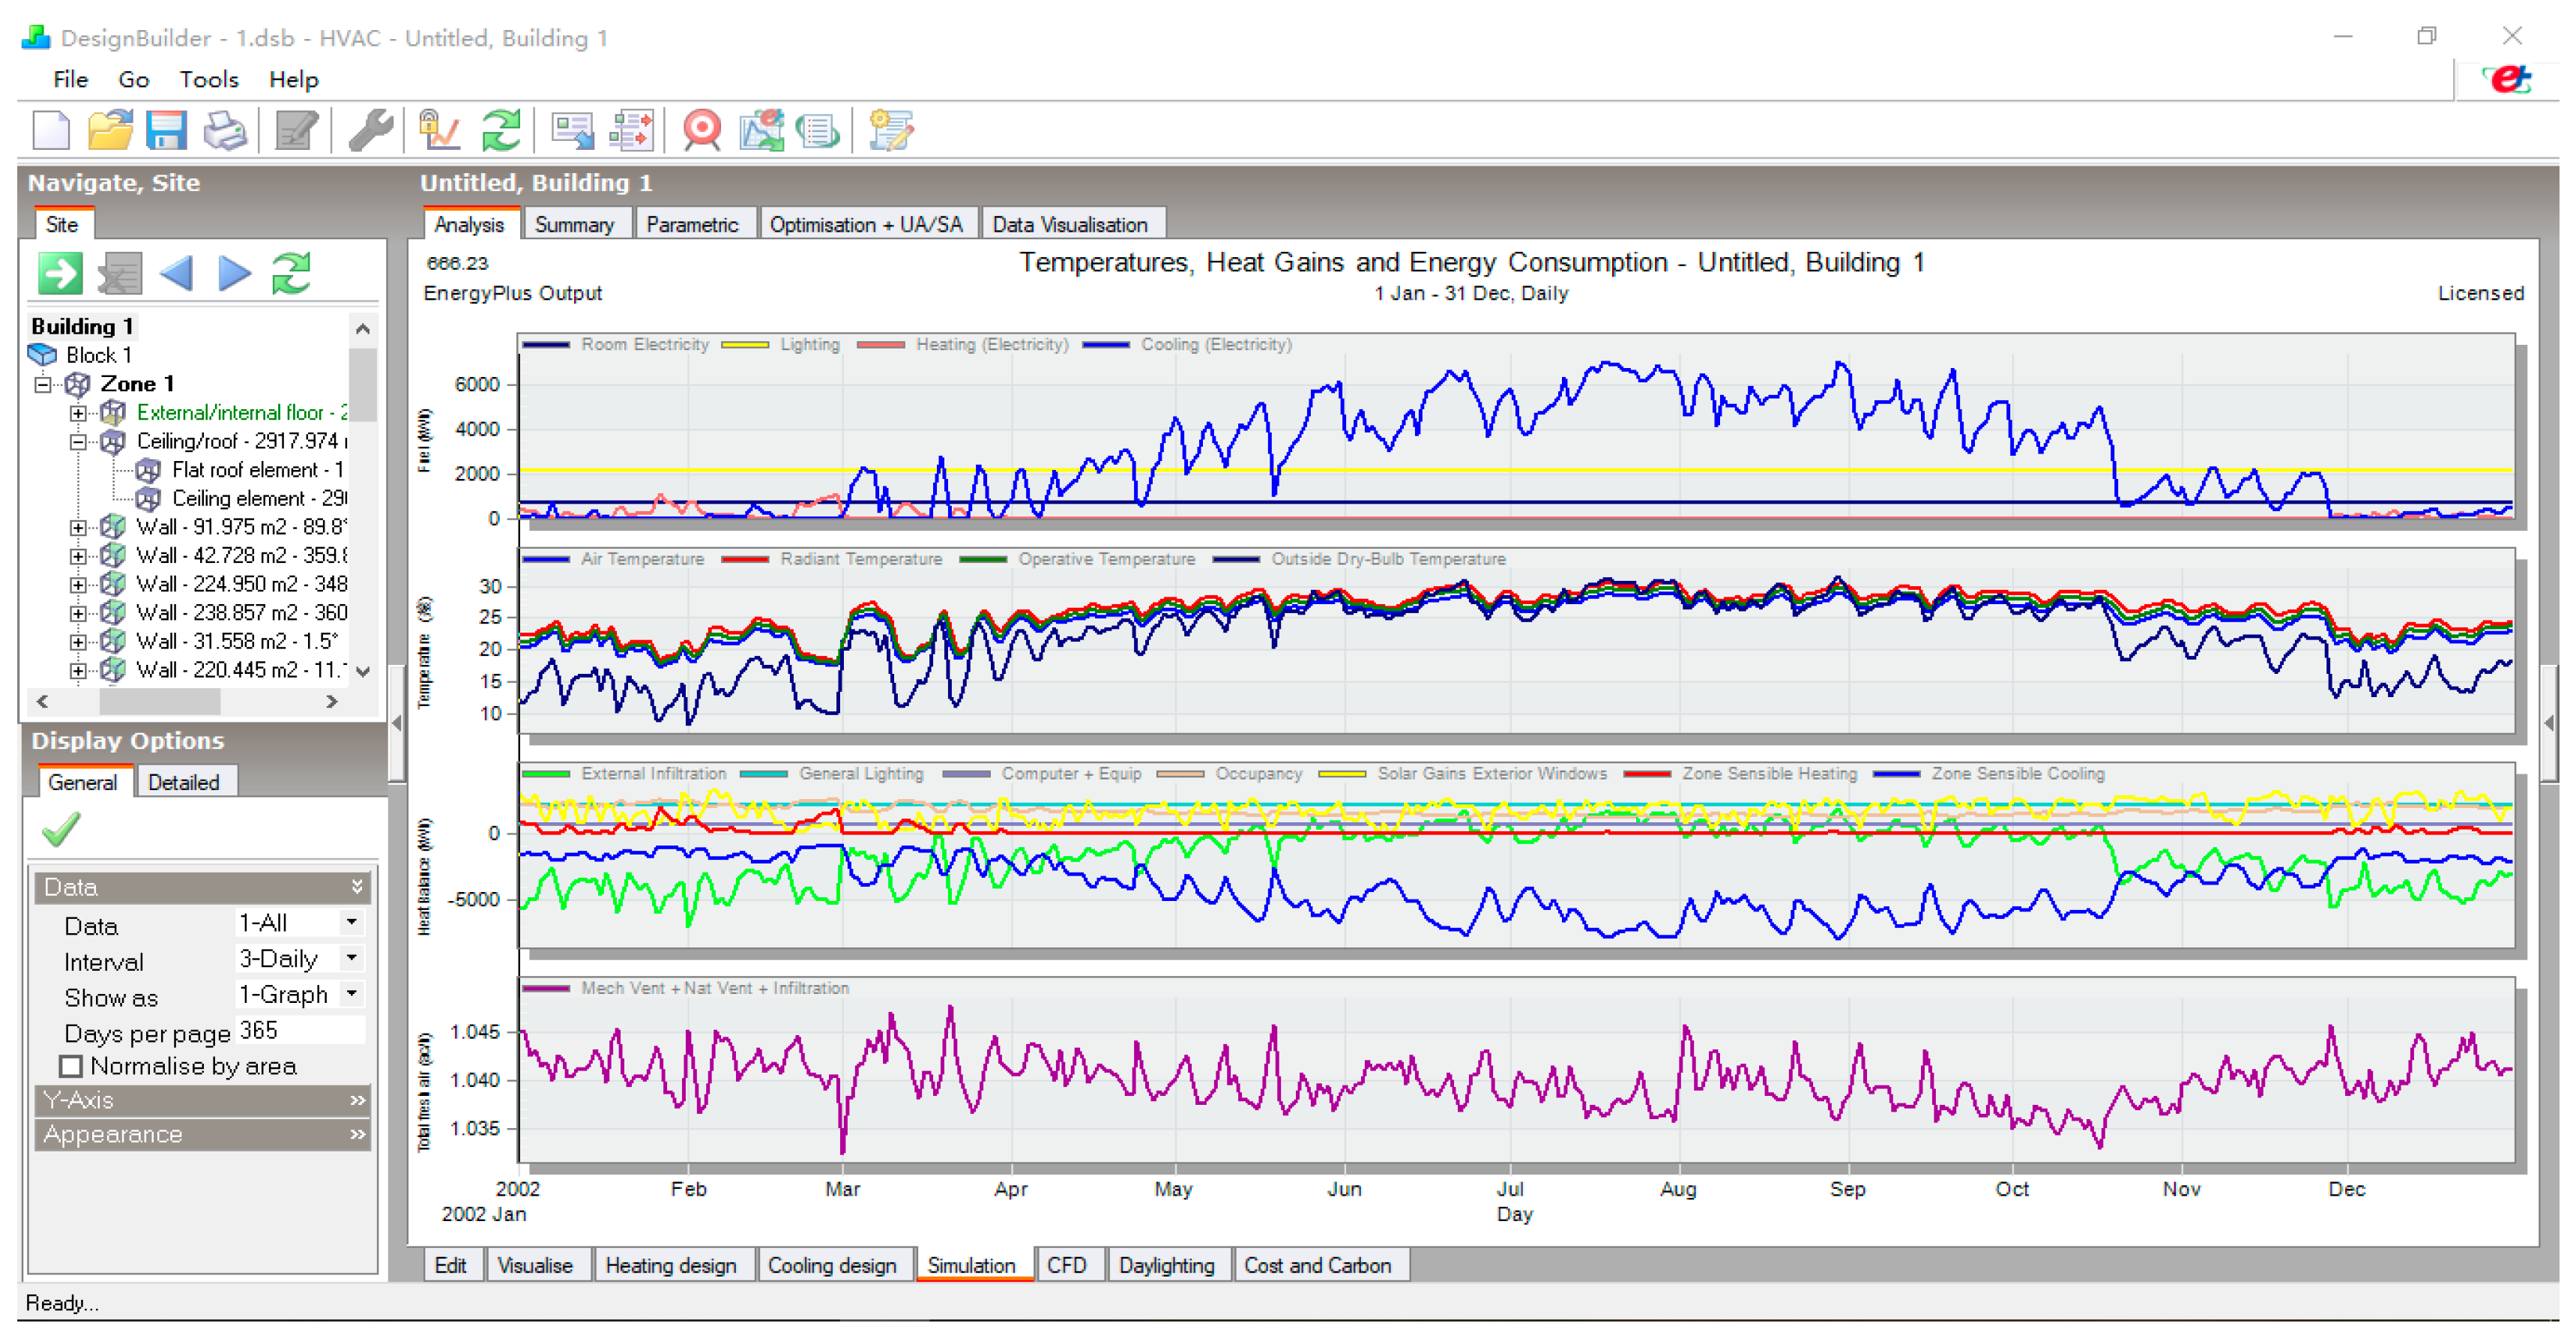
2.5.2. GGE from the Maintenance and Operation Stage— G o

This study used Designbuilder software to simulate the energy consumption of the air conditioning, lighting, and other building equipment of the GICM (Figure 4). The BIM model must be established in Revit before it can be imported into Designbuilder in the format of gbxml. Therefore, it can help to save time used for modeling. In addition, this software is fully functional and can carry out a full energy consumption simulation analysis and economic analysis for building heating, cooling, lighting, ventilation, and other building equipment. For this project, the thermal conductivity of the walls and glass are set to be 0.351 (W/m2*k) and 1.960 (W/m2*k), respectively.
The simulation results are shown in Figure 5. The monthly energy consumption of the building is collected based on simulation results, as shown in Table 5. Furthermore, the annual amount of GGE of the building was calculated based on the electricity carbon emission factor. At last, the GGE throughout the whole maintenance and operation stage could be calculated by multiplying this figure by the service life span.
Based on Table 5, the annual energy consumption of the building p is p = p o a + p o l + p o e = 2028.67   MWh and the corresponding GGE is g = 2028.372 × 0.9344 = 1895.217 t. The service life span is 50 years. Therefore, the total energy consumption during the maintenance and operation stage is P = 2028.672 × 50 = 101,433.6 MWh and the corresponding GGE from the maintenance and operation stage is Go = 101,433.6 × 0.9344 = 94,779.56 t.

2.5.3. GGE from the Demolition Stage— G d

According to Equation (8), the amount of GGE generated by the demolition activities is:
G d d = A × E C d c × E F e l e = 17856.5   m 2 × 107.7   kWh / m 2 × 0.9344 t C O 2 / MWh = 1796.99   t
According to Equation (9), the amount of GGE generated by the demolition activities is:
G d w = Q d w × D d w × E F d w = 41381.18   t × 50   km × 1.92 t / ( t · km )   × 10 4 = 397.26   t
Therefore, the total GGE generated from the demolition stage can be estimated through Equation (7):
G d = G d d +   G d w = 1796.99 + 397.26 = 2194.25   t
After all the G m , G o and G d are all obtained, the LCGGE of GICM can be calculated:
G = G m + G o + G d = 17000.05 + 94 , 779.56 + 2194.25 = 966973.86   t  

3. Interpretation of the Results

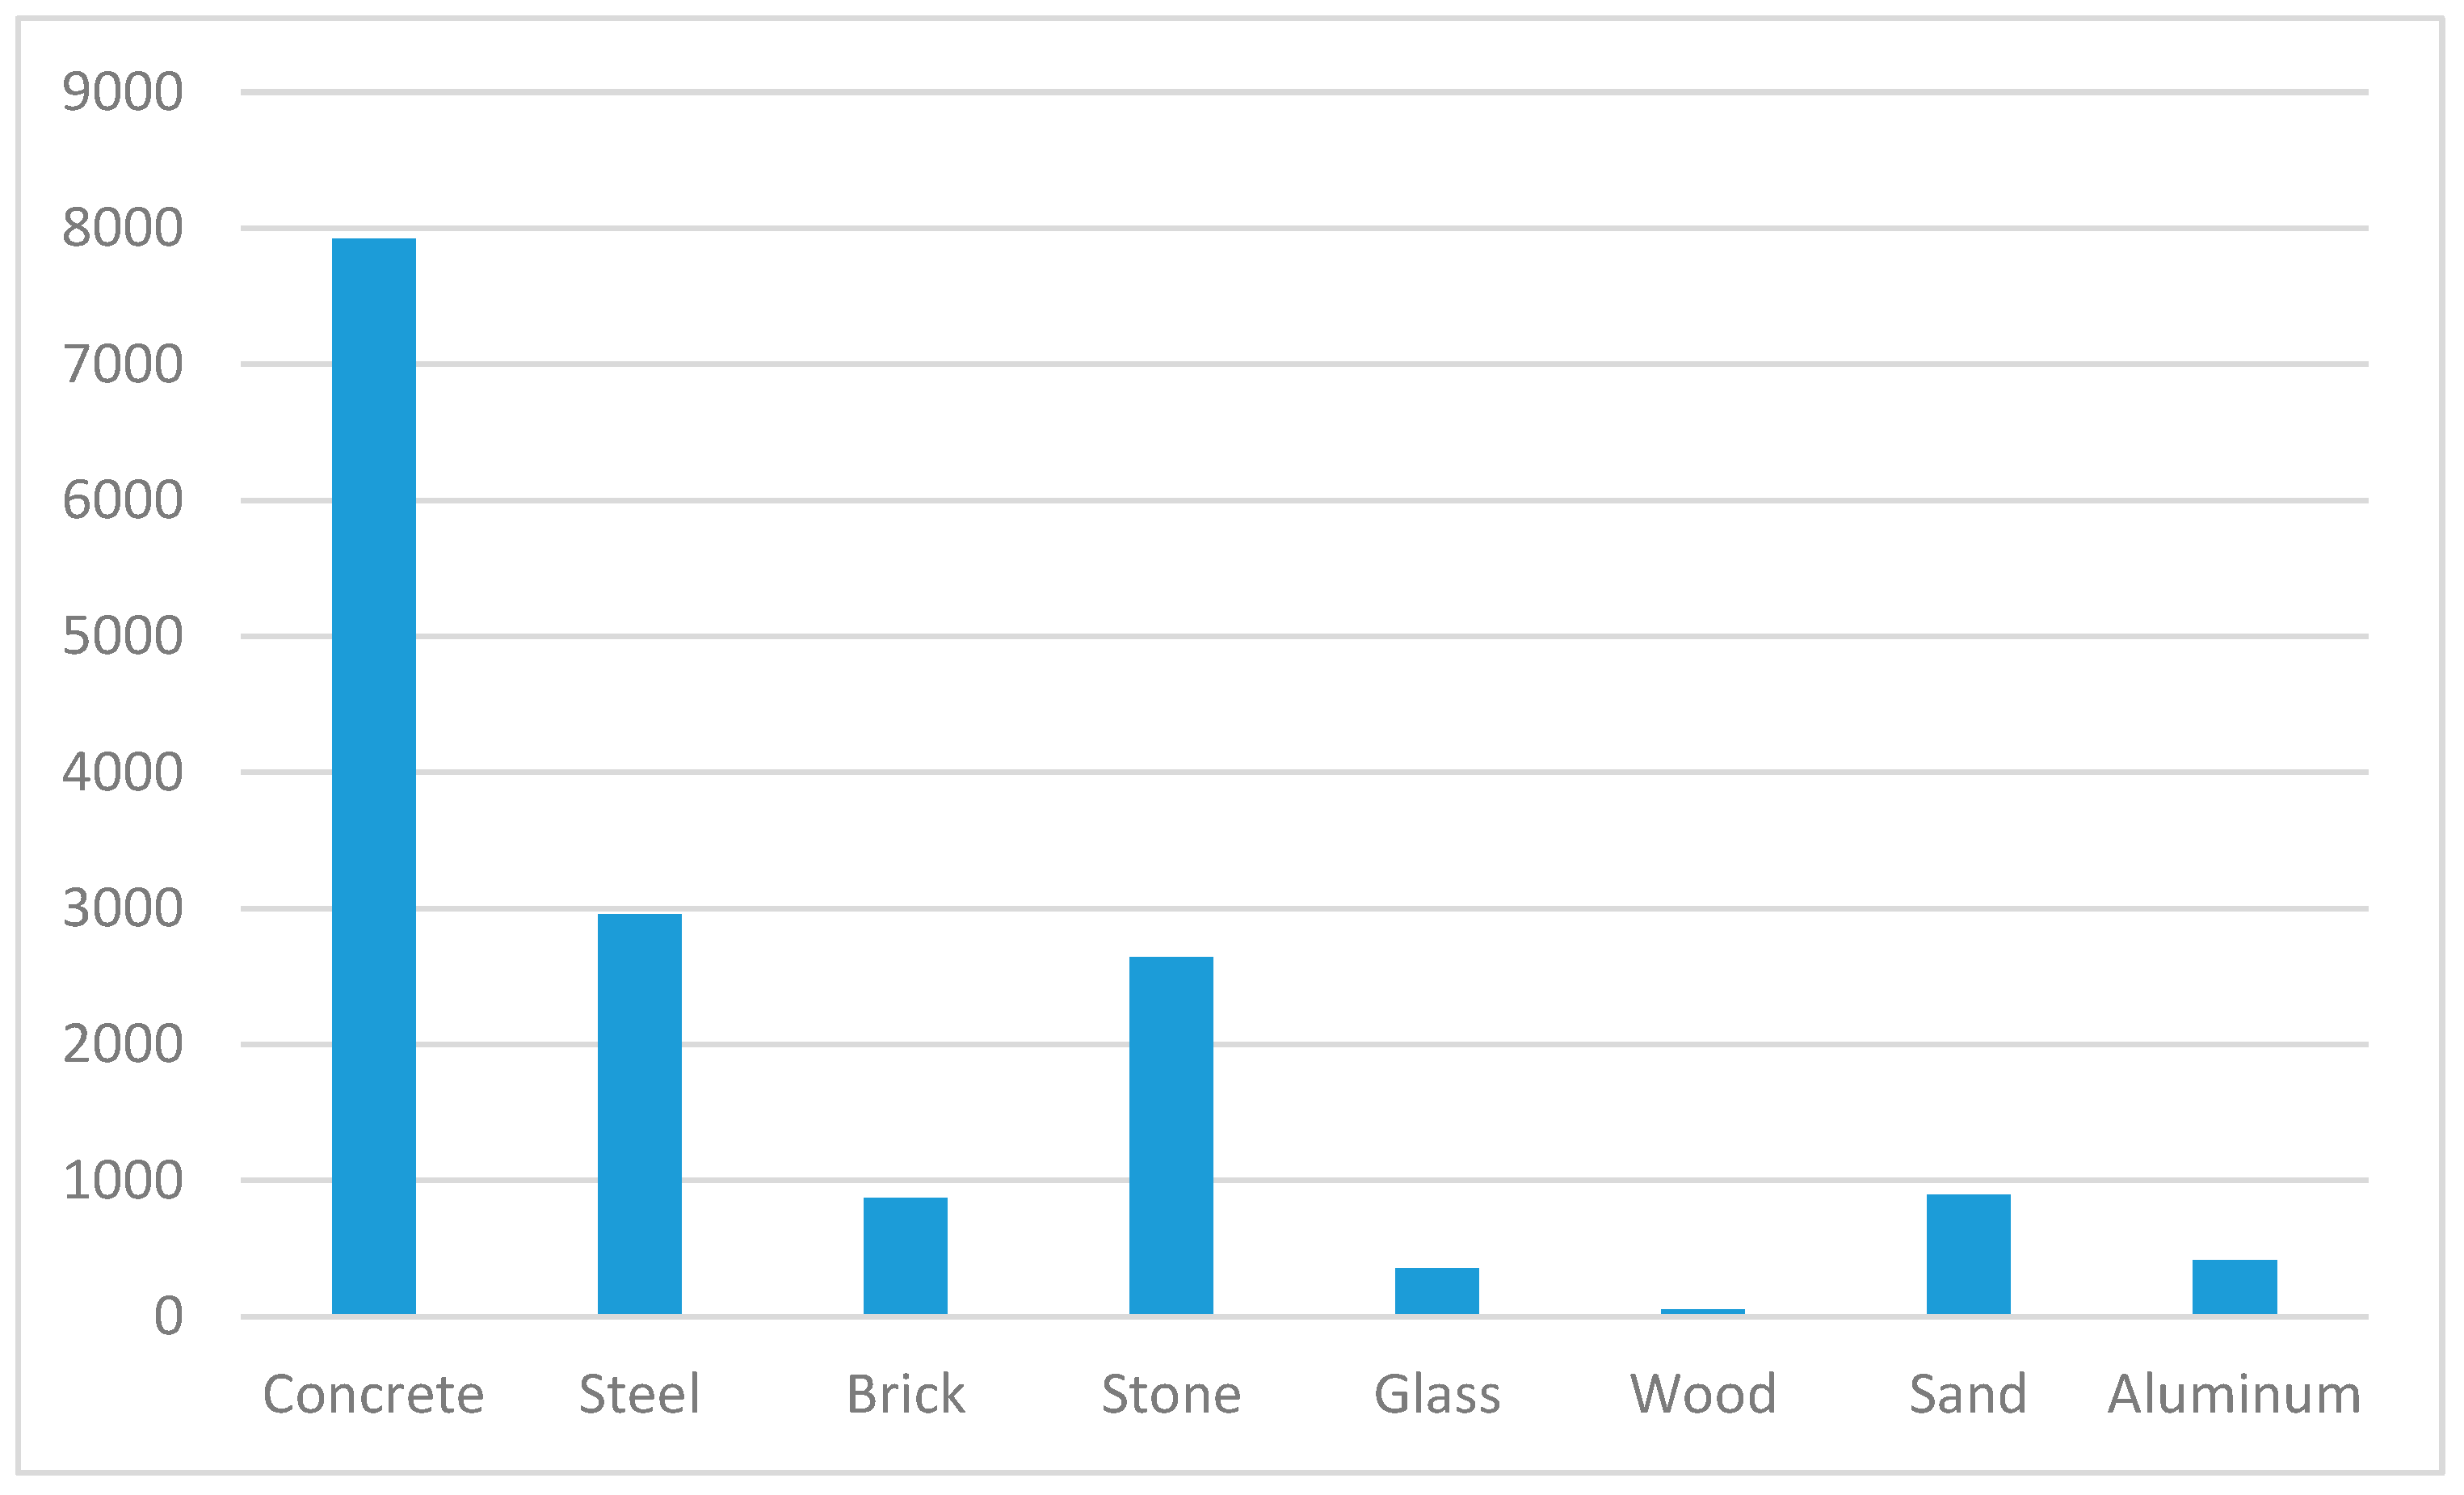
3.1. GGE from Different Buidling Materials

Figure 6 compares GGE from different building materials used in the GICM. It can be seen that there are significant differences in the amount of GGE generated by different types of materials. Concrete and steel are the two major sources of GGE during the materialization stage. Therefore, reducing and avoiding the waste of concrete and steel is of crucial importance for GGE reduction in the construction industry. For instance, an efficient water reducing agent can be considered to reduce the consumption of cement in the process of concrete production, which can reduce the generation of GGE from the source at the same time as improving the strength of the concrete. In addition, stones, bricks and sand are also significant for the GGE during the materialization stage.

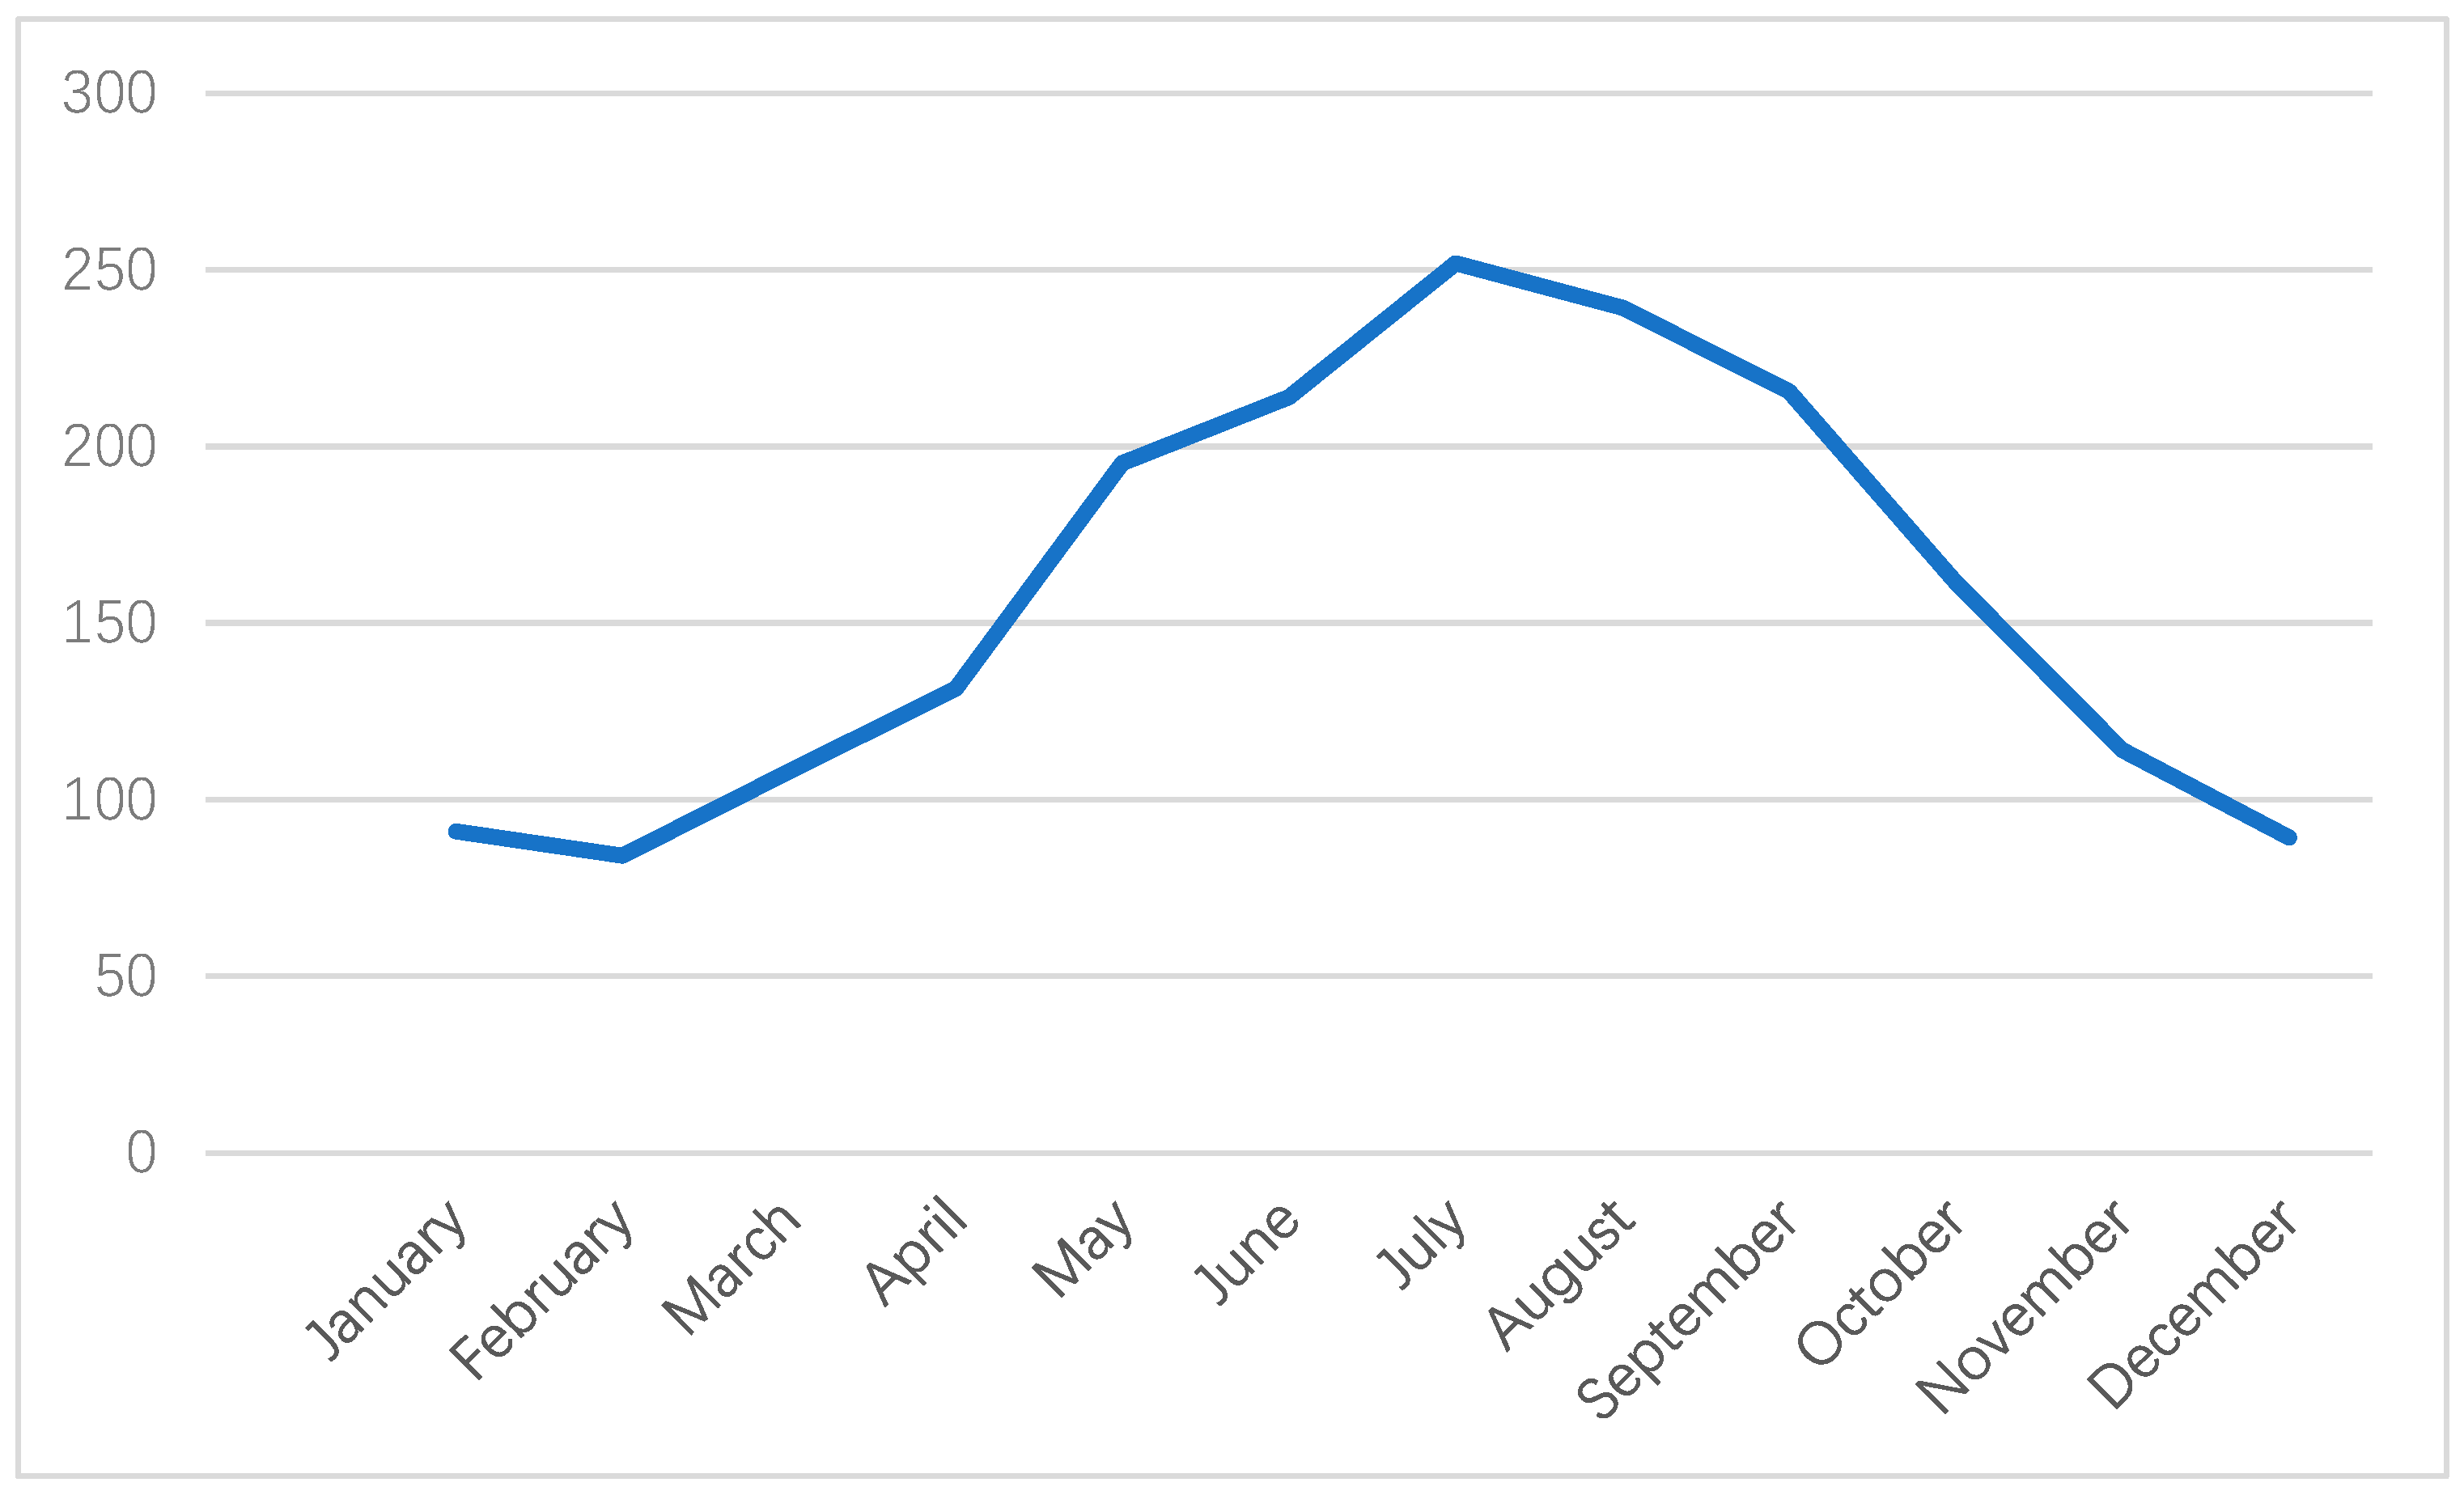
3.2. GGE in Different Months

Figure 7 compares the amount of GGE of the GICM in different months. It can be seen that the amount of GGE generated in summer is higher than the other three seasons because more energy is consumed on air conditioning for cooling the high temperature. The result is different with the figure for buildings located in regions with a hot summer and cold winter like Nanjing or Hefei [34,40]. The monthly GGE of buildings during the operation and maintenance stage in these regions usually has two peak values. One is in the summer, and the other one is in winter. The main cause of this difference is that less energy is needed for heating due to the warm winter in Guangdong.

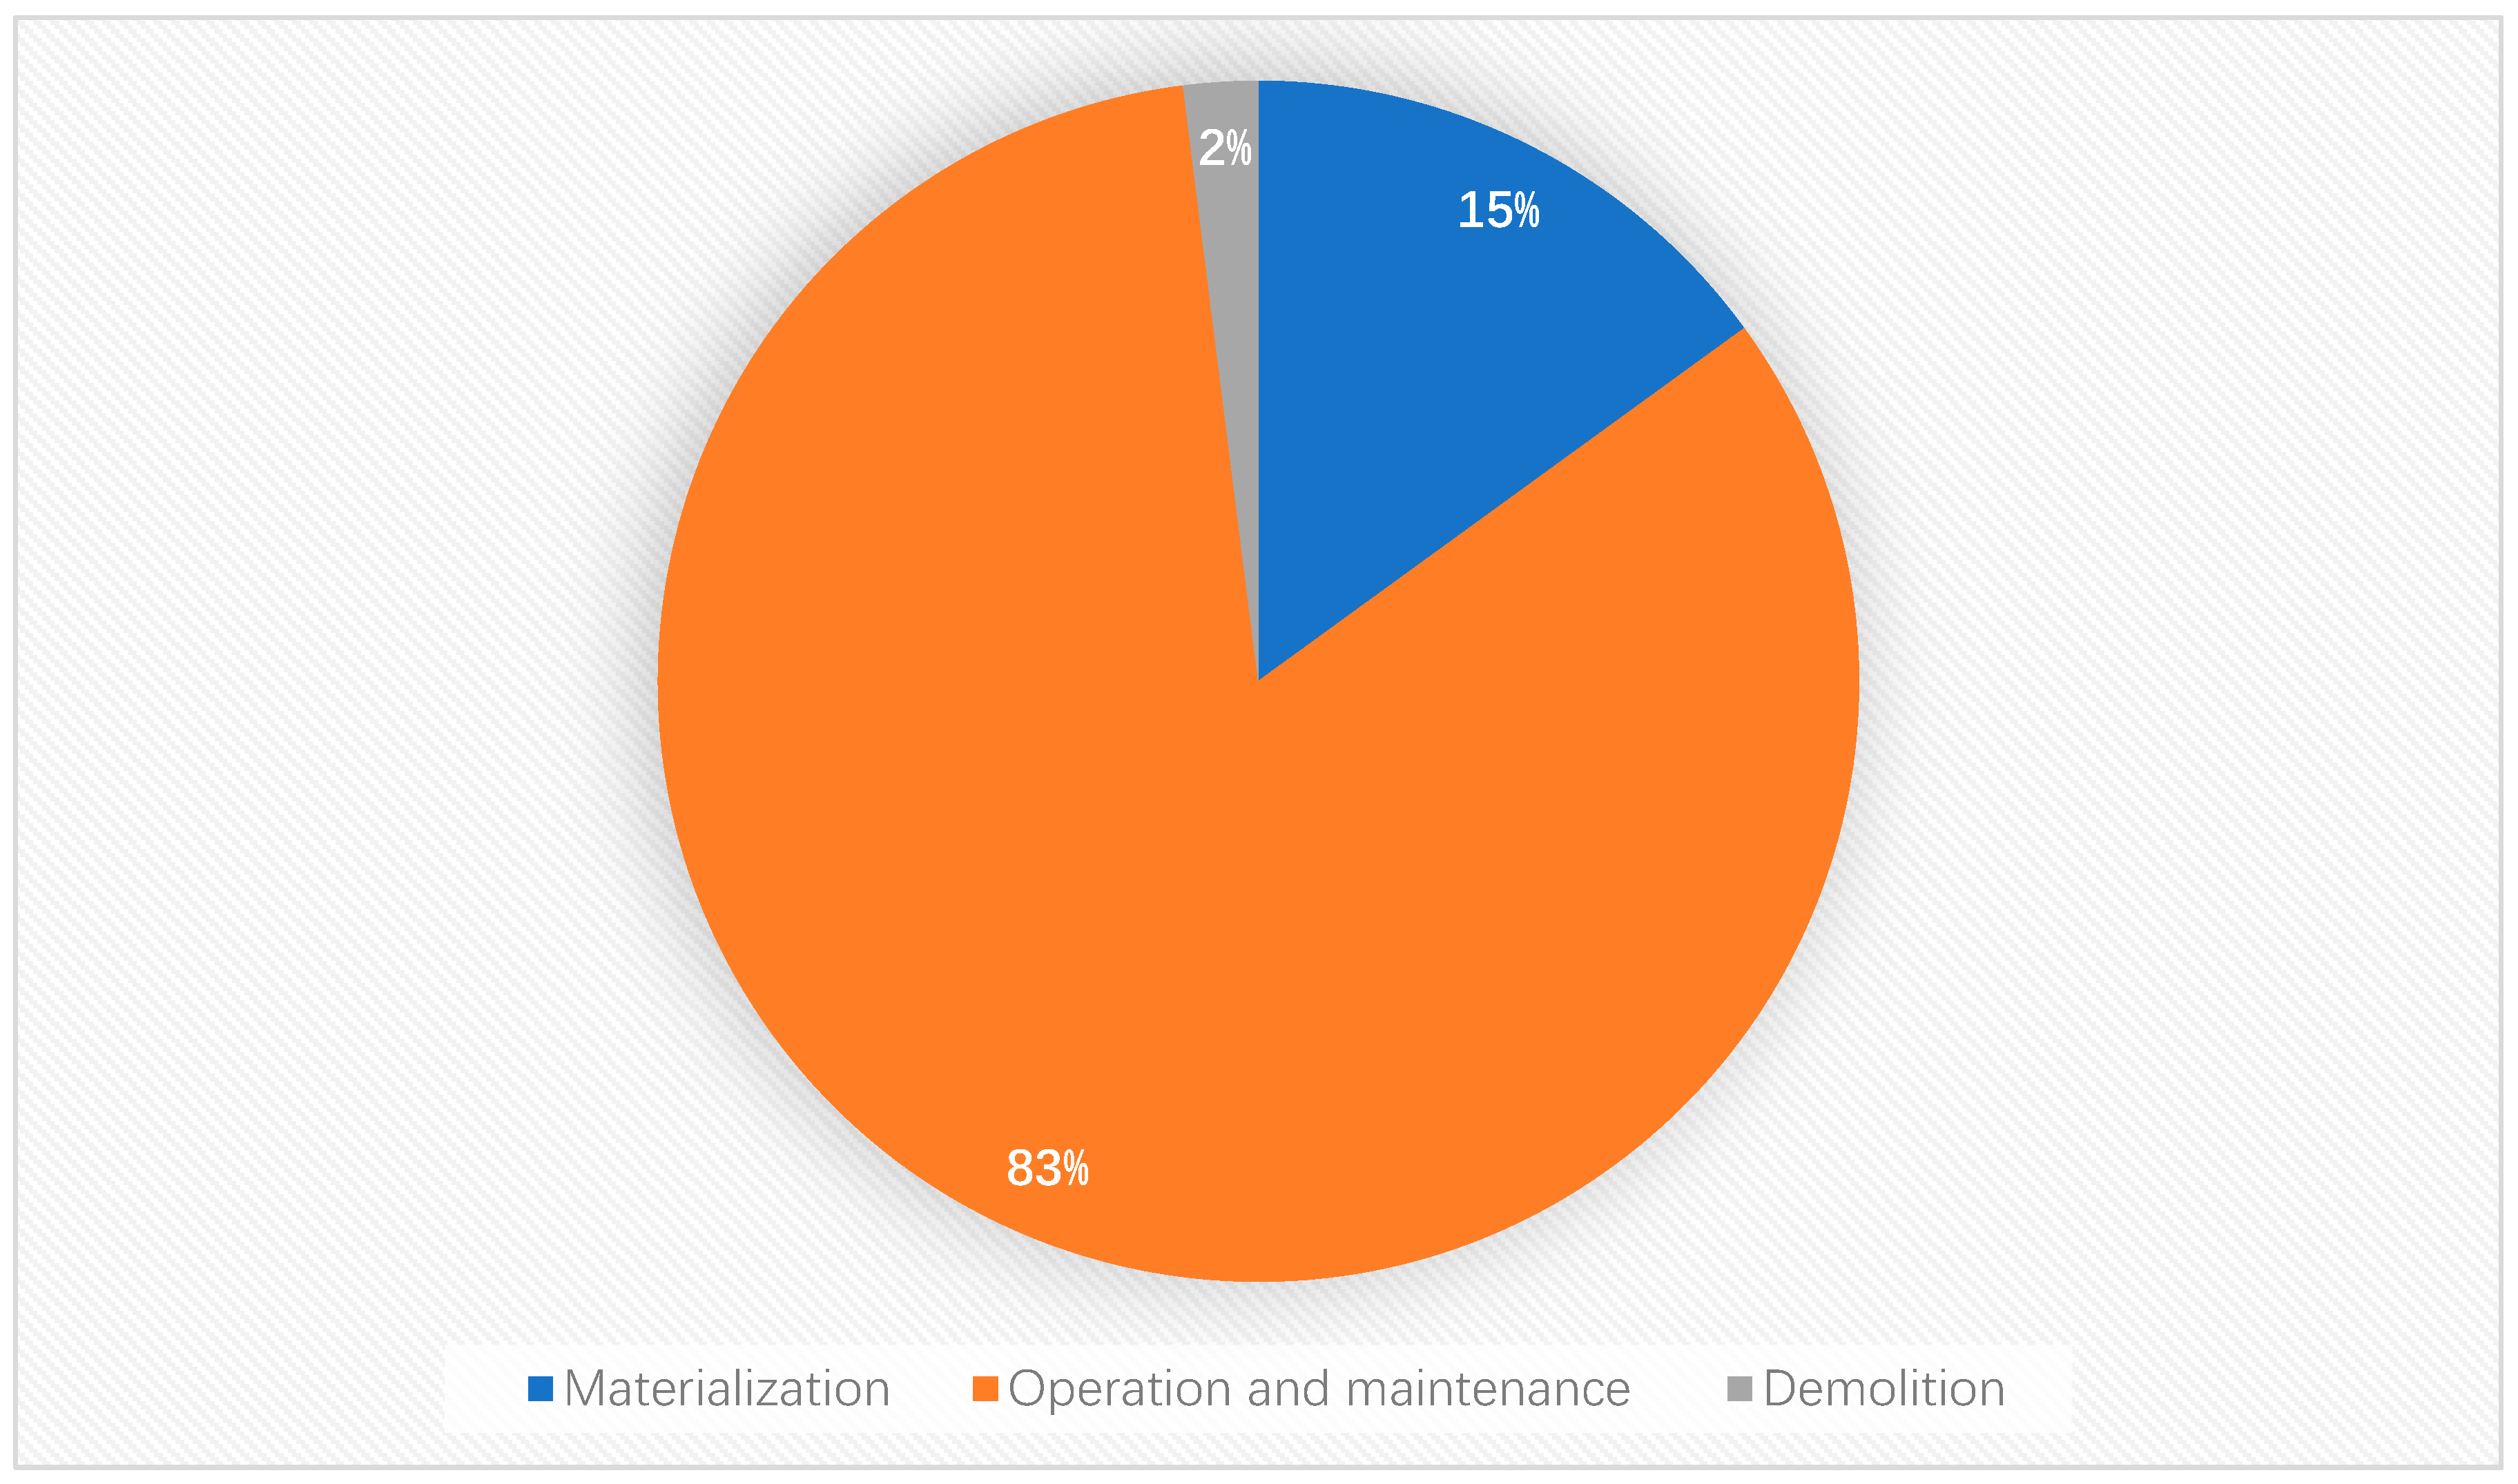
3.3. GGE from Different Stages

Figure 8 compares the amount of GGE from different stages throughout the whole life cycle of the GICM. It can be seen that the GGE generated during the operation and maintenance stage account for over 80% of the total amount throughout the whole life cycle of this museum, which is much more than that of residential buildings (at the level of about 65%) [41,42,43]. Museum buildings are very complicated buildings with specific activities and energy consumptions that have significant impacts on the operation and maintenance stage. Firstly, the museum usually serves the population of the whole city and even tourists from other countries, meaning that and the number of daily visitors and staff is higher than that of residential buildings. Because of the requirements for human comfort, more energy is consumed during the operation and maintenance stage for air conditioning and lighting. In addition, some collections in the museum also need strict preservation conditions, such as a special temperature and humidity, which need specialized equipment [33,44]. It further increases the burden of energy consumption.
The figure also indicates that the operation and maintenance stage is the key link in GGE reduction for large-scale public buildings, which is consistent with previous studies [34,40,45,46]. Managers can adopt measures, such as using more energy-efficient facilities and improving users’ behavior to further improve the sustainability and environmental performance of a building. The results once again prove the shortcoming of exiting green build assessment standards that sometimes lead to irrational assessment results because they pay less attention to the operation and maintenance stage. Moreover, the proportion of GGE generated from the demolition stage is only 2%, which is not important to the LCGGE of a building.

3.4. Limitations of Proposed Method

The proposed method combines LCA and BIM and comprehensively applies two different pieces of BIM software. It can be used to estimate the LCGGE of a building and overcome the shortcomings of exiting green building assessment standards. However, there are some limits. Firstly, BIM-based design is not prevalent in China’s market. It takes much time to transfer traditional CAD drawings to BIM model. Secondly, the interoperability between different BIM platforms is not good. Some incompatibility problems occur when the model established by Revit is imported into other platforms including Deignbuilder.

4. Conclusions and Recommendations

4.1. Conclusions

The use of previous green building assessment standards that usually do not pay sufficient attention to the operation and maintenance stage is likely to result in inaccurate assessment results. Therefore, this paper proposed a green building assessment method that combines LCA and BIM by calculating the LCGGE of a building. The GICM, a large-scale public building, was selected for case study for validating the developed model. The following conclusions were drawn from this study:
(1)
The LCGGE of a building can be divided into three stages: the materialization stage, the operation and maintenance stage, and the demolition stage based on the theory. BIM, as an advanced information technology in the construction industry, can help provide the required data for LCA.
(2)
During the materialization stage, concrete and steel are the most important source of GGE among all building materials. The reduction of the waste of concrete and steel is valuable for GGE reduction.
(3)
For regions with hot summers and warm winters, the GGE of a building in summer is the most throughout out the whole year during the operation and maintenance stage.
(4)
For large-scale public buildings, the GGE during the operation and maintenance stage accounts for over 80% of the LCGGE of a building, which is much higher than that of residential buildings. Therefore, the operation and maintenance stage plays the most important role in energy saving and emissions reduction for a large-scale building.
(5)
The demolition stage is less important in GGE reduction compared with the other two stages.
In summary, the combination of LCA and BIM in green building assessment can help people to deeply understand how the construction industry interacts with the environment, so as to build a sustainable living environment.

4.2. Recommendations

For future research, the following research directions deserve scholarly attention:
(1)
The compatibility of different BIM platforms should be improved in the future.
(2)
This paper fails to test the effects of different GGE reduction measures, such as adopting recycled materials or using additional energy-efficient facilities. In the future, studies should focus on seeking the best way to achieve green buildings with the lowest LCGGE.
(3)
For developing countries such as China, the urbanization process is less than 50 years old and it is difficult to find the early data regarding building energy consumption that may have been lost. Therefore, we hope to have better data to modify the established energy analysis model in future studies.

Author Contributions

Conceptualization, B.C., J.L. and V.W.Y.T.; methodology, B.C. and J.L.; formal analysis, B.C. and J.L.; writing—original draft preparation, B.C. and M.Y.; writing—review and editing, V.W.Y.T. and D.C.; visualization, J.L.; supervision, V.W.Y.T. and D.C.; project administration, B.C.; funding acquisition, D.C. B.C., J.L. and V.W.Y.T. contributed equally to this work. All authors have read and agreed to the published version of the manuscript.

Funding

This research was funded by Nature Science Research Project of Anhui Province (1908085ME173), National Innovation Training Program for College Students; and Australian Research Council (DP190100559).

Acknowledgments

We thank K. Jing to provide initial drawings of the project.

Conflicts of Interest

The authors declare no conflict of interest.

References

  1. Ghaffarianhoseini, A.H.; Dahlan, N.D.; Berardi, U.; Ghaffarianhoseini, A.; Makaremi, N.; Ghaffarianhoseini, M. Sustainable energy performances of green buildings: A review of current theories, implementations and challenges. Renew. Sustain. Energy Rev. 2013, 25, 1–17. [Google Scholar] [CrossRef]
  2. United Nations Environment Programme (UNEP). Buildings and Climate Change: Summary for Decision-Makers; UNEP Sustainable Building and Climate Initiative: Paris, France, 2009; pp. 2–11. [Google Scholar]
  3. Šujanová, P.; Rychtáriková, M.; Sotto Mayor, T.; Hyder, A. A Healthy, Energy-Efficient and Comfortable Indoor Environment, a Review. Energies 2019, 12, 1414. [Google Scholar] [CrossRef] [Green Version]
  4. Lai, X.; Liu, J.; Qian, S.; Georgiev, G.; Wu, G. Driving forces for low carbon technology innovation in the building industry: A critical review. Renew. Sustain. Energy Rev. 2017, 74, 299–315. [Google Scholar] [CrossRef]
  5. Lavy, S.; Dixit, M.K. Literature review on design terror mitigation for facility managers in public access buildings. Facilities 2010, 28, 542–563. [Google Scholar] [CrossRef] [Green Version]
  6. Feng, Y.P.; Yong, W.; Liu, C.B. Energy-efficiency supervision systems for energy management in large public buildings: Necessary choice for china. Energy Policy 2009, 37, 2060–2065. [Google Scholar]
  7. He, J.; Yan, Z.F.; Liu, H.J. On the current energy consumption and countermeasures of large public buildings in china. Adv. Mater. Res. 2011, 374–377, 840–842. [Google Scholar] [CrossRef]
  8. Xu, Z.; Lau, S. Introduction to the building research establishment environmental assessment method (breeam) in UK. New Archit. 2002, 80, 55–58. [Google Scholar]
  9. Wu, P.; Mao, C.; Wang, J.; Song, Y.; Wang, X. A decade review of the credits obtained by leed v2.2 certified green building projects. Build. Environ. 2016, 102, 167–178. [Google Scholar] [CrossRef]
  10. Lin, H.Y.; Chen, Z.J.; Ye, L. Interpretation of GB/T50378-2014 national standard green building evaluation standard. Constr. Sci. Technol. 2014, 16, 10–14. (In Chinese) [Google Scholar]
  11. Li, Y.; Li, Y.; He, B.; Zhao, D. Green building in china: Needs great promotion. Sustain. Cities Soc. 2014, 11, 1–6. [Google Scholar] [CrossRef]
  12. Spinoza, O.; Buehlmann, U.; Smith, B. Forest certification and green building standards: Overview and use in the U.S. hardwood industry. J. Clean. Prod. 2012, 33, 30–41. [Google Scholar] [CrossRef]
  13. Zhang, Y.; Wang, J.; Hu, F.; Wang, Y. Comparison of evaluation standards for green building in china, britain, united states. Renew. Sustain. Energy Rev. 2017, 68 Pt P1, 262–271. [Google Scholar] [CrossRef]
  14. Amiri, A.; Ottelin, J.; Sorvari, J. Are leed-certified buildings energy-efficient in practice? Sustainability 2019, 11, 1672. [Google Scholar] [CrossRef] [Green Version]
  15. Lee, W.L.; Burnett, J. Benchmarking energy use assessment of hk-beam, breeam and leed. Build. Environ. 2008, 43, 1882–1891. [Google Scholar] [CrossRef]
  16. Law, C.H.; Yang, J.K.; Jiang, X.Y. Building energy simulation for leed qualification on a commercial building in china. Appl. Mech. Mater. 2012, 193–194, 258–269. [Google Scholar] [CrossRef]
  17. Jeroen, B. Guinee. Handbook on life cycle assessment operational guide to the iso standards. Int. J. Life Cycle Assess. 2002, 7, 311. [Google Scholar]
  18. Göran, F.; Michael Tomas, E.; Jeroen, G.; Sangwon, S. Recent developments in life cycle assessment. J. Environ. Manag. 2009, 91, 1–21. [Google Scholar]
  19. Cabeza, L.F.; Rincón, L.; Vilariño, V.; Pérez, G.; Castell, A. Life cycle assessment (lca) and life cycle energy analysis (lcea) of buildings and the building sector: A review. Renew. Sustain. Energy Rev. 2014, 29, 394–416. [Google Scholar] [CrossRef]
  20. Agrawal, B.; Tiwari, G.N. Life cycle cost assessment of building integrated photovoltaic thermal (bipvt) systems. Energy Build. 2010, 42, 1472–1481. [Google Scholar] [CrossRef]
  21. Khasreen, M.; Banfill, P.F.; Menzies, G. Life-cycle assessment and the environmental impact of buildings: A review. Sustainability 2009, 1, 674–701. [Google Scholar] [CrossRef]
  22. Rowlinson, S.; Collins, R.; Tuuli, M.M.; Jia, Y. Implementation of Building Information Modeling (BIM) in construction: A comparative case study. Aip Conf. Proc. 2010, 1233, 572–577. [Google Scholar]
  23. Habib, A.; Das, N.G.; Hossain, M.B. Retracted: Case study of carbon emissions from a building’s life cycle based on bim and ecotect. Pak. J. Biol. Sci. 2017, 2017, 193505. [Google Scholar]
  24. Martin, P. Building information modelling (bim) based energy analysis and response to low carbon construction innovations. Clin. Chem. 2013, 37, 111–112. [Google Scholar]
  25. Röck, M.; Hollberg, A.; Habert, G.; Passer, A. Lca and bim: Visualization of environmental potentials in building construction at early design stages. Build. Environ. 2018, 140, 153–161. [Google Scholar] [CrossRef]
  26. Eleftheriadis, S.; Mumovic, D.; Greening, P. Life cycle energy efficiency in building structures: A review of current developments and future outlooks based on bim capabilities. Renew. Sustain. Energy Rev. 2017, 67, 811–825. [Google Scholar] [CrossRef] [Green Version]
  27. Robert, B. Evaluation of maturity of bim tools across different software platforms. Procedia Eng. 2016, 164, 481–486. [Google Scholar]
  28. Feng, J.; Zhang, J.P.; Gao, S.P. Chooseing suitable bim software for engineering projects based on the fuzzy neural network evaluation model. Appl. Mech. Mater. 2013, 405–408, 3348–3351. [Google Scholar] [CrossRef]
  29. Asojo, A.O. An instructional design for building information modeling (bim) and revit in interior design curriculum. Art Des. Commun. High. Educ. 2012, 11, 143–154. [Google Scholar] [CrossRef]
  30. Ashfaque, A.C.; Rasul, M.G.; Khan, M.M.K. Thermal-comfort analysis and simulation for various low-energy cooling-technologies applied to an office building in a subtropical climate. Appl. Energy 2008, 85, 449–462. [Google Scholar]
  31. Tullio, R.; Iole, N.; Dario, A.; Domenica, P. Is a self-sufficient building energy efficient? Lesson learned from a case study in mediterranean climate. Appl. Energy 2018, 218, 131–145. [Google Scholar]
  32. Sartori, I.; Hestnes, A.G. Energy use in the life cycle of conventional and low-energy buildings: A review article. Energy Build. 2007, 39, 249–257. [Google Scholar] [CrossRef]
  33. Lucchi, E. Simplified assessment method for environmental and energy quality in museum buildings. Energy Build. 2016, 117, 216–229. [Google Scholar] [CrossRef]
  34. Peng, C. Calculation of a building’s life cycle carbon emissions based on Ecotect and building information modeling. J. Clean. Prod. 2016, 112, 453–465. [Google Scholar] [CrossRef]
  35. Penman, J.; Gytarsky, M.; Hiraishi, T.; Irving, W.; Krug, T. The National Greenhouse Gas Inventories Programme. In 2006 IPCC Guidelines for National Greenhouse Gas Inventories; Eggleston, H.S., Buendia, L., Miwa, K., Ngara, T., Tanabe, K., Eds.; IGES: Hayama, Japan, 2006. [Google Scholar]
  36. Xiao, Z.; Jian, G.; Yan, Y. Research of co2 emission of residential buildings in zhejiang province based on life cycle assessment. Adv. Mater. Res. 2012, 461, 255–258. [Google Scholar]
  37. Hui, J.J.; Wu, Z.W.; Yuan, L.Z.; Jun, B. Life cycle energy consumption and co2 emission of an office building in china. Int. J. Life Cycle Assess. 2012, 17, 105–118. [Google Scholar]
  38. Zhang, X.L.; Shen, L.Y.; Zhang, L. Life cycle assessment of the air emissions during building construction process: A case study in Hong Kong. Renew. Sustain. Energy Rev. 2013, 17, 160–169. [Google Scholar] [CrossRef]
  39. Department of Climate Change, National Development and Reform Commission. 2012 Baseline Emission Factors for Regional Power Grids in China. Available online: http://qhs.mee.gov.cn/kzwsqtpf/201812/W020181220585205729251.pdf (accessed on 11 January 2020). (In Chinese)
  40. Lu, K.; Jiang, X.; Tam, V.W.; Li, M.; Wang, H.; Xia, B.; Chen, Q. Development of a Carbon Emissions Analysis Framework Using Building Information Modeling and Life Cycle Assessment for the Construction of Hospital Projects. Sustainability 2019, 11, 6274. [Google Scholar] [CrossRef] [Green Version]
  41. Zhang, X.; Wang, F. Life-cycle assessment and control measures for carbon emissions of typical buildings in China. Build. Environ. 2015, 86, 89–97. [Google Scholar] [CrossRef]
  42. Zhang, Y.; Zheng, X.; Zhang, H.; Chen, G.; Wang, X. Carbon emission analysis of a residential building in China through life cycle assessment. Front. Environ. Sci. Eng. 2016, 10, 150–158. [Google Scholar] [CrossRef]
  43. Li, D.; Cui, P.; Lu, Y. Development of an automated estimator of life-cycle carbon emissions for residential buildings: A case study in Nanjing, China. Habitat Int. 2016, 57, 154–163. [Google Scholar] [CrossRef]
  44. Lucchi, E. Review of preventive conservation in museum buildings. J. Cult. Herit. 2018, 29, 180–193. [Google Scholar] [CrossRef]
  45. Najjar, M.; Figueiredo, K.; Hammad, A.W.; Haddad, A. Integrated optimization with building information modeling and life cycle assessment for generating energy efficient buildings. Appl. Energy 2019, 250, 1366–1382. [Google Scholar] [CrossRef]
  46. Hollberg, A.; Genova, G.; Habert, G. Evaluation of BIM-based LCA results for building design. Autom. Constr. 2020, 109, 102972. [Google Scholar] [CrossRef]
Figure 1. Guangdong Inkstone Culture Museum (GICM).
Sustainability 12 00685 g001
Figure 2. Goal and accounting scope.
Sustainability 12 00685 g002
Figure 3. The three-dimensional rendering of the GICM model created in Revit.
Sustainability 12 00685 g003
Figure 4. Model of the GICM in Designbuilder.
Sustainability 12 00685 g004
Figure 5. Simulation results of energy consumption of the GICM.
Sustainability 12 00685 g005
Figure 6. GGE from different building materials (t).
Sustainability 12 00685 g006
Figure 7. Monthly GGE generated by the GICM during the operation and maintenance stage (t).
Sustainability 12 00685 g007
Figure 8. Proportion of GGE from different life cycle stages.
Sustainability 12 00685 g008
Table 1. Main building materials used in the GICM.
MaterialsQuantity (t)
Concrete32,730.26
Steel1339.34
Brick4371.12
Stone1134.18
Glass252.57
Wood267.84
Sand991.82
Aluminum294.05
Total41,381.18
Note: In the table, stone refers to stone used for walls, pavements, and decorations. Class 2 construction stone is used in this building. In addition, sand is applied for floor tile laying, the basement treatment of wall tiles, wall plastering, and many other works. However, the stone and sand used for concrete aggregates have been calculated in the amount of concrete. There are no duplicate statistics here.
Table 2. Unit energy consumption and greenhouse gas emissions (GGE) in material production.
Building MaterialsEnergy Consumption (KJ/kg)GGE(t/t)
Concrete1247.740.2420
Brick20000.2
Stone12,9432.33
Steel33,9062.208
Glass16,0001.4
Wood18000.2
Sand40000.9
Aluminum12,9641.407
Note: The ability for reuse and recycling should be taken into consideration when accounting the material consumption and GGE from the perspective of the entire life cycle. Materials associated with reuse and recycling mainly include steel, aluminum extrusion, architectural glass, and wood. In this study, the data of metal martials including steel and aluminum has already considered reuse and recycling. Architectural glass and wood are also able to be partially or fully recycled, and recycled glass and wood usually cannot be reused in buildings directly. Thus, the reuse and recycling of glass and wood is not considered in this study.
Table 3. Calculation temperature of outdoor weather in Guangdong.
DesignationTemperature
Outdoor dry bulb temperature in summer33.5 °C
Outdoor wet bulb temperature in summer27.7 °C
Outdoor dry bulb temperature in winter5 °C
Outdoor wet bulb temperature in winter1.3 °C
Table 4. GGE generated by the production of different materials.
Building MaterialsAmount (t)Carbon Emission Factor (t/t)GGE (t)
Concrete32,730.260.24207920.72
Steel1339.342.2082957.26
Brick4371.120.2874.22
Stone1134.182.332642.64
Glass252.571.4353.60
Wood267.840.253.57
Sand991.820.9892.64
Aluminum294.051.407413.73
Table 5. Monthly energy consumption of the GICM.
Date/TimeAir ConditioningLighting (kWh)Other Equipment (kWh)Total (kWh)
Heating (kWh)Cooling (kWh)
January8215.371958.2266,555.8420,653.0297,382.45
February9029.392265.5960,114.9518,654.3490,064.27
March3585.6324,788.9366,555.8420,653.02115,583.40
April056,240.3064,408.8819,986.79140,636.00
May0121,786.9066,555.8420,653.02208,995.80
June0144,530.7064,408.8819,986.79228,926.40
July0182,396.2066,555.8420,653.02269,605.10
August0168,889.8066,555.8420,653.02256,098.70
September0146,424.7064,408.8819,986.79230,820.40
October085,750.8966,555.8420,653.02172,959.80
November312.2537,371.4864,408.8819,986.79122,079.40
December2945.425365.8566,555.8420,653.0295,520.13

