Article

Sustainable Traffic Management in an Urban Area: An Integrated Framework for Real-Time Traffic Control and Route Guidance Design

1
Department of Civil Engineering, University of Salerno, via Giovanni Paolo II, 132, 84084 Fisciano (SA), Italy
2
Department of Mobility, Infrastructures and Public works, Municipality of Naples, piazza Municipio, 80133 Naples, Italy
3
Department of Civil, Architectural and Environmental Engineering, University of Naples “Federico II” via Claudio 21, 80125 Naples, Italy
*
Author to whom correspondence should be addressed.
Sustainability 2020, 12(2), 726; https://0-doi-org.brum.beds.ac.uk/10.3390/su12020726
Submission received: 2 December 2019 / Revised: 1 January 2020 / Accepted: 3 January 2020 / Published: 19 January 2020
(This article belongs to the Special Issue Sustainable Mobility: Social, Technological and Environmental Issues)

Abstract

:
This paper focuses on the presentation of an integrated framework based on two advanced strategies, aimed at mitigating the effect of traffic congestion in terms of performance and environmental impact. In particular, the paper investigates the “operational benefits” that can be derived from the combination of traffic control (TC) and route guidance (RG) strategies. The framework is based on two modules and integrates a within-day traffic control method and a day-to-day behavioral route choice model. The former module consists of an enhanced traffic control model that can be applied to design traffic signal decision variables, suitable for real-time optimization. The latter designs the information consistently with predictive user reactions to the information itself. The proposed framework is implemented to a highly congested sub-network in the city center of Naples (Italy) and different scenarios are tested and compared. The “do nothing” scenario (current; DN) and the “modeled compliance” (MC) scenario, in which travelers’ reaction to the information (i.e., compliance) is explicitly represented. In order to evaluate the effectiveness of the proposed strategy and the modeling framework, the following analyses are carried out: (i) Network performance analysis; (ii) system convergence and stability analysis, as well as the compliance evolution over time; (iii) and emissions and fuel consumption impact analysis.

1. Introduction and Motivation

The current main challenge of any urban system deals with the externalities produced by the road transportation system. It is well-known that about 50% of pollution is from road transport and, in particular, from internal combustion engines [1]. Within this context, different actions have been deployed in the last few decades to reduce pollution, such as acting on the vehicle technology [2] or different types of fuels [3], and through different and sophisticated mobility/travel demand management policies [4] or traffic flow control strategies.
Among the traffic flow control strategies, one of the most challenging ones consists of addressing the problem at the transportation network level by implementing proper strategies for the reduction of traffic congestion.
In this vein, new technologies deployed in the Intelligent Transportation Systems framework may easily support drivers to adopt a more sustainable behavior and/or may allow a more sustainable management of traffic flows. In particular, real-time traffic control (TC) [5] and Route Guidance (RG) [6] represents one of the most effective strategies, as also highlighted by the EU project CARBOTRAF [7], in which TC and variable message signs (VMSs) have been jointly used to reduce CO2 and black carbon emissions.
The present paper aims to investigate the effectiveness of the joint implementation of a RG strategy and two simultaneous TC strategies. Indeed, existing studies have singularly investigated the effectiveness of TC strategies (e.g., single junction SIGSET, [8], network optimization, [9], link or subarea control [10]), or RG in terms of route choice [11], compliance [12] and effectiveness of the information [13], whereas, joint implementation is rather overlooked in the literature in both, the application and methodological levels [14,15,16].
The main research challenge lies in the design of most effective/sustainable traffic control decision variables and in the design of the most effective/sustainable information to give to the system users. In particular, the present paper implements a RG strategy and two simultaneous TC strategies, namely link metering (LM) and signal settings synchronization for urban networks (network traffic control—NTC), including stage sequence optimization (i.e., scheduled synchronization [17,18]). The following issues have been addressed:
  • The design of decision/control variables for network control and link control;
  • The day-to-day updating behavior of users under the route guidance information system;
  • The development of the whole framework based on combinations of TC and RG.
To this end, an integrated and effective modeling framework, based on a within-day and day-to-day dynamics, is required (Figure 1). The framework is composed of two modules (Traffic control and Route Guidance), and the inputs and outputs of each iteratively interact through a microscopic traffic flow model.
The TC module is composed of two sub-modules, namely, Network Traffic Control (NTC; [17]) and link metering (LM; [19,20]). The NTC is fed by flows which are modeled through a macroscopic approach and are forecasted through a traffic flow prediction model, based on a rolling horizon procedure. The LM is fed by occupancies and flows, which are directly derived from a microscopic traffic flow simulation. The considered traffic control module is an extended implementation of the module already proposed in [19].
The RG module consists of a compliance model, which is able to simulate the day-to-day user reactions to the information. The experienced travel times on the previous day, t − 1, and the experienced reliability during t − 1 are some of the attributes considered in the compliance model.
In the joint model simulation, an iterative procedure, which is able to guarantee the consistency of user behavior, information, and traffic signal decision variables, is also included.
The proposed framework was applied to a real sub-network, represented by the highly congested city center of Naples, Italy. In particular, three scenarios were considered and compared, depending on the information provided to the users. These included scenarios in which travelers are not provided with information; a second scenario in which forced rerouting (FR) is assumed (FR scenario); a third scenario in which travelers are provided with prescriptive information (on estimated shortest route) and the travelers’ reaction to the information is explicitly taken into account. Regarding the third scenario, travelers’ reactions are investigated through a compliance model (modeled compliance—MC scenario) and supposing a fixed rate of compliance (parametric high compliance—PC-H scenario).
The numerical results are analyzed in terms of within-day dynamics with respect to the queue lengths and the total delay as well as in terms of day-to-day dynamics with respect to the system convergence and solution stability. The within-day analysis also focuses on the evaluation of the environmental impacts with respect to the consumption and emission indicators.
The remainder of the paper is organized as follows: Section 2 provides a brief state-of-the-art description with respect to TC and RG strategies and summarizes the research goals. All details about the proposed framework are discussed in terms of the methodology used in Section 3. In Section 4, the considered case study is briefly presented, while in Section 5 the results of numerical applications are displayed. Finally, Section 6 mainly focuses on the conclusions, discussion, and presentation of future perspectives.

2. State of Play and Research Goals

In this section, an overview of state-of-the-art TC and RG strategies is provided in order to highlight the main paper contributions, respectively, with reference to the joint simulation of TC-RG, the TC, and the RG.
Regarding the joint implementation of TC and RG, some main contributions regarding the topic may be found in [15,16,21,22]. This topic presents challenges, since it requires an integrated and effective modelling framework, able to design traffic control decision variables and the information through the simulation of the within-day and day-to-day dynamics. In general, the main dynamic traffic assignment tools aim to analyze route guidance design and the traveler behavior modeling, while the considered traffic control approaches mainly focus on dynamic tolls and ramp metering rate optimizations.
Regarding TC, the main challenges in the literature, include the time-dependency of timing plan computation and the decision variables to be considered in the optimization procedure, as well as the objective function.
The above issues may be addressed through online or offline approaches. In the case of online applications, optimization may be pursued on the basis of real-time observed flows, including flow trajectories over time. The main research efforts for online implementations refer to junction or network control (e.g., MOVA [23], max pressure [24], SCOOT and SCAT [25,26], TUC [27], UTOPIA [28]), and to the link or sub-network control [29,30,31,32,33,34].
It must be highlighted that the whole TC module adopted in this paper, as described above, has already been tested in the literature in a within-day context of simulation (see [18]), but has yet to be tested in terms of day-to-day analysis. In particular, in [18], the main innovative contributions are concerned with (i) the combination of NTC and LM; (ii) the online application of the scheduled synchronization approach; and finally, (iii) the two-level optimization procedure combining two criteria, namely, total delay minimization and queue equi-distribution (see [33]).
As for TC, RG strategies rely on substantial scientific literature.
In general, several issues have been addressed in recent decades on RG. The main topics in the literature are about:
  • The route choice, the learning process modeling, and the traveler reactions to information;
  • The anticipatory route guidance problem, which affects the consistency between the experienced travel times and the provided information, as well as accurate information design;
  • How traveler behaviors affect network convergence and the stability of the achieved solution.
The main contributions are based on compliance modeling [13], switching/rerouting behavior [34], bound rationality and the role of inertia, risk perception [35], and the effect of information quality [36] on the change in traffic patterns and system convergence [37,38,39,40,41].
The second issue is concerned with the anticipatory route guidance problem, which is strictly related to information reliability. In general, any information system can be considered reliable if the given travel time is consistent with users’ expectations and experience. To this aim, a crucial issue is the prediction of users’ reactions to the information in order to properly estimate the users’ choices, and then the information to be provided. It can be addressed through a fixed-point formulation and solved through “heuristic procedures”, in which path flows and traffic conditions are determined simultaneously, through the evaluation of consistency among path flows, forecasted link conditions, designed information, and new path flows [36,40,41,42]. A further issue worthy of mention is network convergence and solution stability. In this regard, [43] has provided the stability analysis of equilibrium patterns in a transportation network, while [44] has studied the stability and attraction of traffic equilibria. Additionally, [45] simulates user updates in expected travel times with experienced travel times. Alternatively, [46] has investigated the extension of deterministic processes in the case of intelligent transportation systems. A study on day-to-day adaptation in the presence of information is given in [47]. More recently, [48] has provided a detailed analysis of within-day (steady state) static conditions, mainly focusing on the analysis of the TC and RG effect in terms of network convergence and solution stability. Furthermore, [49] has highlighted, in particular, the role of stochastic processes in practical applications of information systems, where users are provided with personal information and exhibit disaggregate behaviors.
With respect to RG, the paper’s contribution is threefold. Firstly, unlike the literature, in this paper, a compliance model which considers the accuracy of the information as endogenous variables is adopted. With regards to the anticipatory route guidance problem, the heuristic procedure proposed in [37] is adopted, therefore, the consistency of predicted (estimated) travel times can be evaluated by comparing them with actual users’ travel times. Finally, convergence and solution stability are investigated through the simulation approach (see [42]). Moreover, a further analysis of the compliance over the days is carried out, making it possible to better understand the relationship between the system evolution and the value of compliance in the stable configuration.

3. Solution Approach and Implementation

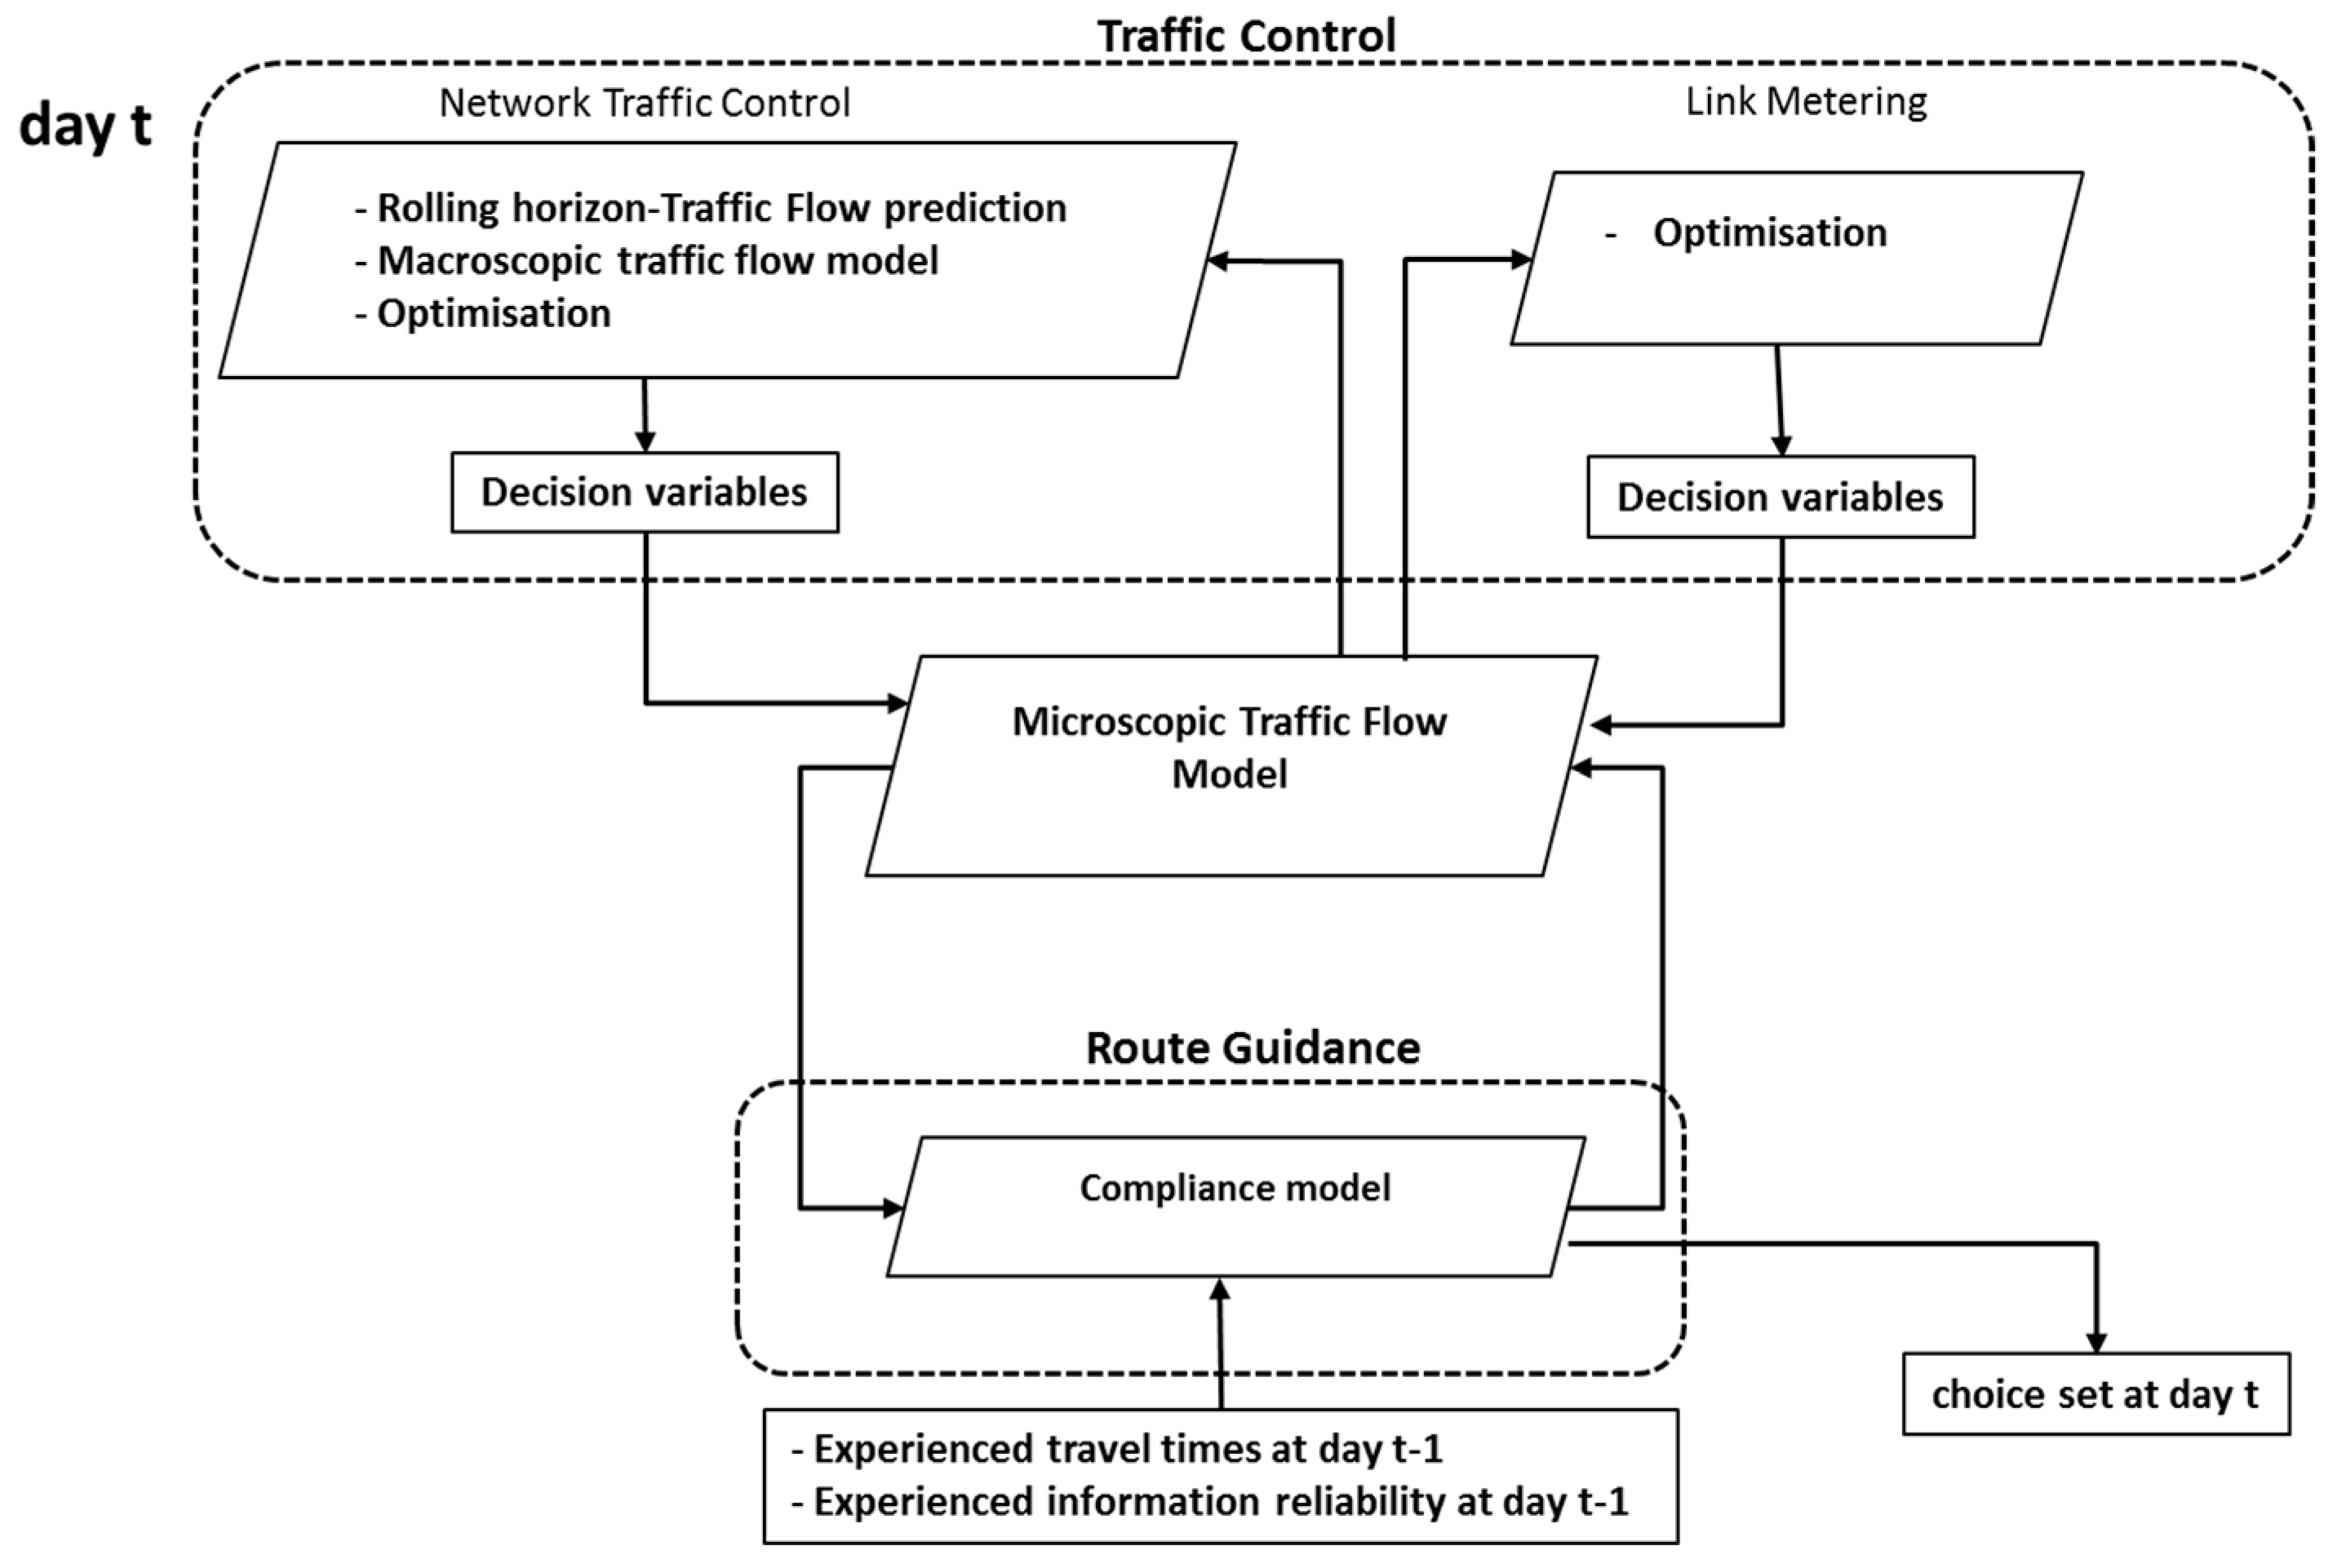
3.1. General Overview

The main modules in the proposed framework are as follows:
(1)
A within-day module for TC;
(2)
A choice model which implicitly simulates the RG effect in terms of compliance within the RG module;
(3)
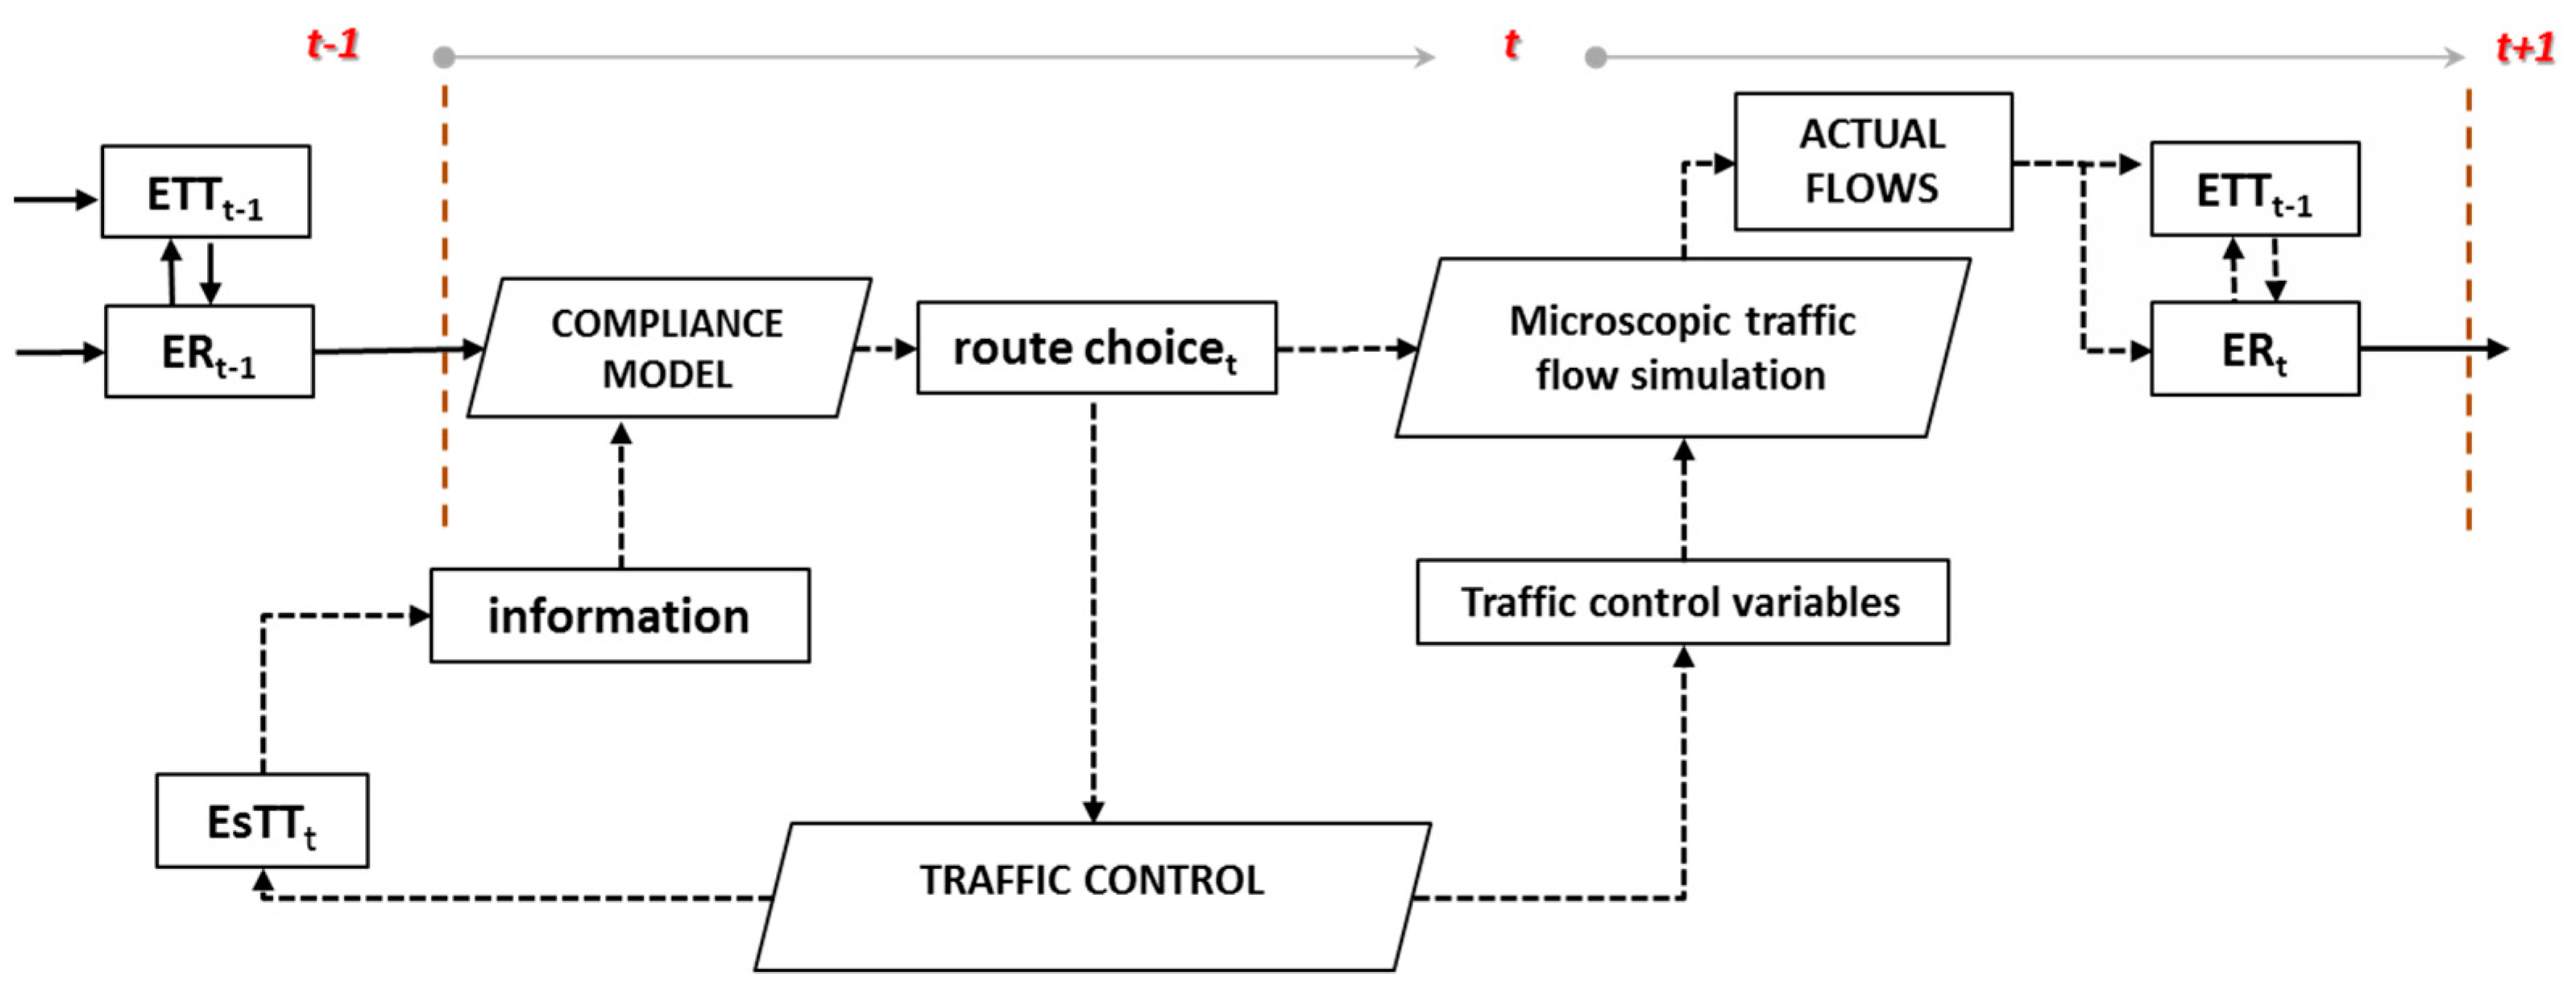
An iterative procedure for anticipatory route guidance which is able to model the consistency between user behavior and traffic signal decision variables, the consistency between information (EsTTt) and user behavior (ETTt − 1), and focus on information reliability (ERt − 1);
(4)
A microscopic traffic flow model able to jointly simulate the effect of users’ preferences and decision variable optimizations.
Each one of these modules is described in more detail in the following sections.

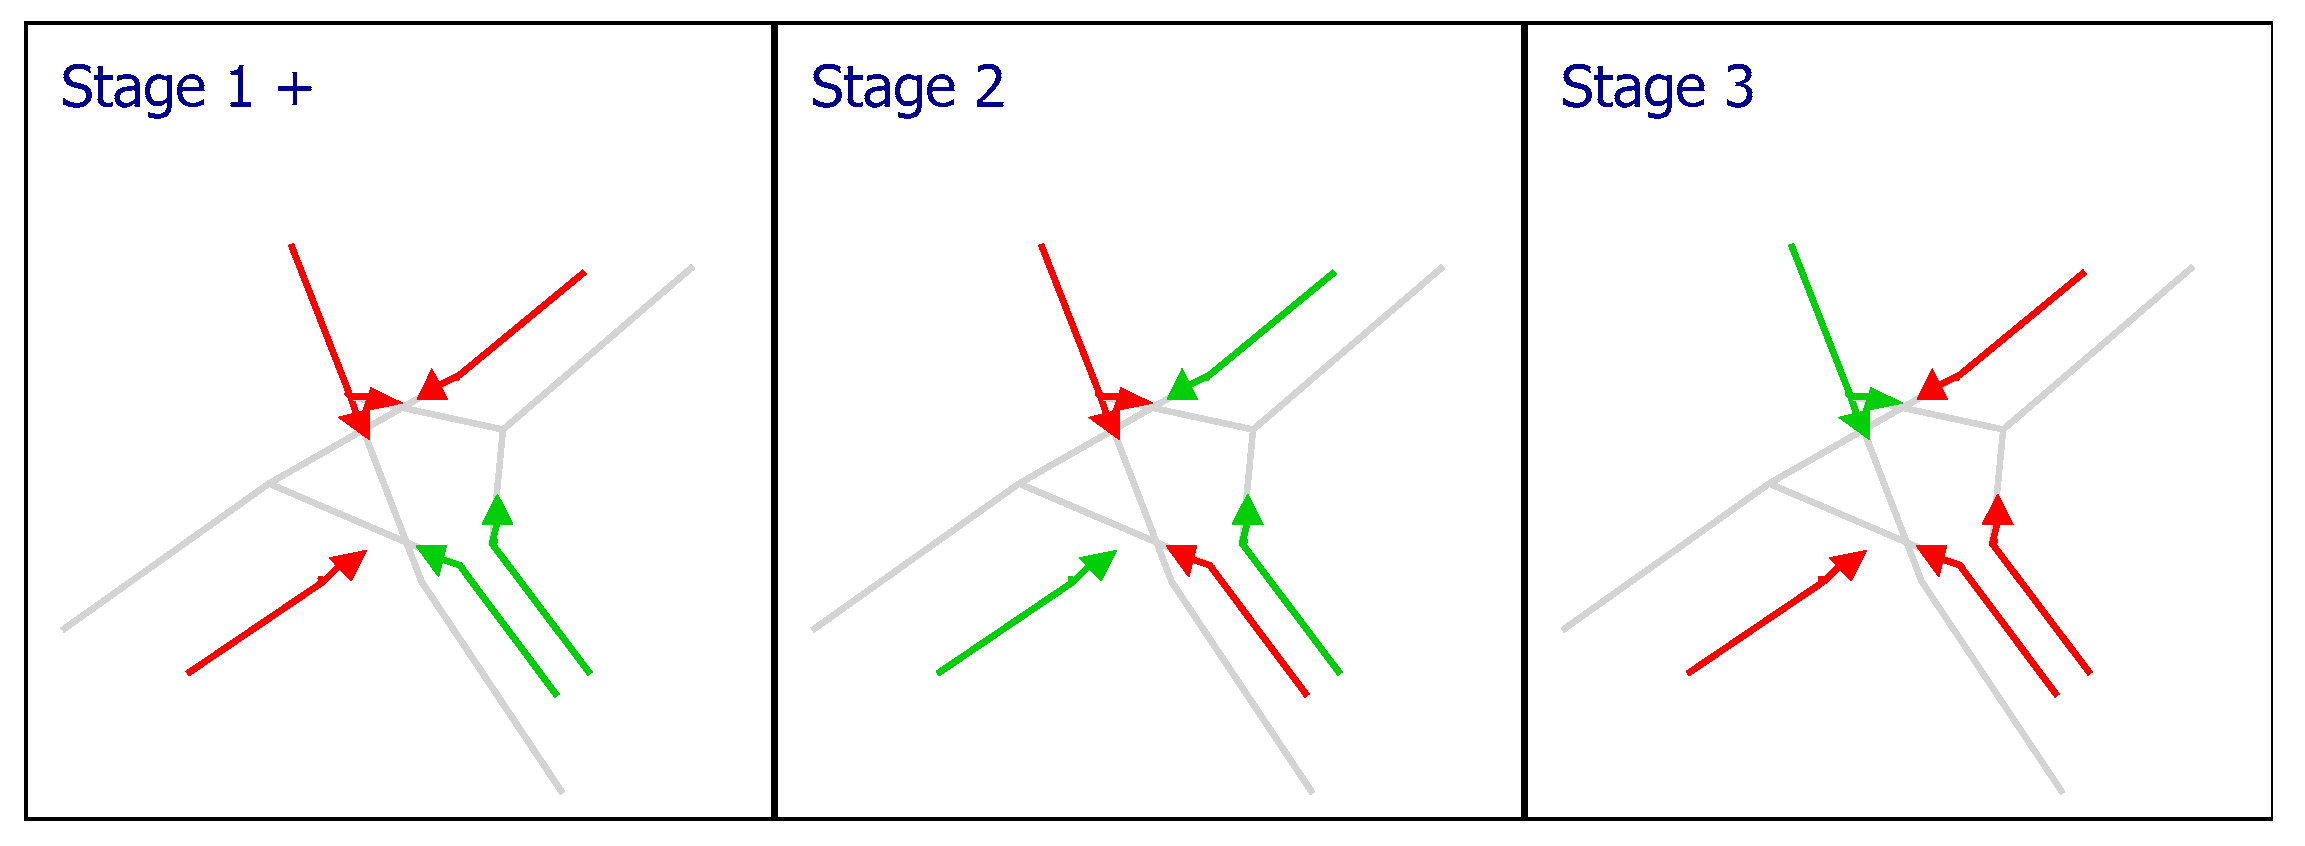
3.2. Traffic Control

A within-day framework combines a TC model based on the online scheduled synchronization approach (i.e., the procedure is able to optimize green timings, offsets, and stage sequences, also called NTC—Network Traffic Control) and a link metering method.
For the link metering, the input variables required for traffic control decision variable optimizations are based on a microscopic traffic flow model, while the input variables required for Network Traffic Control decision variable optimizations are based on a macroscopic traffic flow model (i.e., a Cell Transmission model; [50]). Furthermore, in order to guarantee the consistency between flows and decision variable optimizations, a traffic flow prediction model, based on a Kalman Filter (see [51] for a more detailed description) and a rolling horizon approach, have been adopted here. Finally, the Network Traffic Control simultaneously operates with the Link Metering method.
The Network Traffic Control may be classified as a mixed discrete–continuous linear optimization. In terms of the optimization procedure, a bi-level approach is pursued, where, at an upper level, the total delay minimization is considered, and, at the lower level, the minimization of the queue equidistribution criterion is adopted (see [33]). Here, we list the parameters and constraints used in the model:
Δ: Approach-stage incidence matrix, with entries δ kj = 1 if approach k is green during stage j and 0 otherwise;
c > 0: The cycle length;
t j ∊ [0, c]: The length of stage j as an optimization variable;
t ar ∊ [0, c]: The so-called all red period at the end of each stage;
l k ∊ [0, c]: The lost time for approach k, which is assumed to be known;
g k : The effective green for approach k;
g min The minimum value of the effective green;
q k > 0: The arrival flow for approach k, which is assumed to be known;
s k > 0: The saturation flow for approach k, which is assumed to be known;
b ∊ [0,1] and eventually t ∊ [1–3]: The discrete variables for stage sequence definition as decision variables;
i: The generic links;
r: The turning rates;
αl,r: The split ratio of the traffic demand in the lth link and rth movement;
γl,r: The number of lanes assigned to the r movements in the lth link;
Q l in : The total inflow;
q l , r out : The discharging capacity, expressed as vehicles/hour/lane;
t l , r : The sum of the signal phase ratios for the rth movement in the lth link;
For each junction i, let ϕ i ∊ [0, c] be the node offset between the start of a reference stage of junction i and the start of the reference stage of the first junction, which is used as a reference for the clock;
For each pair of (adjacent) junctions (i, h) in the network, let ϕ ih = ϕ h ϕ i = ϕ hi be the link offset between junctions i and h, which is needed for computing the total delay through a traffic flow model;
For the computation of delay, the method for interacting junctions has been adopted, and, in particular, the total network delay has been computed by combining each junction j and each approach k, the deterministic delay ( DTD k j ), and the stochastic and oversaturation term ( SOTD k j ) . Finally, the total delay is equal to the following formula:
T D = Σ j Σ k ( D T D k j + S O T D k j )
Regarding queue equidistribution, the following objective function has been considered:
f ( g k , ϕ i ) = l = 1 n r = 1 3 ( m a x ( α l , r Q l i n γ l , r q l , r o u t t l , r , 0 ) ) .
The proposed criterion aims to minimize the difference between the longitudinal capacity and the demand flow at each link.
With reference to the solution algorithm in this paper, meta-heuristic Simulated Annealing (see [17]), working on a single objective problem, has been adopted.
Concerning the adopted methodology for the link control implementation, the approaches proposed by [19,20,52] have been considered, which are based on occupancy as a control variable.
Here, we list the parameters used in the model:
k: The time step;
s: The section;
o ^ : The desired occupancy;
qs: The metered flow;
os: The observed occupancy;
Kp: The proportional gain;
Kl: The integral gain.
Regarding the control function, a proportional-integral-type (PI) feedback controller has been implemented, aiming to ensure the consistency between observed and desired occupancy.
q s ( k ) = q s ( k 1 ) K p [ o s ( k ) o s ( k 1 ) ] + K l [ o ^ o s ( k ) ]

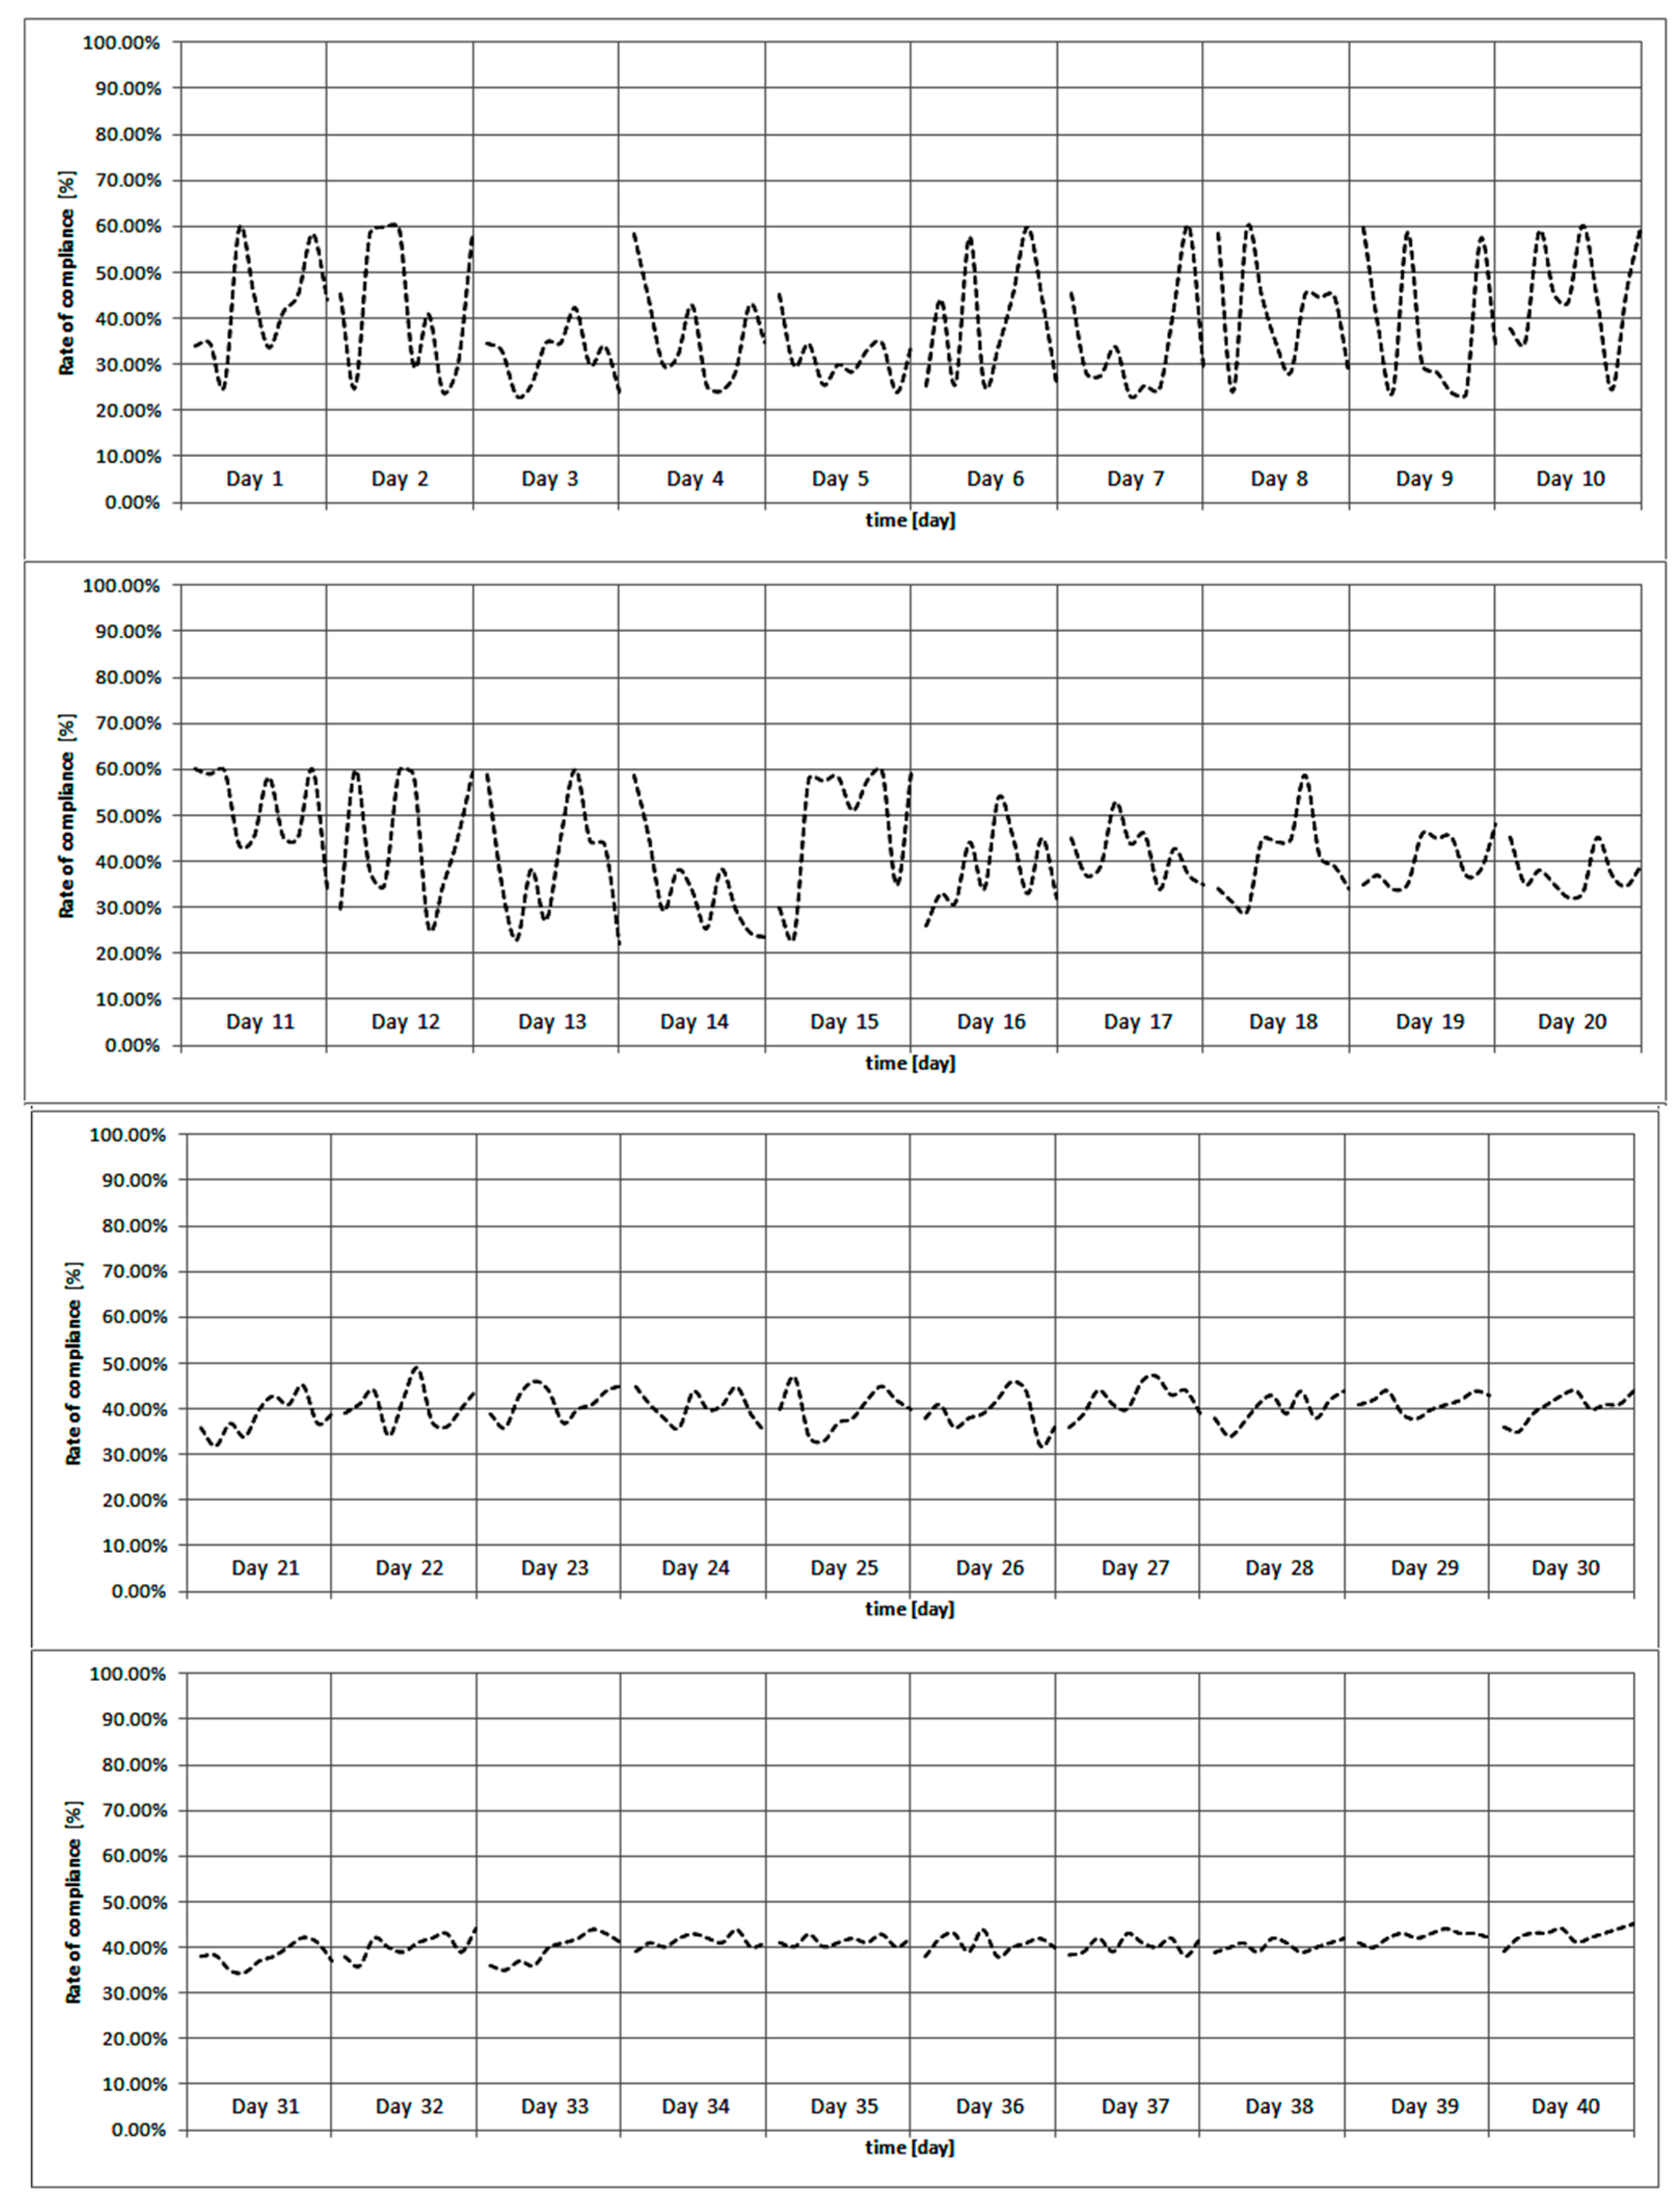
3.3. Day-to-Day Behavioral Modelling

In this section, the choice model, which implicitly simulates the RG effect in terms of compliance, is discussed. The considered model, calibrated starting from a stated preference experiment, carried out using an Internet-based tool [53], was adopted.
The model takes into account the experienced reliability of the information system on the previous day (ERt − 1), as well as the experienced travel time on the previous day (ETTt − 1), and finally the estimated travel times on day t (EsTTt) (see Figure 2).
In particular, a (binomial) mixed multinomial logit (see [54]) formalization of the holding structure proposed in [55] has been applied in order to correctly simulate traveler compliance. The model calibration results are briefly summarized in Table 1. In general, for each user making a choice between two alternative routes, the model is able to predict if he/she will follow the suggested information (choosing the suggested route) or not (choosing an alternative route). Further details regarding the experiment design are provided in [55].
Regarding the significant attributes in the model, a further description is displayed below:
  • AtLeastOneUnrel: A binary variable that equals 1 if the information system has not been reliable in the previous three days, otherwise zero;
  • SuggRouteIncr: The difference between the suggested route actual travel time at day t − 1 and the average value of the actual travel times of all routes suggested during the previous five days;
  • Consec: An attribute synthesizing the consistency between the most chosen route by the traveler during the previous 5 days and the route suggested during day t (the current day);
  • NotPreferredSugg: A performance measure over the last five days of the suggested route if different (then not preferred) from the route chosen by the traveler during the previous day;
  • FreqChosen: An attribute summarizing the consistency between the frequency of choice of the suggested route with respect to the previous five days;
  • FreqConc: An attribute representing the consistency between choices made by a traveler and the suggested information with respect to the previous five days.

3.4. Day-to-Day Behavioral Modelling
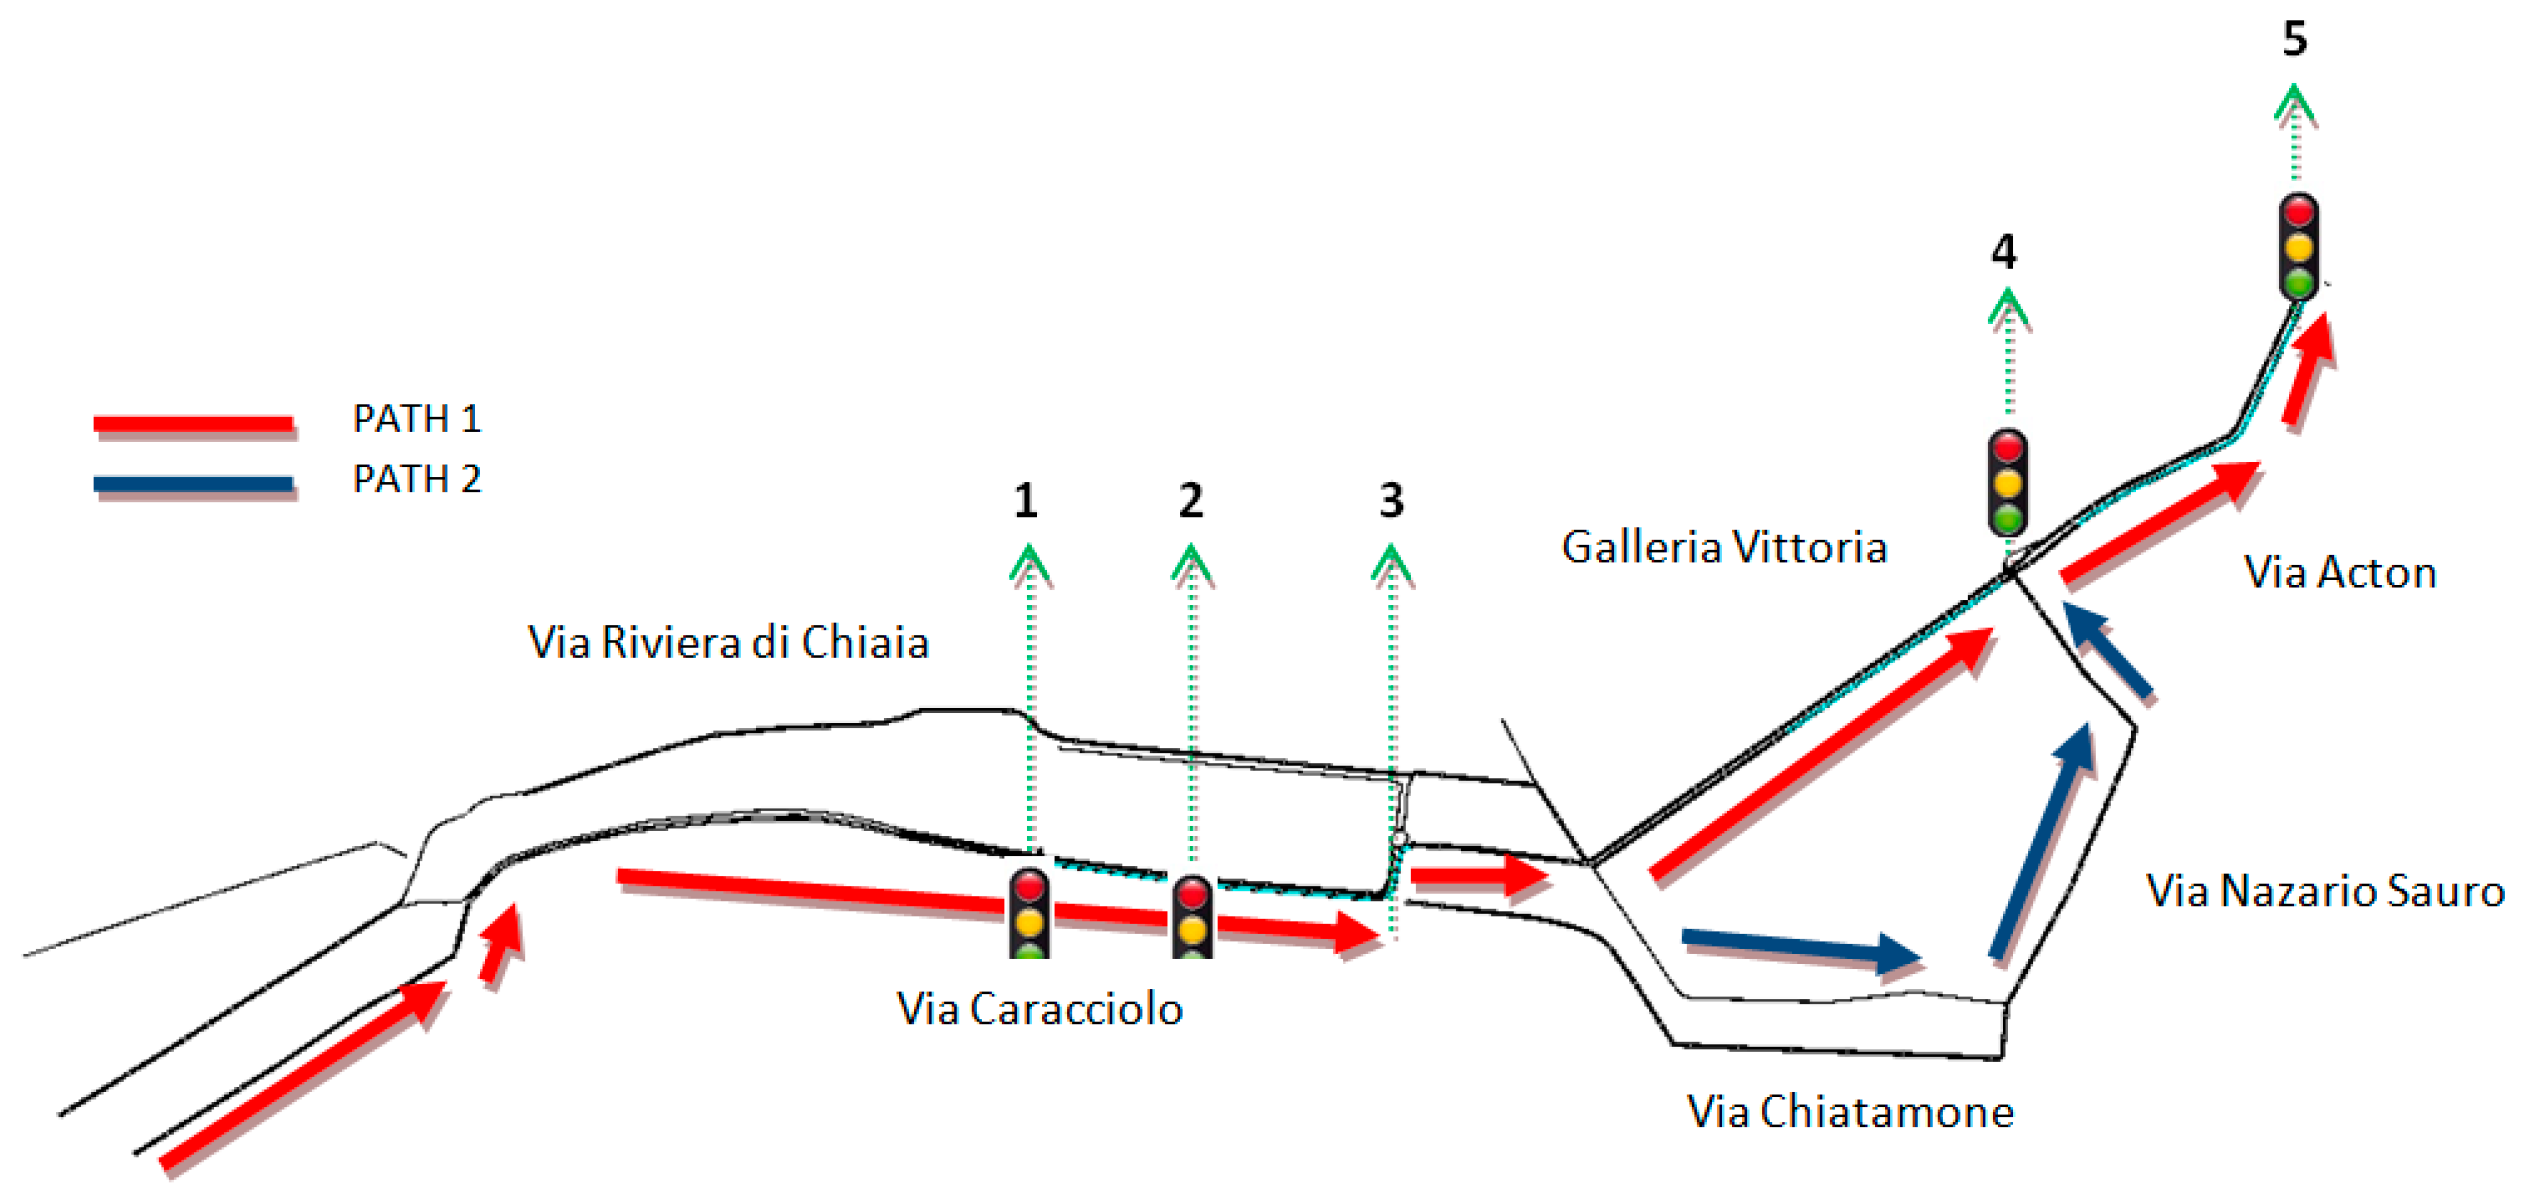
In this section, the steps of the iterative procedure for anticipatory route guidance able to guarantee consistency between user behavior and traffic signal decision variables, guarantee consistency between information (EsTTt) and user behavior (ETTt − 1), and focus on the information reliability (ERt − 1) is described.
From an analytical point of view, it is a fixed-point problem and the method of successive averages (MSA), which is based on a recursive approach, is the solution algorithm that has been adopted here.
In particular, the following parameters are set accordingly:
k: The iteration;
fkt: Network flows at iteration k, at day t;
EsTTt: The estimated travel time at day t;
EsTTkt*: The estimated travel times consistent with flow on day t;
ETTt − 1: The experienced travel times at day t − 1;
ERt − 1: The experienced reliability at day t − 1.
The main steps of the solution algorithm are listed below:
k = 0
f0t = Ω (ERt − 1 = 0; ETTt − 1= 0; EsTTk − 1t = 0)
do
k = k + 1
   //step 1 — flow updating*/
   fkt = Ω (ERt − 1; ETTt − 1; EsTTk − 1t)     //Ω is a generic function
   //step 2 – consistent estimated travel times computation*/
   EsTTkt* = Ψ (fkt)       //Ψ is a generic function
   //step 3 – new estimated travel times estimation*/
   EsTTkt = EsTTk −1 t + 1/α [EsTTkt* - EsTTk −1 t]
Loop until
maxEsTTkt* - EsTTk −1 t/EsTTk −1 t > δ    //δ = 0.02

4. Application

In order to test the proposed modelling framework, a real case study was considered. This is represented by a highly congested network in the city centre of Naples (see Figure 3).
In terms of network layout, this sub-network is composed of an origin–destination pair from the west to the east of the city, composed of one main link (Francesco Caracciolo), one diversion node at the end of this link, and two alternative paths to the final destination. The first path goes through a tunnel (Galleria Vittoria, path 1) the second one is the alternative path, which is further composed of three successive roads, namely, Via Chiatamone, Via Nazario Sauro, and Via Acton (in whole, representing path 2).
With reference to the above figure, junctions 1, 2, and 5 are classified as pedestrian traffic signals, junction 4 is a complex junction composed by 5 approaches, currently working with fixed timing plans, in particular, it is characterized by three stages: Stage 1 lasts 19 s, stage 2 lasts 65 s, and stage 3 lasts 26 s, where the total cycle length is 100 s (see Figure 4 for the correspondence between approaches and stages).
Therefore, with respect to the proposed framework, junctions 4 and 5, which can be classified as interacting junctions, are designed in accordance with the NTC approach, whereas, upstream junctions 1 and 2 are designed in accordance with the LM method.
In terms of implementation remarks, the whole traffic control procedure operates every control interval (every five minutes). In particular, decision variables regarding Network Traffic Control, are optimized by considering the traffic flows predicted through the rolling horizon procedure. This procedure is a temporal and spatial problem decomposition based on a time horizon period for traffic flow prediction. This interval (equal to five minutes) is composed of two sub-intervals, namely, a roll period (equal to five seconds) and a look ahead period (the time period from the end of the roll period to the end of the current traffic prediction). Furthermore, the real-time traffic information must be collected at every roll period in order to adjust the prediction and deliver them at every rolling period.
Regarding the origin-destination flows estimation, a detailed description may be found in [20], however, a dynamic microscopic simulation requires the internal paths to be known. The main flow patterns within our study area are reported in Table 2. It should be noted that these flows concern the morning peak hour, estimated to be at around 08:00.
Microscopic traffic flow modeling was pursued and, in particular, the SUMO [56] simulation tool was adopted in order to implement the considered scenarios. The TraCI interface was adopted for the online application and the code needed was developed in MATLAB (R2018b).
For further details regarding demand flows and traffic flow modeling calibration, the reader may refer to [18]. In this regard, the Wiedemann’s car-following traffic flow model [57] was considered. Regarding the calibration and validation procedure, the used indicators were the route journey times. In terms of goodness-of-fit function for model calibration, the GEH (Geoffrey E. Havers) statistic [58] was adopted and is in accordance with [59], where 85% of measures have a GEH < 5. Regarding the validation procedure, in accordance with [60], 95% of all of the modeled routes journey times were within 15% of the observed mean times.). In Figure 3, the current scenario is also represented, in which there are the traffic signal controllers (Section 4 and Section 5), link controllers (Section 1 and Section 2) and variable message signs (Section 3).

5. Numerical Results and Discussion

This section mainly focuses on the explanation of the numerical results. In terms of the implementation, it must be clarified that in order to reproduce the within-day simulation, a single morning (peak) hour was considered, estimated to be at around 08:00, including a 10-min warm-up period. In particular, the analyses of the simulation results were computed by excluding the first 10 min, and by considering only 50 min of simulation as well as the number of successive times (days) considered for simulation, in order to reproduce the day-to-day evolution equal to 40. This is consistent with the experiment designed for the calibration of the compliance model discussed in Section 3.2.
In particular, the results of four scenarios are displayed and discussed. The considered scenarios are listed as follows:
  • Do nothing (DN), which is the current scenario, in which travelers are not provided with information;
  • Forced rerouting (FR), where the whole system simulates a forced rerouting strategy (to alternative route 2) and this is implemented when the length of the queue observed directly in the tunnel is higher than a specific value. This scenario refers to the case in which users are provided with prescriptive information, but the alternative route is temporarily closed off to drivers;
  • Modeled compliance (MC), where the proposed TC-RG framework is implemented and a disaggregate compliance model is applied in order to reproduce the users’ outcomes coherently with their reaction to the information. It must be clarified that the most relevant users are considered systematic. The resulting compliance of this scenario is evaluated though the provided analyses;
  • Parametric high compliance (PC-H), in which the value of compliance is equal to 60%. This scenario is intended to act as a sensitivity analysis, in the case of a high rate of compliance. This scenario corresponds to the case of highly accurate information, and, therefore, high rates of compliant users are expected.
Finally, the analyses are carried out in terms of within-day performance indicators (i.e., travel times and queue lengths) day-to-day with respect to travel times and compliance evolution over the given period of time, and finally, in terms of the (within-day) impact (i.e., emissions and fuel consumption).

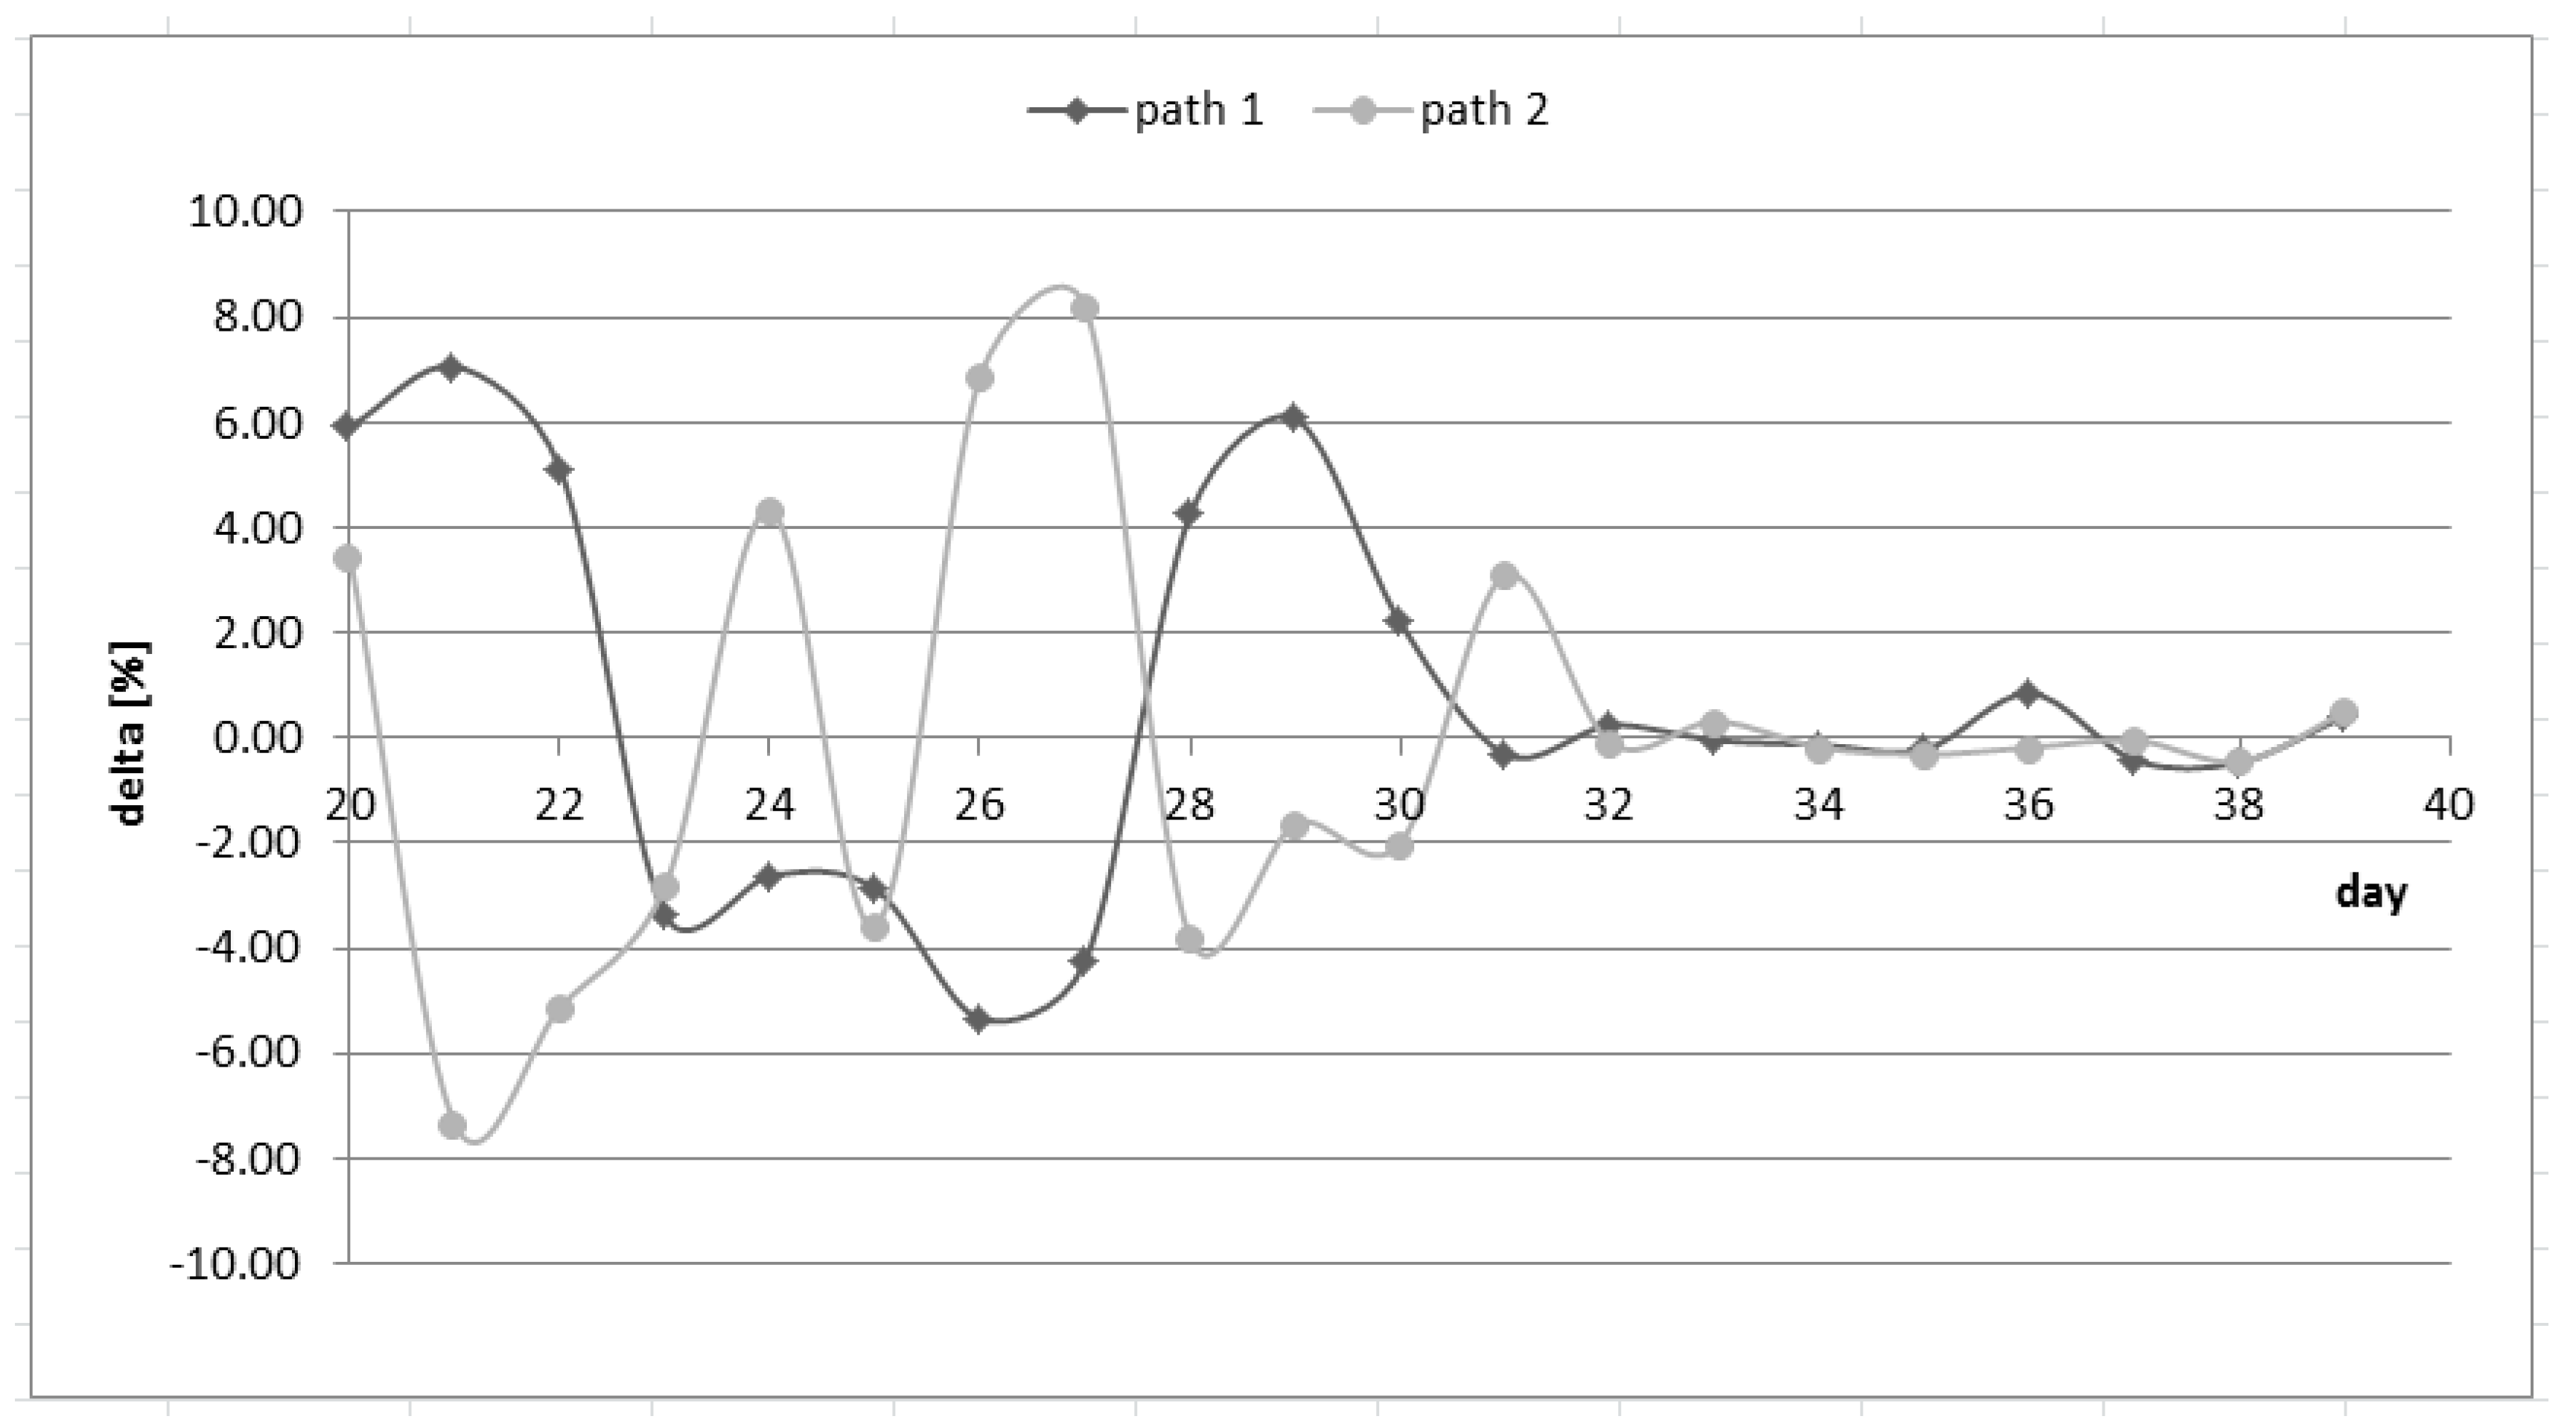
5.1. DN Scenario versus MC Scenario: Benefits of the Modeled Compliance Scenario

In this section, two testing scenarios are considered:
  • The do nothing [DN] scenario;
  • The modeled compliance [MC] scenario;
In order to evaluate the effectiveness of the proposed strategy, the MC scenario was compared with the DN one. The relative difference (i.e., DN versus MC) between the mean values of actual travel times of the two alternative paths was then calculated (TTpathx), as well as the mean value of the relative difference of the queue lengths (QL) at significant sections (identified in accordance with Figure 4). The results are reported in Table 3 and Table 4, and highlight that the MC scenario outperforms the current scenario. Indeed, the combined TC-RG strategy significantly reduces the values of the two indicators.
With reference to the MC scenario, in order to evaluate the system convergence, the overtime evolution of the mean value, and the relative difference between two successive days of the path travel times were considered.
Let us specify that the results of the considered indicators we show are from the 21st day to the 40th, and results before the 21st day are unstable and hence useless for any further interpretation and are not displayed. In particular, in Table 5, the average travel time values (TTpathx) and the standard deviations (St. dev.) are displayed for each day, as well as the ‘delta’ indicator, against the days shown in Figure 5. The obtained results indicate that system convergence is achieved starting from around the 32nd day. Indeed, from the same day, stable values may be observed (in terms of both mean values and standard deviations) for the path travel times, and also for the value of delta, which approaches zero. However, it must be observed that the first ten days need to be considered for the model application and traffic simulation warm-up, thus, the system convergence is achieved starting from around the 20th day.
Furthermore, with reference to only the MC scenario, a further evaluation is provided in terms of the day-to-day process analysis. In particular, in order to classify the achieved solution, the evolution of the mean travel times on the two alternative paths against days, until the end of the simulation time interval, are plotted. In this regard, see Figure 6, where the results range from the 21st day until the 40th day. The first ten days are considered for model application and traffic simulation warm-up; thus, system convergence is achieved, starting from around the 30th day.
In particular, the actual travel times from the 31st day until the end are almost the same from one day to the next, showing that the system has reached convergence and the achieved solution is stable. In accordance with previous considerations and due to the warm-up period to be considered for modeling the framework application from the 21st day, the system has reached convergence and the achieved solution is stable. A similar analysis is displayed in Figure 7 regarding the evolution over time of the compliance. In this case, in order to highlight the stabilization effect, the evolution of the compliance against all days is shown. The graph still indicates the stable behavior of the users starting from the 21st day. This result is consistent with the theoretical background, on the basis of which we may expect that behavior stabilization can anticipate and affect the system evolution [48]. Starting from the analyses and with reference to the considered network, three main conclusions may arise: (i) The proposed framework, composed of two simultaneous strategies, iterative procedures, a traffic flow prediction model, and a rolling horizon approach, is able to provide effective results; (ii) the combination of TC-RG strategies is able to guarantee the system convergence and stability of the achieved solution. It must be clarified that, in general, in accordance with the theory of dynamic non-linear processes, an empirical solution found through numerical experiments represents a stable fixed-point of the problem, furthermore, it may be argued that stability has a significant effect for policy design and implementation, and, indeed, in the case of stability, the system will achieve the same configuration over multiple days, facilitating the effectiveness of policy implementation; (iii) the analysis of the compliance evolution over the days clearly shows compliance stabilization. In particular, behavior stabilization anticipates the system stabilization, where the value may be considered as target value for the definition of the transportation system design strategies.

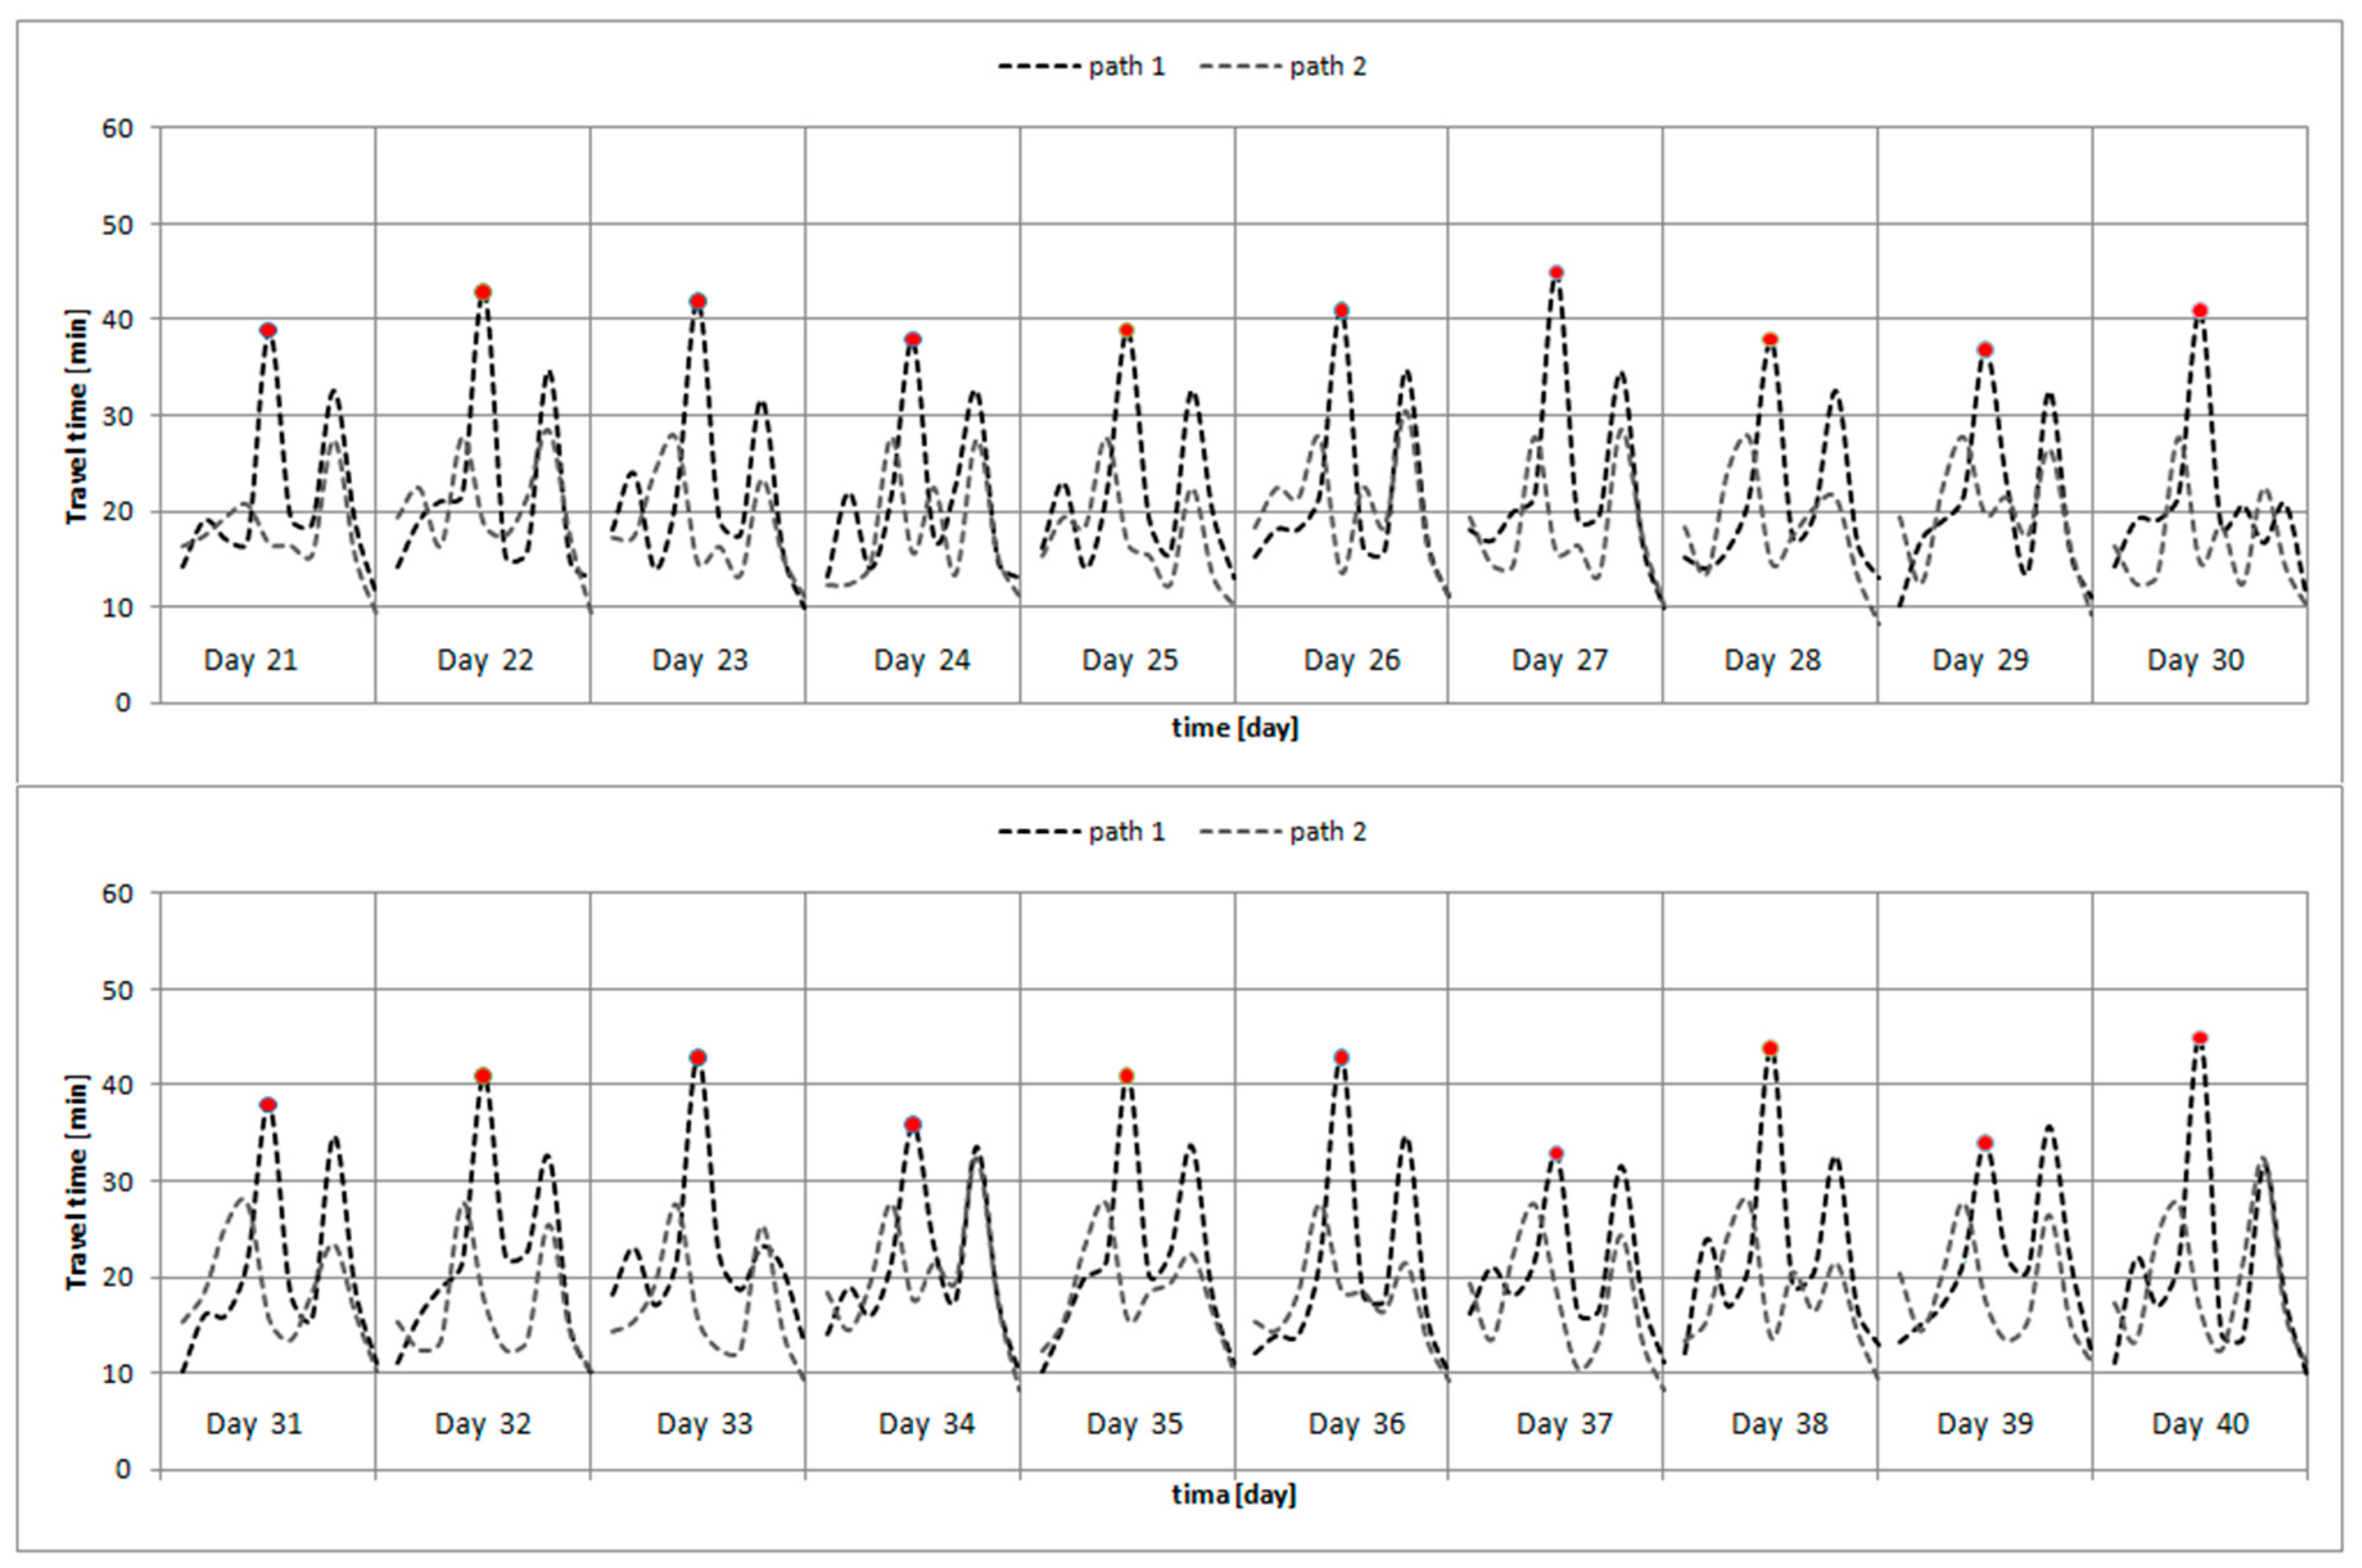
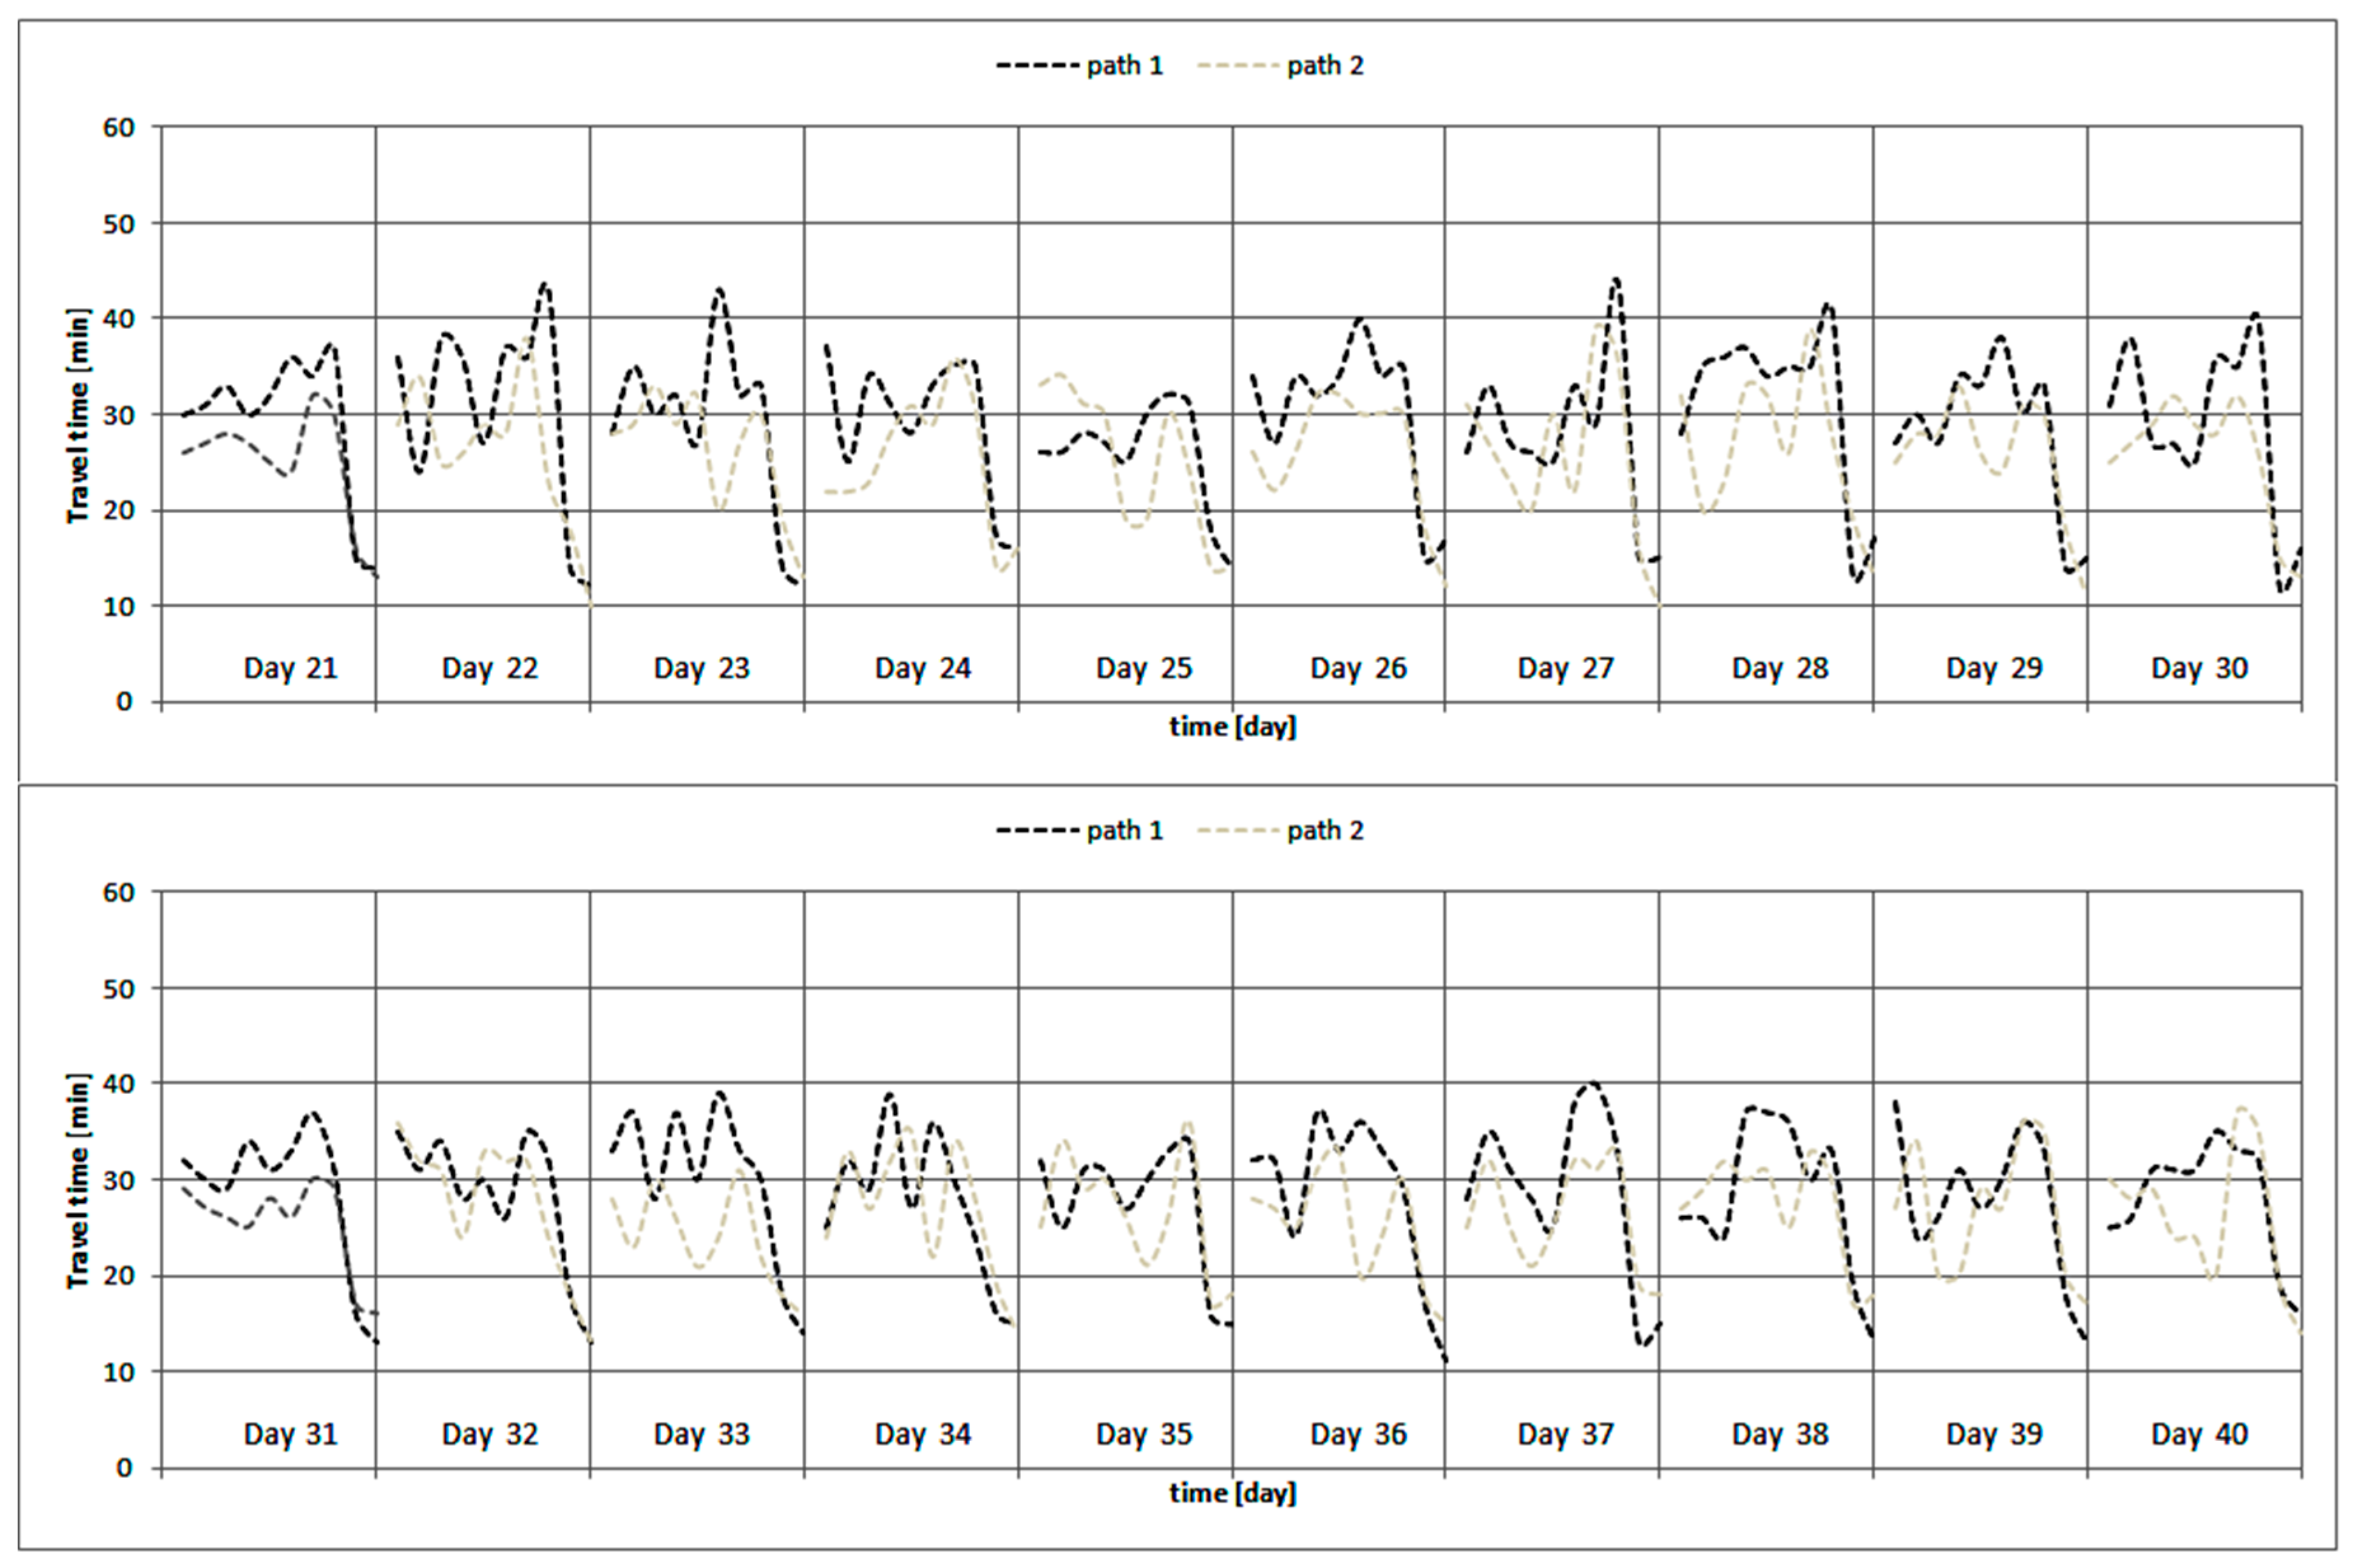
5.2. Further Analyses: FR and PC-H Scenarios

In order to evaluate the effect of different kinds of information, the following two graphical analyses were also carried out. In particular, the evolution over days of the path travel times was investigated with respect to two different scenarios (Figure 8 and Figure 9), namely,
  • forced rerouting [FR];
  • parametric high compliance [PC-H].
In this paper, the information has been provided through variable message signs. It is also important to consider equipped users that receive information through specific devices, and, therefore, the compliance can be influenced not only by information inaccuracy, but also by the penetration rates of technologies.
In the first FR scenario, it is possible to conclude that convergence is not guaranteed. Regarding the PC-H scenario, the convergence is achieved, but the stability of the reached solution is not observed, and, therefore, it is expected that the system will exhibit a different behavior every day, obstructing the policy design. Here, analyses confirm that in order to be effective in terms of system convergence and solution stability, users’ reactions to the given information model (i.e., a compliance model) is required. In general, the TC-RG framework may be preliminarily adopted in order to investigate the compliance value to be achieved in order to guarantee the system convergence and solution stability.
Indeed, from an operational point of view, once the compliance value is identified, the traffic control decision variables may be optimized in order to anticipate (i.e., to reduce the transient interval) the achievement of the required value of compliance and consequently accelerate system stabilization.

5.3. Environmental Impact Analysis: Emissions and Fuel Consumption Evaluation

In this subsection, for completeness, an evaluation of the impacts in terms of emissions and fuel consumption is only displayed for scenario MC, which is recognized to be the best scenario, and for scenario PC-H which is considered as the second-best scenario.
First of all, a comparative evaluation of the mean travel time reduction (in terms of relative difference) is displayed again in Table 6 below. The numerical results again highlight that scenario PC-H may be considered convenient only with respect to the travel time improvement on path 1, where it is otherwise useless with respect to path 2.
Regarding emission and fuel consumption, the results are summarized in Table 7 below.
In particular, five air pollutants have been considered and, for each one of them, the percentage of relative reduction is shown with respect to the DN scenario. The estimations have been made directly by SUMO (see [61]), in which some emissions models are included. In this paper, the Handbook Emission Factors for Road Transport (HBEFA v2.1; see [62]) has been adopted. This model provides emission factors for all vehicle categories. Regarding the vehicle categories, this information has been collected from the ACI (Automobile Club Italia) database (Italian vehicle owner association; see [63]) for the city of Naples.
In summary, the mean value of the air pollutant reduction is around 34% in the case of the PC-H scenario, while it is around 54% in the case of the MC scenario, which is the best scenario. Finally, in terms of fuel consumption, the difference is around a 40% reduction in the case of the PC-H scenario and 50% in the case of the MC scenario. In conclusion, the environmental impacts are still consistent with the achieved performance indicators.

6. Conclusions and Future Perspectives

The paper illustrates a unified framework, which embeds a simultaneous traffic control strategy and route guidance system. With regard to traffic control, the combination between an online scheduled synchronization method and a link metering strategy has been adopted. With respect to route guidance, the main contribution here is the implementation of a model that implicitly reproduces day-to-day behavioral processes in terms of users’ reactions to information that is presented to them. The traffic flow has been modeled at a microscopic disaggregate level and all models were run in the SUMO simulation environment.
In order to test the proposed framework, a small sub-network of the city centre of Naples (one origin-destination pair and two alternative paths) was considered.
The results of different scenarios were compared. Firstly, two scenarios were analyzed and discussed, namely, the do nothing scenario [DN], which is the real current scenario, and the modeled compliance [MC] scenario. Next, further analysis was provided, aiming to discuss the results of rerouting and high parametric values of compliance.
The main conclusions refer to the system convergence and stabilization that may only be clearly observed in the case of the MC scenario, unlike the other scenarios. Furthermore, it must be observed that the proposed framework is able to support the identification of the target value of compliance corresponding to the most stable configuration (for instance, in our case, it was around 40%). This result is also consistent with the preliminary theoretically-based considerations made by [13] and [55]. Indeed, they observed that, in the case of a steady state condition, the rate of compliance that is able to guarantee the solution stability is around 30%. However, they also specified that, in the case of within-day-dynamic modeling, slightly different results may occur. In general, an optimization problem may be solved in order to accelerate system stabilization.
Furthermore, the numerical results highlight that the proposed TC-RG strategy significantly improves system performance (specifically, travel times and queue lengths). In particular, the framework may be considered to be a useful tool for guaranteeing the observation of behavior stabilization (i.e., learnt behavior since the eleventh day) and system convergence and stabilization (since the twenty first day).
On the basis of the analyses carried out, the following main conclusions are listed:
(i)
The whole framework proposed is able to provide more effective results then other frameworks, as observed through the values of the considered performance indicators;
(ii)
The TC-RG approach is able to guarantee system convergence and the stability of the achieved solution;
(iii)
In accordance with the literature (e.g., [13]), the analysis of the compliance evolution over the analyzed days clearly shows a consistent value of compliance in the case of system stabilization.
From an operational point of view, the framework may be adopted in both offline and online applications. In the first case, the whole modeling framework may support user behavior predictions and the identification of optimization strategies to be implemented in order to anticipate system convergence and stabilization by indirectly affecting the traveler compliance. With respect to the online applications, the TC-RG methods may be adopted in order to identify optimal settings for traffic control decision variables consistent with predictions of user behavior. In the latter case, depending on the length of a transient period, achieving system convergence and stabilization is still guaranteed.
Regarding future research perspectives, the authors would like to test the proposed framework on different networks characterized by more complex topologies. Regarding the information, different kinds of information (e.g., descriptive and/or mixed information) will be considered as well as the en route information. It is also worth comparing the simulation- and analytically-based approaches. The application of the analytical approach [50] will be also suitable in order to study the acceleration of the system stabilization. In particular, the latter approach could be adopted in order to evaluate the transient period before system stabilization and how this may be affected (i.e., minimized).

Author Contributions

Conceptualization, S.d.L., R.D.P., S.M., and L.P.; Formal analysis, S.d.L., R.D.P., S.M., and L.P.; methodology, S.d.L., R.D.P., S.M., and L.P.; writing—original draft, S.d.L., R.D.P., S.M., and L.P. All authors have read and agreed to the published version of the manuscript.

Funding

This research has been partially supported by the University of Salerno, under local grants n. ORSA165221–2016 and n. ORSA180377–2018.

Acknowledgments

The author would like to thank the Municipality of Naples for the provided data. The authors also wishes to thank anonymous reviewers for their helpful comments.

Conflicts of Interest

The authors declare no conflict of interest

References and Note

  1. IEA. “Tracking Transport”. IEA: Paris. Available online: https://www.iea.org/reports/tracking-transport-2019 (accessed on 14 January 2020).
  2. De Luca, S.; Di Pace, R.; Marano, V. Modelling the adoption intention and installation choice of an automotive after-market mild-solar-hybridization kit. Transp. Res. Part C Emerg. Technol. 2015, 56, 426–445. [Google Scholar] [CrossRef]
  3. Vandecasteele, I.; Baranzelli, C.; Siragusa, A.; Aurambout, J.P.; Alberti, V.; Alonso Raposo, M.; Batista e Silva, F. The Future of Cities– Opportunities, Challenges and the Way Forward; EUR 29752 EN; Publications Office: Luxembourg, 2019. [Google Scholar]
  4. De Luca, S.; Papola, A. Evaluation of travel demand management policies in the urban area of Naples. WIT Trans. Built Environ. 2001, 52, 10. [Google Scholar]
  5. Gozalvez, J.; Sepulcre, M.; Bauza, R. IEEE 802.11p vehicle to infrastructure communications in urban enviroments. IEEE Commun. Mag. 2012, 50, 176–183. [Google Scholar] [CrossRef]
  6. Melo, S.; Macedo, J.; Baptista, P. Guiding cities to pursue a smart mobility paradigm: An example from vehicle routing guidance and its traffic and operational effects. Res. Transp. Econ. 2017, 65, 24–33. [Google Scholar] [CrossRef]
  7. Mascia, M.; Hu, S.; Han, K.; North, R.; Van Poppel, M.; Theunis, J.; Beckx, C.; Litzenberger, M. Impact of traffic management on black carbon emissions: A microsimulation study. Netw. Spat. Econ. 2017, 17, 269–291. [Google Scholar] [CrossRef] [Green Version]
  8. Allsop, R.E. SIGCAP: A computer program for assessing the traffic capacity of signal-controlled road junctions. Traffic Eng. Control 1976, 17, 338–341. [Google Scholar]
  9. Robertson, D.I. TRANSYT: A Traffic Network Study Tool; TRRL Report 1969, LR253; Transport and Road Research Laboratory: London, UK, 1969. [Google Scholar]
  10. Geroliminis, N.; Haddad, J.; Ramezani, M. Optimal perimeter control for two urban regions with macroscopic fundamental diagrams: A model predictive approach. IEEE Trans. Intell. Transp. Syst. 2013, 14, 348–359. [Google Scholar] [CrossRef] [Green Version]
  11. Ben-Elia, E.; Di Pace, R.; Bifulco, G.N.; Shiftan, Y. The impact of travel information’s accuracy on route-choice. Transp. Res. Part C Emerg. Technol. 2013, 26, 146–159. [Google Scholar] [CrossRef]
  12. Srinivasan, K.; Mahmassani, H. Modeling inertia and compliance mechanisms in route choice behavior under real-time information. Transp. Res. Rec. J. Transp. Res. Board 2000, 1725, 45–53. [Google Scholar] [CrossRef]
  13. Bifulco, G.N.; Cantarella, G.E.; Simonelli, F.; Velonà, P. Advanced traveller information systems under recurrent traffic conditions: Network equilibrium and stability. Transp. Res. Part B Methodol. 2016, 92, 73–87. [Google Scholar] [CrossRef]
  14. Abdelghany, K.; Valdes, D.; Abdelfatah, A.; Mahmassani, H. Real-Time Dynamic Traffic Assignment and Path-Based Signal Coordination; Application to Network Traffic Management. Transp. Res. Rec. J. Transp. Res. Board 1999, 1667, 67–76. [Google Scholar] [CrossRef]
  15. Ben-Akiva, M.; Bierlaire, M.; Burton, D.; Koutsopoulos, H.N.; Mishalani, R. Network state estimation and prediction for real-time traffic management. Netw. Spat. Econ. 2001, 1, 293–318. [Google Scholar] [CrossRef]
  16. Liu, R.; Van Vliet, D.; Watling, D. Microsimulation models incorporating both demand and supply dynamics. Transp. Res. Part A Policy Pract. 2006, 40, 125–150. [Google Scholar] [CrossRef] [Green Version]
  17. Memoli, S.; Cantarella, G.E.; de Luca, S.; Di Pace, R. Network signal setting design with stage sequence optimisation. Transp. Res. Part B 2017, 100, 20–42. [Google Scholar] [CrossRef]
  18. De Luca, S.; Di Pace, R.; Memoli, S.; Storani, F. A hybrid traffic control framework for urban network management. In Proceedings of the 2019 IEEE International Conference on Environment and Electrical Engineering and 2019 IEEE Industrial and Commercial Power Systems Europe (EEEIC/I&CPS Europe), Genova, Italy, 11–14 June 2019; pp. 1–6. [Google Scholar]
  19. Kotsialos, A.; Papageorgiou, M.; Middelham, F. Local and optimal coordinated ramp metering for freeway networks. J. Intell. Transp. Syst. 2005, 9, 187–203. [Google Scholar] [CrossRef]
  20. Papamichail, I.; Papageorgiou, M. Traffic-Responsive Linked Ramp Metering Control. IEEE Trans. Intell. Transp. Syst. 2008, 9, 111–121. [Google Scholar] [CrossRef]
  21. Mahmassani, H.; Hu, T.; Jayakrishnan, R. Dynamic traffic assignment and simulation for advanced network informatics (DynaSMART). In Urban Traffic Networks: Dynamic Flow Modeling and Control; Springer: Berlin, NY, USA, 1995. [Google Scholar]
  22. Ben-Akiva, M.; Koutsopoulos, H.N.; Antoniou, C.; Balakrishna, R. Traffic Simulation with DynaMIT. In Fundamentals of Traffic Simulation; Barceló, J., Ed.; Springer: New York, NY, USA, 2010; pp. 363–398. [Google Scholar]
  23. Vincent, R.A.; Peirce, J.R.; Webb, P.J. MOVA Traffic Control Manual; Transport and Road Research Laboratory: London, UK, 1990. [Google Scholar]
  24. Varaiya, P. Max pressure control of a network of signalized intersections. Transp. Res. Part C Emerg. Technol. 2013, 36, 177–195. [Google Scholar] [CrossRef]
  25. Hunt, P.B.; Robertson, D.I.; Bretherton, R.D.; Winton, R.I. SCOOT—A Traffic Responsive Method of Coordinating Signals; RRL Report LR 1041; Road Research Laboratory: London, UK, 1981. [Google Scholar]
  26. Luk, J.Y.K. Two traffic-responsive area traffic control methods: SCAT and SCOOT. Traffic Eng. Control 1984, 25, 14–22. [Google Scholar]
  27. Dinopoulou, V.; Diakaki, C.; Papageorgiou, M. Application and evaluation of the signal traffic control strategy TUC in Chania. J. Intell. Transp. Syst. 2005, 9, 133–143. [Google Scholar] [CrossRef]
  28. Mauro, V. UTOPIA—Urban Traffic Control—Main Concepts. In Proceedings of the the EU–China ITS Workshop, Beijing, China, 18–19 April 2002; pp. 18–19. [Google Scholar]
  29. Wood, K.; Bretherton, D.; Maxwell, A.; Smith, K.; Bowen, G. Improved Traffic Management and Bus Priority with SCOOT; TRL Staff Paper PA 3860/02; Transport Research Laboratory: London, UK, 2002. [Google Scholar]
  30. Luk, J.; Green, D. Balancing Traffic Density in a Signalised Network; Austroads Research Report AP-R369/10; Austroads: Sydney, Australia, 2010. [Google Scholar]
  31. Geroliminis, N.; Sun, J. Properties of a well-defined macroscopic fundamental diagram for urban traffic. Transp. Res. Part B Methodol. 2011, 45, 605–617. [Google Scholar] [CrossRef] [Green Version]
  32. Ramezani, M.; Haddad, J.; Geroliminis, N. Dynamics of heterogeneity in urban networks: Aggregated traffic modeling and hierarchical control. Transp. Res. Part B Methodol. 2015, 74, 1–19. [Google Scholar] [CrossRef]
  33. Jang, K.; Kim, H.; Jang, I.G. Traffic signal optimization for oversaturated urban networks: Queue growth equalization. IEEE Trans. Intell. Transp. Syst. 2015, 16, 2121–2128. [Google Scholar] [CrossRef]
  34. Kucharski, R.; Gentile, G. Simulation of rerouting phenomena in Dynamic Traffic Assignment with the Information Comply Model. Transp. Res. Part B Methodol. 2018, 126, 414–441. [Google Scholar] [CrossRef]
  35. Gao, S.; Frejinger, E.; Ben-Akiva, M. Adaptive route choices in risky traffic networks: A prospect theory approach. Transp. Res. C 2010, 18, 727–740. [Google Scholar] [CrossRef]
  36. Ben-Akiva, M.; De Palma, A.; Isam, K. Dynamic network models and driver information systems. Transp. Res. Part A Gen. 1991, 25, 251–266. [Google Scholar] [CrossRef]
  37. Jayakrishnan, R.; Mahmassani, H.S.; Hu, T.Y. An evaluation tool for advanced traffic information and management systems in urban networks. Transp. Res. Part C Emerg. Technol. 1994, 2, 129–147. [Google Scholar] [CrossRef]
  38. Unnikrishnan, A.; Waller, S.T. User equilibrium with recourse. Netw. Spat. Econ. 2009, 9, 575. [Google Scholar] [CrossRef]
  39. Bottom, J.; Ben-Akiva, M.; Bierlaire, M.; Chabini, I.; Koutsopoulos, H.; Yang, Q. Investigation of route guidance generation issues by simulation with DynaMIT. In Proceedings of the 14th International Symposium on Transportation and Traffic Theory, Jerusalem, Israel, 20–23 July 1999. [Google Scholar]
  40. Bottom, J.A. Consistent Anticipatory Route Guidance. Ph.D. Thesis, Massachusetts Institute of Technology, Cambridge, MA, USA, 2000. [Google Scholar]
  41. Crittin, F.; Bierlaire, M. New algorithmic approaches for the anticipatory route guidance generation problem. In Proceedings of the Swiss Transport Research Conference (No. TRANSP-OR-CONF-2006-056), Ascona, Switzerland, 1–3 March 2001. [Google Scholar]
  42. Dong, J.; Mahmassani, H.; Lu, C.C. How reliable is this route?: Predictive travel time and reliability for anticipatory traveler information systems. Transp. Res. Rec. J. Transp. Res. Board 2006, 1980, 117–125. [Google Scholar] [CrossRef]
  43. Zhang, D.; Nagurney, A. On the local and global stability of a travel route choice adjustment process. Transp. Res. Part B Methodol. 1996, 30, 245–262. [Google Scholar] [CrossRef]
  44. Lo, H.; Bie, J. Stability domains of traffic equilibrium: Directing traffic system evolution to equilibrium. In Proceedings of the First International Symposium on Dynamic Traffic Assignment (DTA), Leeds, UK, 21–23 June 2006. [Google Scholar]
  45. Bie, J.; Lo, H.K. Stability and attraction domains of traffic equilibria in a day-to-day dynamical system formulation. Transp. Res. Part B 2010, 44, 90–107. [Google Scholar] [CrossRef]
  46. Cantarella, G.E. Day-to-day dynamic models for intelligent transportation systems design and appraisal. Transp. Res. Part C Emerg. Tech. 2013, 29, 117–130. [Google Scholar] [CrossRef]
  47. Han, L.; Sun, H.; Wu, J.; Zhu, C. Day-to-day evolution of the traffic network with Advanced Traveler Information System. Chaos Solitons Fractals 2011, 44, 914–919. [Google Scholar] [CrossRef]
  48. Bifulco, G.N.; Cantarella, G.E.; Simonelli, F. Design of signal setting and advanced traveler information systems. J. Intell. Transp. Syst. 2014, 18, 30–40. [Google Scholar] [CrossRef]
  49. Watling, D.P.; Cantarella, G.E. Model representation & decision-making in an ever-changing world: The role of stochastic process models of transportation systems. Netw. Spat. Econ. 2015, 15, 843–882. [Google Scholar]
  50. Daganzo, C.F. The Cell-Transmission Model. Part II: Network Traffic. Transp. Res. Part B Methodol. 1995, 29, 79–93. [Google Scholar] [CrossRef]
  51. Pace, R.D. A traffic control framework for urban networks based on within-day dynamic traffic flow models. Transp. A Transp. Sci. 2019, 1–36. [Google Scholar] [CrossRef]
  52. Keyvan-Ekbatani, M.; Gao, X.; Gayah, V.V.; Knoop, V.L. Traffic-responsive signals combined with perimeter control: Investigating the benefits. Transp. B Transp. Dyn. 2019, 7, 1402–1425. [Google Scholar] [CrossRef]
  53. Hoogendoorn, S.P. Travel Simulator Laboratory, TSL Website, 2004. http://www.tsl.tudelft.nl.
  54. McFadden, D.; Train, K. Mixed MNL models for discrete response. J. Appl. Econom. 2000, 15, 447–470. [Google Scholar] [CrossRef]
  55. Bifulco, G.N.; Cantarella, G.E.; de Luca, S.; Di Pace, R. Analysis and modelling the effects of information accuracy on travellers’ behavior. In Proceedings of the 14th International IEEE Conference on Intelligent Transportation Systems (ITSC), Washington, DC, USA, 5–7 October 2011; pp. 2098–2105. [Google Scholar]
  56. Krajzewicz, D.; Erdmann, J.; Behrisch, M.; Bieker, L. Recent Development and Applications of SUMO—Simulation of Urban MObility. Int. J. Adv. Syst. Meas. 2012, 5, 128–138. [Google Scholar]
  57. Wiedemann, R.; Reiter, U. Microscopic traffic simulation: The simulation system MISSION, background and actual state. In CEC Project ICARUS (V1052) Final Report, Vol 2, Appendix A. Brussels, CEC; CEC: Brussels, Belgium, 1992. [Google Scholar]
  58. Ma, J.; Dong, H.; Zhang, H.M. Calibration of Micro Simulation with Heuristic Optimization Methods. Trans. Res. Rec. 2007, 1999, 208–217. [Google Scholar] [CrossRef] [Green Version]
  59. Highways Agency. Design Manual for Roads and Bridges: Volume Contents Pages and Alpha-Numeric Index. Available online: http://www.standardsforhighways.co.uk/ha/standards/dmrb/ (accessed on 17 January 2020).
  60. TfL (Transport for London). Traffic Modelling Guidelines: TfL Traffic Manager and Network Performance Best Practice Version 3.0; Transport for London: London, UK, 2010; Available online: http://bailey.persona-pi.com/Public-Inquiries/Brent%20Cross/I-During%20Inquiry/AA-GEN/AA.INQ.28%20TfL%20Traffic%20Modelling%20Guidelines%20Version%203%200%20September%202010%20ex.pdf (accessed on 17 January 2020).
  61. SUMO Emissions and Fuel Consumption Models. Available online: https://sumo.dlr.de/docs/Models/Emissions/HBEFA-based.html (accessed on 1 January 2020).
  62. HBEFA Model. Available online: https://www.hbefa.net/e/index.html (accessed on 1 January 2020).
  63. ACI. Available online: http://www.aci.it/laci/studi-e-ricerche/dati-e-statistiche/annuario-statistico.html (accessed on 1 January 2020).
Figure 1. Proposed framework.
Sustainability 12 00726 g001
Figure 2. Day-to-day behavior modeling.
Sustainability 12 00726 g002
Figure 3. Network layout. Source: Generated by authors.
Sustainability 12 00726 g003
Figure 4. Correspondence between approaches and stages.
Sustainability 12 00726 g004
Figure 5. Relative difference (delta) of travel times for each one of the two paths against time.
Sustainability 12 00726 g005
Figure 6. Travel times evolution over the days, considering two paths with MC.
Sustainability 12 00726 g006
Figure 7. Compliance evolution over the analyzed days, considering modeled compliance (MC).
Sustainability 12 00726 g007
Figure 8. Travel times evolution over the analyzed days with two paths, considering forced rerouting (FR). The red points on the graph represent the times of the rerouting implementation.
Sustainability 12 00726 g008
Figure 9. Travel times evolution over the analyzed days of the two paths, considering PC-H.
Sustainability 12 00726 g009
Table 1. Estimation results of the holding model. The considered mixed logit is based on the error term representation. Here, a normal distribution is assumed to be the mean value of the error term which is equal to zero, whereas Var [ ζ n ] is the variance.
Holding Model
Pseudo-ρ20.387
Final log-likelihood−1088.787
(Var[ [ ζ n ] ])11.55 (7.75)
CompliantNot-Compliant
ASA +1.07 (+4.17)
AtLeastOneUnrel +0.87 (+1.50)
SuggRouteIncr +0.80 (+1.16)
NotPreferredSugg +1.48 (+4.78)
FreqConc+1.47 (+4.88)
Consec+2.64 (+5.42)
Table 2. Flow patterns (morning peak hour).
Pathf [veh/h]
Sustainability 12 00726 i0011375
[→]
Sustainability 12 00726 i002650
[→]
Sustainability 12 00726 i003970
[←]
Sustainability 12 00726 i004285
[←]
Table 3. Mean values of actual travel times of the two alternative paths (TTpathx) and the relative difference (%) of the do nothing (DN) scenario with respect to the modeled compliance (MC) scenario.
Path 1Path 2
−23.15%−16.53%
Table 4. Mean queue lengths (QLs) and relative difference (%) of the DN scenario with respect to the MC scenario.
Section 1Section 2Section 3Section 4Section 5
−88.70%−75.28%−84.46%−68.13%−32.18%
Table 5. Travel times (morning peak hour).
dayTT path 1 [min]St.dev.TTpath 2 [min]St.dev.
2026.862.9122.422.03
2125.272.2021.651.83
2223.482.2423.241.92
2322.282.1624.431.84
2423.032.2125.122.02
2523.632.4824.031.70
2624.312.1824.891.84
2725.612.4423.181.65
2826.701.9221.281.78
2925.571.7522.091.65
3024.011.4022.451.29
3123.481.4122.901.30
3223.561.3922.191.28
3323.541.3822.211.29
3423.511.3722.141.26
3523.541.3922.181.30
3623.591.3622.251.32
3723.391.4022.291.29
3823.491.4122.301.34
3923.601.3722.401.27
4023.501.3922.291.31
Table 6. Mean travel times relative difference (%) of the DN scenario with respect to the each scenario (ID Scenario).
ID SCENARIOPath 1Path 2
MC−23.15%−16.53%
PC-H−15.26%0.82%
Table 7. Emission and fuel consumption percentage variations with respect to the DN scenario.
[PC-H][MC]
Emissions CO−30.3%−50.0%
CO2−39.8%−59.9%
NOX−28.3%−59.8%
HC−44.4%−50.0%
PMx−25.0%−50.0%
Mean −33.6%−53.9%
Fuel consumed −40.0%−50.0%

