Article

An integrated Multi-Criteria Decision Making Model for Sustainability Performance Assessment for Insurance Companies

by
Ramin Gharizadeh Beiragh
1,
Reza Alizadeh
2,
Saeid Shafiei Kaleibari
3,
Fausto Cavallaro
4,*,
Sarfaraz Hashemkhani Zolfani
5,
Romualdas Bausys
6 and
Abbas Mardani
7,8,*
1
Department of Industrial Engineering, Urmia University of Technology, Urmia 419-57155, Iran
2
School of Industrial and Systems Engineering, University of Oklahoma, Norman, OK 73019, USA
3
Department of Mechanical Engineering, Shanghai Jiao Tong University, Shanghai 430074, China
4
Department of Economics, University of Molise, Via De Sanctis, 86100 Campobasso, Italy
5
School of Engineering, Catholic University of the North, Larrondo 1281, Coquimbo 1240000, Chile
6
Department of Graphical Systems, Vilnius Gediminas Technical University, Sauletekio al, 11, LT-10223 Vilnius, Lithuania
7
Informetrics Research Group, Ton Duc Thang University, Ho Chi Minh City 758307, Vietnam
8
Faculty of Business Administration, Ton Duc Thang University, Ho Chi Minh City 758307, Vietnam
*
Authors to whom correspondence should be addressed.
Sustainability 2020, 12(3), 789; https://0-doi-org.brum.beds.ac.uk/10.3390/su12030789
Submission received: 27 December 2019 / Revised: 13 January 2020 / Accepted: 15 January 2020 / Published: 21 January 2020
(This article belongs to the Special Issue Sustainability Assessment)

Abstract

:
To stay competitive in a business environment, continuous performance evaluation based on the triple bottom line standard of sustainability is necessary. There is a gap in addressing the computational expense caused by increased decision units due to increasing the performance evaluation indices to more accuracy in the evaluation. We successfully addressed these two gaps through (1) using principal component analysis (PCA) to cut the number of evaluation indices, and (2) since PCA itself has the problem of merely using the data distribution without considering the domain-related knowledge, we utilized Analytic Hierarchy Process (AHP) to rank the indices through the expert’s domain-related knowledge. We propose an integrated approach for sustainability performance assessment in qualitative and quantitative perspectives. Fourteen insurance companies were evaluated using eight economic, three environmental, and four social indices. The indices were ranked by expert judgment though an analytical hierarchy process as subjective weighting, and then principal component analysis as objective weighting was used to reduce the number of indices. The obtained principal components were then used as variables in the data envelopment analysis model. So, subjective and objective evaluations were integrated. Finally, for validating the results, Spearman and Kendall’s Tau correlation tests were used. The results show that Dana, Razi, and Dey had the best sustainability performance.

1. Introduction

In the era of Industry 4.0, global concern about sustainable development has been increasing due to serious ecological degradation caused by industrial growth. The effect of industrialization has been studied in different societies. Corporations can have a critical role in attaining environmental sustainability [1]. Sustainability is development which satisfies the current needs without restraining subsequent generations from satisfying their own needs [2]. Various methods have been used to evaluate sustainability in different disciplines [3,4,5,6,7,8,9,10]. Several methods to assess the sustainability performance of firms and companies have been developed [11,12,13,14]. These comprise analyzing the impact of technological innovation and innovation management on firm sustainability performance [14], environmental footprint [15], the Environmental Sustainability Index [16], driving force, pressure, state, exposure, effect, action model [17], and others. Büyüközkan and Karabuluthave provided an overview of these approaches [18]. Hellström studied the structure and concepts of environmentally-sustainable innovation as eco-innovation [19]. Cavallaro et al. proposed an intuitionistic fuzzy algorithm to assess the sustainability of concentrated solar power (CSP) technology [20,21]. Cavallaro developed a sustainability index of biomass based on the Takagi–Sugeno fuzzy inference system [22]. Nilashi et al. proposed a neuro-fuzzy approach for measuring country’s sustainability performance [23].
One of the effective approaches to assess the sustainability performance is to use multi-criteria decision making (MCDM) methods, specially data envelopment analysis (DEA) and AHP. In the next section, we propose a critical evaluation of the literature.

2. Literature Review

Many studies are conducted on performance assessment and sustainability performance assessment using MCDM methods. We conduct a critical evaluation of the literature on MCDM methods, including DEA, AHP, and PCA. Singh et al. proposed a model to build an integrated sustainability performance index for steel industries [24]. Tsolas used an integrated DEA–AHP approach to develop environmental sustainability indices in mineral processing using economic and/or environmental combined indices [25]. Similar frameworks have been developed in the mining and minerals industry [26], design and manufacturing [27], medicine and chemical industry [28], water resource management [29], and country-level sustainability performance [30,31,32]. The majority of studies have utilized the environmental performance of enterprises as the indicator of firm sustainability performance [33,34,35]. Another group of studies have somewhat concentrated on corporate social responsibility inside a certain industry, like financial and banking services [34], renewable energy [32], or supply chain [36,37]. Some studies investigated the sustainability performance of the energy sector for long-term time horizons [38,39,40,41,42]. Some of the papers studied the relationship between an enterprise’s environmental and economic performance [35,43,44,45] or the influence of stakeholders as part of the social dimension [46,47]. Putzhuber and Hasenauer developed 15 indices to measure economic, social, and environmental impacts using governmental data. They found that the available public data show that there are specific impact measures over specific locations [48].
Hatami-Marbini and Kangi [49,50,51,52,53,54] studied the environmental and social externalities related to the semiconductor industry and concluded that the sustainability performance of the related industries can increase because of the more prevailing use of semiconductor equipment within diverse industries. Halkos and Tzeremes [54] studied the sustainability efficiency of 20 countries using a two-stage DEA during 1990–2011. They found that a country’s high production efficiency does not ensure a high eco-efficiency performance. Tajbakhsh and Hassini [55] investigated the sustainability efficiency of fossil-fuel-based electricity generation facilities in two-stage DEA. They found that that neither existing two-stage DEA models nor traditional efficiency ratios sufficiently accounted for the environmental and social impacts of fossil-fuel power generation sources. Wu et al. [56] developed a DEA model to assess the sustainability efficiency of a two-stage system with undesired outputs. The two-stage system consisted of two sub-systems: a production subsystem and a pollution treatment subsystem. Based on their proposed DEA model, three theorems were established to show the relationships between the interest preference parameter and the change in efficiency scores. They captured the actual characteristics of the studied real-world two-stage system and generalized to explore the efficiency level of other similar two-stage systems as well. The study in [57] proposed an adaptable cross-efficiency assessment approach using a DEA model to find the best supplier performance in a semiconductor industry. Hatami-Marbini et al. Reference [58] proposed a four-stage bounded fuzzy DEA model, in a way that all the inputs and outputs are presumed to be fuzzy numbers. They demonstrated the efficiency of the proposed model in evaluating the safety and sustainability performance of various semiconductor manufacturers. Hsu [51] developed a hybrid DEA and improved grey relational analysis to assess environmental efficiency, while Chen et al. [59] developed a new indicator, as a non-disposal degree and a new semi-disposability assumption. They used the new indicators in a traditional DEA approach, replacing the assumptions of strong and weak disposability in environmental assessments. Tsai et al. [52] used conventional DEA models to investigate benchmark industries. Li et al. [60] generalized a three-stage DEA model to measure sustainability performance with a focus on the efficiency of innovation by evaluating the scale, technical efficiency, and pure technical efficiency of innovation in China’s semiconductor manufacturing during 2009–2014.
Tourais et al. suggested that sustainability performance can be measured by investigating the interaction of environment and organizations [61], They also proposed that the environmental data can be more comparable if they are standardized. Liu introduced a general measure for measuring sustainability for renewable energy systems, which includes many fundamental sustainability indices [62]. Nonetheless, few studies have studied experiential profiles of firm-level corporate sustainability or evaluated firm-level variations in sustainability over time. Insurance companies are one of the areas which have not been studied enough. These firms rely on performance evaluation and constant adaptation to stay solvent and competitive. In addition to firm-oriented evaluations, a sector-wide evaluation of the entire insurance sector is conducive to inform mesoscale decision-making in an economy. Such a sustainability evaluation generates a ranking of the insurance companies, providing indicators on the sustainability, transparency, efficiency, and competitiveness of the sector. Besides policymakers, it benefits the rest of the actors in the economy, including stakeholders, consumers, managers, investors, and banks. The main target of ranking insurance companies is to discover their reliability and sustainability. The ranking facilitates unraveling the present and future status of a company in a multidimensional manner, focusing primarily on sustainability, financial, and management aspects.
In addition, because of fast economic growth, the ever-increasing impacts of environmental pollution have absorbed huge attention all around the world [63,64,65,66,67,68]. There are different models within the literature with respect to evaluating sustainability performance [69,70,71,72]. Sueyoshi and Yuan [72] adopted a DEA intermediate method to assess the sustainability performance of Asian countries. Production with pollutant byproducts and pollution assumed as a two-step system have provoked growing attention in the sustainability management field. Undesirable aspects have been considered when evaluating the performance of suppliers [73,74,75,76,77,78,79,80,81], eco-efficiency [82,83,84,85,86,87,88,89,90,91], and resource and environmental [92,93,94,95,96,97] efficiency. Some studies also introduced DEA efficiency evaluation by taking into account unwanted issues, and unwanted factors can be considered inputs or unwanted outputs in the DEA models [98,99,100,101,102,103,104]. Scientists have introduced various methods to address unwanted outputs in DEA [105]. Unwanted outputs are unavoidably generated together with desirable outputs [106].
Several approaches can be utilized for evaluating business sustainability. These evaluations usually primarily make use of data envelopment analysis (DEA), accompanied by other analytical tools, including analytic hierarchy process (AHP), and principal component analysis (PCA).
AHP is a qualitative and quantitative analysis of multi-attribute decision analysis methods, created by [107] to organize and quantify human judgment. Using AHP, the decision-makers can make pure pairwise judgments to prioritize alternatives.
Pearson proposed the principal component analysis approach in 1901. This statistical method can handle problems with multiple variables. The aim of using this method is mainly to deal with data with high dimensions. In the published literature many advantages have been mentioned for the principal component analysis method, two of which are more cited: first, its strength in revealing the hidden patterns in the data and finding the similarities and dissimilarities in the data; second, it makes the data smaller while keeping the important and valuable features [108].
On the other hand, the data envelopment analysis method has been widely used in the performance assessment of various subjects [109,110]. It has been mainly used in assessing the functionalities of educational units, like schools and universities, healthcare units, like clinics and hospitals, financial units, like banks, and so forth. These units in DEA literature are called decision-making units (DMUs) [111,112]. One of the biggest advantages of the DEA method is to enhance the relative efficacy of the decision-making units through optimizing the share of the weighed sum of the outputs to the weighted sum of the inputs [113,114,115,116,117,118,119,120,121]. DEA has a strong discerning ability in finding the valuable information in data [122,123,124,125]. This strength has a direct negative relationship with the number of variables, which means when the variables are more, DEA cannot reveal the useful patterns effectively [126]. Additionally, DEA’s discerning ability decreases when the number of DMUs is not considerable and the number of variables is high [108,127]. In the case of these constraints and difficulties, the currently-used DEA approaches typically produce solutions with a huge number of DMUs. Therefore, there are huge efforts going on to enhance DEA’s power in discerning. For instance [128], proposed a DEA model which uses multiple criteria to leverage the discerning ability in assessing the efficiencies of investments firms using a multi-objective linear programming framework. In another study, an approach was developed to enable weight restriction in their domain directly [129]. They defined the notion of an assurance region (AR) to investigate the efficacy of the linear production likelihood set. In their proposed AR, several linear homogeneous constraints are imposed on the input and output multipliers. They found that AR can diminish the number of options for the overall efficacy if it is applied in technically efficient organizations. Reference [130] used a pessimistic–optimistic method of DEA to take into account both pros and cons of the decision-making units to decrease the impact of a high number of variables. They used this method in performance evaluation in the revenue distribution process. In another study, [131] introduced a method based on maximum variance to reduce the dimension of the data via the Gram–Schmidt method. The selected Gram–Schmidt factors were then inserted in the developed DEA approach with a natural AR. The study in [132] proposed an adjusted network data envelopment analysis (NDEA) model for assessing the sustainability performance of an energy supply chain in Iran from production to distribution stages. The study in [133] added economic dimensions such as corruption and population to the DEA model to increase the discerning power of the DEA model. Thus, it is necessary to reduce the data dimensionality or the number of variables in the DEA structure, especially in the presence of large dimensionality of the data set.
There have been DEA studies that improved the methodology by reducing the number of input/output variables. Reference [134] described a systematic multivariate statistical approach to omit some inputs and outputs that are highly correlated with the retained ones and decide which of the original correlated variables can be omitted with least loss of information and which can be retained. They concluded that even omitting variables that are highly correlated, and thereby contain little additional information on performance, could have a significant influence on the computed efficiency measures. Using PCA, [135] suggested a methodology that produces uncorrelated linear combinations of original inputs and outputs to improve discrimination in DEA with minimal loss of information. The study in [136] applied similar data reduction methods and evaluated deregulated airline networks to measure the quality of Western European airports. Reference [137] proposed a new DEA framework to evaluate the healthcare performance of different districts in Istanbul, Turkey. They suggested an imprecise data envelopment analysis approach, which sets forth a more realistic decision methodology for evaluating the relative health-care performance and enables the determination of the best district in terms of health-care performance in Istanbul. Reference [138] implemented DEA to evaluate the economic performance of 18 cities in China. The results indicate that there is the same rank of performance by using either the PCA or constant returns to scale (CRS) model in DEA. The PCA procedure adopted by [138] was slightly modified in [139] study by incorporating other important featured of ranking that [138] did not consider. The study in [140] changed the undesirable outputs to be desirable ones and then performed PCA on the ratios of a single desirable output to a single input. Finally, the transformed principal components were treated as outputs into DEA models with an assurance region (AR). Reference [141] suggested that the variables could be divided into groups based on their logical composition concerning the production process to reduce data dimension using PCA as a means of weighting inputs and outputs and summarizing them parsimoniously rather than selecting them.
Most of the studies in the literature conducted evaluations of insurance companies using DEA models, and [142] evaluated 22 insurance companies over the period 1999–2004 to study the technical efficiency of China’s insurance industry. First, they calculated the efficiency scores, and then they conducted a regression analysis to identify the critical determinants of efficiency. The study in [143] measured the efficiency of the insurance industry in China from 1999 to 2006 based on the multistage DEA model and showed that the efficiency scores of insurance firms are underestimated if the endogenous risk factors are not considered. References [144,145] employed a two-step procedure of the DEA process to evaluate the efficiency in the Greek insurance industry. Reference [146] applied a variant of the DEA model to examine the active insurance companies in the life insurance sector in India. Their results indicate a significant imbalance in the levels of cost efficiency during the years 1982–2001. The study in [147] used a two-stage DEA approach to evaluate 24 non-health insurance companies in Taiwan. Grmanova and Strunz [148] identified the relationship between the technical efficiency and profitability of insurance companies. They analyzed 15 commercial insurance companies in Slovakia in the period of 2013–2015 using a DEA model. Malyovanyi et al. [149] estimated the influence of social expenditures and their structure on economic growth in the OECD countries for the years 1980–2015. They improved the functioning of non-state social insurance institutions in Ukraine. Horsch et al. [150] conducted a detailed survey of deposit insurance systems in post-Soviet countries since 2017. They collected and covered 15 post-Soviet countries’ insurance systems completely. They found that post-Soviet countries are on their way to developing deposit insurance systems that can effectively protect clients and help establish a stable financial system. Simionescu [151] studied the Romanian insurance market, considering ten representative insurance companies, taking into account the qualitative changes in the legislative basis after Romania’s entry into the European Union and the global economic crisis. They used a panel autoregressive-model (PVAR) model for the ten insurance firms during 2004–2017. They found that the indemnities paid by the insurance firms negatively influenced the liquidity, but with a lag of two periods after changes in indemnities. Jurickova et al. [152] evaluated the technical efficiency of the National Innovation System within a sample of European Union (EU) countries using DEA. Trynchuk [153] identified the role of universities in spreading social responsibility practices in the insurance market. Nesterchuk and Prokopchuk [154] investigated the existing state and projections for future growth of the Ukrainian agrarian insurance system based on developing the strategy of development of the latter with maximum attention to the needs and interests of all its contributors.
In addition to the classical application of DEA, several studies extended the DEA models. For example, Reference [155] evaluated and examined a set of Japanese life insurance companies in the two aspects of production yield and productivity change using a nonparametric DEA model by using panel data from 1988–1993. Reference [156] provided new empirical evidence on the efficiency of frontier measures in the international insurance industry. In their study, the efficiency scores of 6462 insurance companies in 36 countries were computed using the Stochastic Frontier Analysis (SFA) and DEA models.
Classic PCA determines the weight of the principal components based only on objective survey data. Hence, some studies combined AHP with PCA and built weighted PCA. Weighted PCA uses AHP to identify the weight of each assessment criterion. For example, [157] used the modified AHP to identify the weights of primary indexes. Then, instead of the primary indicators of the pervasive principal component index, for each principal component, they used the linear weighted value as a pervasive assessment. Compared with other evaluation methods, weighted PCA, which is the integrated AHP–PCA model, is more efficient in reducing dimension and the calculation load. It also retains the most information of the original data.
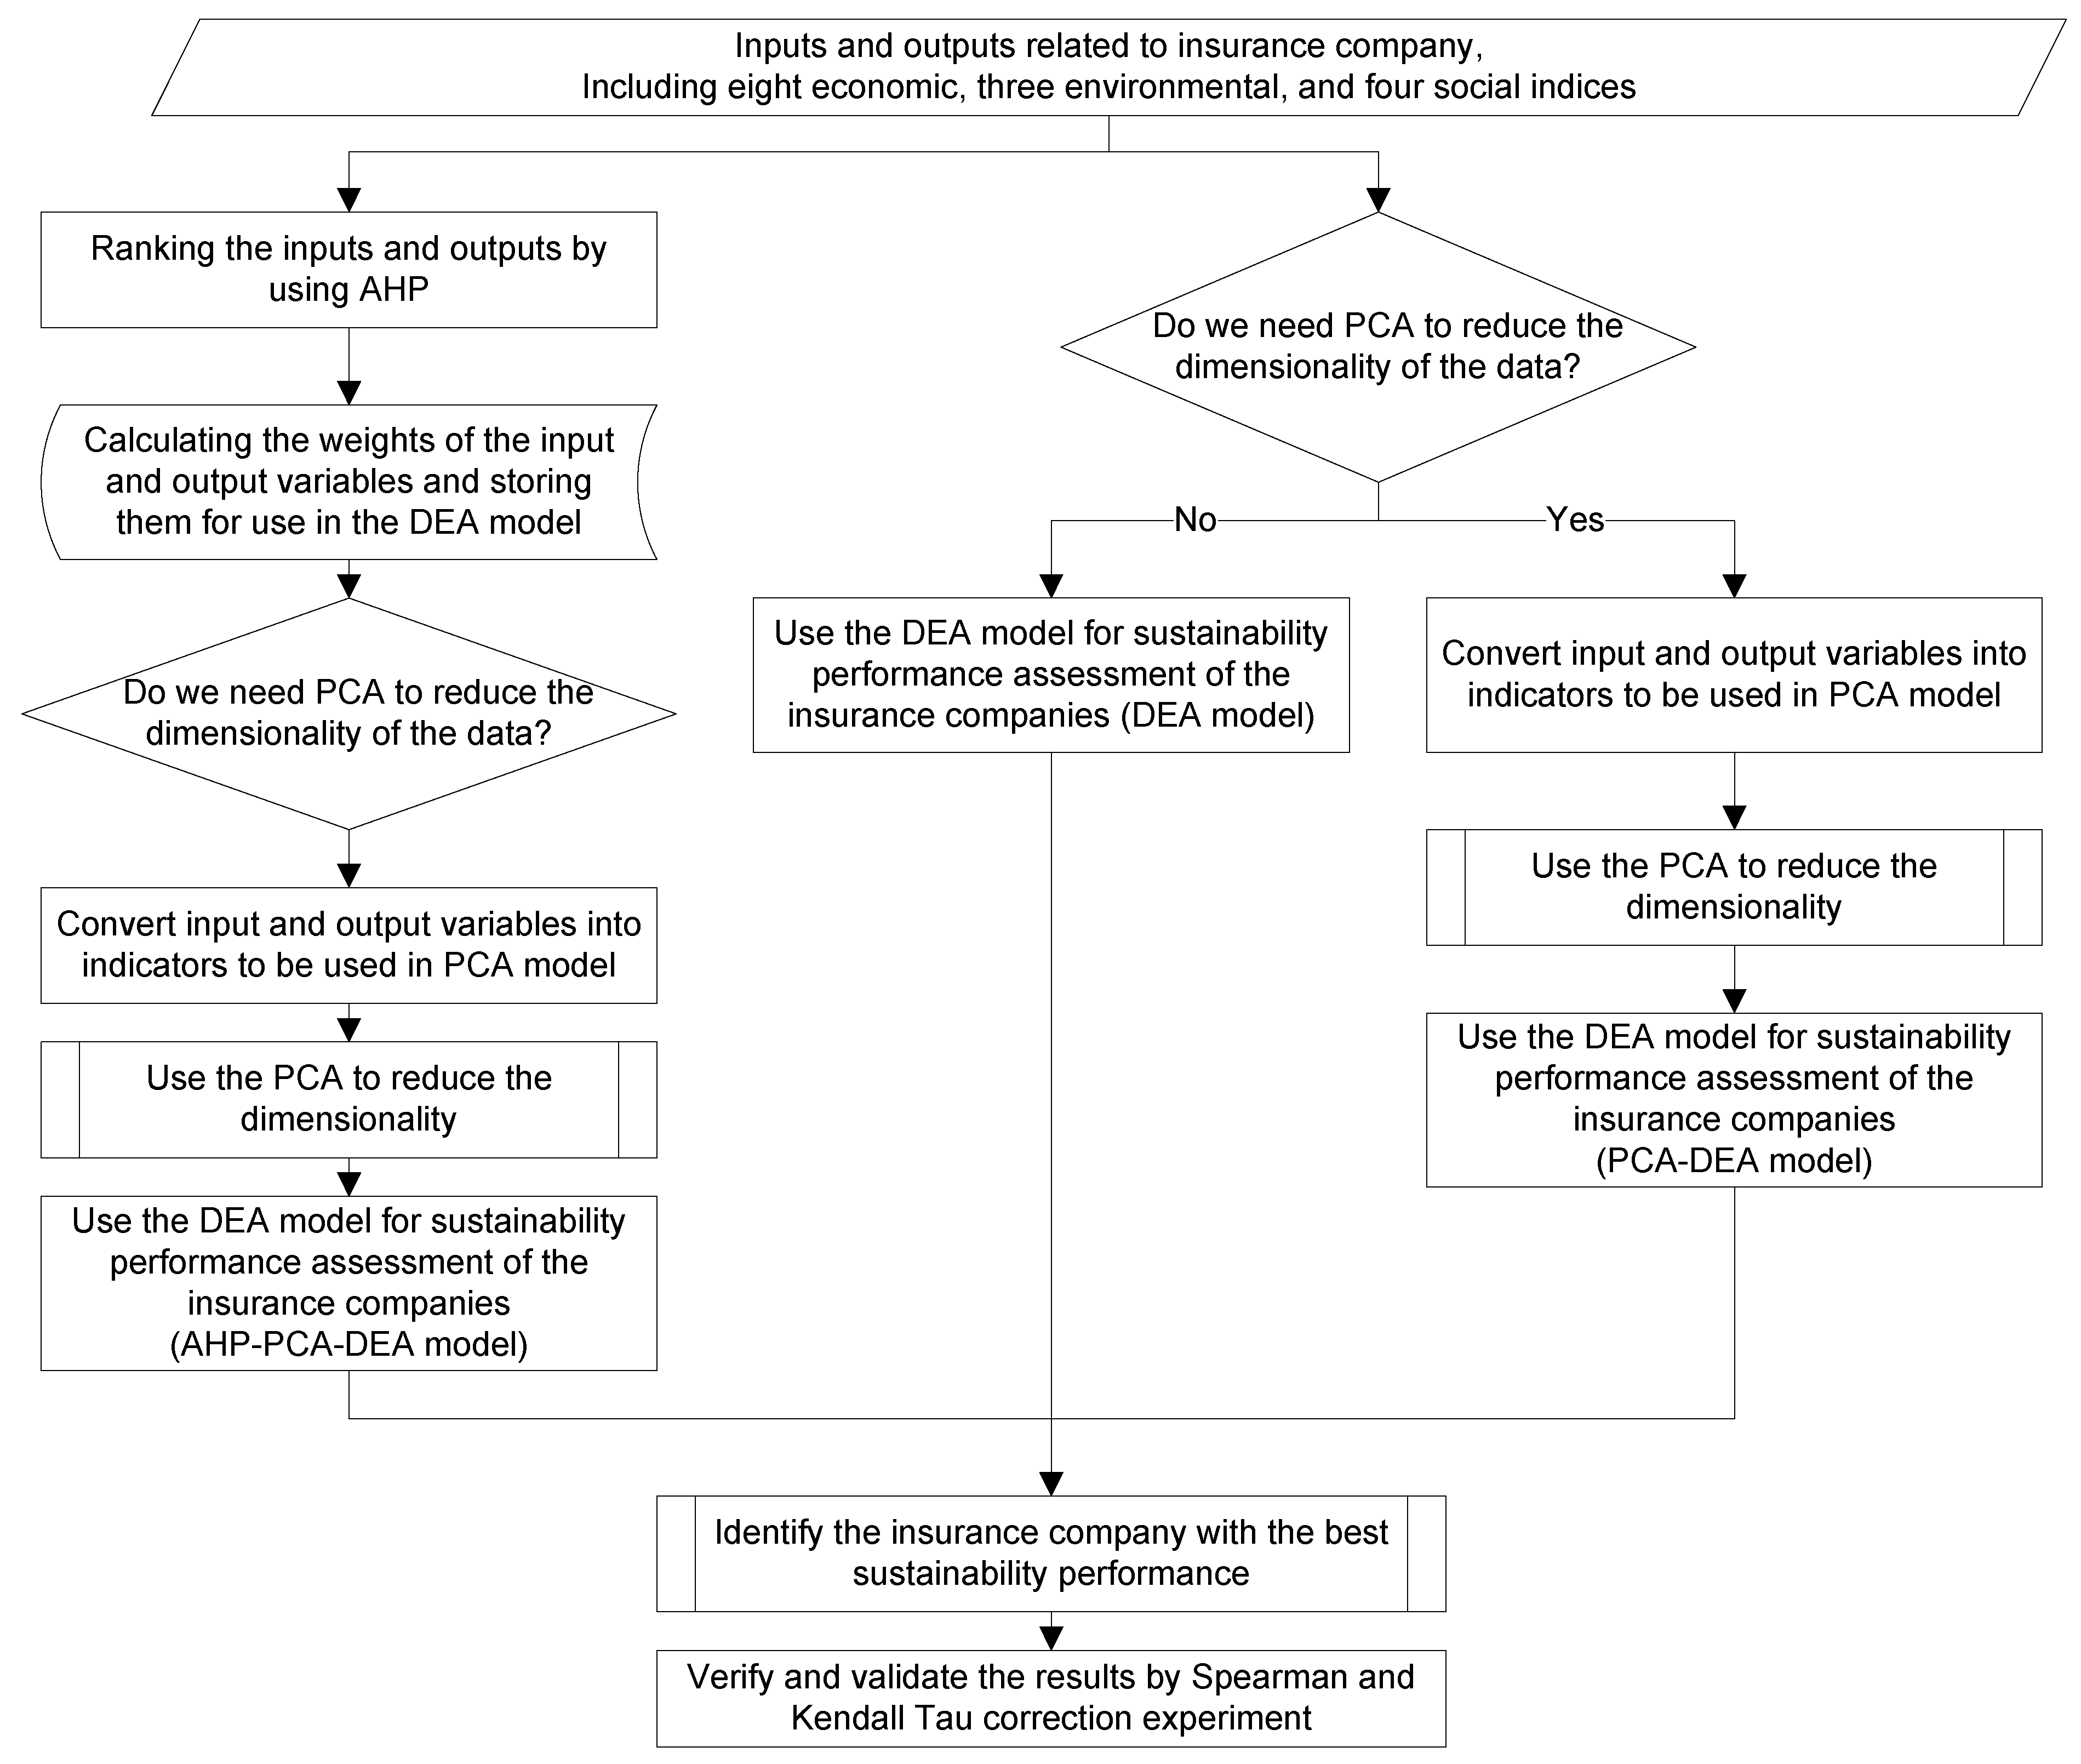
The aim of this paper is to measure the performance and efficacy of insurance firms based on different economic aspects whose values may cause economic recession or growth. Our contribution is to use principal component analysis and analytic hierarchical process techniques to improve the discerning power and effectiveness of the conventional DEA. These modifications of the conventional DEA, along with utilizing the optimal set of indices, leads to an increase in the accuracy of the performance assessment. In other words, we successfully address one of the limitations of conventional DEA. That is, the computational expense caused by increased decision units due to increasing the performance evaluation indices (for more accuracy in the evaluation). To accomplish this goal, we use PCA to cut the number of evaluation indices, and since PCA itself has the problem of merely using the data distribution without considering the domain-related knowledge, we utilize AHP to rank the indices through the expert’s domain-related knowledge.
Multiple criteria decision-making (MCDM) methods are used in this study for finding the “appropriate” pair of weights. We use analytic hierarchy process (AHP), which is a qualitative and quantitative analysis of multi-attribute decision analysis methods created by [107], to identify the “optimal” weights in the model. Using AHP, the decision makers can make pure pairwise judgments to reach the overall priorities for the alternatives [158,159]. Because of its simplicity, ease of use, and great flexibility, the AHP has been studied extensively and used in nearly all applications related to MCDM since its development [160,161,162,163].
Also, we use principal component analysis (PCA), which was proposed by [164] as a multivariate statistical approach to reduce data dimensionality. The advantage of PCA is that it defines a mapping from the original space to the principal coordinates, and hence that if a new point x arrives, its projection onto the principal coordinates defined by the original n data points can be computed [165,166,167,168].
The data compression is done by transforming the original data into a new set of variables, the new principal components, which are uncorrelated with each other. Based on the degree of importance, the principal components will be in descending order, and only the first several most important ones can be retained. Using PCA, we minimize the limitations of the previous studies, e.g., multicollinearity, subjectivity, and high computation requirement, and it has strong objectivity.
Then, we evaluate a numerical example of this methodology. The remainder of this paper is structured as follows: Section 2 introduces the methodology of the proposed model; in Section 3, the case study and running algorithm of the proposed model are presented; Section 4 shows the results and discussion; and finally, the conclusion is summarized in Section 5.

3. Method

Our case study had a large number of input and output variables in comparison to the number of DMUs. PCA was used to reduce the number of input and output variables, and then this dimension-reduced data was entered in a modified DEA to improve DEA’s discrimination power. We also used expert judgment to rank both objective and subjective results. Usually, there are two different approaches to determine the weight of indicators, namely, subjective weighting and objective weighting. Subjective weighting is a way to give indicator weights based on the judgment of experts, who subjectively determine that specific indicators are more important than the others. As shown in Figure 1, we obtained the weights of inputs and outputs by AHP and integrated AHP with PCA, and the number of variables was reduced by weighted principal component analysis (WPCA), then the input-oriented DEA model was used to get the ranks of each DMU. Finally, the results of the two approaches were verified and validated by the Spearman and Kendall tau correlation experiment.

3.1. AHP–PCA Model

We integrated AHP and PCA to convert the linguistic judgments into numerical scales, simplify our complex evaluation problem focusing on their interest in comparison of just two criteria, and improve their consistency. MCDM methods can support decision-makers in this process [169,170], and can be used for finding the appropriate pair of weights. In other words, we looked to identify the optimal weights for the sustainability performance. The analysis of complex decisions involved the evaluation of activities using multiple criteria to determine the best alternative action [171,172]. AHP is the popular method in decision-making, which only needs the decision-makers to compare each pair of objects and provide their preference values.
This can happen since the main thought of AHP is to decompose the complex problems into sub-problems, to classify these sub-problems by dominance relationship, and to construct an orderly hierarchy. According to a particular percentage scale for assigning the relative importance of evaluating elements, a pairwise comparison allows the conversion of subjective assessments into numerical scales, breaks down the problem into a two-choice comparison, and enhances their reliability. The importance level of one element in this paper is expressed as a scale of 1–9, as shown in Table 1. Scale 1 means the two elements are of equal importance, and scale 9 means one is hugely more important than the other.
According to [138,139,140], PCA was applied to evaluate and rank the performance of n decision making units (j = 1, 2, …, n) with m inputs (i = 1, 2, …, m) and s outputs (r = 1, 2, …, s), for which the ratio between every output and every input is as in Equation (1):
d i r j = y r j x i j r   = 1 ,   2 ,   ,   s i = 1 ,   2 ,   ,   m
The bigger d i r j is, the better the performance of D M U j   regarding the output and the i th inputs. Now, let d k j =   d i r j , e.g., k = 1 corresponds to i = 1, r =1 and k = 2 corresponds to i = 1, r = 2, etc., where k = 1, 2, …, p and p = m*s. We need to find some weights that combine those p individual ratios of d k j for D M U j . Consider the following n*p data matrix composed by d k j in Equation (2):
D = [ d 1 ,   d 2 ,   ,   d p ] n p
Each row represents p individuals’ ratios of d k j for each DMU and each column represents a specific output/input ratio. That is, d k =   [ d 1 1 ,   d 2 2 ,   ,   d k n ] T . PCA was employed to search for a component structure by factoring the sample correlation matrix D and finding out new independent measures, which are different linear combinations of d 1 ,   ,   d p . Principal components can be combined by their eigenvalues to obtain a weighted measure of d j . The PCA process D was carried out as follows.
Step 1: Normalize the ratio matrix.
To normalize the ratio matrix (D), Equation (3) is used:
D ˜ = [ d ˜ 1 ,   d ˜ 2 ,   ,   d ˜ p ] n p =   [ d ˜ k j ] n p
where d ˜ k j = ( d k j   d k ¯ ) s k k , the sample mean d ¯ k =   1 n   j = 1 n d k j , and sample variance s k k =   j = 1 n ( d k j d k ¯ ) 2 ( n 1 ) .
Step 2: Calculate the sample correlation matrix.
To calculate the sample correlation matrix (R), Equation (4) is used:
R = [ r k i ] p p
where r k i = ( n 1 ) s k i   s k k s i i and s k i = 1 n 1   j = 1 n ( d k j     d k ¯ ) ( d k j d i ¯ ) .
Step 3: Solve the following equation: | R   λ I p | = 0 , where i is a p × p identity matrix. We obtain the ordered p characteristic roots (eigenvalues) λ 1   λ 2   λ p with k = 1 p λ k = p and the related p characteristic vectors ( l 1 k ,   l 2 k , ,   l p k ) (k = 1, …, p). Those characteristic vectors compose the principal components p c k . as in Equation (5):
P C k =     D ˜ [ l 1 ,   ,   l p ] =   [ P C 1 ,   ,   P C p ] n p
Step 4: Select the principal component by defining ρ =   k = 1 M λ k k = 1 p λ k =   k = 1 M λ k p . The first M components may be selected by satisfying, e.g., ρ > 90 % , i.e., the first M principal components account for 90% of the contribution to the total sample variance (the other proposal to select the principal components can be λ > 1 ).
Step 5: Establish the principal of weighted PCA.
In this step, we create the weighted standardized PCA. The weighted standardized index is D k , and it is shown in Equation (6).
D k =   w k D ˜
where w k is on behalf of the important weigh of index k determined by AHP. So, the new principal component is established as in Equation (7).
  P C M = D k [ l 1 ,   ,   l p ]
Reference [173] showed that ranking by PCA may not be reliable. So, the chosen principal component was considered as the output of the DEA. However, the output of the original DEA model should be highly positive, but some of the principal component values can be negative. References [174,175] proved that the following linear equation could be used to fix this problem. Reference [140] also used the linear equation. Therefore, the following linear equation was used to achieve positive data, as in Equations (8) and (9):
Z j k = p c k j + q
  Q = min { P C k j }   1 k M , 1 j n + 1
By this linear equation, the entire chosen principal component increases with the same rate. Since the nature of the principal components is increasing, all input variables were considered as outputs for DEA.

3.2. Modified DEA Model

Reference [176] proved that the input-oriented (Banker, Charnes, and Cooper) BCC model is output translation invariant. Reference [177] further proved that an input-oriented Charnes, Cooper, and Rhodes (CCR) model with a single constant input (or dummy) coincided with the input-oriented BCC model. To evaluate the operational efficiency of DMUo, a simplified input-oriented CCR model was proposed, as follows in Equation (10):
M a x   w o =   k = 1 M p k z k o s . t . k = 1 M p k z k j 1 , j = 1 ,   2 ,   ,   n ;   p k 0 ; k = 1 , , M
In the model (10), the possibility of a resolution between the DMUs is weak. It is possible for some DMU to achieve the same performance. Fixing this problem using the assurance region (AR) is essential. A similar AR for the weight constraints was successfully applied to rank voting by [140,178,179]. The model proposed by [180] is as follows in Equation (11):
M a x   w o =   k = 1 M p k z k o s . t . k = 1 M p k z k j 1 ,                       j = 1 ,   2 ,   ,   n ;                     j   0 p k p k + 1 ε k                                 k = 1 ,   2 ,   ,   M 1 ε =   { 0                           λ k =   λ k + 1   ε > 0           λ k >   λ k + 1   p k 0                                 k = 1 ,   2 ,   ,   M .
In model Equation (11), p k is the weight assigned to outputs z k j ,   j = 1 , 2 , , n , and the weight constraints p k   p k + 1   ε k represent the fact that the kth principal component carries the total dispersion more than the kth one does. To obtain the efficiency of the DMUs, model Equation (11) must be calculated separately for each DMU. Therefore, a new model is proposed to save time and calculate the efficiency easily in this paper. The proposed model is as follows:
M A X   ( 1   d o )
s .   t .
k = 1 M p k z k o +   d o = 1
k = 1 M p k z k j 1 ,                       j = 1 ,   2 ,   ,   n ;                     j   0
p k p k + 1 ε k                                 k = 1 ,   2 ,   ,   M 1
ε =   { 0 λ k =   λ k + 1 ε > 0 λ k >   λ k + 1
p k 0                                 k = 1 ,   2 ,   ,   M
d o 0
where w o = 1   d o . For all DMUs, the model Equation (12) was converted to the model Equation (13) as follows:
M A X o   ( 1   d o )
s .   t .
k = 1 M p k o z k o +   d o = 1
k = 1 M p k o z k j 1 ,                       j = 1 ,   2 ,   ,   n ; o   j
p k o p ( k + 1 ) o ε k o                                 k = 1 ,   2 ,   ,   M 1
ε =   { 0 λ k =   λ k + 1 ε > 0 λ k >   λ k + 1  
p k o 0                                 k = 1 ,   2 ,   ,   M
d o 0                                 o .  

4. Empirical Study

To demonstrate the efficacy of our proposed method, Iranian insurance companies were used as an example to be evaluated and ranked during 2019. The data for public and private insurance companies were retrieved from the Iran Central Insurance database. The private companies were Dana, Asia, Alborz, Moallem, Persian, Toseeh, Razi, Karafarin, Sina, Mellat, Dey, Saman, Novin, Pasargard, and only the Iran Insurance company was a public (governmental) company. In Iran, the insurance companies can operate in both the health and non-health insurance industries. We used indicators generated using both health and non-health insurance companies’ statistics.
The primary step in the performance evaluation was selecting the indices. The indices were divided into two overall subsets. The first type of indices evaluated the performance in financial aspects, and were based on the equities: operating costs, investment costs, rights of equities, the premium of insurance issued, total assets, net profit, investment income, and total debt. The second type evaluated performance in managerial aspects: number of agents, number of branches, number of employees, number of issued insurances, and total payable compensations. In this paper, the input and output variables were as shown in Table 2.
As shown in Table 2, there were seven input variables, three of which were purely economic variables, one was purely social, one was purely environmental, and two were environmental. The third input variable included zero energy buildings, developing renewable energies, and sustainable agricultural and industrial projects. Operating costs are expenses that are given to personals, sale networks, and all factors relating to insurance rights.
Investment costs are the total of premiums, which become large cash that will be invested in addition to collected deposits and other financial resources of insurance companies. These amounts were considered as indexes of long-term and short-term investment costs.
With respect to the sixth input variable, total assets, total receivable claims were considered as assets of insurance companies.
In calculating the total debt, we considered whether corporate or legal individuals were included or not.
In calculating the number of issued insurances, we considered the total number of the issued insurance—that is, insured by companies, including individuals and groups in any field. In this adjoined issued insurance, previously issued was not included.
In calculating the total payable compensations, we considered the statistics of the total payable compensation as representing the number of cases which insurance companies have paid. This also showed the volume of the activities of insurance companies allocated to compensation in the entire insurance field for a year.
The values for ranking and implementation of the model’s algorithm relating to 14 insurance companies for seven input and six output variables are presented in Table 3.
In the DEA model, the number of DMUs was approximately three times the number of variables. Therefore, the PCA model was applied to reduce data. In PCA, as mentioned in the methodology, a single output was divided into a single input, and the resulting ratios were considered PCA indicators. These ratios were normalized as the first step of PCA. The output/input ratios and data normalization were just calculated and not mentioned here to prevent data excess. Next, the correlation matrix was calculated, and Eigenvectors and their corresponding Eigenvalues were obtained from the correlation matrix. According to the ascending order, the first column includes a vector corresponding to the largest Eigenvalue, and the last vector is corresponding to the smallest Eigenvalue. In PCA, for calculating principal components, eigenvectors obtained in the previous step are multiplied by the standard matrix. In this paper, for incorporating the expert judgments in the results, the AHP weights were imported to the PCA model. The AHP weights provided from the insurance experts’ preferences by using Super Decision software are shown in Table 4.
As described in the PCA model, according to Equation (1), input and output must be converted to a single ratio. Thus, the input and output weights that were obtained from AHP should be converted to a single weight ratio ( d k ). It was assumed that the ratio weights should be obtained by dividing outputs weights to inputs weights, but a simple example shows the weakness of this procedure. We recommend that the weights of inputs and outputs should be multiplied together as follows:
w d 14 = w O 2 w I 7 =   0.1738 0.21478 = 0.8092 , w d 30 = w O 5 w I 2 =   0.01689 0.0208 = 0.812  
As shown above, the single ratio d14 included two important indexes in comparison to d 30 . However, w d 30   was more important than w d 14   , which has inconsistency with the decision-maker (DM) view. In contrast, by multiplying the input and output weights, the results obtained for d14 and d30 were more reasonable, as shown below:
w d 14 = w O 2   w I 7 =   0.1738 0.21478 = 0.0373 , w 30 = w O 5   w I 2 =   0.01689 0.0208 = 0.000351  
So, the single ratio weights were calculated by multiplying the input and output weights. Then, to achieve the final weight, the weights obtained were normalized by using w d k ˜ =   w d k k = 1 p w d k . The results are shown in Table 5.
Then, the weights were used with the PCA method. According to Equation (6), each index’s weight was multiplied first with the standard matrix, and then the result was multiplied by the Eigenvectors matrix to find the principal components. The results were sorted in descending order by coding WPCA in MATLAB software and displayed in Table 6.
There were 42 principal components. The principal components that have the highest proportion of total variance are the most important. Based on their proportion, several principal components were selected to satisfy ρ > 90 % . In fact, at this stage, reducing dimension was done, and the condition of running DEA with high discrimination was available. By selecting the first five principal components, we could satisfy   ρ > 90 % . These five major components were considered output variables for DEA Equation (13). However, these principal components included negative values, which cannot be used in DEA. So, by using Equation (9) Q =   m i n { P C k j } + 1 ,   1 k M ,   1 j n , a total of five principal components were positive and ready to enter the DEA model. The positive five principal components are shown in Table 7.
To achieve the final ranking of the insurance companies, the resulting positive indicators were used in DEA Equation (13). For further evaluation and validation of the model, the ranking was done without using the AHP method, just by applying the PCA–DEA model. The results obtained from Lingo software are shown in Table 8.

5. Results and Discussion

Table 7 shows the results of the models. According to the results of the AHP–PCA–DEA model, three units had an efficiency score W0 greater than one. Three DMUs, namely DMU2 (Dana), DMU8 (Razi), and DMU11 (Dey), showed the highest performance. Among them, DMU2 (Dana) was the most efficient, and it achieved the best ranking. Also, in the PCA–DEA model, two units, DMU11 (Dey) and DMU2 (Dana), had an efficiency score higher than one. In this model, DMU2 (Dana) was dedicated to the best ranking too. At the end of 2018, Dana insurance company was converted to a private company. Therefore, with changing management strategy during 2019, it increased by 73.1% in attracting premiums, which shows public confidence in the company in the insurance market. In fact, this company can get 9% of the market share in this index. Also, it increased its performance in rights of equities and investment income by about 50% and in d7 (32.7), which is very important, it had the highest performance. All of these indicators are important for decision makers and play a vital role in the ranks of DMUs. Therefore, Dana insurance company is the most sustainable company according to the indicators.
As shown in the right-hand side of Table 7, we integrated two different MCDM models, including AHP and DEA. According to the results, DMU8 in the PCA–DEA model achieved rank five, but in the AHP–PCA–DEA model it improved its rank to be second. This subject indicates that DMU8 is a more sustainable unit, based on the indicators that are important for decision makers. As evident from the results, two DMUs, namely DMU1 (Iran) and DMU6 (Persian), had low ranks in both of the models. Although DMU1 (Iran) was the only national insurance company and has a significant market share in the insurance industry of Iran, it was confronted with high, increasing operating costs and total payable compensations in 2019. Also, it faces decreasing its stock value in the stock market. Besides this, the results of AHP–PCA–DEA show a considerable variation in efficiency scores, ranging from 0.9259 to 1.0732. The mean of the efficiency scores for all the firms in the AHP–PCA–DEA model was 0.9995, which shows that insurance companies have excellent performances and work in a perfectly competitive market. We also used two statistical tests, Spearman and Kendall Tau. The results of the Spearman test of DEA–PCA and DEA–PCA–AHP concluded by showing meaningful correlation between them. In addition, the Kendal Tau test showed the same result, which means a meaningful correlation between the two methods’ results. The value obtained by the Spearman test (i.e., 0.96) illustrates a rigorous direct correlation between the two models. Similarly, the value obtained by the Kendall Tau test (i.e., 0.87) reveals a rigorous correlation between the results of the two ranking methods.
According to the analysis given above, similar conclusions can be reached by comparing the distribution of the number of efficient DMUs in different years, indicating that there is great potential for improvement in the sustainability performance. It is also worth noting that sustainability performance scores in the traditional DEA approach tend to form a higher assessment, so the insurance sector may be overestimating its performance in the development of environmental protection.
We now compare the decision of the weights in this study with previous studies. The sustainability performance was computed, for instance, as the arithmetic average of sustainability performance weight [181], or over a set weight of α = 0.5 [182], a mutual set of weights [82]. Previous studies illustrated the differences between the sustainability performance scores and weights [183]. Nevertheless, the average sustainability performance scores vary based on changing weights. The overall sustainability performance changes must reflect variation in the weights, and we suggest using the newly-defined overall performance sustainability after the calculations are performed. Decision-makers can choose the appropriate weights to maximize the new overall sustainability performance score [184]. From the prior literature, one can obtain insights concerning the overall score as a function of the score of the entire set of decision-making units. Under the PCA modification and the weights of the AHP method, we investigated whether any unique sustainability performance decomposition exists. We assumed the overall sustainability performance of a multi-dimensional network is the product of the sustainability performance of each decision-making unit. In other words, our approach provides a comprehensive view of the relationship between the overall sustainability performance and the varying weights. This indicates unique a sustainability performance index, and the new overall sustainability performance is uniquely determined. References [158,159,169,170,178] noted that the information on the overall sustainability performance modifications from the conventional DEA, along with utilizing the optimal set of indices, leads to an increase in the accuracy of the performance assessment. However, they did not address the computational expense caused by increased decision units due to increasing the performance evaluation indices (to more accuracy in the evaluation). In other words, we successfully addressed one of the limitations of conventional DEA. That is, to accomplish this goal, we used PCA to cut the number of evaluation indices, and since PCA itself has the problem of merely using the data distribution without considering the domain-related knowledge, we utilized AHP to rank the indices through the expert’s domain-related knowledge. This is the exciting aspect of the differentiation between previous analyses that only used AHP to help the DEA process and increase the computational expense, while our approach managed the computational expense by reducing the dimensionality through PCA.

6. Limitations

In this article, we designed an integrated MCDM model and used the AHP weighting method. Then, we demonstrated the sustainability performance assessment problem using an example of insurance companies. However, there were some limitations in our approach which must be addressed in the future. The developed MCDM model used an integration of AHP, PCA, and DEA methods by analyzing a specific example of Iranian insurance companies, and it was not validated in a generalized scheme. In other words, to understand if the evaluation results are valid, a long-run and more general tracking study may be needed. For instance, sustainability performance assessment in other insurance companies in other countries needs to be studied. Also, other firms need to be studied using the same study framework.
In addition, in the AHP weight computation process, we invited nine experts (six from academia, three from industry) to create the pairwise comparison matrix. The elements of the matrix (priorities of the criteria) were identified by compromising their arguments, and the element adjustment step was conducted in the same manner when the consistency test failed. Nevertheless, the AHP weighting outcome would be more reliable if more experts were involved, through the integration approaches of group decision [185] or statistics [186]. This means that inviting more experts from more diverse disciplines may stabilize biases and the incompleteness of their knowledge.
Furthermore, in the AHP process, we chose the elements of the comparison matrix in a specific way which was exclusive to our specific problem, and so the distribution may differ with the particular evaluation problems because of the decision-makers’ judgements, as they always have their own preferences for specific criteria. Various distributions are also acceptable with various elements. Measuring the uncertainty of the attribute value is also another future direction of study which is worthy of investigation and was not dealt with in this article.
It is a non-trivial task to evaluate the sustainability performance of the existing insurance companies with MCDM approaches because the non-uniqueness of the evaluation outcome is not only due to the change in the type of the MCDM method but also due to the complexity of finding a proper criteria set. For the evaluation of the insurance companies’ sustainability performance, we just considered the operational level in this study. Moreover, the chosen social and environmental indices were closer to socio-economic or eco-economic aspects and were not purely social aspects. Therefore, another future direction of our research would be selection of purer social and environmental aspects of the sustainability performance evaluation.

7. Conclusions

This paper proposed an integrated AHP–PCA–DEA model to rank Iranian insurance companies. Fourteen insurance companies were evaluated using 13 sustainability performance indices as a practical, real-world problem. The proposed model made a quick evaluation of the sustainability performance possible, which saved a tremendous amount of computation expense by reducing the number of indices required for an accurate sustainability performance evaluation. The PCA method was used to reduce the number of dimensions of the original dataset. The obtained principal components were then applied as variables in the DEA model. To avoid absolute objectivity or absolute subjectivity and take the advantages of both approaches, the AHP and PCA models were integrated. Our contribution is to incorporate AHP and PCA to conventional DEA to modify the over-objective results of DEA and use the effective set of indices to evaluate the insurance companies more accurately. In other words, one of the limitations of the DEA is that by increasing the sustainability performance evaluation indices (more accuracy in the evaluation), the number of decision units should be increased, which is more computationally expensive. So, we first used PCA to decrease the number of evaluation indices. PCA itself has the drawback of only using the distribution of data and it does not consider the domain knowledge. So, we used AHP to weigh the indices by using the experts’ domain-related knowledge.
Finally, for validating the results, two Spearman and Kendall’s Tau correlation tests were used. The results showed that Dana, Razi, and Dey had the best sustainability performance, with Dana being the most efficient and achieving the best ranking. In the standard DEA model, to obtain the efficiency of DMUs, the model must be calculated separately for each DMU. In this paper, we calculated the values for all the DMUs simultaneously using a linear equation. This is the first contribution of this paper. Also, increasing discrimination power in the conventional DEA model is a challenging problem which causes computational expense. So, using PCA as a dimensionality reduction method to reduce this computation cost/time is the second contribution of this paper. Additionally, the output of the original DEA model should be highly positive, and this is not possible when we use PCA. So, this linear equation also enables us to achieve positive data, which is the third contribution of this paper.

Author Contributions

R.G.B.: Conceptualization, Data curation, Investigation, Methodology, Software, Validation, Visualization, Writing—original draft; R.A.: Conceptualization, Investigation, Methodology, Software, Project administration, Resources, Validation, Writing—original draft, Writing—review & editing; S.S.K.: Conceptualization, Data curation, Investigation, Methodology, Software, Visualization, Writing—original draft; F.C.: Funding acquisition, Resources, Project administration, Writing—review & editing; S.H.Z.: Funding acquisition, Project administration; R.B.: Funding acquisition; A.M.: Funding acquisition. All authors have read and agreed to the published version of the manuscript.

Funding

This research received no external funding.

Conflicts of Interest

The authors declare no conflict of interest.

Correction Statement

This article has been republished with a minor correction to the author's contact information. This change does not affect the scientific content of the article.

References

  1. Jorgenson, A.K.; Clark, B. Societies consuming nature: A panel study of the ecological footprints of nations, 1960–2003. Soc. Sci. Res. 2011, 40, 226–244. [Google Scholar] [CrossRef]
  2. Li, H.; Dong, K.; Sun, R.; Yu, J.; Xu, J. Sustainability assessment of refining enterprises using a DEA-based model. Sustainability 2017, 9, 620. [Google Scholar] [CrossRef]
  3. Gaziulusoy, I.; Erdoğan Öztekin, E. Design for sustainability transitions: Origins, attitudes and future directions. Sustainability 2019, 11, 3601. [Google Scholar] [CrossRef]
  4. Alkhayyal, B.; Labib, W.; Alsulaiman, T.; Abdelhadi, A. Analyzing Sustainability Awareness among Higher Education Faculty Members: A Case Study in Saudi Arabia. Sustainability 2019, 11, 6837. [Google Scholar] [CrossRef]
  5. McGinley, K.A.; Robertson, G.C.; Friday, K.S. Examining the Sustainability of Tropical Island Forests: Advances and Challenges in Measurement, Monitoring, and Reporting in the US Caribbean and Pacific. Forests 2019, 10, 946. [Google Scholar] [CrossRef]
  6. Herghiligiu, I.V.; Robu, I.-B.; Pislaru, M.; Vilcu, A.; Asandului, A.L.; Avasilcăi, S.; Balan, C. Sustainable Environmental Management System Integration and Business Performance: A Balance Assessment Approach Using Fuzzy Logic. Sustainability 2019, 11, 5311. [Google Scholar] [CrossRef]
  7. Fadel, C.; Tarabieh, K. Development of an Industrial Environmental Index to Assess the Sustainability of Industrial Solvent-Based Processes. Resources 2019, 8, 115. [Google Scholar] [CrossRef]
  8. Brambilla, A.; Capolongo, S. Healthy and Sustainable Hospital Evaluation—A Review of POE Tools for Hospital Assessment in an Evidence-Based Design Framework. Buildings 2019, 9, 76. [Google Scholar] [CrossRef]
  9. Doğu, F.U.; Aras, L. Measuring Social Sustainability with the Developed MCSA Model: Güzelyurt Case. Sustainability 2019, 11, 2503. [Google Scholar] [CrossRef]
  10. Lin, A.J.; Chang, H.-Y. Business Sustainability Performance Evaluation for Taiwanese Banks—A Hybrid Multiple-Criteria Decision-Making Approach. Sustainability 2019, 11, 2236. [Google Scholar] [CrossRef]
  11. Farooq, O.; Farooq, M.; Reynaud, E. Does Employees’ Participation in Decision Making Increase the level of Corporate Social and Environmental Sustainability? An Investigation in South Asia. Sustainability 2019, 11, 511. [Google Scholar] [CrossRef]
  12. Singh, A.; Kar, S.; Pamucar, D. Stakeholder Role for Developing a Conceptual Framework of Sustainability in Organization. Sustainability 2019, 11, 208. [Google Scholar] [CrossRef]
  13. Fagerlind, T.; Stefanicki, M.; Feldmann, A.; Korhonen, J. The Distribution of Sustainable Decision-Making in Multinational Manufacturing Enterprises. Sustainability 2019, 11, 4871. [Google Scholar] [CrossRef]
  14. Zhang, Y.; Khan, U.; Lee, S.; Salik, M. The Influence of Management Innovation and Technological Innovation on Organization Performance. A Mediating Role of Sustainability. Sustainability 2019, 11, 495. [Google Scholar] [CrossRef]
  15. Northey, S.; Haque, N.; Mudd, G. Using sustainability reporting to assess the environmental footprint of copper mining. J. Clean. Prod. 2013, 40, 118–128. [Google Scholar] [CrossRef]
  16. Esty, D.C.; Emerson, J.W. Yale’s Environmental Performance Index and the rise of data-driven policymaking. In Routledge Handbook of Sustainability Indicators; Routledge: Abingdon, UK, 2018. [Google Scholar]
  17. Waheed, B.; Khan, F.; Veitch, B. Linkage-based frameworks for sustainability assessment: making a case for driving force-pressure-state-exposure-effect-action (DPSEEA) frameworks. Sustainability 2009, 1, 441–463. [Google Scholar] [CrossRef]
  18. Büyüközkan, G.; Karabulut, Y. Sustainability performance evaluation: Literature review and future directions. J. Environ. Manag. 2018, 217, 253–267. [Google Scholar] [CrossRef]
  19. Hellström, T. Dimensions of environmentally sustainable innovation: The structure of eco-innovation concepts. Sustain. Dev. 2007, 15, 148–159. [Google Scholar] [CrossRef]
  20. Cavallaro, F.; Zavadskas, E.K.; Streimikiene, D.; Mardani, A. Assessment of concentrated solar power (CSP) technologies based on a modified intuitionistic fuzzy topsis and trigonometric entropy weights. Technol. Forecast. Soc. Chang. 2019, 140, 258–270. [Google Scholar] [CrossRef]
  21. Cavallaro, F.; Zavadskas, E.K.; Streimikiene, D. Concentrated solar power (CSP) hybridized systems. Ranking based on an intuitionistic fuzzy multi-criteria algorithm. J. Clean. Prod. 2018, 179, 407–416. [Google Scholar] [CrossRef]
  22. Cavallaro, F. A Takagi-Sugeno fuzzy inference system for developing a sustainability index of biomass. Sustainability 2015, 7, 12359–12371. [Google Scholar] [CrossRef]
  23. Nilashi, M.; Cavallaro, F.; Mardani, A.; Zavadskas, E.; Samad, S.; Ibrahim, O. Measuring Country Sustainability Performance Using Ensembles of Neuro-Fuzzy Technique. Sustainability 2018, 10, 2707. [Google Scholar] [CrossRef]
  24. Singh, R.K.; Murty, H.; Gupta, S.; Dikshit, A. Development of composite sustainability performance index for steel industry. Ecol. Indic. 2007, 7, 565–588. [Google Scholar] [CrossRef]
  25. Tsolas, I. Derivation of mineral processing environmental sustainability indicators using a DEA weight-restricted algorithm. Min. Metall. Explor. 2008, 25, 199–205. [Google Scholar] [CrossRef]
  26. Azapagic, A. Developing a framework for sustainable development indicators for the mining and minerals industry. J. Clean. Prod. 2004, 12, 639–662. [Google Scholar] [CrossRef]
  27. Alizadeh, R.; Soltanisehat, L. Stay competitive in 2035: A scenario-based method to foresight in the design and manufacturing industry. Foresight 2020. in Press. [Google Scholar] [CrossRef]
  28. Soltanisehat, L.; Alizadeh, R.; Mehregan, N. Research and Development Investment and Productivity Growth in Firms with Different Levels of Technology. Iran. Econ. Rev. 2019, 23, 795–818. [Google Scholar]
  29. Zamani Sabzi, H.; Abudu, S.; Alizadeh, R.; Soltanisehat, L.; Dilekli, N.; King, J.P. Integration of time series forecasting in a dynamic decision support system for multiple reservoir management to conserve water sources. Energy Sour. Part A Recover. Util. Environ. Effects 2018, 40, 1398–1416. [Google Scholar] [CrossRef]
  30. Krajnc, D.; Glavič, P. A model for integrated assessment of sustainable development. Resour. Conserv. Recycl. 2005, 43, 189–208. [Google Scholar] [CrossRef]
  31. Alizadeh, R.; Maknoon, R.; Majidpour, M.; Salimi, J. Energy Policy in Iran and International Commitments for GHG Emission Reduction. J. Environ. Sci. Technol. 2015, 17, 183–198. [Google Scholar]
  32. Alizadeh, R.; Soltanisehat, L.; Lund, P.D.; Zamanisabzi, H. Improving renewable energy policy planning and decision-making through a hybrid MCDM method. Energy Policy 2019. in Press, No. 111174. [Google Scholar] [CrossRef]
  33. Tahir, A.C.; Darton, R. The process analysis method of selecting indicators to quantify the sustainability performance of a business operation. J. Clean. Prod. 2010, 18, 1598–1607. [Google Scholar] [CrossRef]
  34. Hsu, C.-H.; Chang, A.-Y.; Luo, W. Identifying key performance factors for sustainability development of SMEs–integrating QFD and fuzzy MADM methods. J. Clean. Prod. 2017, 161, 629–645. [Google Scholar] [CrossRef]
  35. Crutzen, N.; Zvezdov, D.; Schaltegger, S. Sustainability and management control. Exploring and theorizing control patterns in large European firms. J. Clean. Prod. 2017, 143, 1291–1301. [Google Scholar] [CrossRef]
  36. Closs, D.J.; Speier, C.; Meacham, N. Sustainability to support end-to-end value chains: The role of supply chain management. J. Acad. Mark. Sci. 2011, 39, 101–116. [Google Scholar] [CrossRef]
  37. Beynaghi, A.; Moztarzadeh, F.; Shahmardan, A.; Alizadeh, R.; Salimi, J.; Mozafari, M. Makespan minimization for batching work and rework process on a single facility with an aging effect: A hybrid meta-heuristic algorithm for sustainable production management. J. Intell. Manuf. 2019, 30, 33–45. [Google Scholar] [CrossRef]
  38. Alizadeh, R.; Lund, P.D.; Beynaghi, A.; Abolghasemi, M.; Maknoon, R. An integrated scenario-based robust planning approach for foresight and strategic management with application to energy industry. Technol. Forecast. Soc. Chang. 2016, 104, 162–171. [Google Scholar] [CrossRef]
  39. Alizadeh, R.; Khodaei, R.; Maknoon, R. A Combined Model of Scenario Planning and Assumption-Based Planning for Futurology, and Robust Decision Making in the Energy Sector. Q. J. Energy Policy Plan. Res. 2016, 2, 7–32. [Google Scholar]
  40. Alizadeh, R.; Majidpour, M.; Maknoon, R.; Kaleibari, S.S. Clean development mechanism in Iran: Does it need a revival? Int. J. Glob. Warm. 2016, 10, 196–215. [Google Scholar] [CrossRef]
  41. Alizadeh, R.; Majidpour, M.; Maknoon, R.; Salimi, J. Iranian energy and climate policies adaptation to the Kyoto protocol. Int. J. Environ. Res. 2015, 9, 853–864. [Google Scholar]
  42. Abolghasemi, M.; Alizadeh, R. A Bayesian Framework for Strategic Management In The Energy Industry. Int. J. Sci. Eng. Technol. 2014, 3, 1360–1366. [Google Scholar]
  43. Nigri, G.; Del Baldo, M. Sustainability Reporting and Performance Measurement Systems: How do Small-and Medium-Sized Benefit Corporations Manage Integration? Sustainability 2018, 10, 4499. [Google Scholar] [CrossRef]
  44. Jassem, S.; Azmi, A.; Zakaria, Z. Impact of Sustainability Balanced Scorecard Types on Environmental Investment Decision-Making. Sustainability 2018, 10, 541. [Google Scholar] [CrossRef]
  45. Hristov, I.; Chirico, A.; Appolloni, A. Sustainability Value Creation, Survival, and Growth of the Company: A Critical Perspective in the Sustainability Balanced Scorecard (SBSC). Sustainability 2019, 11, 2119. [Google Scholar] [CrossRef]
  46. Chung, C.-C.; Chao, L.-C.; Chen, C.-H.; Lou, S.-J. A balanced scorecard of sustainable management in the Taiwanese bicycle industry: Development of performance indicators and importance analysis. Sustainability 2016, 8, 518. [Google Scholar] [CrossRef]
  47. Barrena Martínez, J.; López Fernández, M.; Romero Fernández, P.M. Corporate social responsibility: Evolution through institutional and stakeholder perspectives. Eur. J. Manag. Bus. Econ. 2016, 25, 8–14. [Google Scholar] [CrossRef]
  48. Putzhuber, F.; Hasenauer, H. Deriving sustainability measures using statistical data: A case study from the Eisenwurzen, Austria. Ecol. Indic. 2010, 10, 32–38. [Google Scholar] [CrossRef]
  49. Hung, S.-W.; He, D.-S.; Lu, W.-M. Evaluating the dynamic performances of business groups from the carry-over perspective: A case study of Taiwan׳s semiconductor industry. Omega 2014, 46, 1–10. [Google Scholar] [CrossRef]
  50. Hatami-Marbini, A.; Kangi, F. An extension of fuzzy TOPSIS for a group decision making with an application to Tehran stock exchange. Appl. Soft Comput. 2017, 52, 1084–1097. [Google Scholar] [CrossRef]
  51. Hsu, L.-C. Using a decision-making process to evaluate efficiency and operating performance for listed semiconductor companies. Technol. Econ. Dev. Econ. 2015, 21, 301–331. [Google Scholar] [CrossRef]
  52. Tsai, C.-H.; Wu, H.-Y.; Chen, I.-S.; Chen, J.-K.; Ye, R.-W. Exploring benchmark corporations in the semiconductor industry based on efficiency. J. High Technol. Manag. Res. 2017, 28, 188–207. [Google Scholar] [CrossRef]
  53. Zhou, H.; Hu, H. Sustainability evaluation of railways in China using a two-stage network DEA model with undesirable outputs and shared resources. Sustainability 2017, 9, 150. [Google Scholar] [CrossRef]
  54. Halkos, G.E.; Tzeremes, N.G.; Kourtzidis, S.A. Measuring sustainability efficiency using a two-stage data envelopment analysis approach. J. Ind. Ecol. 2016, 20, 1159–1175. [Google Scholar] [CrossRef]
  55. Tajbakhsh, A.; Hassini, E. Evaluating sustainability performance in fossil-fuel power plants using a two-stage data envelopment analysis. Energy Econ. 2018, 74, 154–178. [Google Scholar] [CrossRef]
  56. Wu, J.; Yin, P.; Sun, J.; Chu, J.; Liang, L. Evaluating the environmental efficiency of a two-stage system with undesired outputs by a DEA approach: An interest preference perspective. Eur. J. Oper. Res. 2016, 254, 1047–1062. [Google Scholar] [CrossRef]
  57. Hatami-Marbini, A.; Agrell, P.J.; Tavana, M.; Khoshnevis, P. A flexible cross-efficiency fuzzy data envelopment analysis model for sustainable sourcing. J. Clean. Prod. 2017, 142, 2761–2779. [Google Scholar] [CrossRef]
  58. Hatami-Marbini, A.; Tavana, M.; Gholami, K.; Beigi, Z.G. A bounded data envelopment analysis model in a fuzzy environment with an application to safety in the semiconductor industry. J. Optim. Theory Appl. 2015, 164, 679–701. [Google Scholar] [CrossRef]
  59. Chen, L.; Wang, Y.-M.; Lai, F. Semi-disposability of undesirable outputs in data envelopment analysis for environmental assessments. Eur. J. Oper. Res. 2017, 260, 655–664. [Google Scholar] [CrossRef]
  60. Li, H.; He, H.; Shan, J.; Cai, J. Innovation efficiency of semiconductor industry in China: A new framework based on generalized three-stage DEA analysis. Socio Econ. Plan. Sci. 2019, 66, 136–148. [Google Scholar] [CrossRef]
  61. Tourais, P.; Videira, N. Why, how and what do organizations achieve with the implementation of environmental management Systems?—Lessons from a comprehensive review on the eco-management and audit scheme. Sustainability 2016, 8, 283. [Google Scholar] [CrossRef]
  62. Liu, G. Development of a general sustainability indicator for renewable energy systems: A review. Renew. Sustain. Energy Rev. 2014, 31, 611–621. [Google Scholar] [CrossRef]
  63. Chen, L.; Lai, F.; Wang, Y.-M.; Huang, Y.; Wu, F.-M. A two-stage network data envelopment analysis approach for measuring and decomposing environmental efficiency. Comput. Ind. Eng. 2018, 119, 388–403. [Google Scholar] [CrossRef]
  64. De Clercq, D.; Wen, Z.; Caicedo, L.; Cao, X.; Fan, F.; Xu, R. Application of DEA and statistical inference to model the determinants of biomethane production efficiency: A case study in south China. Appl. Energy 2017, 205, 1231–1243. [Google Scholar] [CrossRef]
  65. Pham, M.D.; Zelenyuk, V. Weak disposability in nonparametric production analysis: A new taxonomy of reference technology sets. Eur. J. Oper. Res. 2019, 274, 186–198. [Google Scholar] [CrossRef]
  66. Essid, H.; Ganouati, J.; Vigeant, S. A mean-maverick game cross-efficiency approach to portfolio selection: An application to Paris stock exchange. Expert Syst. Appl. 2018, 113, 161–185. [Google Scholar] [CrossRef]
  67. Chen, L.; Wu, F.M.; Wang, Y.M.; Li, M.J. Analysis of the environmental efficiency in China based on the DEA cross-efficiency approach under different policy objectives. Expert Syst. 2019. [Google Scholar] [CrossRef]
  68. Amirteimoori, H.; Amirteimoori, A.; Amirteimoori, A. Sustainability assessment in the presence of undesirable factors over time: A case on gas companies. Expert Syst. 2018, e12316. [Google Scholar] [CrossRef]
  69. Sueyoshi, T.; Goto, M. The intermediate approach to sustainability enhancement and scale-related measures in environmental assessment. Eur. J. Oper. Res. 2019, 276, 744–756. [Google Scholar] [CrossRef]
  70. Wu, M.-Q.; Zhang, C.-H.; Liu, X.-N.; Fan, J.-P. Green supplier selection based on DEA model in interval-valued Pythagorean fuzzy environment. IEEE Access 2019, 7, 108001–108013. [Google Scholar] [CrossRef]
  71. Sueyoshi, T.; Li, A.; Liu, X. Exploring Sources of China’s CO2 Emission: Decomposition Analysis under Different Technology Changes. Eur. J. Oper. Res. 2019, 279, 984–995. [Google Scholar] [CrossRef]
  72. Sueyoshi, T.; Wang, D.D. Rank dynamics and club convergence of sustainable development for countries around the world. J. Clean. Prod. 2019, 119480. [Google Scholar] [CrossRef]
  73. Azadi, M.; Jafarian, M.; Saen, R.F.; Mirhedayatian, S.M. A new fuzzy DEA model for evaluation of efficiency and effectiveness of suppliers in sustainable supply chain management context. Comput. Oper. Res. 2015, 54, 274–285. [Google Scholar] [CrossRef]
  74. Jauhar, S.K.; Pant, M. Integrating DEA with DE and MODE for sustainable supplier selection. J. Comput. Sci. 2017, 21, 299–306. [Google Scholar] [CrossRef]
  75. Dobos, I.; Vörösmarty, G. Green supplier selection and evaluation using DEA-type composite indicators. Int. J. Prod. Econ. 2014, 157, 273–278. [Google Scholar] [CrossRef]
  76. Zhou, X.; Pedrycz, W.; Kuang, Y.; Zhang, Z. Type-2 fuzzy multi-objective DEA model: An application to sustainable supplier evaluation. Appl. Soft Comput. 2016, 46, 424–440. [Google Scholar] [CrossRef]
  77. Shabanpour, H.; Yousefi, S.; Saen, R.F. Future planning for benchmarking and ranking sustainable suppliers using goal programming and robust double frontiers DEA. Transp. Res. Part D Transp. Environ. 2017, 50, 129–143. [Google Scholar] [CrossRef]
  78. Yousefi, S.; Soltani, R.; Saen, R.F.; Pishvaee, M.S. A robust fuzzy possibilistic programming for a new network GP-DEA model to evaluate sustainable supply chains. J. Clean. Prod. 2017, 166, 537–549. [Google Scholar] [CrossRef]
  79. Badiezadeh, T.; Saen, R.F.; Samavati, T. Assessing sustainability of supply chains by double frontier network DEA: A big data approach. Comput. Oper. Res. 2018, 98, 284–290. [Google Scholar] [CrossRef]
  80. Luthra, S.; Govindan, K.; Kannan, D.; Mangla, S.K.; Garg, C.P. An integrated framework for sustainable supplier selection and evaluation in supply chains. J. Clean. Prod. 2017, 140, 1686–1698. [Google Scholar] [CrossRef]
  81. Rashidi, K.; Cullinane, K. A comparison of fuzzy DEA and fuzzy TOPSIS in sustainable supplier selection: Implications for sourcing strategy. Expert Syst. Appl. 2019, 121, 266–281. [Google Scholar] [CrossRef]
  82. Mavi, R.K.; Saen, R.F.; Goh, M. Joint analysis of eco-efficiency and eco-innovation with common weights in two-stage network DEA: A big data approach. Technol. Forecast. Soc. Chang. 2019, 144, 553–562. [Google Scholar] [CrossRef]
  83. Liu, X.; Guo, P.; Guo, S. Assessing the eco-efficiency of a circular economy system in China’s coal mining areas: Emergy and data envelopment analysis. J. Clean. Prod. 2019, 206, 1101–1109. [Google Scholar] [CrossRef]
  84. Wang, X.; Ding, H.; Liu, L. Eco-efficiency measurement of industrial sectors in China: A hybrid super-efficiency DEA analysis. J. Clean. Prod. 2019, 229, 53–64. [Google Scholar] [CrossRef]
  85. Ezici, B.; Eğilmez, G.; Gedik, R. Assessing the eco-efficiency of U.S. manufacturing industries with a focus on renewable vs. non-renewable energy use: An integrated time series MRIO and DEA approach. J. Clean. Prod. 2020, 253, 119630. [Google Scholar] [CrossRef]
  86. Shao, L.; Yu, X.; Feng, C. Evaluating the eco-efficiency of China’s industrial sectors: A two-stage network data envelopment analysis. J. Environ. Manag. 2019, 247, 551–560. [Google Scholar] [CrossRef]
  87. Hu, W.; Guo, Y.; Tian, J.; Chen, L. Eco-efficiency of centralized wastewater treatment plants in industrial parks: A slack-based data envelopment analysis. Resour. Conserv. Recycl. 2019, 141, 176–186. [Google Scholar] [CrossRef]
  88. Torres-Ruiz, A.; Ravindran, A.R. Use of interval data envelopment analysis, goal programming and dynamic eco-efficiency assessment for sustainable supplier management. Comput. Ind. Eng. 2019, 131, 211–226. [Google Scholar] [CrossRef]
  89. Zhu, W.; Xu, L.; Tang, L.; Xiang, X. Eco-efficiency of the Western Taiwan Straits Economic Zone: An evaluation based on a novel eco-efficiency model and empirical analysis of influencing factors. J. Clean. Prod. 2019, 234, 638–652. [Google Scholar] [CrossRef]
  90. Yu, Y.; Huang, J.; Zhang, N. Modeling the eco-efficiency of Chinese prefecture-level cities with regional heterogeneities: A comparative perspective. Ecol. Model. 2019, 402, 1–17. [Google Scholar] [CrossRef]
  91. Bang, Y.-Y.; Lee, D.S.; Lim, S.-R. Analysis of corporate CO2 and energy cost efficiency: The role of performance indicators and effective environmental reporting. Energy Policy 2019, 133, 110897. [Google Scholar] [CrossRef]
  92. Wu, J.; Li, M.; Zhu, Q.; Zhou, Z.; Liang, L. Energy and environmental efficiency measurement of China’s industrial sectors: A DEA model with non-homogeneous inputs and outputs. Energy Econ. 2019, 78, 468–480. [Google Scholar] [CrossRef]
  93. Bai, X.; Salim, R.; Bloch, H. Environmental Efficiency of Apple Production in China: A Translog Stochastic Frontier Analysis. Agric. Resour. Econ. Rev. 2019, 48, 199–220. [Google Scholar] [CrossRef]
  94. Halkos, G.; Petrou, K.N. Assessing 28 EU member states’ environmental efficiency in national waste generation with DEA. J. Clean. Prod. 2019, 208, 509–521. [Google Scholar] [CrossRef]
  95. Zhou, Z.; Wu, H.; Song, P. Measuring the resource and environmental efficiency of industrial water consumption in China: A non-radial directional distance function. J. Clean. Prod. 2019, 240, 118169. [Google Scholar] [CrossRef]
  96. Zhang, J.; Wu, Q.; Zhou, Z. A two-stage DEA model for resource allocation in industrial pollution treatment and its application in China. J. Clean. Prod. 2019, 228, 29–39. [Google Scholar] [CrossRef]
  97. Liu, X.; Ji, X.; Zhang, D.; Yang, J.; Wang, Y. How public environmental concern affects the sustainable development of Chinese cities: An empirical study using extended DEA models. J. Environ. Manag. 2019, 251, 109619. [Google Scholar] [CrossRef] [PubMed]
  98. Liu, X.; Chu, J.; Yin, P.; Sun, J. DEA cross-efficiency evaluation considering undesirable output and ranking priority: A case study of eco-efficiency analysis of coal-fired power plants. J. Clean. Prod. 2017, 142, 877–885. [Google Scholar] [CrossRef]
  99. Long, X.; Wu, C.; Zhang, J.; Zhang, J. Environmental efficiency for 192 thermal power plants in the Yangtze River Delta considering heterogeneity: A metafrontier directional slacks-based measure approach. Renew. Sustain. Energy Rev. 2018, 82, 3962–3971. [Google Scholar] [CrossRef]
  100. Jiang, Z.; Ding, Z.; Zhang, H.; Cai, W.; Liu, Y. Data-driven ecological performance evaluation for remanufacturing process. Energy Convers. Manag. 2019, 198, 111844. [Google Scholar] [CrossRef]
  101. Gémar, G.; Gómez, T.; Molinos-Senante, M.; Caballero, R.; Sala-Garrido, R. Assessing changes in eco-productivity of wastewater treatment plants: The role of costs, pollutant removal efficiency, and greenhouse gas emissions. Environ. Impact Assess. Rev. 2018, 69, 24–31. [Google Scholar] [CrossRef]
  102. Wu, Y.; Ke, Y.; Zhang, T.; Liu, F.; Wang, J. Performance efficiency assessment of photovoltaic poverty alleviation projects in China: A three-phase data envelopment analysis model. Energy 2018, 159, 599–610. [Google Scholar] [CrossRef]
  103. Li, A.; Zhang, A.; Huang, H.; Yao, X. Measuring unified efficiency of fossil fuel power plants across provinces in China: An analysis based on non-radial directional distance functions. Energy 2018, 152, 549–561. [Google Scholar] [CrossRef]
  104. Liu, H.; Wu, J.; Chu, J. Environmental efficiency and technological progress of transportation industry-based on large scale data. Technol. Forecast. Soc. Chang. 2019, 144, 475–482. [Google Scholar] [CrossRef]
  105. Sun, C.; Liu, X.; Li, A. Measuring unified efficiency of Chinese fossil fuel power plants: Intermediate approach combined with group heterogeneity and window analysis. Energy Policy 2018, 123, 8–18. [Google Scholar] [CrossRef]
  106. Chu, J.; Wu, J.; Chu, C. A multi-objective model for Pareto optimality in data envelopment analysis cross-efficiency evaluation. Eur. J. Oper. Res. 2019, 274, 471–499. [Google Scholar] [CrossRef]
  107. Saaty, T.L. How to make a decision: The analytic hierarchy process. Eur. J. Oper. Res. 1990, 48, 9–26. [Google Scholar] [CrossRef]
  108. Venkatesh, A.; Kushwaha, S. Measuring technical efficiency of passenger bus companies in India: A non-radial data envelopment analysis approach. OPSEARCH 2017, 54, 706–723. [Google Scholar] [CrossRef]
  109. Bhatia, V.; Basu, S.; Mitra, S.K.; Dash, P. A review of bank efficiency and productivity. OPSEARCH 2018, 55, 557–600. [Google Scholar] [CrossRef]
  110. Bose, A.; Patel, G.N. “NeuralDEA”—A framework using Neural Network to re-evaluate DEA benchmarks. OPSEARCH 2015, 52, 18–41. [Google Scholar] [CrossRef]
  111. Charnes, A.; Cooper, W.W.; Rhodes, E. Measuring the efficiency of decision making units. Eur. J. Oper. Res. 1978, 2, 429–444. [Google Scholar] [CrossRef]
  112. Agarwal, S. DEA-neural networks approach to assess the performance of public transport sector of India. OPSEARCH 2016, 53, 248–258. [Google Scholar] [CrossRef]
  113. Liu, J.S.; Lu, L.Y.; Lu, W.-M. Research fronts in data envelopment analysis. Omega 2016, 58, 33–45. [Google Scholar] [CrossRef]
  114. Wei, G.; Wang, J. A comparative study of robust efficiency analysis and data envelopment analysis with imprecise data. Expert Syst. Appl. 2017, 81, 28–38. [Google Scholar] [CrossRef]
  115. Mardani, A.; Zavadskas, E.K.; Streimikiene, D.; Jusoh, A.; Khoshnoudi, M. A comprehensive review of data envelopment analysis (DEA) approach in energy efficiency. Renew. Sustain. Energy Rev. 2017, 70, 1298–1322. [Google Scholar] [CrossRef]
  116. Chen, L.; Jia, G. Environmental efficiency analysis of China’s regional industry: A data envelopment analysis (DEA) based approach. J. Clean. Prod. 2017, 142, 846–853. [Google Scholar] [CrossRef]
  117. Olesen, O.B.; Petersen, N.C. Stochastic data envelopment analysis—A review. Eur. J. Oper. Res. 2016, 251, 2–21. [Google Scholar] [CrossRef]
  118. Banker, R.; Natarajan, R.; Zhang, D. Two-stage estimation of the impact of contextual variables in stochastic frontier production function models using data envelopment analysis: Second stage OLS versus bootstrap approaches. Eur. J. Oper. Res. 2019, 278, 368–384. [Google Scholar] [CrossRef]
  119. Zhou, H.; Yang, Y.; Chen, Y.; Zhu, J. Data envelopment analysis application in sustainability: The origins, development and future directions. Eur. J. Oper. Res. 2018, 264, 1–16. [Google Scholar] [CrossRef]
  120. Babazadeh, R.; Razmi, J.; Rabbani, M.; Pishvaee, M.S. An integrated data envelopment analysis–mathematical programming approach to strategic biodiesel supply chain network design problem. J. Clean. Prod. 2017, 147, 694–707. [Google Scholar] [CrossRef]
  121. Sagarra, M.; Mar-Molinero, C.; Agasisti, T. Exploring the efficiency of Mexican universities: Integrating data envelopment analysis and multidimensional scaling. Omega 2017, 67, 123–133. [Google Scholar] [CrossRef]
  122. Jradi, S.; Ruggiero, J. Stochastic data envelopment analysis: A quantile regression approach to estimate the production frontier. Eur. J. Oper. Res. 2019, 278, 385–393. [Google Scholar] [CrossRef]
  123. Xia, M.; Chen, J.X. Data envelopment analysis based on choquet integral. Int. J. Intell. Syst. 2017, 32, 1312–1331. [Google Scholar] [CrossRef]
  124. Castellet, L.; Molinos-Senante, M. Efficiency assessment of wastewater treatment plants: A data envelopment analysis approach integrating technical, economic, and environmental issues. J. Environ. Manag. 2016, 167, 160–166. [Google Scholar] [CrossRef] [PubMed]
  125. Yang, W.-C.; Lee, Y.-M.; Hu, J.-L. Urban sustainability assessment of Taiwan based on data envelopment analysis. Renew. Sustain. Energy Rev. 2016, 61, 341–353. [Google Scholar] [CrossRef]
  126. Sadi-Nezhad, S.; Sotoudeh-Anvari, A. A new Data Envelopment Analysis under uncertain environment with respect to fuzziness and an estimation of reliability. OPSEARCH 2016, 53, 103–115. [Google Scholar] [CrossRef]
  127. Charles, V.; Aparicio, J.; Zhu, J. The curse of dimensionality of decision-making units: A simple approach to increase the discriminatory power of data envelopment analysis. Eur. J. Oper. Res. 2019, 279, 929–940. [Google Scholar] [CrossRef]
  128. Moslemi, S.; Izadbakhsh, H.; Zarinbal, M. A new reliable performance evaluation model: IFB-IER–DEA. OPSEARCH 2019, 56, 14–31. [Google Scholar] [CrossRef]
  129. Akbarian, D. Avoiding dissimilarity between the weights of the optimal DEA solutions. OPSEARCH 2019. [Google Scholar] [CrossRef]
  130. Lashani, E.; Aryavash, K. The optimistic—Pessimistic revenue distribution in the presence of imprecise data. OPSEARCH 2018, 55, 288–301. [Google Scholar] [CrossRef]
  131. Bian, Y. A Gram–Schmidt process based approach for improving DEA discrimination in the presence of large dimensionality of data set. Expert Syst. Appl. 2012, 39, 3793–3799. [Google Scholar] [CrossRef]
  132. Kaleibari, S.S.; Beiragh, R.G.; Alizadeh, R.; Solimanpur, M. A framework for performance evaluation of energy supply chain by a compatible network data envelopment analysis model. Sci. Iran. Trans. E Ind. Eng. 2016, 23, 1904. [Google Scholar] [CrossRef]
  133. Flegl, M.; Andrade, L.A. Measuring countries’ performance at the Summer Olympic Games in Rio 2016. OPSEARCH 2018, 55, 823–846. [Google Scholar] [CrossRef]
  134. Jenkins, L.; Anderson, M. A multivariate statistical approach to reducing the number of variables in data envelopment analysis. Eur. J. Oper. Res. 2003, 147, 51–61. [Google Scholar] [CrossRef]
  135. Adler, N.; Golany, B. Including principal component weights to improve discrimination in data envelopment analysis. J. Oper. Res. Soc. 2002, 53, 985–991. [Google Scholar] [CrossRef]
  136. Adler, N.; Berechman, J. Measuring airport quality from the airlines’ viewpoint: An application of data envelopment analysis. Transp. Policy 2001, 8, 171–181. [Google Scholar] [CrossRef]
  137. Karsak, E.E.; Karadayi, M.A. Imprecise DEA framework for evaluating health-care performance of districts. Kybernetes 2017, 46, 706–727. [Google Scholar] [CrossRef]
  138. Zhu, J. Data envelopment analysis vs. principal component analysis: An illustrative study of economic performance of Chinese cities. Eur. J. Oper. Res. 1998, 111, 50–61. [Google Scholar] [CrossRef]
  139. Premachandra, I. A note on DEA vs principal component analysis: An improvement to Joe Zhu’s approach. Eur. J. Oper. Res. 2001, 132, 553–560. [Google Scholar] [CrossRef]
  140. Liang, L.; Li, Y.; Li, S. Increasing the discriminatory power of DEA in the presence of the undesirable outputs and large dimensionality of data sets with PCA. Expert Syst. Appl. 2009, 36, 5895–5899. [Google Scholar] [CrossRef]
  141. Ueda, T.; Hoshiai, Y. Application of principal component analysis for parsimonious summarization of DEA inputs and/or outputs. J. Oper. Res. Soc. Jpn. 1997, 40, 466–478. [Google Scholar] [CrossRef]
  142. Shujie, Y.; Zhongwei, H.; Genfu, F. On technical efficiency of China’s insurance industry after WTO accession. China Econ. Rev. 2007, 18, 66–86. [Google Scholar]
  143. Huang, W.; Paradi, J.C. Risk-adjusted efficiency of the insurance industry: evidence from China. Serv. Ind. J. 2011, 31, 1871–1885. [Google Scholar] [CrossRef]
  144. Barros, C.P.; Nektarios, M.; Assaf, A. Efficiency in the Greek insurance industry. Eur. J. Oper. Res. 2010, 205, 431–436. [Google Scholar] [CrossRef]
  145. Simar, L.; Wilson, P.W. Estimation and inference in two-stage, semi-parametric models of production processes. J. Econom. 2007, 136, 31–64. [Google Scholar] [CrossRef]
  146. Tone, K.; Sahoo, B.K. Evaluating cost efficiency and returns to scale in the Life Insurance Corporation of India using data envelopment analysis. Socio Econ. Plan. Sci. 2005, 39, 261–285. [Google Scholar] [CrossRef]
  147. Kao, C.; Hwang, S.-N. Efficiency decomposition in two-stage data envelopment analysis: An application to non-life insurance companies in Taiwan. Eur. J. Oper. Res. 2008, 185, 418–429. [Google Scholar] [CrossRef]
  148. Grmanová, E.; Strunz, H. Efficiency of insurance companies: Application of DEA and Tobit analyses. J. Int. Stud. 2017, 10, 250–263. [Google Scholar] [CrossRef]
  149. Malyovanyi, M.; Nepochatenko, O.; Nesterchuk, Y. Conceptual Approaches to Improving the Functioning of Non-state Social Insurance Institutions in Ukraine. Econ. Sociol. 2018, 11, 289–304. [Google Scholar] [CrossRef]
  150. Horsch, A.; Sysoyeva, L.; Bogma, S. Deposit insurance systems of post-Soviet countries: A comparative analysis. J. Int. Stud. 2018, 11, 22–44. [Google Scholar] [CrossRef]
  151. Simionescu, M. The evolution of the Romanian insurance market after 2000. Econ. Manag. Sustain. 2019, 4, 11. [Google Scholar] [CrossRef]
  152. Jurickova, E.; Pilik, M.; Kwarteng, M.A. Efficiency measurement of National Innovation Systems of the European Union countries: DEA Model Application. J. Int. Stud. 2019, 12, 286–299. [Google Scholar] [CrossRef]
  153. Trynchuk, V.; Khovrak, I.; Dankiewicz, R.; Ostrowska-Dankiewicz, A.; Chushak-Holoborodko, A. The role of universities in disseminating the social responsibility practices of insurance companies. Probl. Perspect. Manag. 2019, 17, 449–461. [Google Scholar] [CrossRef]
  154. Nesterchuk, Y.; Prokopchuk, O.; Tsymbalyuk, Y.; Rolinskyi, O.; Bilan, Y. Current status and prospects of development of the system of agrarian insurance in Ukraine. Invest. Manag. Financ. Innov. 2018, 15, 56. [Google Scholar] [CrossRef]
  155. Fukuyama, H. Investigating productive efficiency and productivity changes of Japanese life insurance companies. Pacif. Basin Finance J. 1997, 5, 481–509. [Google Scholar] [CrossRef]
  156. Eling, M.; Luhnen, M. Efficiency in the international insurance industry: A cross-country comparison. J. Bank. Finance 2010, 34, 1497–1509. [Google Scholar] [CrossRef]
  157. Hui, Z.; Honggeng, Y. Application of Weighted principal component analysis in comprehensive evaluation for power quality. In Proceedings of the 2011 IEEE Power Engineering and Automation Conference, Wuhan, China, 8–9 September 2011. [Google Scholar]
  158. Çalik, A.; Pehlivan, N.Y.; Kahraman, C. An integrated fuzzy AHP/DEA approach for performance evaluation of territorial units in Turkey. Technol. Econ. Dev. Econ. 2018, 24, 1280–1302. [Google Scholar] [CrossRef]
  159. Wang, Y.-M.; Liu, J.; Elhag, T.M. An integrated AHP–DEA methodology for bridge risk assessment. Comput. Ind. Eng. 2008, 54, 513–525. [Google Scholar] [CrossRef]
  160. Ho, W.; Ma, X. The state-of-the-art integrations and applications of the analytic hierarchy process. Eur. J. Oper. Res. 2018, 267, 399–414. [Google Scholar] [CrossRef]
  161. Dos Santos, P.H.; Neves, S.M.; Sant’Anna, D.O.; de Oliveira, C.H.; Carvalho, H.D. The analytic hierarchy process supporting decision making for sustainable development: An overview of applications. J. Clean. Prod. 2019, 212, 119–138. [Google Scholar] [CrossRef]
  162. Krejčí, J.; Stoklasa, J. Aggregation in the analytic hierarchy process: Why weighted geometric mean should be used instead of weighted arithmetic mean. Expert Syst. Appl. 2018, 114, 97–106. [Google Scholar] [CrossRef]
  163. Omar, F.; Bushby, S.T.; Williams, R.D. Assessing the performance of residential energy management control Algorithms: Multi-criteria decision making using the analytical hierarchy process. Energy Build. 2019, 199, 537–546. [Google Scholar] [CrossRef]
  164. Pearson, K. LIII. On lines and planes of closest fit to systems of points in space. Lond. Edinb. Dublin Philos. Mag. J. Sci. 1901, 2, 559–572. [Google Scholar] [CrossRef]
  165. shen How, B.; Lam, H.L. Sustainability evaluation for biomass supply chain synthesis: Novel principal component analysis (PCA) aided optimisation approach. J. Clean. Prod. 2018, 189, 941–961. [Google Scholar]
  166. Zhao, Z.; Shkolnisky, Y.; Singer, A. Fast Steerable Principal Component Analysis. IEEE Trans. Comput. Imaging 2016, 2, 1–12. [Google Scholar] [CrossRef] [PubMed]
  167. Kamadi, V.V.; Allam, A.R.; Thummala, S.M. A computational intelligence technique for the effective diagnosis of diabetic patients using principal component analysis (PCA) and modified fuzzy SLIQ decision tree approach. Appl. Soft Comput. 2016, 49, 137–145. [Google Scholar] [CrossRef]
  168. Jiang, Q.; Liu, Z.; Liu, W.; Li, T.; Cong, W.; Zhang, H.; Shi, J. A principal component analysis based three-dimensional sustainability assessment model to evaluate corporate sustainable performance. J. Clean. Prod. 2018, 187, 625–637. [Google Scholar] [CrossRef]
  169. Gupta, P.; Mehlawat, M.K.; Aggarwal, U.; Charles, V. An integrated AHP-DEA multi-objective optimization model for sustainable transportation in mining industry. Resour. Policy 2018. [Google Scholar] [CrossRef]
  170. Azadeh, A.; Ghaderi, S.; Izadbakhsh, H. Integration of DEA and AHP with computer simulation for railway system improvement and optimization. Appl. Math. Comput. 2008, 195, 775–785. [Google Scholar] [CrossRef]
  171. Ho, W.; Xu, X.; Dey, P.K. Multi-criteria decision making approaches for supplier evaluation and selection: A literature review. Eur. J. Oper. Res. 2010, 202, 16–24. [Google Scholar] [CrossRef]
  172. Emrouznejad, A.; Marra, M. The state of the art development of AHP (1979–2017): A literature review with a social network analysis. Int. J. Prod. Res. 2017, 55, 6653–6675. [Google Scholar] [CrossRef]
  173. Shanmugam, R.; Johnson, C. At a crossroad of data envelopment and principal component analyses. Omega 2007, 35, 351–364. [Google Scholar] [CrossRef]
  174. Scheel, H. Undesirable outputs in efficiency valuations. Eur. J. Oper. Res. 2001, 132, 400–410. [Google Scholar] [CrossRef]
  175. Seiford, L.M.; Zhu, J. Modeling undesirable factors in efficiency evaluation. Eur. J. Oper. Res. 2002, 142, 16–20. [Google Scholar] [CrossRef]
  176. Pastor, J.T. Translation invariance in data envelopment analysis: A generalization. Ann. Oper. Res. 1996, 66, 91–102. [Google Scholar] [CrossRef]
  177. Lovell, C.K.; Pastor, J.T.; Turner, J.A. Measuring macroeconomic performance in the OECD: A comparison of European and non-European countries. Eur. J. Oper. Res. 1995, 87, 507–518. [Google Scholar] [CrossRef]
  178. Hashimoto, A. A ranked voting system using a DEA/AR exclusion model: A note. Eur. J. Oper. Res. 1997, 97, 600–604. [Google Scholar] [CrossRef]
  179. Foroughi, A.A.; Tamiz, M. An effective total ranking model for a ranked voting system. Omega 2005, 33, 491–496. [Google Scholar] [CrossRef]
  180. Andersen, P.; Petersen, N.C. A Procedure for Ranking Efficient Units in Data Envelopment Analysis. Manag. Sci. 1993, 39, 1261–1264. [Google Scholar] [CrossRef]
  181. Despotis, D.K.; Koronakos, G.; Sotiros, D. Composition versus decomposition in two-stage network DEA: A reverse approach. J. Prod. Anal. 2016, 45, 71–87. [Google Scholar] [CrossRef]
  182. Chen, Y.-p.; Lin, Y.-y. Controlling the movement of crowds in computer graphics by using the mechanism of particle swarm optimization. Appl. Soft Comput. 2009, 9, 1170–1176. [Google Scholar] [CrossRef]
  183. Ang, S.; Chen, C.-M. Pitfalls of decomposition weights in the additive multi-stage DEA model. Omega 2016, 58, 139–153. [Google Scholar] [CrossRef]
  184. Guo, C.; Abbasi Shureshjani, R.; Foroughi, A.A.; Zhu, J. Decomposition weights and overall efficiency in two-stage additive network DEA. Eur. J. Oper. Res. 2017, 257, 896–906. [Google Scholar] [CrossRef]
  185. Ishizaka, A.; Labib, A. Review of the main developments in the analytic hierarchy process. Expert Syst. Appl. 2011, 38, 14336–14345. [Google Scholar] [CrossRef]
  186. Sitorus, F.; Cilliers, J.J.; Brito-Parada, P.R. Multi-criteria decision making for the choice problem in mining and mineral processing: Applications and trends. Expert Syst. Appl. 2019, 121, 393–417. [Google Scholar] [CrossRef]
Figure 1. The framework of the method.
Sustainability 12 00789 g001
Table 1. Pairwise comparison scale for analytic hierarchy process (AHP) preferences.
Verbal Judgments of PreferencesExtremely PreferredVery Strongly to ExtremelyVery Strongly PreferredStrongly to Very StronglyStrongly PreferredModerately to StronglyModerately PreferredEqually to ModeratelyEqually Preferred
Numerical rating987654321
Table 2. Input and output variables.
VariableSustainability AspectDescription
I1: Number of agentsEconIndividuals or corporates that can provide insurance services
I2: Number of branchesEcon/socProviders of insurance services, inspection, control, support, and brokers
I3: Investment in green projectsEnvSum of total investment in environmentally friendly projects.
I4: Operating costsEconAll official, personnel, public expenses, and commission fees.
I5: Investment costsEcon/Env/SocPremiums received from insurers cannot be consumed for compensations immediately and remain in companies for a while.
I6: Total assetsEconThese assets include tangible fixed assets and intangible assets.
I7: corporate social responsibilitySocCorporate social responsibility encompasses investments as the company’s charitable contributions and role in the community.
O1: Premium of Insurance issuedEcon/Env/SocDirect premiums are received by insurance companies or branches, while indirect ones are presented by brokers of insurance companies.
O2: Net profitEconSubtractions of the number of incomes with operating costs and tax.
O3: Investment incomeEconThe total proceeds from short-term and long-term investments.
O4: Total debtEconTotal debt to representatives, brokers, and other companies
O5: Number of issued insurancesEconPenetration rate of insurance policies and all types of insurances.
O6: Total payable compensationsEconCompensations during the review period paid by insurance companies are called payable compensation.
Note: Econ: Economic, Env: Environmental, Soc: Social.
Table 3. The values for input and output variables.
I1I2I3I4I5I6I7O1O2O3O4O5O6
Iran553846142051,736,9821,472,42923,795,357593,4492,831,972320,2913324323,258,5171,562,6372,198,107
Dana9521581543,191,983763,08137,756,571157,6845,152,12169,73930,9225,025,75310850321,703,533
Asia19242699894,016,0512,018,25036,501,402684,5206,665,153127,191276,4307,127,5673,670,365391,057
Alborz15011302511,858,6031,638,02436,881,628883,0403,530,870262,414341,1194,429,5341,850,647206,050
Moalem79163839921,117575,62437,944,028516,386900,37945,48499,2971,995,053444,989315,901
Parsian149765939224,85681,679,71236,839,940199,7793,622,715506,228321,7375,473,4802,407,920254,405
Toseie160744032920,4301,476,39437,043,258554,7682,126,782199,932147,0082,249,5911,585,899111,615
Razi57745928653,290643,64537,876,007345,151844,02115,311667,551,285,2891,045,29475,427
Karafarin107253426990,9531,392,33737,127,315472,4361,813,07380,495176,1302,802,203628,40141,311
Sina14235080894,794324,84238,194,810494,3351,671,06144,78238,6402,278,848170,750354,580
Dey56131234342,660643,93037,875,722663,702601,80034,75371,696806,664151,08743,425
Saman67137816205,445516,42138,003,231408,974809,49396,11053,548982,730418,11628,637
Novin121633831601,038769,23737,750,415290,1911,160,41695,833125,5041,280,9791,109,931133,316
Pasargard99329933275,321109,27837,426,875728,6821,042,748159,726128,4641,164,5191,168,66639,580
Table 4. The AHP weights for inputs and outputs.
IndicesI1I2I3I4I5I6I7O1O2O3O4O5O6
Weights0.026080.02080.033040.087050.053680.068440.214780.110290.17380.138980.042080.016890.01409
Table 5. The AHP weights for ratio indicators.
Indicesd1d2d3d4d5d6d7d8d9
Weights0.009606670.00750.012500.036477440.022418470.027494350.103911650.016220570.012664
Indices10d11d12d13d14d15d16d17d18
Weights0.021110.061591030.037852890.046423360.175451610.012496340.0097570.0162630.047449
Indicesd19d20d21d22d23d24d25d26d27
Weights0.029161910.035764600.135168090.003272140.0025550.0042580.0124246170.0076359780.0093649
Indicesd28d29d30d31d32d33d34d35d36
Weights0.035393450.00116680.0009110.0015180.004430430.002722880.0033390.012620780.0009218
Indicesd37d38d39d40d41d42
Weights0.000720.00120.003500180.002151150.002638210.00997079
Table 6. The negative principle components obtained from WPCA.
PC1PC2PC3PC4PC5 PC1PC2PC3PC4PC5
Iran−0.29150.058420.070730.028010.10622Sina0.078000.02444−0.10390.01313−0.04603
Dana0.040900.209390.15311−0.07190.00982Dey0.08962−0.05341−0.07310.03889−0.01485
Asia0.018520.04530.045470.07397−0.0126Saman0.02535−0.0763−0.0317−0.12020.031898
Alborz−0.0380−0.00430.021410.02407−0.0048Novin−0.0278−0.009230.050270.016890.000952
Moalem0.06831−0.0163−0.05260.07582−0.0368Pasargard0.00546−0.11215−0.0248−0.13790.054345
Parsian−0.0491−0.0207−0.0469−0.0414−0.0504Eigenvalue15.355611.934894.540133.903962.090281
Toseie−0.0195−0.00940.02708−0.0392−0.0017VCR (%)36.5628.4210.819.34.98
Razi0.087259−0.01891−0.03990.08253−0.033CVCR (%)36.5664.9875.7985.0890.06
Karafarin0.01259−0.016890.004930.0575−0.0031
Note: VCR: Variance contribution rate, CVCR: Cumulative variance contribution rate.
Table 7. The positive principal components obtained from WPCA.
PC1PC2PC3PC4PC5 PC1PC2PC3PC4PC5
Iran11.3499751.3622921.3195671.397775Razi1.3788181.2726511.251651.3740921.25856
Dana1.3324631.5009431.4446671.2195671.301373Karafarin1.3041471.2746661.2964861.3490581.288459
Asia1.3100811.3368881.3370251.3655331.278937Sina1.369561.3159981.1876691.3046841.245532
Alborz1.2535261.2872891.3129641.3156281.286779Dey1.381181.2381481.218471.3304471.276709
Moalem1.3598721.275221.2389461.3673851.254797Saman1.3169081.2152561.2598251.1713311.323457
Parsian1.2423791.2708781.244591.250141.24113Novin1.2638361.2823261.3418281.3084511.29251
Toseie1.2720321.2821731.318641.2523181.289895Pasargard1.2970141.1794041.2667611.1536141.345904
Table 8. The final ranks from the different models.
PCA–DEAAHP–PCA–DEA
DMUInsurance CompanyW0RankDMUInsurance CompanyW0RankDMUInsurance CompanyW0RankDMUInsurance CompanyW0Rank
1Iran0.7332138Razi0.947751Iran0.9446138Razi1.0062
2Dana1.290519Karafarin0.847482Dana1.073219Karafarin0.9697
3Asia0.8967610Sina0.958243Asia0.9790610Sina0.9994
4Alborz0.82201011Dey1.018924Alborz0.94921111Dey1.0013
5Moalem0.9826312Saman0.892875Moalem0.9897512Saman0.9598
6Parsian0.69031413Novin0.831496Parsian0.92591413Novin0.9549
7Toseie0.78241214Pasargard0.7965117Toseie0.94911014Pasargard0.94712

