Article

Analysis of the Development Level of Geo-Economic Relations between China and Countries along the Belt and Road

1
Faculty of Geographical Science, Beijing Normal University, Beijing 100875, China
2
Academy of Plateau Science and Sustainability, Xining 810008, China
3
School of Geographical Science, Qinghai Normal University, Xining 810008, China
4
School of Economics, Dongbei University of Finance and Economics, Dalian 116025, China
5
School of Geographic and Environmental Sciences, Tianjin Normal University, Tianjin 300387, China
*
Author to whom correspondence should be addressed.
Sustainability 2020, 12(3), 816; https://0-doi-org.brum.beds.ac.uk/10.3390/su12030816
Submission received: 13 December 2019 / Revised: 13 January 2020 / Accepted: 20 January 2020 / Published: 22 January 2020
(This article belongs to the Section Economic and Business Aspects of Sustainability)

Abstract

:
With the continuous advancement of the Belt and Road Initiative, countries along the Belt and Road are becoming the most important geo-economic space for China’s peaceful rise. This paper constructs a geo-economic model to measure the geo-economic relations between China and countries along the Belt and Road, analyzes the spatial-temporal patterns of geo-economic flow between China and these countries, and discusses the spatial agglomeration of geo-economic flow between China and these countries. The results show that the geo-economic flow between China and the countries along the Belt and Road is increasing and the geo-economic relations between China and these countries are continuing to improve. Trade flow is far greater than investment flow, and China’s geo-economic relations with these countries have mainly relied on trade flow. The spatial differentiation of geo-economic flow between China and countries along the Belt and Road is significant. The development of geo-economic relations is unbalanced, and regional powers play an important role. The geo-economic center of gravity of China and countries along the Belt and Road was moving in the northeastern part of India and it first moved to the northwest and then to the southeast. China’s geo-economic space has obvious core-peripheral structure characteristics, and Southeast Asia is the core area of China’s geo-economic space. China’s geo-economic space presents a northwest-southeast pattern in the direction. There has been a significant, positive spatial autocorrelation in geo-economic flow between China and the countries along the Belt and Road, but the overall spatial agglomeration has been weak. The geo-economic flow agglomerations of China and these countries have mainly occurred in Southeast Asia, and the main agglomeration type has been high–high. The geo-economic activities of China and Southeast Asia had certain spatial spillover effects. To promote the sustainable development of China’s geo-economic relations with the countries along the Belt and Road, China should upgrade investment networks with these countries, optimize geo-economic relations with regional powers, and promote the full development of trade flow, investment flow and other geo-economic element flow.

1. Introduction

Since proposing it, China has built the Belt and Road Initiative as an important long-term project. In 2015, the Chinese government issued the “Vision and Actions on Jointly Building the Silk Road Economic Belt and 21st-Century Maritime Silk Road” and developed the blueprint for the construction of the Belt and Road Initiative [1]. In 2017, the Chinese government launched two initiatives to promote unimpeded trade cooperation and digital economy international cooperation along the Belt and Road. In 2017 and 2019, China organized and held two Belt and Road Forums for International Cooperation and reached a number of cooperation consensuses with participating countries. As of March 2019, the Chinese government had signed 173 cooperation documents about building the Belt and Road, together with 125 countries and 29 international organizations. Due to the joint efforts of China and the countries along the Belt and Road, trade between China and these countries has continued to expand, two-way investment has developed in-depth, the pace of construction of the free trade zone has accelerated, and major projects have come into effect [2]. There is no doubt that China’s geo-economic relations with the countries along the Belt and Road are moving to a new stage.
As the Belt and Road Initiative is accepted by an increasing number of countries, scholars are paying increasing attention to the Belt and Road. The Belt and Road Initiative is not intended to rebuild the historical international trade route but to be an open and inclusive international regional economic cooperation network [3]. The Belt and Road Initiative is creating new development models and civilizations and redefining China’s geopolitical identity, which transcends confrontational geopolitical thinking [4]. The Belt and Road Initiative follows functional logic, which is essentially functional cooperation between China and countries along the Belt and Road based on a specific geographical environment [5]. These views suggest that China’s Belt and Road Initiative will provide cooperation platforms and new development opportunities for many countries, and China and the countries along the Belt and Road will achieve mutual benefits and experience a win–win situation. However, not everyone agrees that the Belt and Road will achieve a win-win situation. These people are more convinced that China’s implementation of the Belt and Road has its own national interests. Jacob said that the Belt and Road Initiative was a long-term strategic initiative, which sought to convert China’s current economic might into diplomatic influence [6]. Dellios believed that the Belt and Road Initiative would undoubtedly bring geopolitical and geo-economic benefits to China [7]. Brown considered that the Belt and Road Initiative was an attempt by China to tell its story to the world, which would result in the world showing more signs of Chinese influence [8]. Blanchard and Flint thought China’s Maritime Silk Road Initiative had multiple economic goals, and the most important goal was to sustain and boost China’s growth [9]. These views tend to reflect China’s Belt and Road Initiative from a geopolitical perspective and the belief that the Belt and Road Initiative is expanding the resources, space and discourse needed for China’s development.
Regardless of the many different views on the Belt and Road Initiative, the Belt and Road is accelerating geo-economic development. Boffa found that the Belt and Road Initiative integrated economies and the countries along the Belt and Road formed good backward and forward linkages [10]. Du and Zhang pointed out that the Belt and Road Initiative stimulated Chinese companies to increase overseas direct investment and strengthened cross-border acquisitions along the Belt and Road [11]. Jean-Paul found that the Belt and Road Initiative promoted trade and investment between China and the Nordic countries and Baltic Countries [12]. Irshad thought that China-Pakistan Economic Corridor was deepening China–Pakistan geo-economic cooperation and enhancing strategic economic partnership between the two countries [13]. These studies proved that the implementation of the Belt and Road Initiative promoted geo-economic cooperation and strengthened the geo-economic links between China and the countries along the Belt and Road. In addition, China’s Belt and Road Initiative is integrating connectivity into the geo-economy. China’s Belt and Road Initiative emphasizes infrastructure connectivity and promotes the construction and renovation of roads, railways, ports and other infrastructures throughout Asia and Europe, linking regions of different economic development levels, promoting the free flow of geo-economic elements [14]. In the future, countries connected by geo-economic elements flow may form a huge geo-economic network along the Belt and Road.
Geo-economic research is very concerned with resources, trade, investment, and geo-economic strategies. Resource conflicts can be described as geo-economic conflicts and geopolitical conflicts, and these conflicts evolve as outcomes of the geopolitical economy [15]. Russia influences the geopolitics and geo-economics of the Caspian region through the development of oil and gas resources in the Caspian Sea region [16]. The spatial distribution of oil and gas resources along the Belt and Road presents a pattern with two centers: Russia and the Middle East [17]. In fact, in the era of the geo-economy, oil, natural gas, and other strategic resources have become important tools for geo-economic competition. The geo-economic analysis of trade focuses on trade patterns and trade competition and cooperation. Trade interdependence has deepened between China and countries in the Belt and Road Initiative area, but the interdependence has been asymmetrical [18]. Fears of the formation of blocs in the world trading system are greatly exaggerated in the post-cold war world [19]. As a conflict between the two largest economies worldwide, the China–US trade war is bound to have a ripple effect on the global system of trade [20]. Geo-economic development is inseparable from the support of capital, and the flow of capital profoundly affects geo-economic competition and cooperation. China’s experimental financial and monetary initiatives are enhancing China’s centrality to global financial flows [21]. The global transnational investment network is showing a “core–edge” ring structure, and the investment network has transformed from a dual-core structure into overlapping and related multicore topological structures [22]. Geo-economic strategy is an important way for large countries to shape regional economic orders. Typical regional geo-economic strategies can be divided into neoimperialism, neo-mercantilism, hegemony, and liberal institutionalism [23]. Southeast Asian, South Asian and Indian Ocean countries prefer a geo-economic “Indo-Pacific” concept, but the “Indo–Pacific” geo-strategic concepts of the United States mainly focus on geopolitical security and military security [24]. Trade powers prioritize achieving geo-economic strategic goals through interregional trade agreements [25,26]. Brazil, China, and India rely on nonmilitary means in their soft balance with the United States, and they attach importance to geo-economic strategy [27]. Through these studies, it is not difficult to find that geo-economic elements are influencing the competition and cooperation of the geo-economy. All geo-economic elements can have profound impacts on geo-economic development.
As Luttwak said, geopolitical competition will give way to geo-economic competition, and resources and markets have become the focuses of competition among countries [28]. However, competition is not the only form of geo-economic relations. Geo-economic relations between countries have many different forms and characteristics. Geo-economic relations change with geo-economic elements. As China’s investment and trade in North Korea have continued to grow, China–North Korea relations have shifted from one-sided economic support by China into strategic and mutual cooperation [29]. The geo-economic relations as a whole are more competitive, rather than cooperative, among China, the US, and Japan, and the competition for overseas oil resources is the decisive factor [30]. The focus of economic relations between India and Japan is on bilateral merchandise trade, capital movements, and the migration of labor [31]. Russia’s role in China’s trade has had a very low general profile, showing that the economic relations between China and Russia need to be further improved [32]. These studies revealed the evolutionary characteristics of geo-economic relations between countries and laid the foundation for the formulation of geo-economic policies. These studies emphasized the geo-economic competition and cooperation, revealed the evolutionary characteristics of geo-economic relations between countries and laid the foundation for the formulation of geo-economic policies. However, these studies did not analyze the effects of economic flow on the geo-economy, nor did they analyze the effects of changes in trade and investment flow on geo-economic relations. In fact, trade flow, capital flow, information flow, population flow, value flow and other flow elements are all closely linked to all countries. Economic flow has become a direct reflection of the interaction of geo-economic activities among countries. Changes in trade flow and investment flow reflect changes in geo-economic relations. Against this background, economic flow analysis can reveal the changes and characteristics of geo-economic relations better than single trade or investment analysis. Therefore, this paper takes the lead in constructing the geo-economic flow model to analyze geo-economic relations. The related geo-economic relations research methods mainly used the gravity model, the ordinary least squares model, comparative analysis and qualitative analysis [33,34]. However, these research methods cannot identify the intensity of geo-economic relations and they cannot unify different geo-economic flow elements. Geo-economic flow model integrates trade flow and investment flow into a unified geo-economic flow, overcoming the limitations of using unilateral indicators to describe geo-economic relations.
The Belt and Road Initiative is reshaping China’s geo-economic relations between China and the countries along the Belt and Road. However, the related research paid more attention to the purpose of China’s Belt and Road initiative and did not clarify the geo-economic relations between China and the countries along the Belt and Road, nor did they reveal the changing characteristics of China’s geo-economic space. In order to solve these problems, this paper measured the geo-economic relations between China and the countries along the Belt and Road, discussed the impact of the Belt and Road initiative on geo-economic relations, and analyzed China’s geo-economic space changes in in the areas along the Belt and Road. More importantly, this paper will identify the role of trade and investment in geoeconomic relations and clarify how trade flow and investment flow reshape geo-economic relations between China and the countries along the Belt and Road. Compared with previous studies on geo-economic relations, this paper emphasizes the role of geo-economic flow elements in maintaining geo-economic relations and reveals the changes of geo-economic relations among countries and the interaction of geo-economic relations through geo-economic flow. On the one hand, geo-economic flow analysis can reveal geo-economic relations intensity between China and the countries along the Belt and Road and scientifically and objectively describe the development level of geo-economic relations between China and the countries along the Belt and Road. On the other hand, geo-economic flow analysis will identify the influence of trade flow and investment flow on geo-economic relations between China and the countries along the Belt and Road. What’s more, this paper analyzed China’s geo-economic space changes based on geo-economic flow and identified the structural characteristics of China’s geo-economic space, which helped us to understand China’s geo-economic space scientifically.
With the continuous promotion of the Belt and Road Initiative, the area along the Belt and Road Initiative has become an important area for China to develop geo-economy. Analysis of the geo-economic relations between China and the areas along the Belt and Road will help us to scientifically and objectively understand the development characteristics of geo-economic relations and to implement geo-economic policies tailored to local conditions. This paper selects the Belt and Road area as the study area. First, we build a geo-economic flow model and then use it to measure geo-economic relations between China and the Belt and Road. Then, we use standard deviation ellipse analysis and spatial autocorrelation analysis to analyze the geo-economic flow of China and the countries along the Belt and Road. Finally, we discuss and summarize the development of geo-economic relations between China and the countries along the Belt and Road.

2. Method and Data

2.1. Geo-Economic Flow Model

Castells proposed the space of flow theory [35], which points out that the dominant form of space is no longer the space of places in network society; it is a new space of flow [36]. With the support of globalization and new information technologies, the “space of place” of the world economy is being replaced by the “space of flow”, and the spatial structure of the world economic system is gradually becoming based more on flow, networks, and nodes [37]. Against this background, the geo-economic flow between countries maintains and drives geo-economic development, and geo-economic flow has become an important indicator for measuring the degree of development of geo-economic relations. To scientifically describe the geo-economic flow, this paper learns from the space of flow theory and constructs a geo-economic flow model to describe the development of geo-economic relations between countries [35].
Fij = Ti * Tj + Ii * Ij
Fi = j = 1 n Fij .
In the formula, Fij is the geo-economic flow of country I and country J, Ti is the trade flow from country I to country J, Tj is the trade flow from country J to country I, Ii is the investment flow from country I to country J, Tj is the investment flow from country J to I, and Fi is the total economic flow of country I and all countries. The size of geo-economic flow reflects the degree of geo-economic interaction between countries. The larger that Fij is, the better the geo-economic relations between countries. Investment flow and trade flow are the most important variables in geo-economic relations. The geo-economic flow model covers investment flow and trade flow, which can reveal the vector characteristics of geo-economic flow between countries and quantifies the developmental changes of geo-economic relations between countries. More importantly, the geo-economic flow model integrates various single elements into a unified economic flow so that we can comprehensively compare geo-economic relations between countries, providing a new way for us to evaluate geo-economic relations between countries.

2.2. Standard Deviational Ellipse

The standard deviational ellipse (SDE) is a research method for revealing the spatial distribution characteristics of geographic elements [38]. As a spatial analysis tool, standard deviation ellipse was used in studies such as population distribution, spatial Variation of Economic, spatial planning of medical care facilities [39,40,
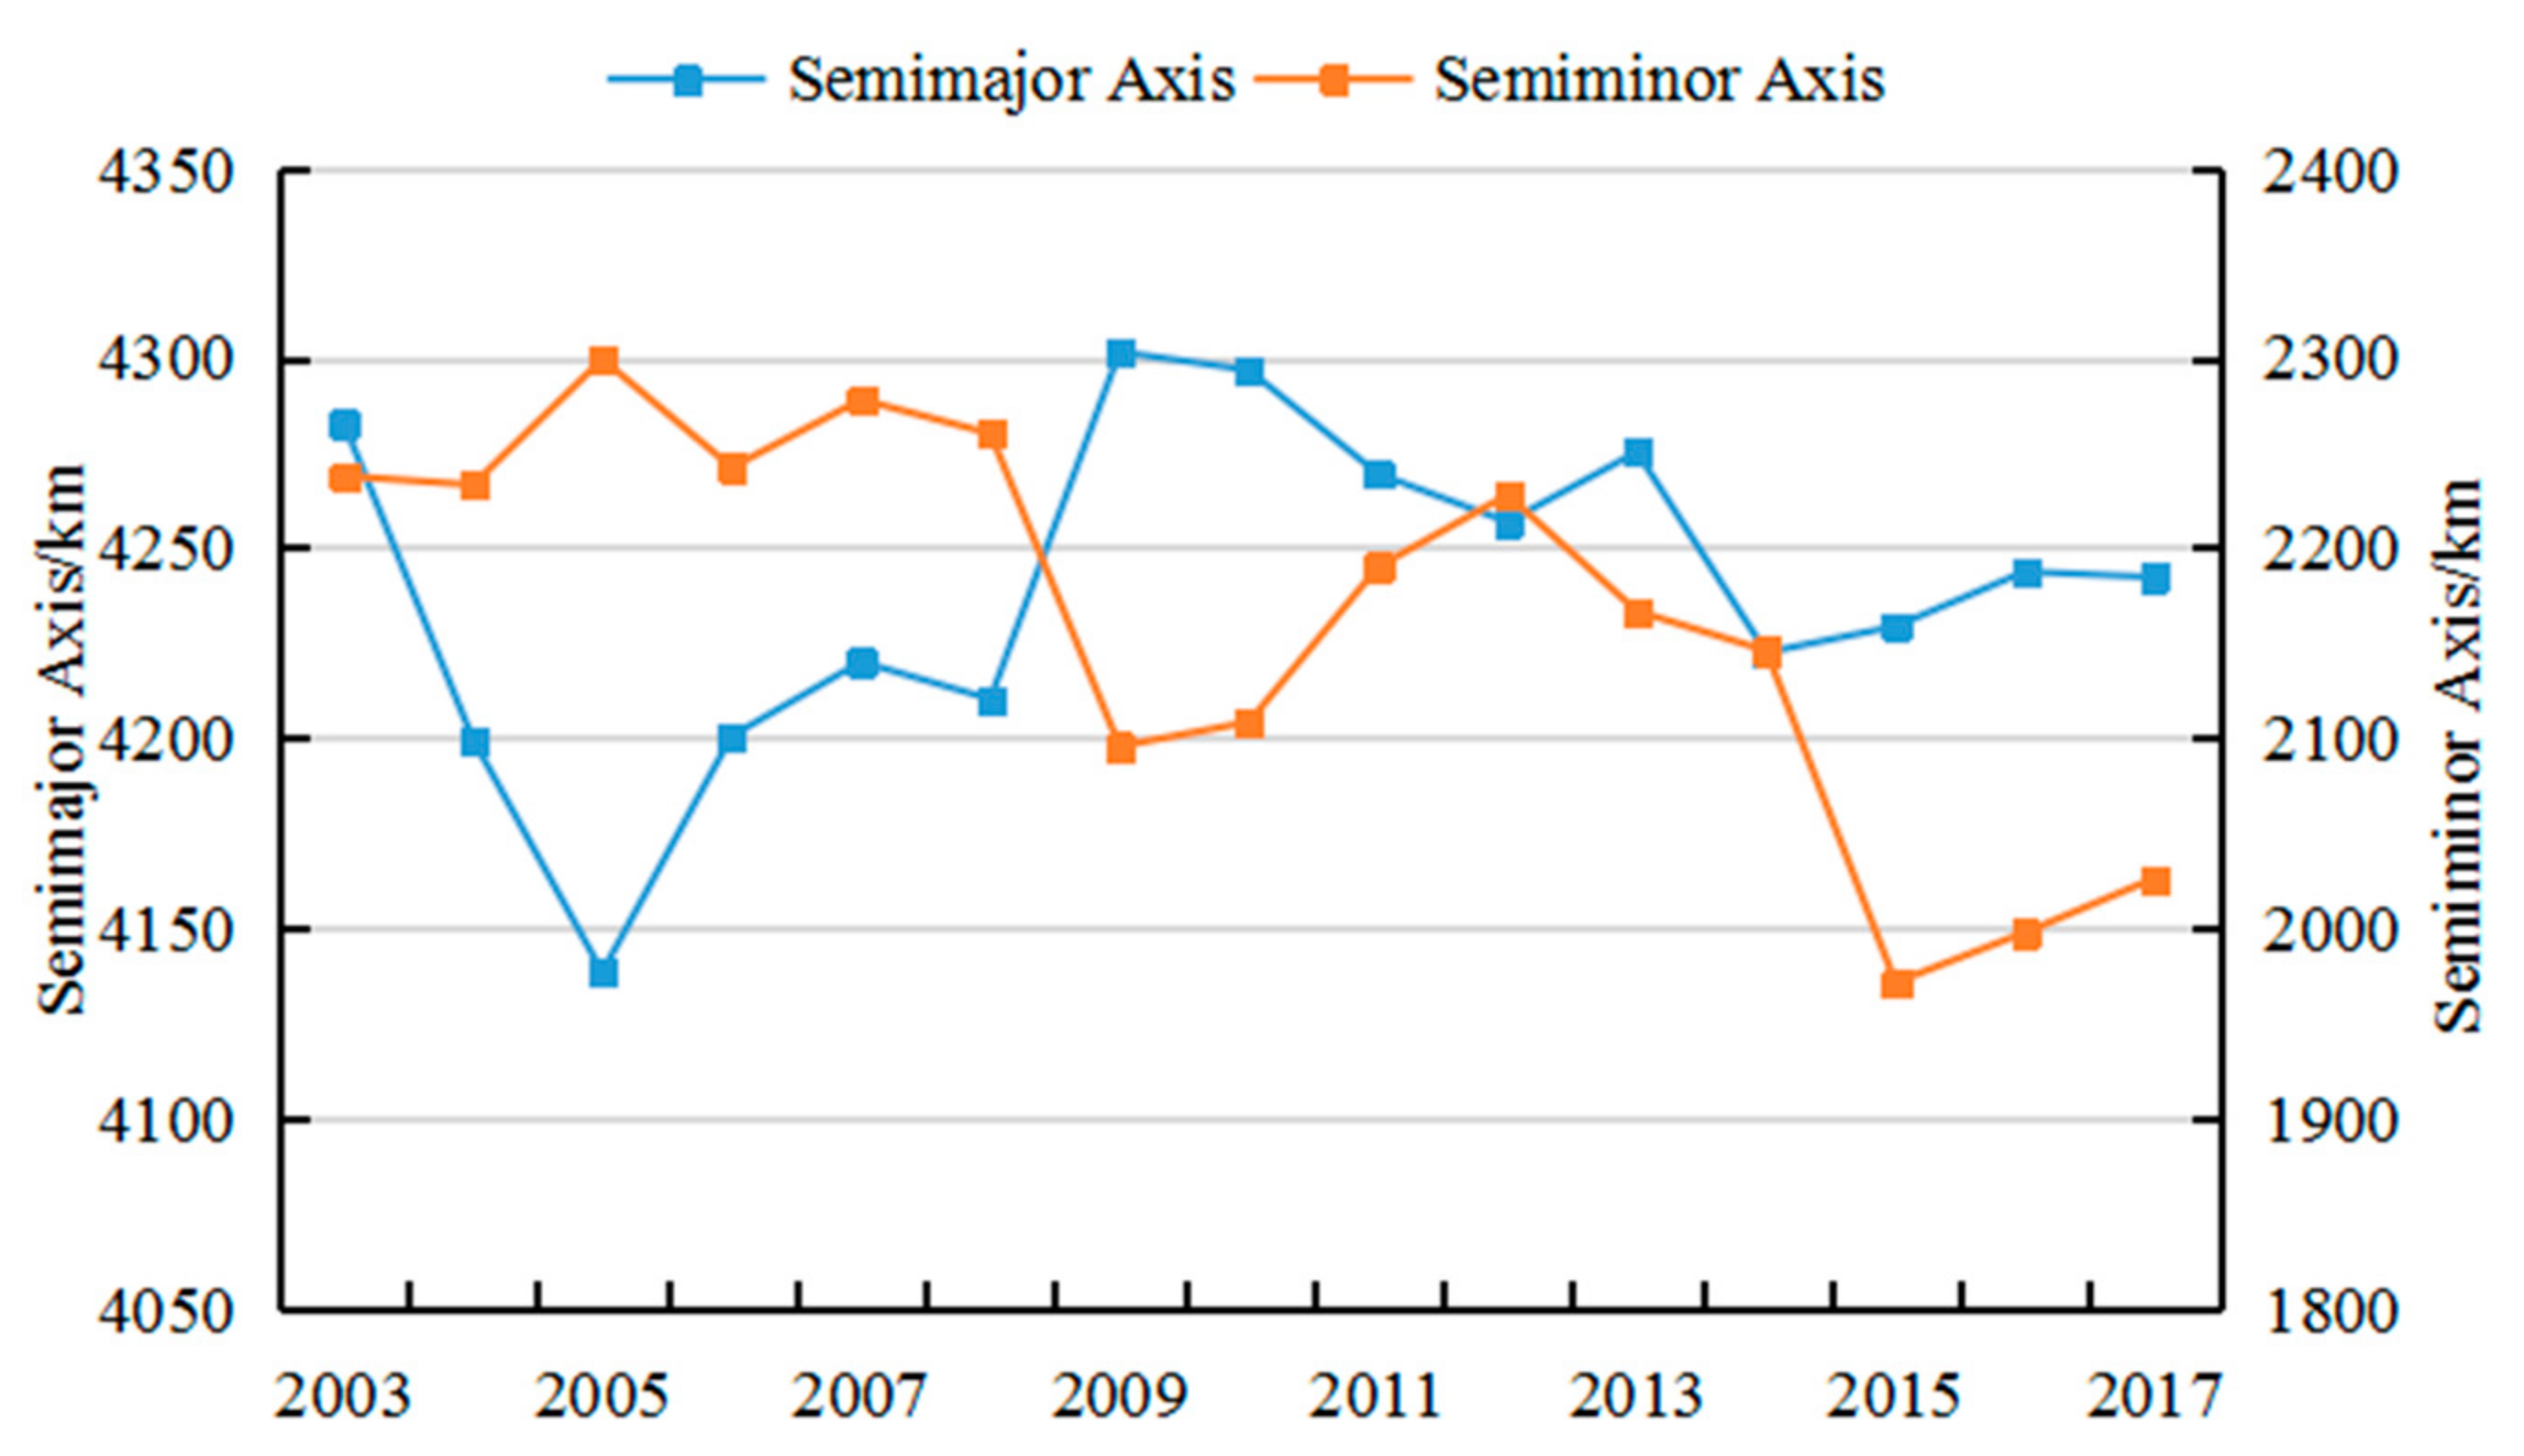
41]. The center of gravity of the SDE reflects the relative positions of elements in geographic space. The direction of the major axis reflects the main trend direction of the distribution of elements in geographic space. The length of the major axis reflects the degree of deviation of the spatial distribution of elements from the center in the main direction. The length of the minor axis reflects the degree of deviation of the elements from the center in the secondary direction. The rotation angle represents the main direction of the distribution of elements, and the ratio of the lengths of the major axes and minor axes reflects the shape of the spatial distribution of elements. With the SDE method, we can reveal the characteristics of the distribution of geo-economic flow, such as the center of gravity, direction and convergence trends, which provide references for describing the changes in geo-economic relations between China and countries along the Belt and Road Initiative.
X = i = 1 n x i n Y = i = 1 n y i n
tan θ = i = 1 n x i 2 i = 1 n y i 2 + i = 1 n x i 2 i = 1 n y i 2 2 + 4 i = 1 n x i 2 y i 2 2 2 i = 1 n x i y i
σ x = i = 1 n x i cos θ y i sin θ 2 n , σ y = i = 1 n x i sin θ y i cos θ 2 n .
In the formula, x i and y i are the coordinates of element i (the research object), and x and y are the relative coordinates of x i and y i from the center of gravity of the region. ( X , Y ) are the coordinates of the regional center of gravity, and θ is the rotation angle of the ellipse.

2.3. Spatial Autocorrelation Analysis

Spatial autocorrelation refers to the statistical correlation between certain attribute values of something distributed in different spatial locations. In this paper, global spatial autocorrelation and local spatial autocorrelation are applied to analyze the spatial correlation and agglomeration of geo-economic flow between China and countries along the Belt and Road Initiative. Global spatial autocorrelation analysis can reveal the overall spatial correlation and clustering degree between regions. The global Moran’s index assumes that spatial object attributes have only one overall trend in the study area, and it is an effective indicator to reveal the overall spatial correlation [42]. The formula of the global Moran’s index is as follows.
I = n i = 1 n j = 1 n w i j ( x i x ) ( x j x ) i = 1 n j = 1 n w i j i = 1 n ( x j x ) i j .
In the formula, I is the global Moran’s index, x i and y i are the observed values of the ith and jth space units, respectively, n is the number of space units, and x is the average value of x. w i j is the binary adjacent spatial weights matrix. The value range of Moran’s index I is between −1 and 1. If Moran’s index passes the significance test and is greater than 0, it indicates that there is a positive spatial correlation in the research area, and the attribute values (high or low) of units in the research area show a clustering trend in space. If Moran’s index passes the significance test and is equal to 0, it indicates that there is no spatial correlation between the observed values, and they are independent. If Moran’s index passes the significance test and is less than 0, it indicates that there is a negative spatial correlation in the study area, and the attributed values of units are dispersed in space and have significant spatial differences.
Generally, z-score statistics and corresponding p-values are applied to test the significance of the global Moran’s index statistics.
Z = I E ( I ) var ( I ) .
In the formula, E(I) is the expected value of Moran’s index, and Var (I) is the variance of Moran’s index.
The global Moran’s index can reveal the correlation of a certain attribute of a spatial object over the whole space, but it cannot reveal the spatial correlation and clustering characteristics of local areas. Local spatial autocorrelation can measure the local space correlation and interregional interaction between each area and its surrounding areas, further revealing the clustering area of similar attributes. It is an effective method to analyze whether there is spatial autocorrelation and clustering characteristics in local space. The formula of the local Moran’s index is as follows.
I i = x i x i = 1 n ( x i x ) 2 j n w i j ( x j x ) i j .
In the formula, I i is the local Moran’s index, x i is the average value of x , and w i j is the weight matrix.
The local Moran’s index also uses z-score statistics and corresponding p-values to test for significance. The local Moran’s index has four clustering types, and different clustering types represent different local correlation relationships. If I i > 0, Z i > 0 and I i pass the significance test, region i is located in the high-high quadrant. If I i > 0, Z i < 0 and I i pass the significance test, region i is located in the low-low quadrant. If I i < 0, Z i > 0 and I i pass significance test, region i is located in the high-low quadrant. If I i < 0, Z i < 0 and I i pass significance test, region i is located in the low-high quadrant. The clustering types of the local Moran’s index is reflected on the map to form local indicators of spatial association (LISA) clustering map. By analyzing the agglomeration types of geo-economic flow, the agglomeration characteristics of these flow between China and countries along the Belt and Road Initiative can be clarified, and the spatial association model of geo-economic relations between countries can be identified.

2.4. Data

The Belt and Road Initiative is an open and inclusive international regional economic cooperation network [3]. It does not have an absolute boundary, nor does it have a precise spatial scope [3]. With reference to the scope of the ancient Silk Road and related literature [43] and considering the accessibility of data, this paper selects China and 56 countries along the Belt and Road as the study area. To facilitate the analysis, this paper divides the 56 countries except for China into 6 regions: Mongolia and Russia; Central Asia; Central and Eastern Europe; Southeast Asia; South Asia; and West Asia [44]. Table 1 shows the study areas and the countries included in the six regions. This paper uses the data of trade and investment of 56 countries in 2003–2017 to analyze the geo-economic relations between China and countries along the Belt and Road. Trade data come from the UN Comtrade Database, and investment data come from the China Statistical Yearbook (2004–2018) and the Statistical Bulletin of China’s Outward Foreign Direct Investment (2003–2017).

3. Results

3.1. Spatiotemporal Evolution of Geo-Economic Flow between China and Countries along the Belt and Road

3.1.1. Geo-Economic Flow between China and Countries along the Belt and Road Have Been Continuously Improving, and the Trade Flow Is Dominant

According to the measurement of the geo-economic flow model, the geo-economic flow among China and countries along the Belt and Road has gradually increased (Figure 1). From 2003 to 2017, the geo-economic flow between China and the countries along the Belt and Road increased from 69,709.81 million dollars to 503,722.89 million dollars. The geo-economic element flow between China and the countries along the Belt and Road continued to develop, bilateral geo-economic links continued to strengthen, and bilateral geo-economic relations improved. Since China began promoting the Silk Road Economic Belt and the 21st-Century Maritime Silk Road, it has continued to promote geo-economic cooperation with countries along the Belt and Road, vigorously promoting infrastructure construction building overseas economic and trade cooperation zones and establishing the Silk Road Fund and Asian Infrastructure Investment Bank to promote the development of bilateral investment and trade. In 2017, the total trade volume of China and countries along the Belt and Road reached 1440.32 billion dollars, and China’s direct investment in countries along the Belt and Road increased to 20.17 billion dollars. In this context, trade flow between China and countries along the Belt and Road increased from 69393.75 million dollars in 2003 to 495,843.89 million dollars in 2017, while the investment flow increased from 370.07 million dollars in 2003 to 7879.00 million dollars in 2017. The development of trade flow is the main reason for the strengthening of the geo-economic connection between China and countries along the Belt and Road. It is worth noting that the geo-economic flow among China and countries along the Belt and Road increased by 434,013.07 million dollars in 2003–2017, of which the contribution from trade flow was as high as 98.27%. Comparing trade flow and investment flow, it is easy to see that the growth rate of trade flow is much more rapid than that of investment flow, showing that China’s geo-economic linkages with countries along the Belt and Road mainly rely on trade rather than investment. Obviously, China’s geo-economic connections with countries along the Belt and Road rely primarily on trade rather than investment.
Affected by the financial crisis in 2008, China’s trade and investment with countries along the Belt and Road declined considerably (Figure 1), leading to a significant decline in the geo-economic flow between China and countries along the Belt and Road in 2009. After the Belt and Road Initiative was launched, geo-economic flow between China and the countries along the Belt and Road did not increase rapidly, but fluctuations in the geo-economic flow increased. On the one hand, the global trade situation and economic growth affect China’s trade and investment with the countries along the Belt and Road. On the other hand, the development of investment and trade between China and countries along the Belt and Road is not balanced. China’s investment in countries along the Belt and Road is much greater than investment in China by countries along the Belt and Road. Moreover, China’s exports to countries along the Belt and Road are far greater than exports to China from countries along the Belt and Road. This imbalance causes the geo-economic flow between China and countries along the Belt and Road to grow slowly.

3.1.2. The Development of Geo-Economic Relations Is Unbalanced, and Regional Powers Such as Russia, India and Saudi Arabia Play an Important Role

From the perspective of spatial differentiation, the spatial differentiation of geo-economic flow between China and countries along the Belt and Road is significant, and China’s geo-economic relations with the countries along the Belt and Road has developed unevenly (Figure 2). According to the spatial pattern of geo-economic flow between China and countries along the Belt and Road in 2003, 2008, 2012 and 2017, we find that geo-economic flow between China and Singapore, Russia and Malaysia were the largest. Geo-economic flows between China and India, Saudi Arabia, Thailand, Indonesia and the Philippines were the next largest. Geo-economic flow between China and Turkey, Pakistan, Kazakhstan, and Ukraine were small. China had the smallest geo-economic flow with the remaining countries. With regard to region, countries with smaller geo-economic flow with China were concentrated in Central and Eastern Europe and Central Asia. These countries have smaller gross domestic products, and their trade volumes with China are smaller. They are not China’s preferred countries for overseas investment. Moreover, Central and Eastern European countries are far from China and thus have high transportation costs, increasing the costs of geo-economic activities. In terms of time, the patterns of geo-economic flow between China and North Asia, South Asia and West Asia are relatively stable. Russia, India and Saudi Arabia are the countries with the largest geo-economic flow in Mongolia and Russia, South Asia and West Asia. The geo-economic flow between China and Southeast Asian countries grew rapidly. Geo-economic flow between China and Vietnam, Thailand, and Myanmar increased in size and ranking. Geo-economic relations between China and Southeast Asian countries are rapidly advancing. The ranking of geo-economic flow of Central Asian countries and Central and Eastern European countries rose first and then declined. Most countries in the two regions had relatively small geo-economic flow with China. According to the ranking of geo-economic flow, the geo-economic flow between China and Vietnam increased fastest, and the geo-economic flow between China and Syria decreased fastest. Vietnam rose from 10th in 2003 to 1st in 2017, and Syria dropped in rank from 34 in 2003 to 56 in 2017. Vietnam is close to China. The industrial structures and resource endowments of China and Vietnam are highly complementary. Thousands of Chinese enterprises have invested and built factories, causing the China-Vietnam bilateral trade flow and investment flow to increase rapidly. Considering trade flow as an example, China’s imports from Vietnam increased from 1456.71 million dollars to 50,374.62 million dollars, and China’s exports to Vietnam increased from 3182.74 million dollars to 71,617.25 million dollars during 2003–2017. A rapid increase in trade flow and investment flow increased the geo-economics between China and Vietnam from 2159.71 million dollars in 2003 to 60,116.01 million dollars in 2017, representing the largest increase among all countries. The war in Syria, which has continued since 2011, seriously damaged the investment and trade between Syria and China. From 2003 to 2017, Syria’s exports to China decreased from 6.36 million dollars to 1.33 million dollars, and China’s investment in Syria decreased from 8.12 million dollars to 0.53 million dollars. The geo-economic activities between China and Syria mainly depend on the growth of China’s exports to Syria. With the decreases in trade and investment, the geo-economic flow between China and Syria decreased from 112.76 million dollars in 2003 to 40.58 million dollars in 2017.
The geo-economic flow and their proportion of regional powers are presented in Table 2. China’s geo-economic flow with Russia, India, Saudi Arabia, and other regional powers are far greater than those of other countries in the region (Table 2). From 2003 to 2017, geo-economic flow between China and Russia was far greater than those of neighboring countries, such as Mongolia, Kazakhstan, and Ukraine. Geo-economic flow between China and Russia reached 42,296.42 million dollars in 2017, accounting for 8.40% of the total. The ratio of geo-economic flow between China and India to total flow was more than 5% in 2003–2017, ranging as high as 8.97% in 2005. From 2003 to 2017, geo-economic flow between China and India were larger than those of other countries in South Asia. In addition, the geo-economic flow between China and Kazakhstan and Saudi Arabia in Central Asia were greater than those of other countries in the region. From 2003 to 2017, total geo-economic flow between China and Russia, Singapore, Saudi Arabia, India and Kazakhstan accounted for no less than 30% of the total geo-economic flow, reaching 40.88% in 2007. These data show that regional powers play an important role in the process of geo-economic cooperation between China and the countries along the Belt and Road. In the future, geo-economic cooperation between China and these countries should be dominated by regional powers. It is worth noting that the geo-economic flow between China and Singapore has been substantial for a long time. Especially in 2005, geo-economic flow between the two countries accounted for 13.51% of the total geo-economic flow, showing that the geo-economic relationship between China and Singapore has been well maintained for a long time, and China and Singapore have been important geo-economic partners for a long time.

3.2. Standard Deviational Ellipse Analysis of Geo-Economic Flow between China and Countries along the Belt and Road

3.2.1. The Geo-Economic Center of Gravity First Moved to the Northwest and Then to the Southeast

The coordinates of the center of gravity and the tracks of spatial movement of the standard deviational ellipse are shown in Figure 3. Judging from the direction of movement of the geo-economic center of gravity, the movement of the geo-economic center of gravity experienced three periods: 2003–2008, 2008–2014 and 2014–2017. From 2003 to 2008, the coordinates of the geo-economic center of gravity moved from (87.03° E, 21.65° N) to (82.19° E, 23.90° N), moving 445 km westward and 240.78 km northward and showing an overall northwestward trend in mobility. During this period, geo-economic developments between China and countries in the Northwest of China, such as West Asia, Central Asia, and Central and Eastern Europe, developed rapidly. The geo-economic center of gravity was heading northwest for the geo-economic developments between China and countries in the northwest of China. The coordinates of geo-economic gravity center moved from (82.19° E, 23.90° N) to (82.21° E, 23.49° N) in 2008 to 2014. From 2008 to 2014, the geo-economic center of gravity fluctuated mainly in the north–south direction of 23° N–24° N. The geo-economic developments in the north and south of China formed a tug-of-war, and geo-economic development was rapid in both directions. From 2014 to 2017, the geo-economic center of gravity moved from (82.21° E, 23.49° N) to (84.73° E, 22.47° N), 235.85 km to the east and 107.33 km to the south. China’s geo-economic center of gravity shows a clear southeast trend in this period. During this period, the China–ASEAN free trade area continued to upgrade, and China’s trade and investment with Southeast Asian countries, such as Vietnam, Indonesia, Malaysia and Singapore, increased significantly. The geo-economic flow between China and Southeast Asian countries increased substantially, pushing the geo-economic center to the southeast. In terms of region, the geo-economic center of gravity of China and countries along the Belt and Road was moving in the northeastern part of India, and the moving area of the center of gravity was relatively stable from 2003 to 2017. The overall geo-economic pattern was relatively stable, and the scope of change was small.

3.2.2. China’s Geo-Economic Space Had an Obvious Core-Periphery Structure, and Southeast Asia Was the Core Region of China’s Geo-Economic Space

The area covered by the standard deviational ellipse is the closest to the center, which is the core area of geo-economic space. From 2003 to 2017, the standard deviational ellipse of geo-economic space always covered Central Asia, South Asia, Southeast Asia and most of Western Asia, while Central and Eastern Europe, Russia, Egypt, Syria and so on were located at the periphery of the standard deviational ellipse. Calculating the proportion of geo-economics of Southeast Asia, South Asia, and Central Asia, we found that the proportion of geo-economics of Southeast Asia, South Asia and Central Asia was more than 57% in 2003–2017, and the proportion of geo-economics of Southeast Asia was more than 43%. This finding shows that the geo-economic space between China and countries along the Belt and Road had an obvious core-periphery structure. As a whole, China’s geo-economic space had Southeast Asia, South Asia and Central Asia as the core and Central and Eastern Europe, Egypt and Mongolia as the periphery. Southeast Asia was the core region of China’s geo-economic space. From the perspective of the standard deviation ellipse moving in the direction of the geo-economic space, the standard deviation ellipse moved to the northwest in 2003–2008, showing that geo-economics in West Asia and Central and Eastern Europe increased. During 2008 to 2014, the range of the standard deviation ellipse remained basically unchanged, indicating that the rate of change of geo-economic flow in all directions was relatively consistent. In 2014–2017, the standard deviation ellipse moved to the southeast, showing that geo-economic flow in Southeast Asia grew relatively more rapidly than in other regions. It was worth noting that the area of the standard deviation ellipse decreased from 30,104,893.19 square kilometers to 26,998,008.83 square kilometers, indicating that China’s core geo-economic space tended to converge in the area along the Belt and Road, and the status of the peripheral geo-economic space was increasing, illustrating that geo-economic space tended toward equilibrium.

3.2.3. China’s Geo-Economic Space Has a Northwest-Southeast Pattern in the Direction

In 2003–2017, the major axis and the minor axis of the standard deviation ellipse of China’s geo-economic space decreased first and then increased, and the variation scope of the major axis was smaller than that of the minor axis (Figure 4). On the whole, the major axis shrank slightly and the minor axis continued to shorten. This shown that China’s geo-economic space in the northwest-southeast direction was relatively stable and China’s geo-economic space in the southwest-northeast direction was shrinking. In addition, the geo-economic flow in the southwest-northeast direction tended to the center. Obviously, China’s geo-economic space presents a northwest-southeast pattern in the direction. From 2003 to 2017, the major axis of the standard deviation ellipse of China’s geo-economic rotated counterclockwise, and the rotation angle decreased from 123.56° to 119.01° (Figure 5). The proportion of geo-economic flow of Central Asia, West Asia and Central and Eastern Europe was on the rise, and it was on the decline in South Asia and Southeast Asia. From 2003 to 2017, the ratio of the minor axis to the major axis of the standard deviation ellipse of China’s geo-economic space decreased from 0.52 to 0.48, with an obvious downward trend. In 2003–2005, the ratio of the minor axis to the major axis of the standard deviation ellipse of China’s geo-economic space increased slightly and reached 0.56. In 2005–2017, the ratio of the minor axis to the major axis of the standard deviation ellipse of China’s geo-economic space continued to decline in fluctuation, and it dropped to 0.48. The directionality of China’s geo-economic space standard deviation ellipse is weakening, and the northwest-southeast pattern of China’s geo-economic space is weakening. With the deepening of China’s opening up and the acceleration of its going out, the geo-economic flow between China and Central Asia, Western Asia and South Asia are increasing and the status of Central Asia, Western Asia and South Asia in China’s geo-economic space are rising, which may cause the geo-economic spatial pattern between China and countries along the Belt and Road tends to develop in a balanced way.

3.3. Spatial Autocorrelation Analysis of Geo-Economic Flow between China and Countries along the Belt and Road

3.3.1. Global Spatial Autocorrelation Analysis of Geo-Economic Flow

To further analyze the spatial correlation of the geo-economic flow between China and countries along the Belt and Road, this paper used ArcGIS to measure the global Moran’s index of the geo-economic flow between China and countries along the Belt and Road. Moran’s index of the geo-economic flow between China and countries along the Belt and Road are shown in Table 3. It can be seen from Table 3 that the global Moran’s index was greater than 0 over the entire research period, and all results passed the significance test at the level of p ≤ 0.001. The global Moran’s index increased firstly and then decreased, indicating that there was a significant, positive spatial autocorrelation of the geo-economic flow between China and countries along the Belt and Road, and geo-economic flow of similar size were clustered in space. Countries with larger geo-economic flow are adjacent to other countries with larger geo-economic flow, while countries with smaller geo-economic flow are adjacent to other countries with smaller geo-economic flow. It is worth noting that the fluctuation range of the global Moran’s index from 2003 to 2017 was relatively small. With a maximum value of 0.213, it always fluctuated around 0.2. Obviously, the global Moran’s index value of the geo-economic flow between China and countries along the Belt and Road was small, indicating that the spatial agglomeration of the geo-economic flow between China and countries along the Belt and Road was weak and that large-scale spatial agglomeration did not occur.

3.3.2. Local Spatial Autocorrelation Analysis of Geo-Economic Flow

The global Moran’s index proved that there was a certain degree of agglomeration in the geo-economic flow between China and countries along the Belt and Road. However, this index cannot identify the specific area or agglomeration type of geo-economic flow. Therefore, this paper used a LISA clustering diagram to further analyze the local spatial autocorrelation of geo-economic flow between China and countries along the Belt and Road (Figure 6). In 2003, 2008, 2012, and 2017, most of the Moran’s indexes of the geo-economic flow between the countries along the Belt and Road and China did not pass the significance test. Considering 2017 as an example, only seven countries in the study area passed the significance test for the local Moran’s index, and 87.04% of the countries did not have local spatial autocorrelation. Therefore, the spatial agglomeration of geo-economic flow between China and countries along the Belt and Road occurred in a few areas. It was further shown that the geopolitical economic flow between China and countries along the Belt and Road had weak agglomeration features.
It can be seen from Figure 3 that the geo-economic flow of China and the countries along the Belt and Road only had high-high agglomeration, and there was not low–low agglomeration, low–high agglomeration or high–low agglomeration in 2003. The high-high agglomeration countries in the first quadrant were Malaysia, Singapore, Brunei, Indonesia, and the Philippines. There were high-high agglomeration and low–low agglomeration in the geo-economic flow between China and the countries along the Belt and Road in 2008. Malaysia, Singapore, Brunei, Indonesia and the Philippines were high–high agglomeration, and India was high-low agglomeration. There was only high–high agglomeration in the geo-economic flow between China and the countries along the Belt and Road in 2012. The high-high agglomeration countries in the first quadrant were Malaysia, Singapore, Brunei, Indonesia and the Philippines. The geo-economic flow of China and the countries along the Belt and Road had high-high and low-high agglomeration in 2017. Vietnam, Thailand, Malaysia, Singapore, Brunei, Indonesia and the Philippines were high-high agglomeration. Cambodia was low-high agglomeration. From the perspective of agglomeration type, high–high agglomeration appeared most frequently and had the widest coverage. The agglomeration of geo-economic flow of China and the countries along the Belt and Road was dominated by high–high agglomerations. From the perspective of agglomeration areas, the spatial agglomeration of geo-economic flow all occurred in Southeast Asia in 2003, 2012 and 2017, and Southeast Asia is the most significant area of geo-economic agglomeration between China and the countries along the Belt and Road. From the perspectives of agglomeration scope and agglomeration change, the number of high–high agglomeration countries increased from 5 to 7, and the proportion of high-high agglomeration countries in Southeast Asian increased from 45.45% to 63.63% from 2003 to 2017. The expansion of high–high agglomeration shows that the geo-economic activities between China and Southeast Asia had a certain spatial spillover effect. Southeast Asian countries with strong trade and investment ties with China drove the development of other countries in Southeast Asia and China. From the perspective of space–time transitions of agglomeration type, India, Thailand, Vietnam and Cambodia underwent space–time transitions and changed quadrants. India changed from not significant to high–low agglomeration first and then to not significant. Thailand and Vietnam changed from not significant to high-high agglomeration. Cambodia changed from not significant to low-high agglomeration.
The LISA map of geo-economic flow shows that the agglomeration of China and the countries along the Belt and Road mainly occurred in Southeast Asia. The interaction of trade flow and investment flow between China and Malaysia, Singapore, Indonesia and other Southeast Asian countries remained at a high level, forming a high–high agglomeration area in the geo-economic connection space between China and the countries along the Belt and Road. This outcome indicated that the geo-economic connection between China and Southeast Asian countries was far greater than that of other countries. The huge economic flow composed of capital flow and trade flow between China and Southeast Asian countries maintained and drove the steady development of bilateral geo-economic relations. Although the geo-economic flow between China and countries along the Belt and Road has a certain degree of spatial correlation, this spatial correlation did not form a large-scale agglomeration. The overall spatial dependence of geo-economic flow between China and the countries along the Belt and Road is weak.

4. Discussion and Conclusions

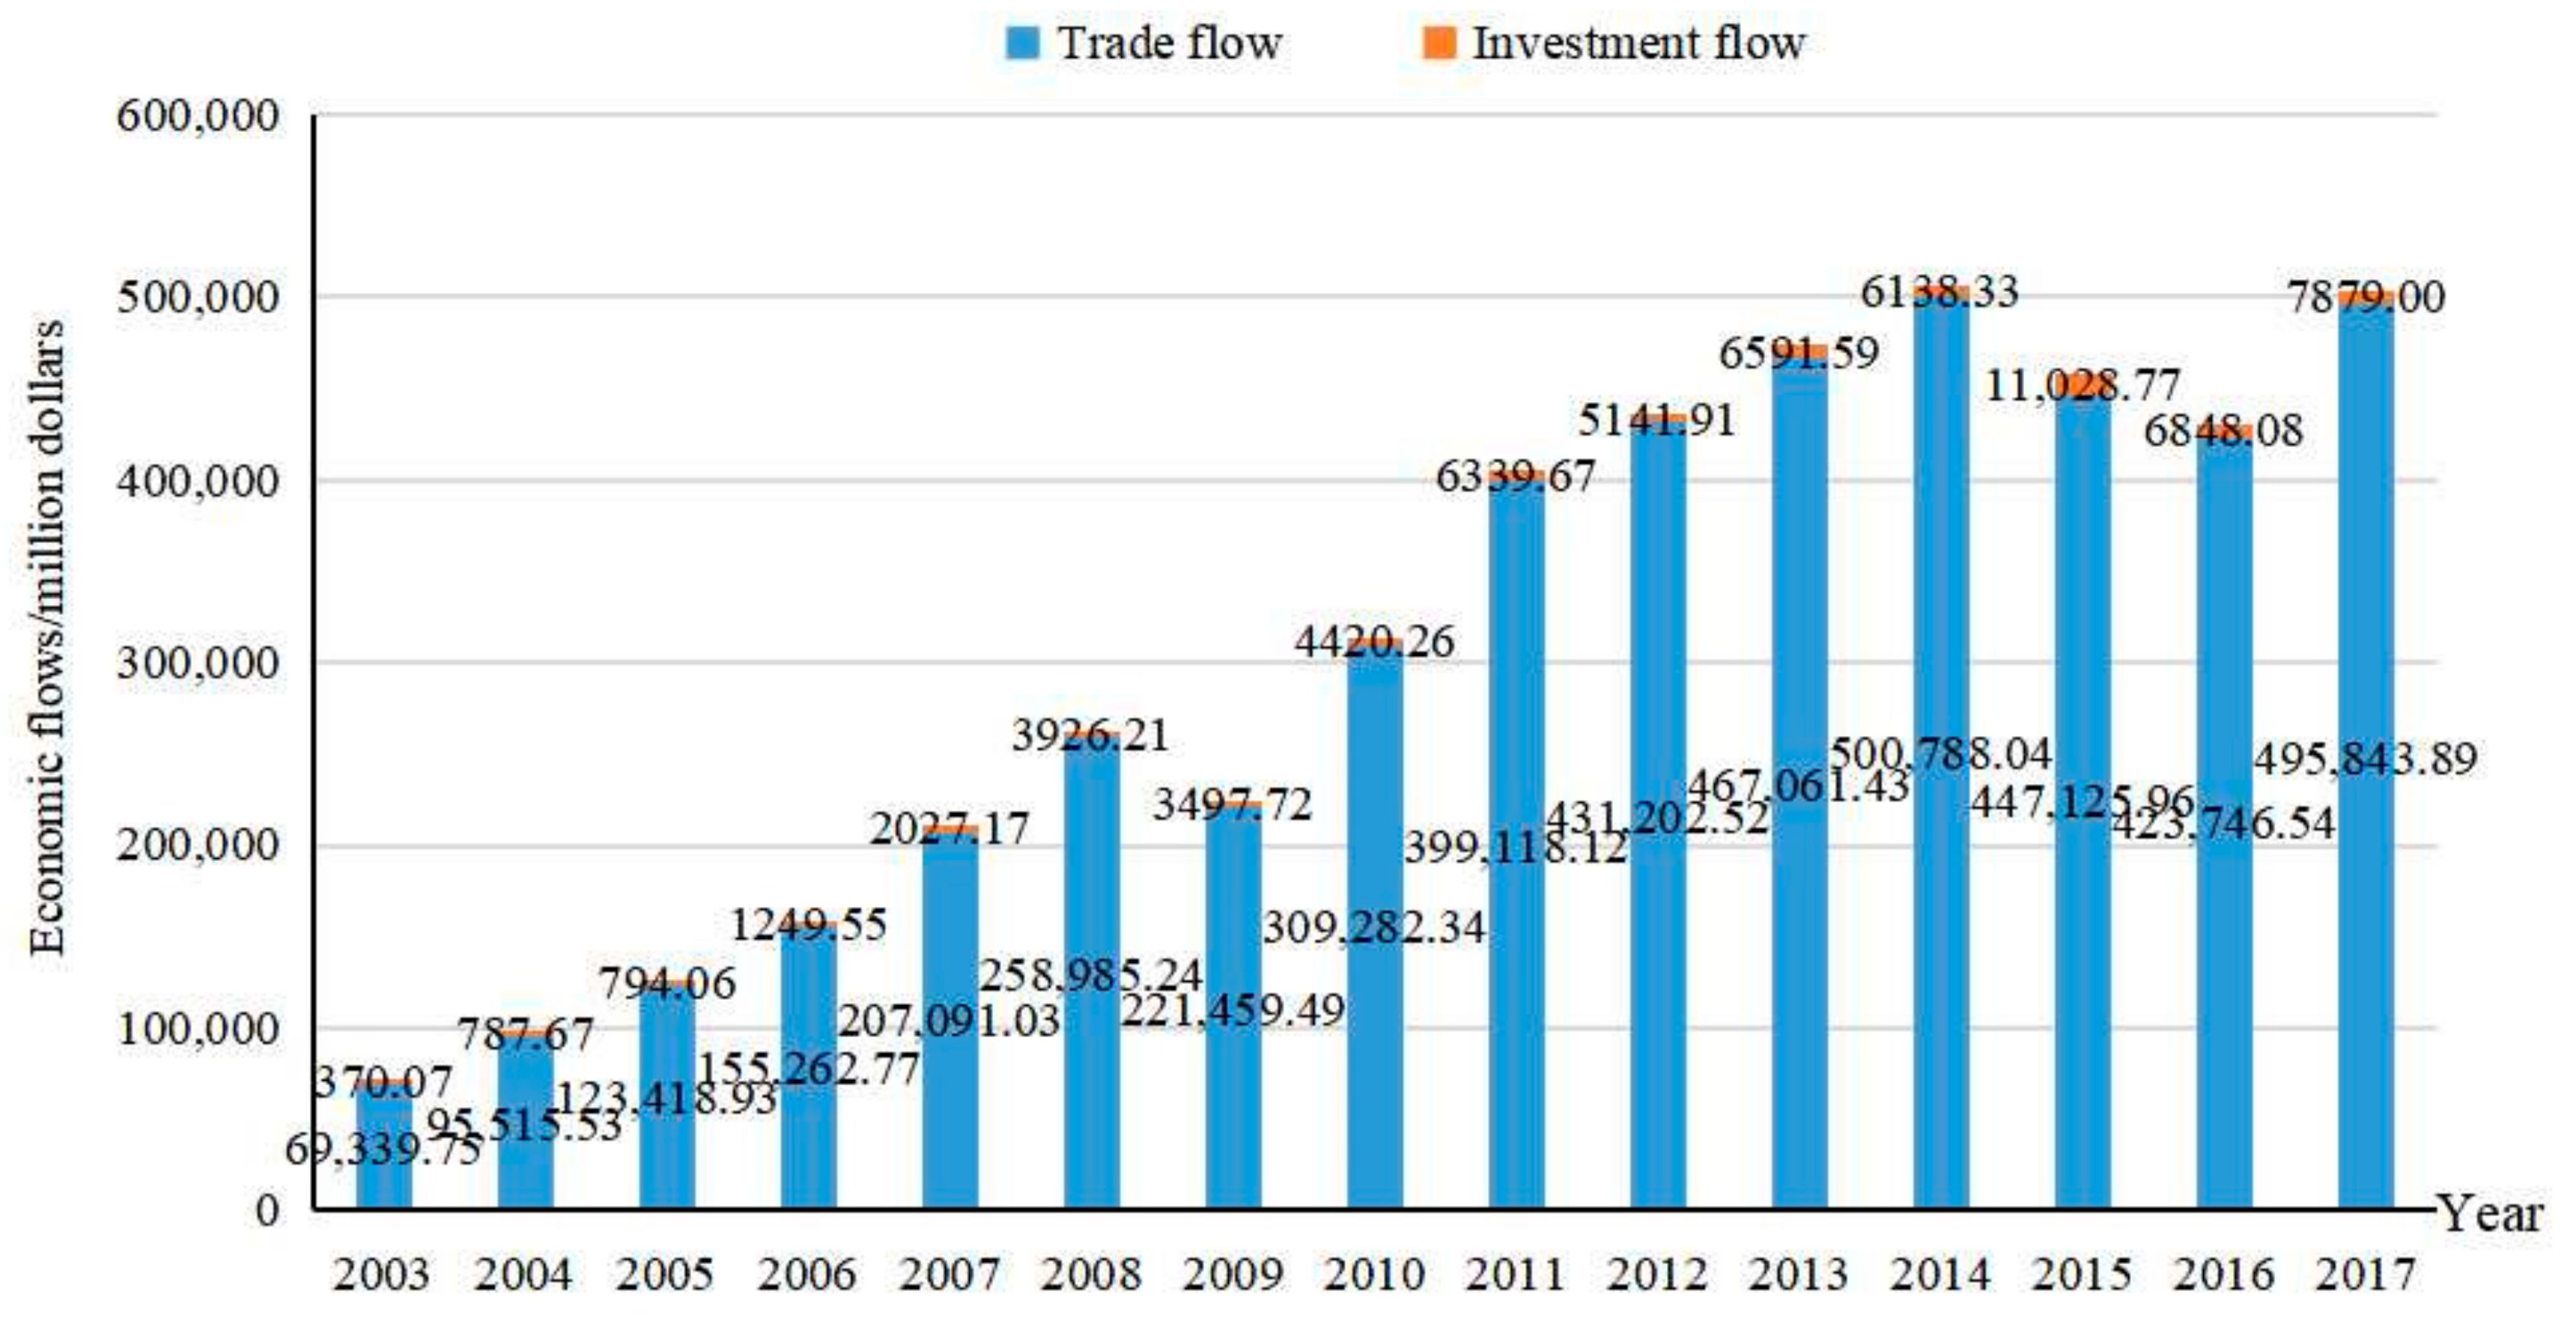
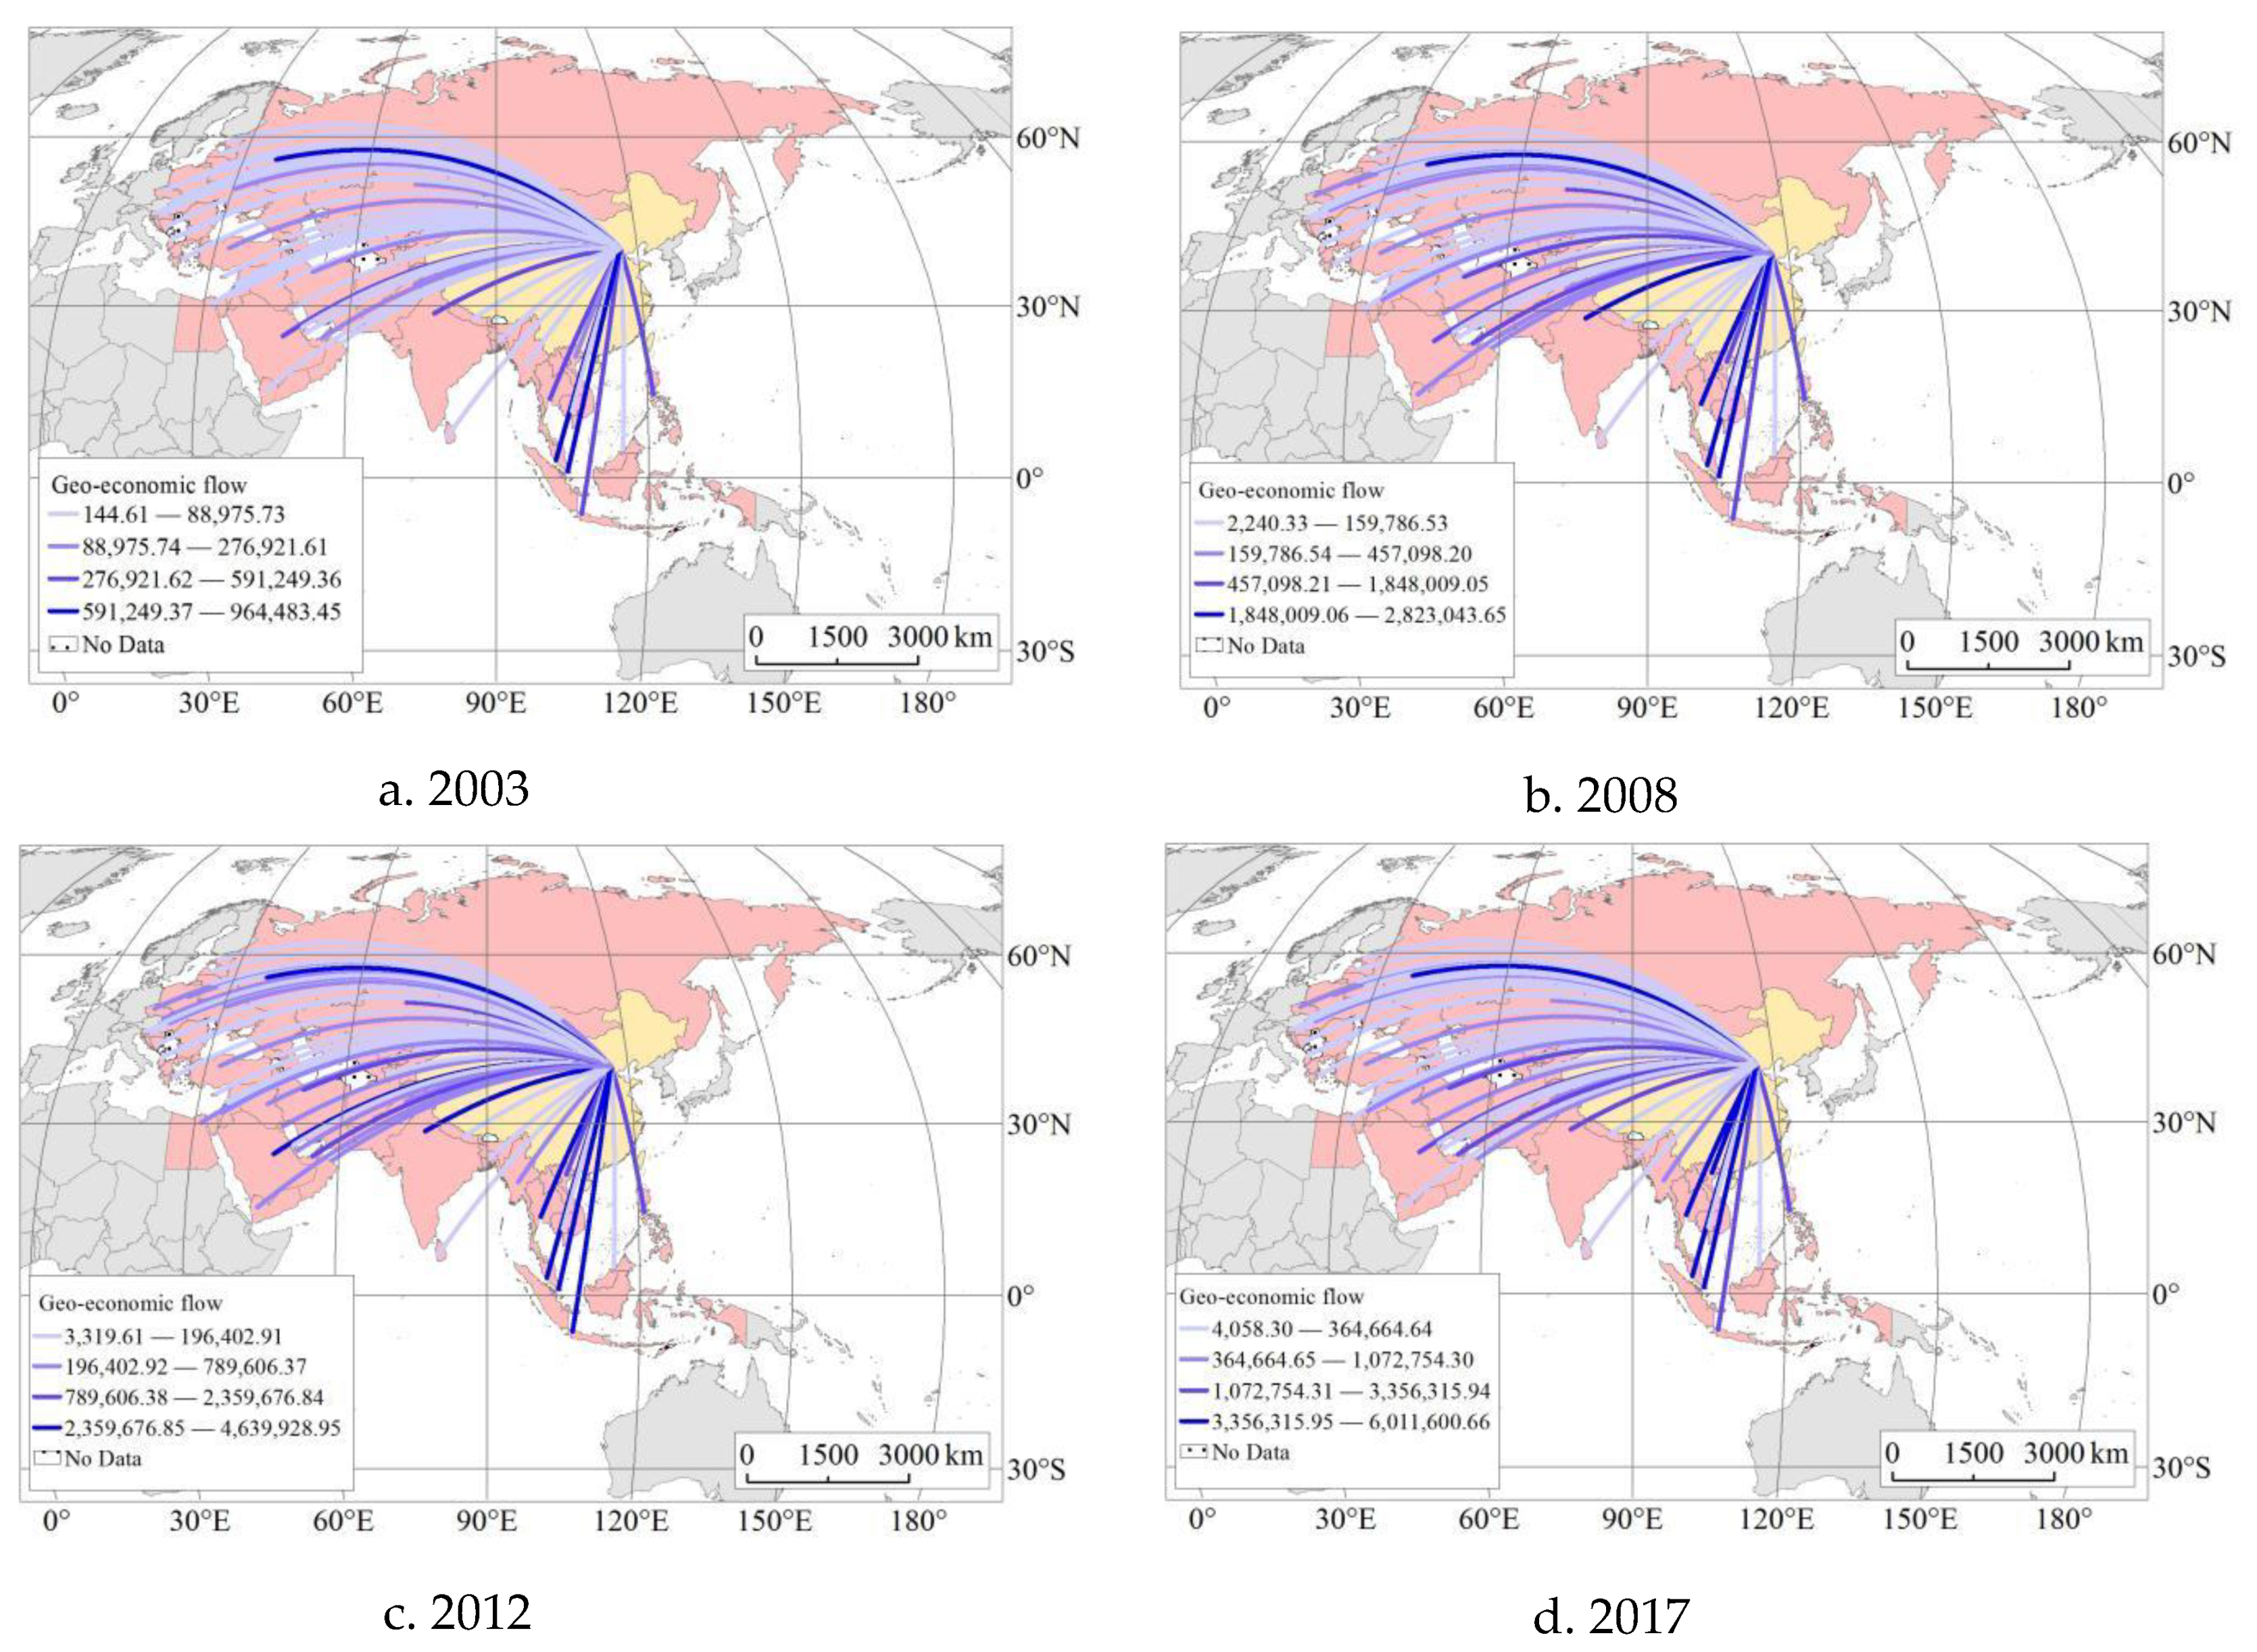
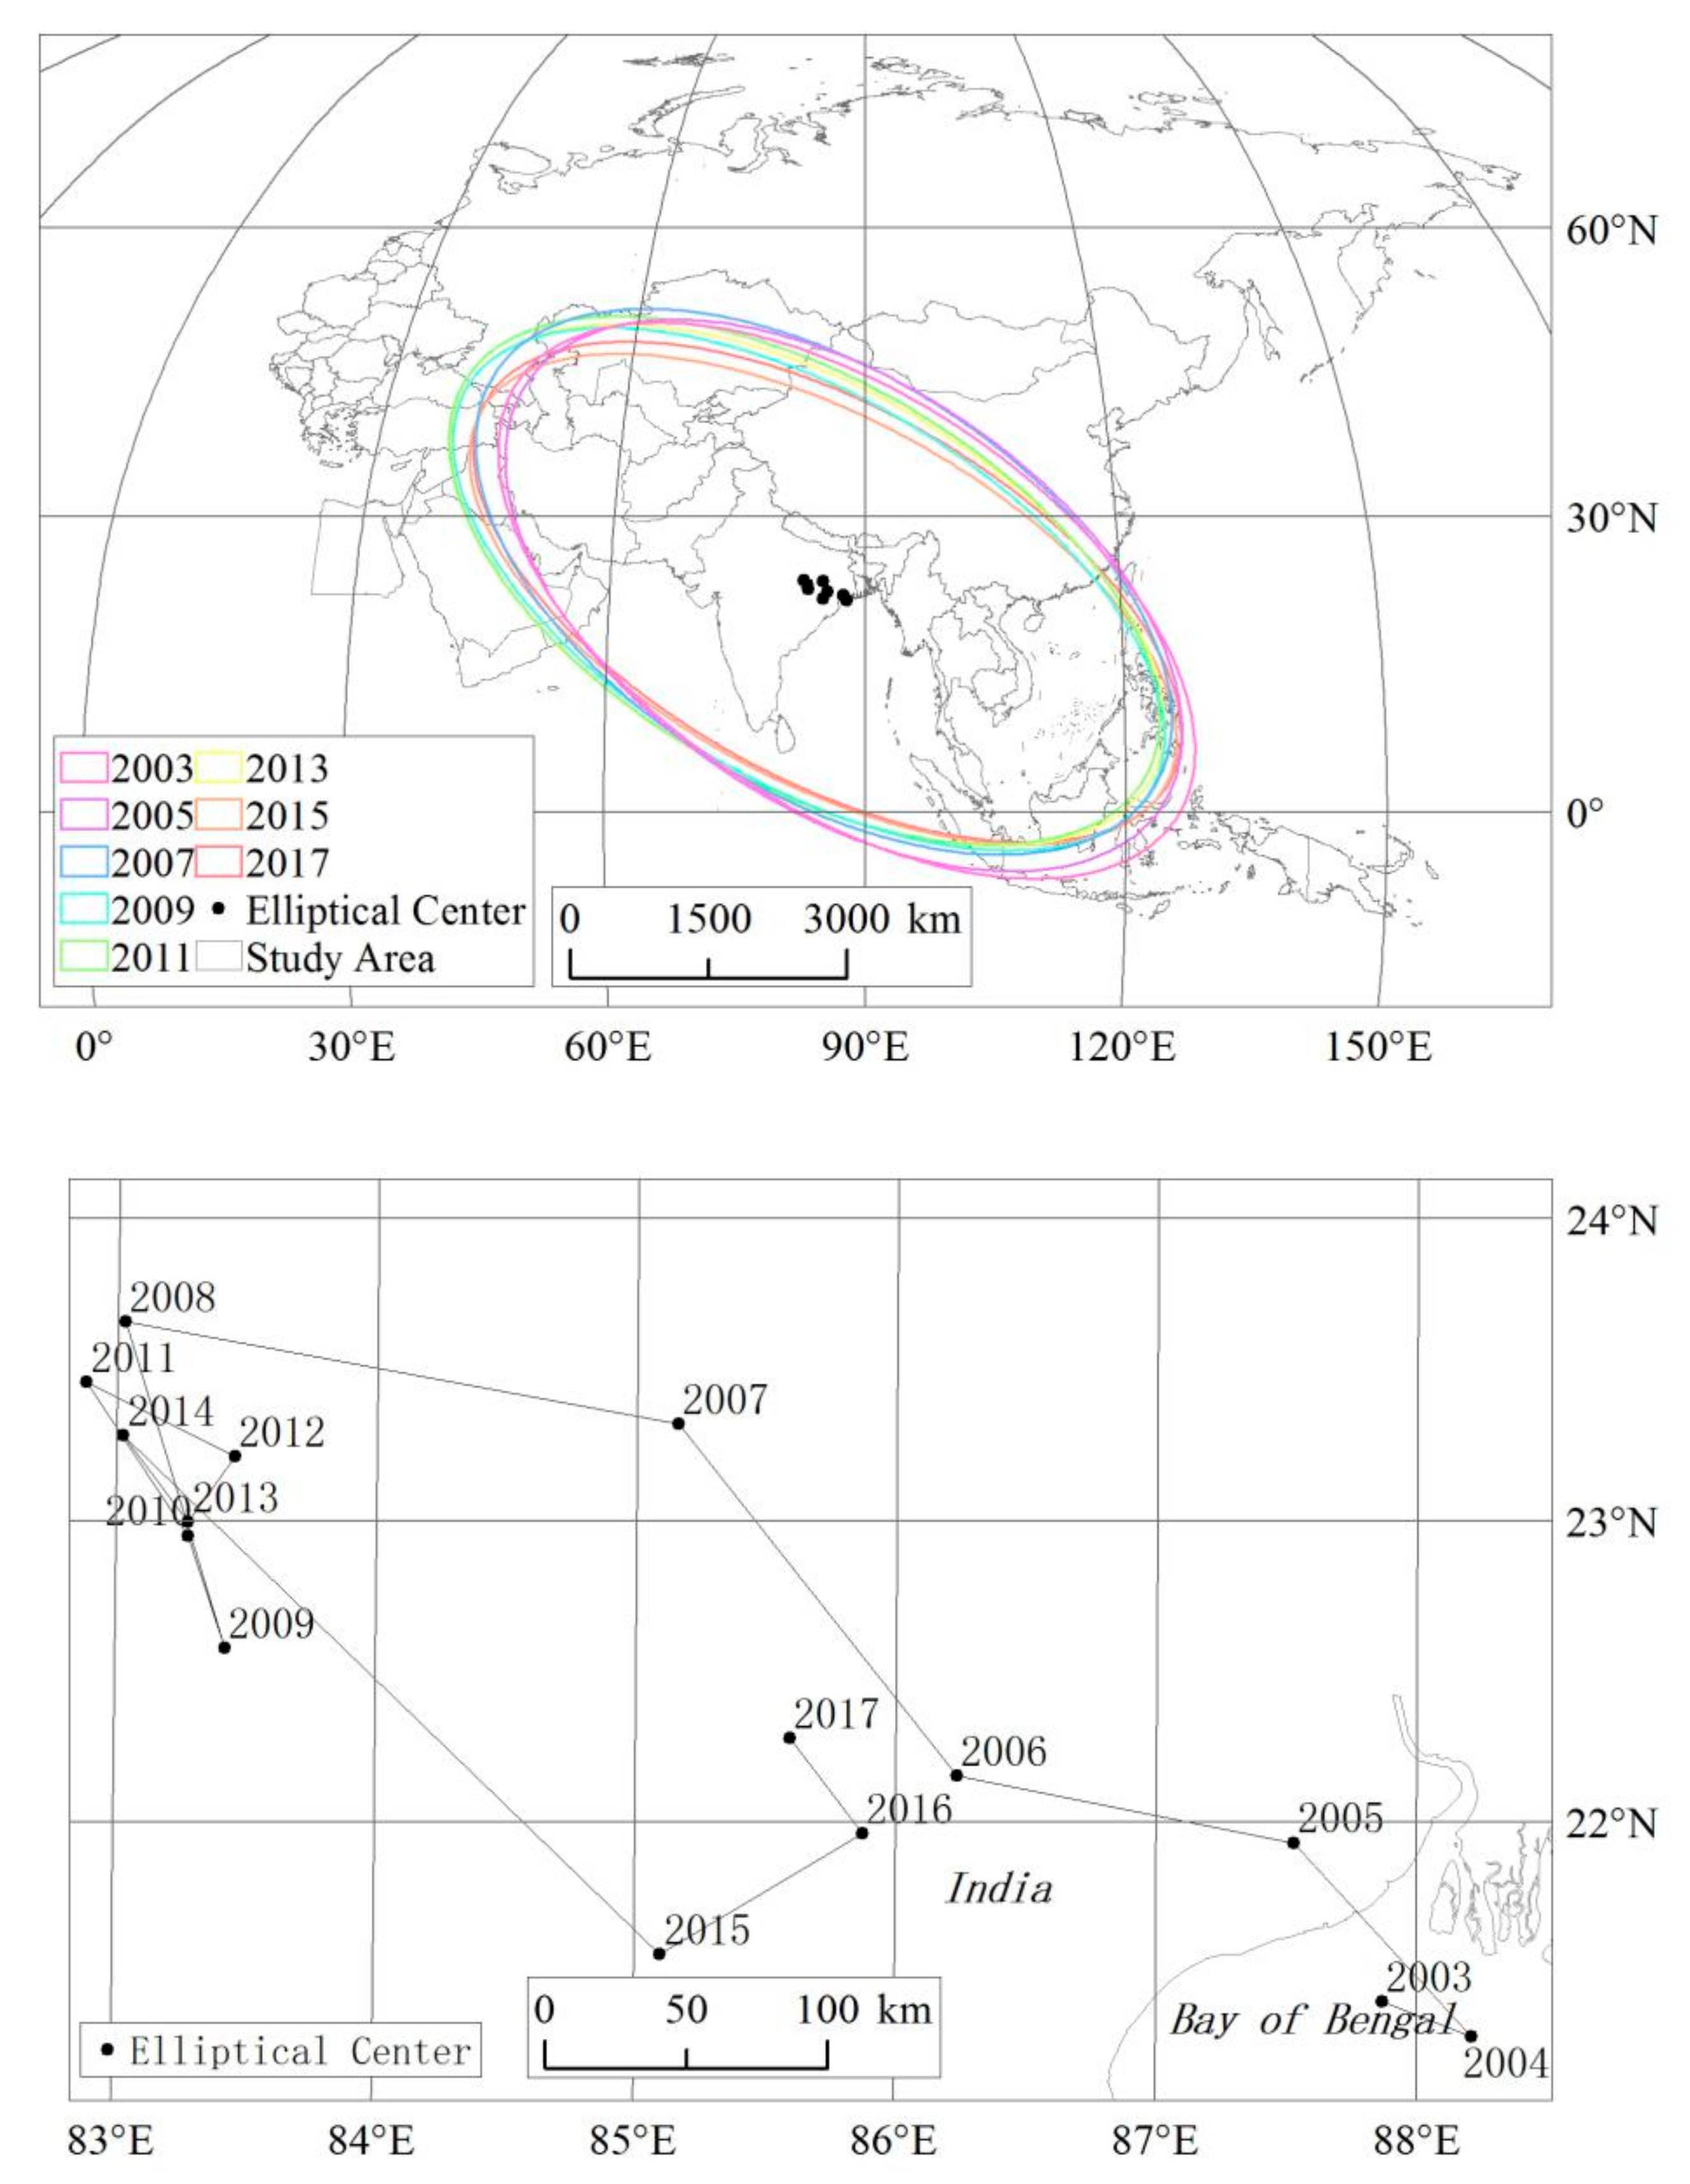
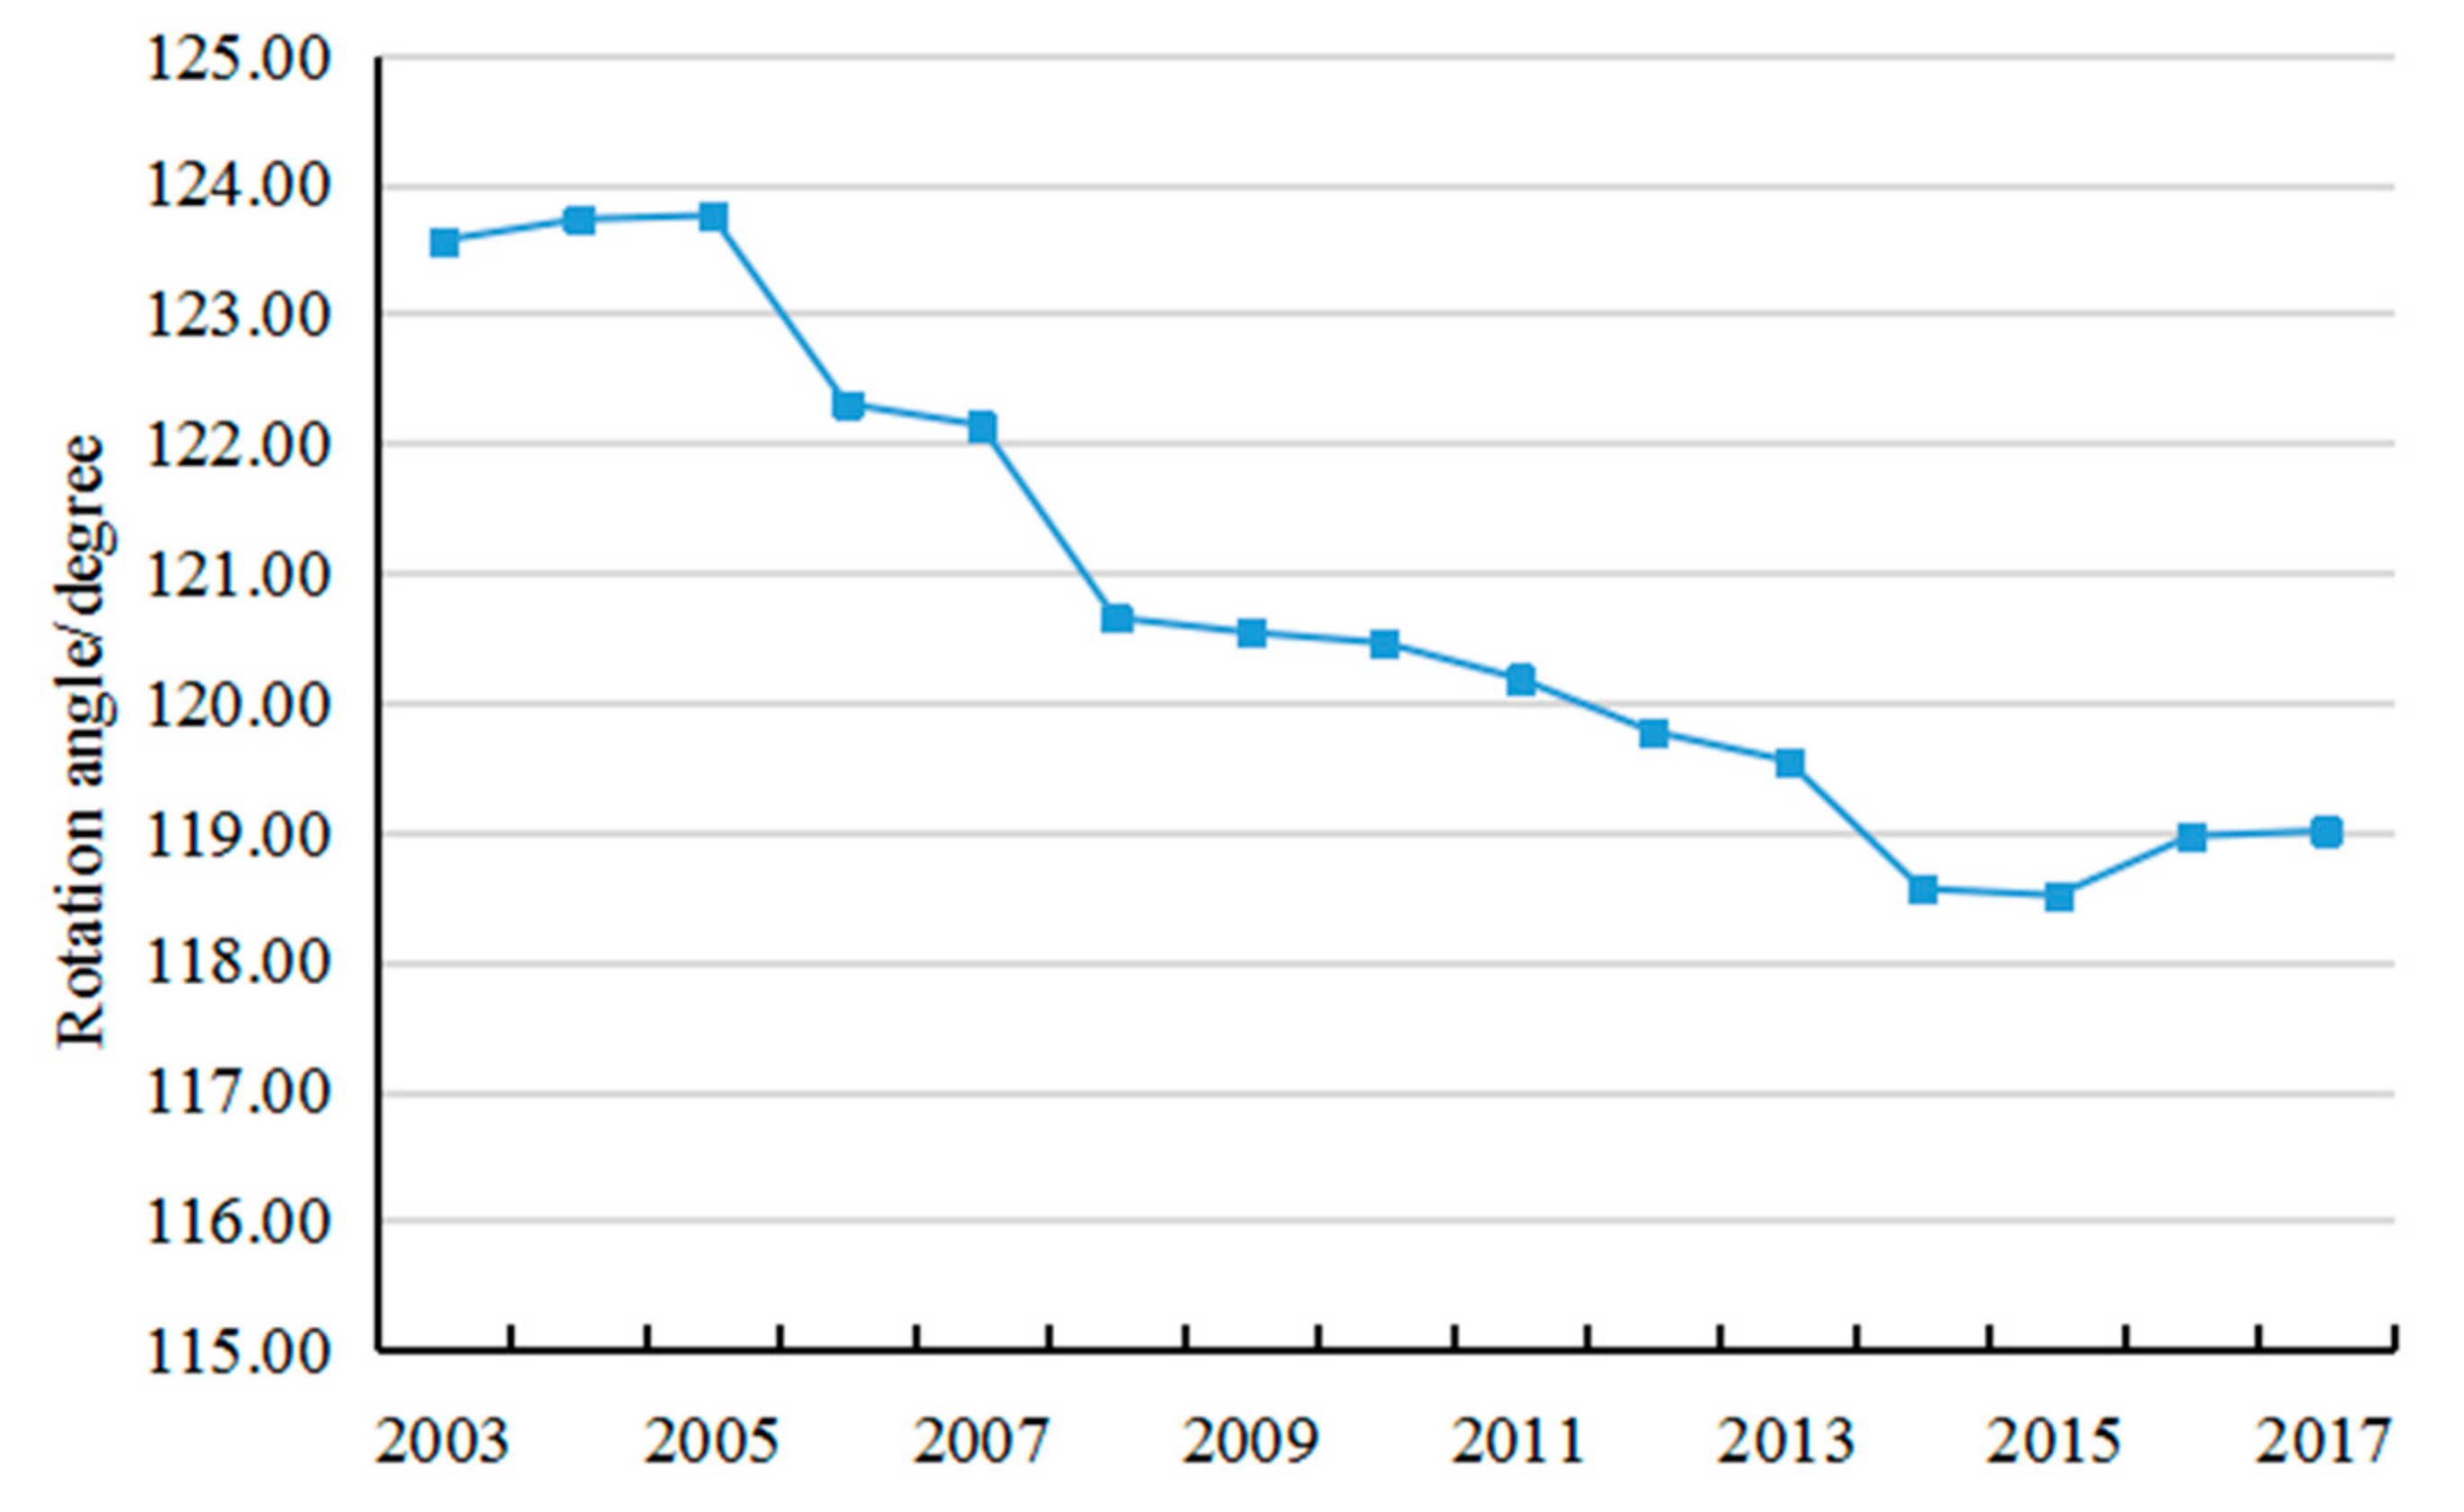
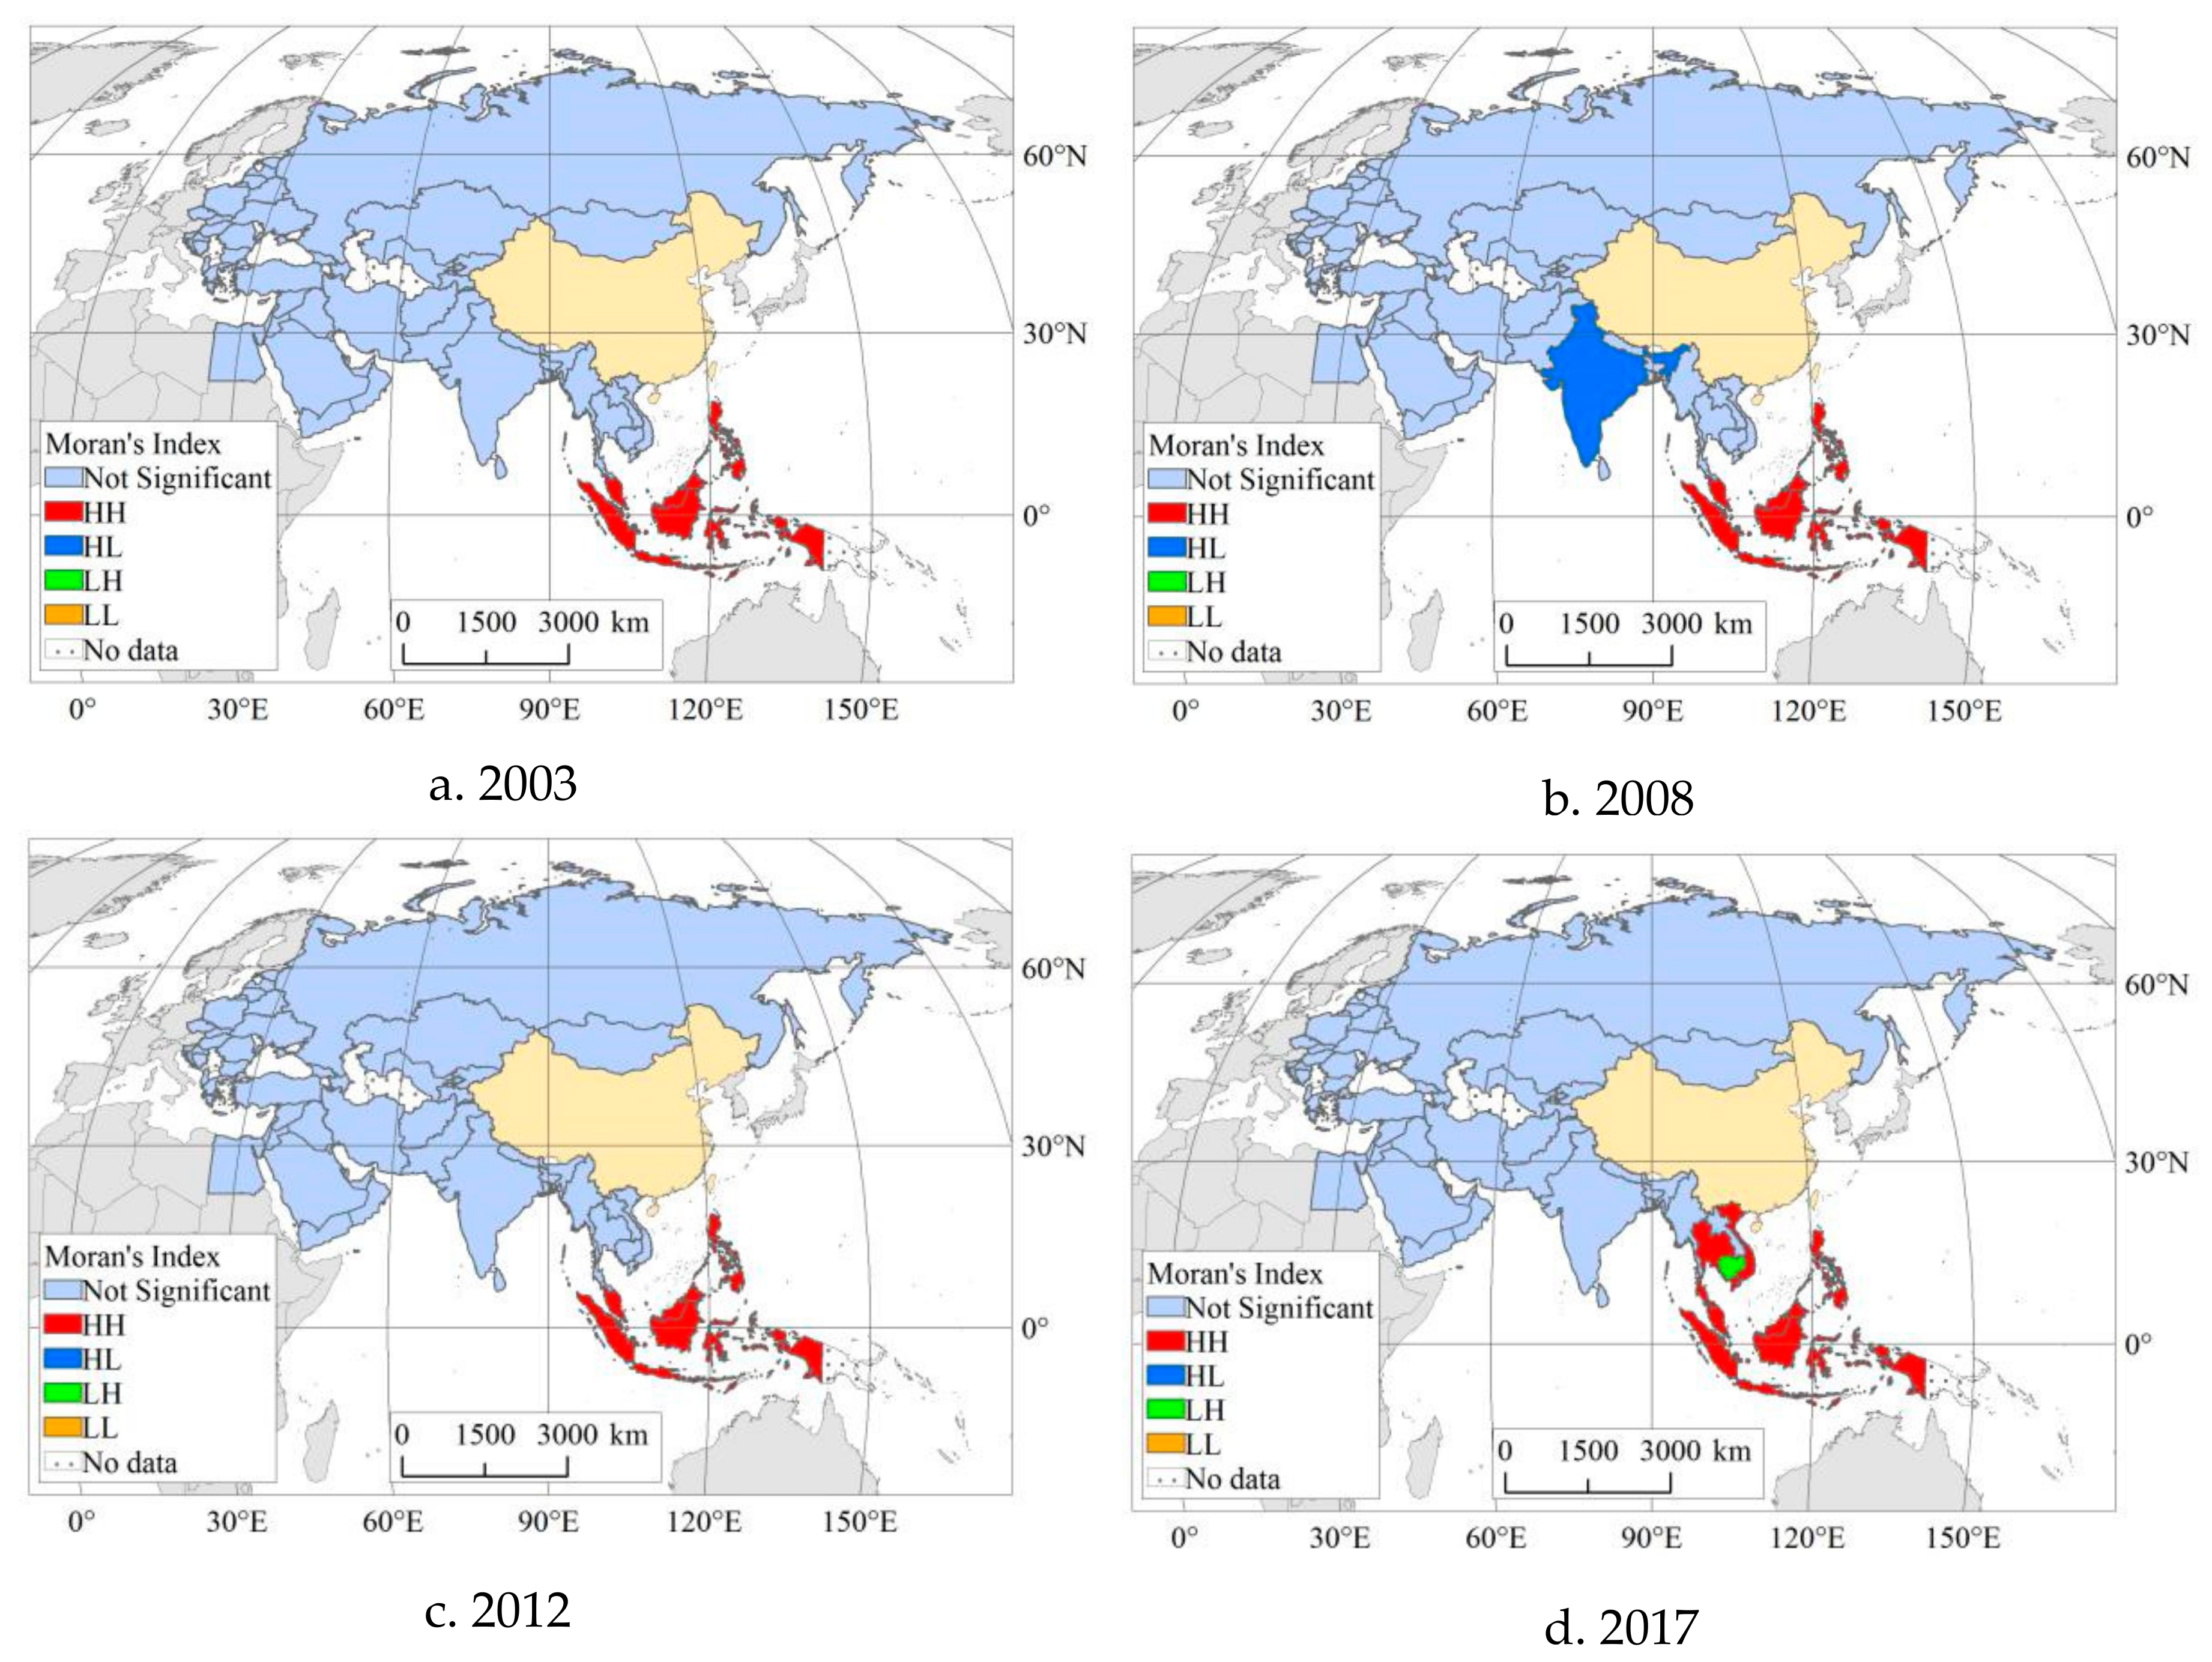
This paper constructs a geo-economic model to measure the geo-economic relations between China and the countries along the Belt and Road. It was found that the geo-economic flow between China and these countries increased, and the geo-economic relations between China and these countries continued to improve. The trade flow was much larger than the investment flow, and the trade flow was dominant in the geo-economic relations between China and the countries along the Belt and Road. The geo-economic relations between China and these countries mainly depended on trade flow. The development of geo-economic relations between China and these countries was not balanced. Russia, India, Saudi Arabia, and other regional powers had large geo-economic flow, and they played an important role in the region. The geo-economic flow between China and Southeast Asian countries grew rapidly, and the bilateral geo-economic relations increased rapidly. The standard deviational ellipse analysis of geo-economic flow between China and the countries along the Belt and Road Initiative showed that the geo-economic center of gravity of China and countries along the Belt and Road was moving in the northeastern part of India and it first moved to the northwest and then moved to the southeast. China’s geo-economic space had obvious core-peripheral structure characteristics, and Southeast Asia is the core area of China’s geo-economic space. China’s geo-economic space presents a northwest-southeast pattern in the direction. The spatial autocorrelation analysis of the geo-economic flow between China and the countries along the Belt and Road Initiative showed that there was a significant, positive spatial autocorrelation. There was a spatial agglomeration feature of geo-economic flow of similar size. The spatial agglomeration of geo-economic flow between China and countries along the Belt and Road occurred in a few areas and the overall spatial agglomeration was weak. The geo-economic flow agglomerations of China and the countries along the Belt and Road Initiative mainly occurred in Southeast Asia, and the main agglomeration type was high-high. The geo-economic activities of China and Southeast Asia had a certain spatial spillover effect.
According to the space of flows theory, the “space of flows” can shape the “space of place” and the “place of space” can also shape the “space of flows” [45]. Modern information and communication technology have made the flow of elements in the space of flow more frequent. The role of the space of flow network consisting of stream elements, nodes, element flows, and networks in global economic activities is constantly strengthening. Entering the 21st century, geo-economic element flow is more frequent and changeable than ever. Trade flow and investment flow between countries are becoming even greater, the global trade network is continuously deepening, and the international investment network is becoming more complex. Geo-economic activities are changing from the space of place to space of flows. Geo-economic flow has become the key to developing geo-economic relations. The development of geo-economic flow is not only driving the development of geo-economic relations, but also shaping the network of geo-economic relations between countries. Therefore, analyzing geo-economic relations between countries requires more attention to geo-economic flow.
As geopolitical status continues to increase, geo-economic relations have become more difficult to grasp. How to scientifically quantify the geo-economic relations between countries is an urgent problem to be solved through geo-economic research. In order to solve this problem, this paper takes the space of flow theory as a guide and constructs a geo-economic flow model to analyze geo-economic relations. On the one hand, the space of flow theory is introduced into the study of geo-economic relations, which expands the application of the space of flow theory. On the other hand, this paper proposes to analyze geo-economic relations from the perspective of geo-economic flow, which provides new an approach for the study of geo-economic relations. The geo-economic flow analysis of China and the countries along the Belt and Road confirmed that the geo-economic flow model is an effective method to describe geo-economic relations. The geo-economic flow model not only quantifies the degree of development of geo-economic relations between China and the countries along the Belt and Road but also identifies the imbalance in the development of geo-economic elements flow between China and the countries along the Belt and Road, providing a basis for decision making to deepen the geo-economic development of China and the countries along the Belt and Road. Through the geo-economic flow measurement of China and these countries, we found that the geo-economic relations between countries is determined by the size of the geo-economic flow between the two sides. Geo-economic flow that is too much or too little on one side can exacerbate the imbalance in the development of geo-economic relations and cause friction and contradiction among countries in the geo-economy. The geo-economic flow model objectively explains that the maintenance of geo-economic relations requires bilateral joint promotion and balanced development. Trade flow, investment flow and other geo-economic element flow occur between different countries, forming an enormous geo-economic network. The more fully developed the geo-economic flow is, the more stable the geo-economic network among countries and the more stable the geo-economic relations among countries. Therefore, only by promoting full development can we build a solid geo-economic flow network and guarantee the sustainable development of geo-economic relations.
In the promotion of the Belt and Road Initiative, China established the Asian Infrastructure Investment Bank, invested in infrastructure and built overseas industrial parks, causing China’s investment in countries along the Belt and Road to continue to increase. China signed and upgraded free trade agreements, established pilot free trade zones and promoted cross-border e-commerce cooperation, causing China’s imports and exports with countries along the Belt and Road to continue to rise. China has optimized its business environment, reduced tariffs and relaxed restrictions on foreign investment to attract foreign investment. These measures led to an increase in geo-economic flow between China and the countries along the Belt and Road, and a geo-economic network system was initially established. With the increase in geo-economic flow and the establishment of geo-economic network, the constraints of geographic distance on the geo-economic development of China and the countries along the Belt and Road are reduced. Geo-economic relations between China and these countries will move toward a new, better era. Affected by the level of social and economic development and investment location, the inflow and outflow of investment flow were relatively small in the areas along the Belt and Road. Most of these countries are developing countries, with the exception of some such as Singapore, Greece, and Lithuania. The economic development of developing countries need substantial funds and their overall overseas investment is relatively small. In 2017, the flow of outward investment from developing economies accounted for 26.63% of global outward foreign direct investment flow. In terms of attracting foreign investment, developed countries, such as the United States, France, and the Netherlands, and emerging economies, such as China, Brazil, and India, are favored by foreign direct investment. Many countries along the Belt and Road are not the main targets of foreign direct investment. In 2017, the foreign direct investment inflow of 56 countries along the Belt and Road (except for China) accounted for only 22.26% of global foreign direct investment inflow, rendering the investment flow in the areas along the Belt and Road much smaller than the trade flow, and the investment flow network is relatively fragile. To further upgrade China’s investment network between China and countries along the Belt and Road, China should maintain investment in the areas along the Belt and Road, innovate investment and financing models, expand financing channels and strengthen financial cooperation with countries along the Belt and Road. The size of trade flow and investment flow is closely related to gross domestic product, market size, resource endowment, geographic location, etc. [30,46]. These factors give India, Russia, Saudi Arabia, Singapore and other regional powers a unique advantage in developing geo-economics with China. India has a large population, a vast market, and the largest gross domestic product in South Asia. In addition, the scale of China–India geo-economics is relatively large. Russia and Saudi Arabia are China’s most important energy partners, as well as important export markets and investment destinations for China. Singapore is a hub country on China’s energy channel and an import and export channel. China and Singapore have large import and export trade and frequent geo-economic cooperation. Since 2013, Singapore has been China’s largest source of foreign investment, and its investment scale in China is huge. These advantages cause India, Russia, Saudi Arabia, Singapore and other regional powers to have larger geo-economic flow and higher geo-economic status. Countries with high geo-economic status have greater influence in the region. Maintaining good geo-economic relations with countries with high geo-economic status is key to developing the geo-economy. In the process of developing the geo-economy, China should attach importance to regional powers, strengthen geo-economic cooperation with regional powers, and actively optimize geo-economic relations with regional powers.
Southeast Asia is geographically close to China and has a connected culture. Southeast Asia is China’s premier region for foreign investment and trade. The resources and industrial structure of Southeast Asian countries are highly complementary to China. A large number of Southeast Asian agricultural and mineral products are exported to China, and a large number of Chinese labor-intensive industries are transferred to Southeast Asia. The construction of the China-ASEAN Free Trade Area has reduced tariffs, expanded the market, and improved the convenience of investment and trade, promoting the rapid development of geo-economics between China and Southeast Asian countries. In 2017, the China–ASEAN trade volume reached 514.82 billion dollars. China has become the largest trading partner of ASEAN. ASEAN has become China’s third-largest trading partner, the fourth largest export market and the second-largest source of imports. China is the third-largest source of foreign direct investment in ASEAN. In 2017, China’s investment flow to ASEAN countries reached 14.119 billion dollars. Therefore, the geo-economic development of China and Southeast Asian countries is faster than that of other regions, and Southeast Asia has become the core of China’s geo-economic space. The area along the Belt and Road is an enormous geographical space. Different geo-economic development conditions in various countries promote the imbalance in geo-economic development, and the spatial differentiation of geo-economic flow is obvious. Therefore, the overall spatial autocorrelation is low. However, the geo-economic development conditions in the same region are relatively similar, and geo-economic flow in the same area are also close in size, leading to the agglomeration of geo-economic flow in individual regions being very obvious. China and Southeast Asia have superior geo-economic development conditions. The geo-economic flow of Singapore, Malaysia, Thailand, Indonesia, Vietnam, the Philippines and China have been large for a long time and have formed a significant, high-value agglomeration in geographical space, rendering the local spatial autocorrelation of Southeast Asia very obvious. In light of the important geo-economic status of Southeast Asia for China, China should regard Southeast Asia as a key area for the Belt and Road Initiative. China should upgrade China’s Southeast Asian geopolitical network by increasing investment in Southeast Asia, consolidating trade with Southeast Asian countries, and deepening geo-economic cooperation with Southeast Asian countries.
Geo-economic flow includes trade, investment, tourism, information, and many other flow elements. As tourism flow and information flow data are difficult to obtain and trade and investment are the most important elements of geo-economic cooperation, this study mainly evaluated the geo-economic relations between China and the countries along the Belt and Road based on trade flow and investment flow. However, the evaluation results might be slightly different from a geo-economic relations evaluation that includes more geo-economic elements, such as tourism flow and information flow. Gross domestic product, market size, resource endowment and geopolitical relations will influence the development of geo-economic relations. This study lacks a more profound discussion of the influence degree of geo-economic relations factors and influence mechanisms. In the future, we should strengthen the analysis of influencing factors of geo-economic relations and influencing mechanisms. In addition, this paper does not refer to geo-economic network analysis. Geo-economic network analysis can help us accurately identify the status of each country in the geo-economic network and the structural characteristics of the geo-economic network. Therefore, we should pay more attention to the study of geo-economic network in the future.

Author Contributions

Conceptualization, W.H. and Y.G.; methodology, W.H.; formal analysis, W.H.; data curation, W.H. and Q.D.; writing—original draft preparation, W.H.; writing—review and editing, Y.G.; Y.H.; and S.W.; S.Y.; visualization, Q.D.; supervision, Y.G. All authors have read and agreed to the published version of the manuscript.

Funding

This research was funded by the National Natural Science Foundation of China (Grants No.41871128, 41701133) and National Social Science Foundation of China (Grants No. 16ZDA041).

Conflicts of Interest

The authors declare no conflict of interest.

References

  1. National Development and Reform Commission; Ministry of Foreign Affairs; Ministry of Commerce of China. Vision and Actions on Jointly Building Silk Road Economic Belt and 21st-Century Maritime Silk Road; Foreign Languages Press: Beijing, China, 2015.
  2. The Office of the Leading Group for Promoting the Belt and Road Initiative. The Belt and Road Initiative: Progress, Contributions and Prospects. 2019. Available online: http://www.xinhuanet.com/2019-04/22/c_1124400071.htm (accessed on 22 April 2019).
  3. Liu, W.D. Scientific understanding of the Belt and Road Initiative of China and related research themes. Prog. Geogr. 2015, 34, 538–544. (In Chinese) [Google Scholar]
  4. Zhong, F.T. Beyond the myth of geopolitics: China’s new Asia strategy. In Looking for a Road; Brill: Leiden, The Netherlands, 2017; pp. 38–53. (In Chinese) [Google Scholar]
  5. Wu, Z.L. Functional logic of the Belt and Road Initiative: A new interpretation based on geo-economic. World Econ. Polit. 2018, 9, 128–153. (In Chinese) [Google Scholar]
  6. Jacob, J.T. China’s Belt and Road Initiative: Perspectives from India. China World Econ. 2017, 25, 78–100. [Google Scholar] [CrossRef]
  7. Dellios, R. Silk Roads of the twenty-first century: The cultural dimension. Asia Pac. Policy Stud. 2017, 4, 225–236. [Google Scholar] [CrossRef]
  8. Brown, K. The Belt and Road: Security dimensions. Asia Eur. J. 2018, 16, 213–222. [Google Scholar] [CrossRef] [Green Version]
  9. Blanchard, J.M.F.; Flint, C. The geopolitics of china’s maritime silk road initiative. Geopolitics 2017, 22, 223–245. [Google Scholar] [CrossRef]
  10. Boffa, M. Trade linkages between the Belt and Road economies. Policy Res. Work. Pap. 2018. Available online: http://documents.worldbank.org/curated/en/460281525178627774/pdf/WPS8423.pdf (accessed on 13 January 2020).
  11. Du, J.; Zhang, Y.F. Does One Belt One Road initiative promote Chinese overseas direct investment? China Econ. Rev. 2018, 47, 189–205. [Google Scholar] [CrossRef]
  12. Larcon, J.-P. The New Silk Road: China Meets Europe in the Baltic Sea Region, a Business Perspective; World Scientific Publishing Company: Singapore, 2017. [Google Scholar]
  13. Irshad, M.S.; Xin, Q.; Arshad, H. One belt and one road: Does China-Pakistan economic corridor benefit for Pakistan’s economy? J. Econ. Sustain. Dev. 2015, 6, 200–207. [Google Scholar]
  14. Djankov, S.; Miner, S. China’s Belt and Road Initiative: Motives, Scope, and Challenges; Peterson Institute for International Economics: Washington, DC, USA, 2016. [Google Scholar]
  15. Kurecic, P. Geoeconomic and geopolitical conflicts: Outcomes of the geopolitical economy in a contemporary world. World Rev. Polit. Econ. 2015, 6, 522–543. [Google Scholar] [CrossRef] [Green Version]
  16. Stulberg, A.N. Moving beyond the great game: The geoeconomics of Russia’s influence in the Caspian energy bonanza. Geopolitics 2005, 10, 1–25. [Google Scholar] [CrossRef]
  17. Zhao, Y.B.; Liu, X.F.; Ge, Y.J. Analysis of the oil and gas resource distribution pattern along the Belt and Road and the interdependence relationship with China. Geogr. Res. 2017, 36, 2305–2320. (In Chinese) [Google Scholar]
  18. Zou, J.L.; Liu, C.L.; Yin, G.Q.; Tang, Z.P. Spatial patterns and economic effects of China’s trade with countries along the Belt and Road. Prog. Geogr. 2015, 34, 598–605. (In Chinese) [Google Scholar]
  19. O’Loughlin, J.; Anselin, L. Geo-economic competition and trade bloc formation: United States, German, and Japanese exports, 1968–1992. Econ. Geogr. 1996, 72, 131–160. [Google Scholar] [CrossRef]
  20. Iqbal, B.A.; Rahman, N.; Elimimian, J. The future of global trade in the presence of the Sino-US trade war. Econ. Polit. Stud. 2019, 7, 217–231. [Google Scholar] [CrossRef]
  21. Huotari, M.; Heep, S. Learning geoeconomics: China’s experimental financial and monetary initiatives. Asia Eur. J. 2016, 14, 153–171. [Google Scholar] [CrossRef]
  22. Yang, W.L.; Du, D.B.; You, X.J.; Shi, W.T.; Yan, Z.M. Network structure evolution and spatial complexity of global transnational investment. Sci. Geogr. Sin. 2017, 37, 1300–1309. (In Chinese) [Google Scholar]
  23. Wigell, M. Conceptualizing regional powers’ geoeconomic strategies: Neo-imperialism, neo-mercantilism, hegemony, and liberal institutionalism. Asia Eur. J. 2016, 14, 135–151. [Google Scholar] [CrossRef] [Green Version]
  24. Liu, Z.Y. Conflict or Cooperation? Geostrategic and Geo-economic Choices in the Indo-Pacific Region. Indian Ocean Econ. Polit. Rev 2014, 4, 4–20. (In Chinese) [Google Scholar]
  25. Scholvin, S.; Wigell, M. Geo-Economics as Concept and Practice in International Relations: Surveying the State of the Art; Finnish Institute of International Affairs: Helsinki, Finland, 2018.
  26. Baracuhy, B. The evolving geo-economics of world trade. Adelphi Pap. 2014, 54, 121–138. [Google Scholar] [CrossRef]
  27. Mattlin, M.; Wigell, M. Geoeconomics in the context of restive regional powers. Asia Eur. J. 2016, 14, 125–134. [Google Scholar] [CrossRef] [Green Version]
  28. Luttwak, E.N. The Endangered American Dream: How to Stop the United States from Becoming a Third World Country and How to Win the Geo-Economic Struggle for Industrial Supremacy; Simon & Schuster: New York, NY, USA, 1993. [Google Scholar]
  29. Yoon, S.H.; Lee, S.O. From old comrades to new partnerships: Dynamic development of economic relations between China and North Korea. Geogr. J. 2013, 179, 19–31. [Google Scholar] [CrossRef]
  30. Huang, Y.; Ge, Y.J.; Liu, X.F. Calculation of the geoeconomic relationships between China, the USA and Japan based on Coulomb force model. Acta Geogr. Sin. 2019, 74, 285–296. (In Chinese) [Google Scholar]
  31. Sato, T. Economic Relations between India and Japan. Eurasian Geogr. Econ. 2012, 53, 457–478. [Google Scholar] [CrossRef]
  32. Kerr, D. Problems in Sino-Russian economic relations. Eur.-Asia Stud. 1998, 50, 1133–1156. [Google Scholar] [CrossRef]
  33. O’Loughlin, J. Geo-economic competition in the Pacific Rim: The political geography of Japanese and US Exports, 1966–1988. Trans. Inst. Br. Geogr. 1993, 18, 438–459. [Google Scholar] [CrossRef]
  34. Habibi, N. Growth in economic relations of China and India with the GCC countries. Asia Pac. Econ. Lit. 2011, 25, 52–67. [Google Scholar] [CrossRef]
  35. Castells, M. The Rise of the Network Society; Blackwell: Oxford, UK, 1996. [Google Scholar]
  36. Taylor, P.J.; Derudder, B. World City Network: A Global Urban Analysis; Routledge: London, UK, 2004. [Google Scholar]
  37. Lu, D.D. Function orientation and coordinating development of subregions within the Jing-Jin-Ji urban agglomeration. Prog. Geogr. 2015, 34, 265–270. (In Chinese) [Google Scholar]
  38. Lefever, D.W. Measuring geographic concentration by means of the standard deviational ellipse. Am. J. Sociol. 1926, 32, 88–94. [Google Scholar] [CrossRef]
  39. Duncan, O.D. The measurement of population distribution. Popul. Stud. 1957, 11, 27–45. [Google Scholar] [CrossRef]
  40. Cromley, E.K.; Shannon, G.W. Locating ambulatory medical care facilities for the elderly. Health Serv. Res. 1986, 21, 499–514. [Google Scholar]
  41. Zhao, L.; Zhao, Z.Q. Projecting the spatial variation of economic based on the specific ellipses in China. Sci. Geogr. Sin. 2014, 34, 979–986. (In Chinese) [Google Scholar]
  42. Moran, P.A.P. Notes on continuous stochastic phenomena. Biometrika 1950, 37, 17–23. [Google Scholar] [CrossRef] [PubMed]
  43. Zheng, Z.; Liu, W.D.; Song, Z.Y.; Yeerken, W.; Liang, Y. The Belt and Road production networks and China’s participation. Prog. Geogr. 2019, 38, 951–962. (In Chinese) [Google Scholar]
  44. Liu, W.D.; Tian, J.C.; Ou, X.L. The “Belt and Road” Strategy Research; The Commercial Press: Beijing, China, 2017. [Google Scholar]
  45. Halbert, L.; Rutherford, J. Flow-place: Reflections on cities, commutation and urban production processes. GAWC Res. Bull. 2010. Available online: http://www.lboro.ac.uk/gawc/rb/rb352.html (accessed on 13 January 2020).
  46. Wang, S.F.; Xue, X.; Zhu, A.X.; Ge, Y.J. The key driving forces for geo-economic relationships between China and ASEAN countries. Sustainability 2017, 9, 2363. [Google Scholar] [CrossRef] [Green Version]
Figure 1. Changes in geo-economic flow between China and countries along the Belt and Road.
Sustainability 12 00816 g001
Figure 2. Spatial differentiation of geo-economic flow between China and countries along the Belt and Road (unit: 10,000 dollars).
Sustainability 12 00816 g002
Figure 3. The geo-economic center of gravity changes in China and countries along the Belt and Road.
Sustainability 12 00816 g003
Figure 4. Changes in the major and minor axes of the standard deviation ellipse of China’s geo-economic space.
Sustainability 12 00816 g004
Figure 5. Changes in rotation angle of the standard deviation ellipse of China’s geo-economic space.
Sustainability 12 00816 g005
Figure 6. Local indicators of spatial association map of geo-economic flow between China and countries along the Belt and Road.
Sustainability 12 00816 g006
Table 1. Countries in the Belt and Road Initiative area in this research.
RegionCountries
Mongolia and RussiaMongolia, Russia
Central AsiaKazakhstan, Uzbekistan, Kyrgyzstan, Tajikistan
Central and Eastern EuropePoland, Romania, Czechia, Slovakia, Bulgaria, Hungary, Latvia, Lithuania, Slovenia, Estonia, Croatia, Albania, Bosnia, Ukraine, Belarus, Cyprus, Greece
Southeast AsiaIndonesia, Thailand, Malaysia, Vietnam, Singapore, Philippines, Myanmar, Cambodia, Laos, Brunei
South AsiaIndia, Pakistan, Bengal, Afghanistan, Sri Lanka,, Nepal
West AsiaSaudi Arabia, United Arab Emirates, Oman, Iran, Turkey, Israel, Kuwait, Iraq, Qatar, Jordan, Lebanon, Bahrain, Yemen, Syria, Georgia, Azerbaijan, Egypt
Table 2. Geo-economic flow and their proportion of regional powers (unit: 10,000 dollars).
Countries20032005200720092011201320152017
Russia769,972.751,461,795.812,385,818.651,941,177.943,977,510.074,450,307.373,419,661.374,229,641.92
Russia’s share11.05%11.77%11.41%8.63%9.81%9.40%7.46%8.40%
Singapore964,483.451,678,501.742,405,079.182,538,970.693,610,182.454,095,347.094,634,484.124,475,356.32
Singapore’s share13.84%13.51%11.50%11.29%8.90%8.65%10.12%8.88%
Saudi Arabia333,318.31685,761.911,185,371.311,466,351.232,715,727.033,181,633.422,580,769.362,415,871.17
Saudi Arabia’s share4.78%5.52%5.67%6.52%6.70%6.72%5.63%4.80%
India377,160.03935,644.331,877,738.532,017,140.903,445,502.372,873,238.572,813,897.343,356,315.94
India’s share5.41%7.53%8.98%8.97%8.50%6.07%6.14%6.66%
Kazakhstan164,570.92338,192.41694,143.44700,068.661,219,892.031,424,440.29702,685.62869,648.82
Kazakhstan’s share2.36%2.72%3.32%3.11%3.01%3.01%1.53%1.73%
Table 3. Moran’s index of the geo-economic flow between China and countries along the Belt and Road.
YearMoran’s Indexp-ValueZ-Score
20030.194 ***0.00073.4004
20040.192 ***0.00083.3663
20050.185 ***0.00123.2362
20060.179 ***0.00183.1282
20070.164 ***0.00412.8674
20080.154 ***0.00702.6976
20090.172 ***0.00282.9931
20100.172 ***0.00292.9826
20110.171 ***0.00322.9460
20120.185 ***0.00163.1632
20130.195 ***0.00083.3399
20140.205 ***0.00053.4597
20150.213 ***0.00033.6137
20160.206 ***0.00053.5045
20170.196 ***0.00083.3679
Note: *** means significant at the level of 10%.

