Article

Co-Combustion of Waste Tires and Plastic-Rubber Wastes with Biomass Technical and Environmental Analysis

by
Luís Carmo-Calado
1,
Manuel Jesús Hermoso-Orzáez
2,*,
Roberta Mota-Panizio
3,
Bruno Guilherme-Garcia
1 and
Paulo Brito
1
1
VALORIZA—Research Center for Endogenous Resource Valorization, Polytechnic Institute of Portalegre, 7300-555 Portalegre, Portugal
2
Department of Graphic Engineering Design and Projects, Universidad de Jaen, 23071 Jaen, Spain
3
MEtRICs—Mechanical Engineering and Resource Sustainability Center, Department of Science and Technology of Biomass, Faculty of Science and Technology, Universidade NOVA de Lisbon, 2829-516 Lisbon, Portugal
*
Author to whom correspondence should be addressed.
Sustainability 2020, 12(3), 1036; https://0-doi-org.brum.beds.ac.uk/10.3390/su12031036
Submission received: 9 January 2020 / Revised: 27 January 2020 / Accepted: 29 January 2020 / Published: 1 February 2020
(This article belongs to the Special Issue Efficient and Non-polluting Biomass and Wastes Thermal Gasification)

Abstract

:
The present work studies the possibility of energy recovery by thermal conversion of combustible residual materials, namely tires and rubber-plastic, plastic waste from outdoor luminaires. The waste has great potential for energy recovery (HHV: 38.6 MJ/kg for tires and 31.6 MJ/kg for plastic). Considering the thermal conversion difficulties of these residues, four co-combustion tests with mixtures of tires/plastics + pelletized Miscanthus, and an additional test with 100% Miscanthus were performed. The temperature was increased to the maximum allowed by the equipment, about 500 °C. The water temperature at the boiler outlet and the water flow were controlled (60 °C and 11 L/min). Different mixtures of residues (0–60% tires/plastics) were tested and compared in terms of power and gaseous emissions. Results indicate that energy production increased with the increase of tire residue in the mixture, reaching a maximum of 157 kW for 40% of miscanthus and 60% of tires. However, the automatic feeding difficulties of the boiler also increased, requiring constant operator intervention. As for plastic and rubber waste, fuel consumption generally decreased with increasing percentages of these materials in the blend, with temperatures ranging from 383 °C to 411 °C. Power also decreased by including such wastes (66–100 kW) due to feeding difficulties and cinder-fusing problems related to ash melting. From the study, it can be concluded that co-combustion is a suitable technology for the recovery of waste tires, but operational problems arise with high levels of residues in the mixture. Increasing pollutant emissions and the need for pre-treatments are other limiting factors. In this sense, the thermal gasification process was tested with the same residues and the same percentages of mixtures used in the co-combustion tests. The gasification tests were performed in a downdraft reactor at temperatures above 800 °C. Each test started with 100% acacia chip for reference (like the previous miscanthus), and then with mixtures of 0–60% of tires and blends of plastics and rubbers. Results obtained for the two residues demonstrated the viability of the technology, however, with mixtures higher than 40% it was very difficult to develop a process under stable conditions. The optimum condition for producing a synthesis gas with a substantial heating value occurred with mixtures of 20% of polymeric wastes, which resulted in gases with a calorific value of 3.64 MJ/Nm3 for tires and 3.09 MJ/Nm3 for plastics and rubbers.

1. Introduction

For the development of a country, high investments are required for electric power generation. Seeking to meet this current demand and respecting the integration between man and nature, it is necessary to generate clean, renewable and efficient energy generation. The search for economic and social development must be linked to environmental preservation for sustainable development [1]. The depletion of fossil fuels is becoming a massive concern nowadays once increasing amounts of energy are required for the actual way of living implemented by society [2].
In industrialized countries, legislations seek the reduction and even banishment on the future use of landfills, since waste disposal is an environmentally critical situation looking for recycling alternatives incorporated into strategies oriented towards a circular economy [3]. As a way to reduce the amount of waste sent to landfills, recycling, recovery, and energy recovery are viable options [4].
Energy recovery from waste is the conversion of non-recyclable waste materials into useable heat, electricity, or fuel through a variety of processes such as, biochemical, chemical and thermochemical. The thermochemical processes are divided into pyrolysis, gasification, and combustion [5].
Waste that has combustible properties, when reuse and recycling are not possible, consideration should be given to the possibility of energy recovery before landfilling. In this context, wastes that have aggregate calorific value can be directly used as fuel or as raw material for fuel production [6]. Biomass is an interesting resource, capable of suppressing these needs once it has significant heating content and, therefore, may be converted into distinct energy forms contributing also to the alleviation of the well-known environmental issues associated with global warming [7,8]. Thermal gasification is characterized by partial oxidation at high temperatures, usually in the range from 800 to 1000 °C, which converts the biomass to a combustible gas mixture [9].
Thermochemical recuperation as an energy recovery technology by thermal conversion of combustible materials was discussed in different studies [10]. There are studies that suggest the process flow schematic of fuel-consuming equipment with thermochemical waste-heat recuperation by steam methane reforming with the addition of flue gas to the reaction mixture [11].
In 2017 in Europe, about 289 million tires were sold, which represents 20% of the world’s tire production [12]. This fact poses a serious challenge for manufacturers, users and environmental authorities, tire recovery and recycling have become a valuable and growing resource in the last decade. Used tires have high calorific value (29–39 MJ/kg) and are made up of about 90% of organic materials, so they are an excellent source of fuel [13]. The most common constituents of tires are natural rubber (14–27%), synthetic rubber (14–27%), fillers such as coal and silica (26–28%), plasticizers based on oils and resins (5–6%). In terms of elemental analysis, it is found that tires have sulfur (5–6%) and metals for reinforcement (16.5–25%) [13]. Other studies show that used tires have about 60% volatile matter, 30% fixed carbon, moisture contents less than 2% and about 7% of ash [14,15].
The best thermochemical option for waste tire disposal and energetic valorization is gasification using a mixture of preheated air and steam as the gasification agent [16]. Furthermore, it is important to comparatively study tires relative to coal and biomass, to observe tire gasification strengths and weaknesses as a feedstock for gasification [17]. Numerous studies have been performed on tire gasification, to help in offsetting their negative impact on the environment. According to a study [18], tires were thermochemically disposed of to reduce their environmental impact. The tires were gasified in a fluidized bed gasifier with the use of atmospheric air. The study concluded that having a lower Equivalence Ratio yielded higher LHVs, CH4, and H2 [19] Most tire gasification studies focus on steam gasification with crushed tire particles from 3mm to 5mm at a temperature of 600 °C to 800 °C. As the temperature increased, gas production increased from 0.21 m3/kg to 0.76 m3/kg, although the calorific value of the gas decreased from 39.6 to 22.2 MJ/m3 [20]. Leung [21] studied fluidized gasification processes of pulverized tires at temperatures from 350 °C to 900 °C. The results are that the main parameters for increasing the amount of gas and its calorific value are the equivalence ratio, the mass flow rate, and the particle size. For a flow rate of 11 m3/h, it was obtained a lower calorific value of 6 MJ/m3.
Later studies by Xiao [22] confirmed that increasing temperature and the equivalence ratio increases gas production. At 700 °C, the rise in the equivalence ratio from 0.2 to 0.6 increased the volume of gas produced by 5.5% and ash production decreased by 600 g/kg to 450 g/kg. Assays were performed in a laboratory fluidized bed reactor at temperatures of 400–800 °C. The amount of fixed carbon decreased with increasing temperature. The lower calorific value of the synthesis gas increased with temperature and decreased with increasing equivalence ratio linearly. The temperature below 600 °C and a high equivalence ratio facilitated rapid gasification. Temperatures above 600 °C decrease the production of tars. It was concluded that under operating conditions 650–750 °C and equivalence ratios of 0.2–0.4, the synthesis gas has calorific powers between 4 to 9 MJ/Nm3 with a production of 1.8 to 3.7 Nm3/kg. Another interesting aspect of gasification is the production of charcoals that can be applied, for example, in wastewater treatment processes. In this work coals with surface areas between 20 to 30 m²/g were produced.
The process of combustion of used tires its gaseous emissions are mainly influenced by the combustion temperature, excess oxygen inside the reactor and material particle size. Using thermogravimetric analysis, it was determined that there was an intense first phase of volatile combustion, followed by a less intense combustion phase with simultaneous burning of volatiles and coals and that the burning times are considerably shorter than coal [23]. Fluidized bed tests are the most efficient in the waste management process. However, it is a more expensive technology with high operating and maintenance costs and requires considerable preparation of the material to be processed. Combustion in rotary kilns allows the burning of remnants of tires of varying particle sizes and relatively low operating costs, including the implementation of particulate filtration and emission control technologies. One of the concerns of this process has been the environmental impacts resulting from the formation of polycyclic aromatic hydrocarbons (PAH) [24]. The type of reactor used in the combustion process largely influences toxic gas emissions.
Several studies comparing emissions from the combustion of used tires with charcoals found that NOx emissions from tires are 3 to 4 times lower than those obtained with charcoals. The same has been observed for SO2 emissions. CO and PAH showed higher tire burn concentrations than coal, but the amount of indirect PAH compounds is similar in both materials. On the other hand, several studies present the co-combustion of used tires with coal as an efficient way of energy recovery of this waste with low gas emissions [25]. Other studies have proposed co-combustion of coal and pulverized tires to reduce CO2 emissions, thereby mitigating emissions and solving the tire problem as waste. Nimmo et al. [26] studied direct burn in co-combustion of pulverized tires and coal in a pilot plant and achieved an 80% reduction in NOx emissions and how particle size influences emissions by determining that with 25 μm achieved an 80% reduction in NOx emissions.
Kandasamy and Gökalp studied how to recover energy from tires. They performed pyrolysis, combustion and gasification tests. The gasification and combustion tests were carried out in an atmosphere of oxygen and steam, respectively. For the thermal gasification studies, they concluded that the complete conversion of the tires occurred only at 950 °C when it presented isothermal conditions in a steam environment. The main products were detected, such as CO2, CO, H2, which indicates the occurrence of oxidation reactions. During the combustion process, it was possible to detect the emission of the main gases, CO and CO2, in addition to the emission of some hydrocarbons. Both for gasification and combustion, it was possible to detect the emission of sulfur, which generated coals with the presence. They concluded that despite the emissions and the presence of sulfur in the coals, the use of tires as an energy resource is viable [27].
Another worldwide problem is the production of plastics and rubber, which achieved 36 Mton. The energy recovery of this waste has been carried out through the incineration process and in cement kilns. Plastics can reach a calorific value higher than 40 MJ/kg due to high carbon and hydrogen contents, and low ash contents. However, the possible emission of toxic compounds, such as chlorine, hydrogen chloride, phosgene, benzene and its derivatives, ammonia, and hydrogen cyanide, as well as formic acid, formaldehyde, phenol, and polychlorinated dioxins and furans, is one of the main objections to the energetic recovery of plastic waste. Therefore, because of the risk of harmful emissions during combustion, polyvinyl chloride (PVC), polyurethane (PUR), methyl polymethacrylate (PMMA), polyamide (PA), and phenol-formaldehyde (PF), require special attention in the selection of the combustion or gasification technology, and the cost of investment is a significant aspect for the decision [28].
For producing high-quality H2-rich syngas from biomass and plastic wastes, the gasification system is considered a suitable route [29]. Refuse Plastic Fuel l (RPF), and wood pellets were tested in an air-blown Fluidized Bed Gasifier (FBG) for syngas utilization in a GE (Gas engine). With temperatures ranging from 700 °C to 940 °C and varying Equivalence Ratios (ER) of 0.3–0.5, some of the most important product gas characteristics were analyzed, including the Lower Heating Value (LHV) and tar concentration levels. Gas composition results revealed that the concentration tendencies varied for the product gases CO, H2, and hydrocarbons, depending on the feedstock type, whereas the same tendencies were observed for CH4 and tar concentrations [30]. The biomass/plastic pellets are promising in hydrogen yield even they show a higher fine elutriation rate and tar generation. The use of biomass/plastic pellets in a catalyst bed yielded good results in terms of the hydrogen concentration (up to 32% vol.), even if an increase in tar production and in the fine/carbon elutriation rate was observed in comparison with wood pellets. vol.), even if an increase in tar production and in the fine/carbon elutriation rate was observed in comparison with wood pellets [31]. Some scientific works consider the scheme of fuel-consuming equipment with a thermochemical heat recuperation system by using ethanol steam reforming. The main concept of thermochemical recuperation (TCR) is the transformation of exhaust gases heat into the chemical energy of a new synthetic fuel that has higher calorimetric properties such as low-heating value. Thermochemical recuperation can be considered as an on-board hydrogen production technology [32].
Most plastic gasification studies are on co-gasification. Ahmed and Gupta [33] studied the characteristics of gas produced in gasification and pyrolysis of plastic samples also containing rubber, between 800 °C and 900 °C. Gasification results showed significant hydrogen production at any temperature. Gasification showed a hydrogen production five times higher than that obtained in the pyrolysis process at 800 °C and seven times higher than 900 °C. The comparison of rubber gasification with forest biomass presented similar results. Rubber produced a greater amount of synthesis gas than forest biomass. These results suggest an important role for the co-gasification of plastics of biomass and rubber additions when working at high temperatures. Kaewluan and Pipatmanomai [34] conducted co-gasification studies of forest biomass in a 100 kWth fluidized bed gasifier. Increasing moisture in the biomass has been found to cause a decrease in bed temperature, with such temperature drop having consequences on the quality and quantity of gas produced by negatively affecting the balance of gasification reactions. Gasification and carbon conversion efficiency decreased from 20% to 10%, while humidity increased from 9.5% to 22.5%. By adding 20% (% as percentage by weight) of rubber to forest biomass with a humidity of 27%, the reactor temperature rose by about 70 °C. In other words, adding rubber to biomass is a more effective process than simply drying up to 9.5% biomass. Besides, the addition of rubber is an important factor in promoting the Boudouard reaction, with increasing CO and decreasing CO2.
In another work, Arena [35] did the study of gasification using different chemically and thermally stable mixtures of plastics in a pilot installation of 400 kW at temperatures between 840 °C and 930 °C, a temperature range that allows a good carbon conversion. The synthesis gas produced presented superior calorific power of the order of 6 MJ/Nm3, values that refer to being of quality to produce electric energy in commercial engines, namely, Otto engines or gas turbines. In the case of gas turbines, their economic viability will only be ensured using complex synthesis gas cleaning and purification systems. Modeling studies of the water vapor gasification process at temperatures in the order of 1000 °C, had relevant results, estimating the obtaining of synthesis gas with a lower calorific value of the order of 8 MJ/Nm3 for plastic and 11 MJ/Nm3 for rubber. As would be expected when using water vapor at such temperatures, hydrogen is the largest gas, about 50% to 60% of the volume of gas produced. The main difference between water vapor gasification and gasification using air as an oxidizing agent is the percentage of hydrogen relative to carbon monoxide in syngas; in the case of water vapor gasification, the percentage of hydrogen in the syngas is twelve times greater than carbon monoxide. Instead, in the case of gasification with air, the percentage of these two compounds is more or less the same. Likewise, the calorific value of the gas produced in water vapor gasification is twice as high, since there is no nitrogen in the syngas and the percentage of hydrogen increases substantially [36].
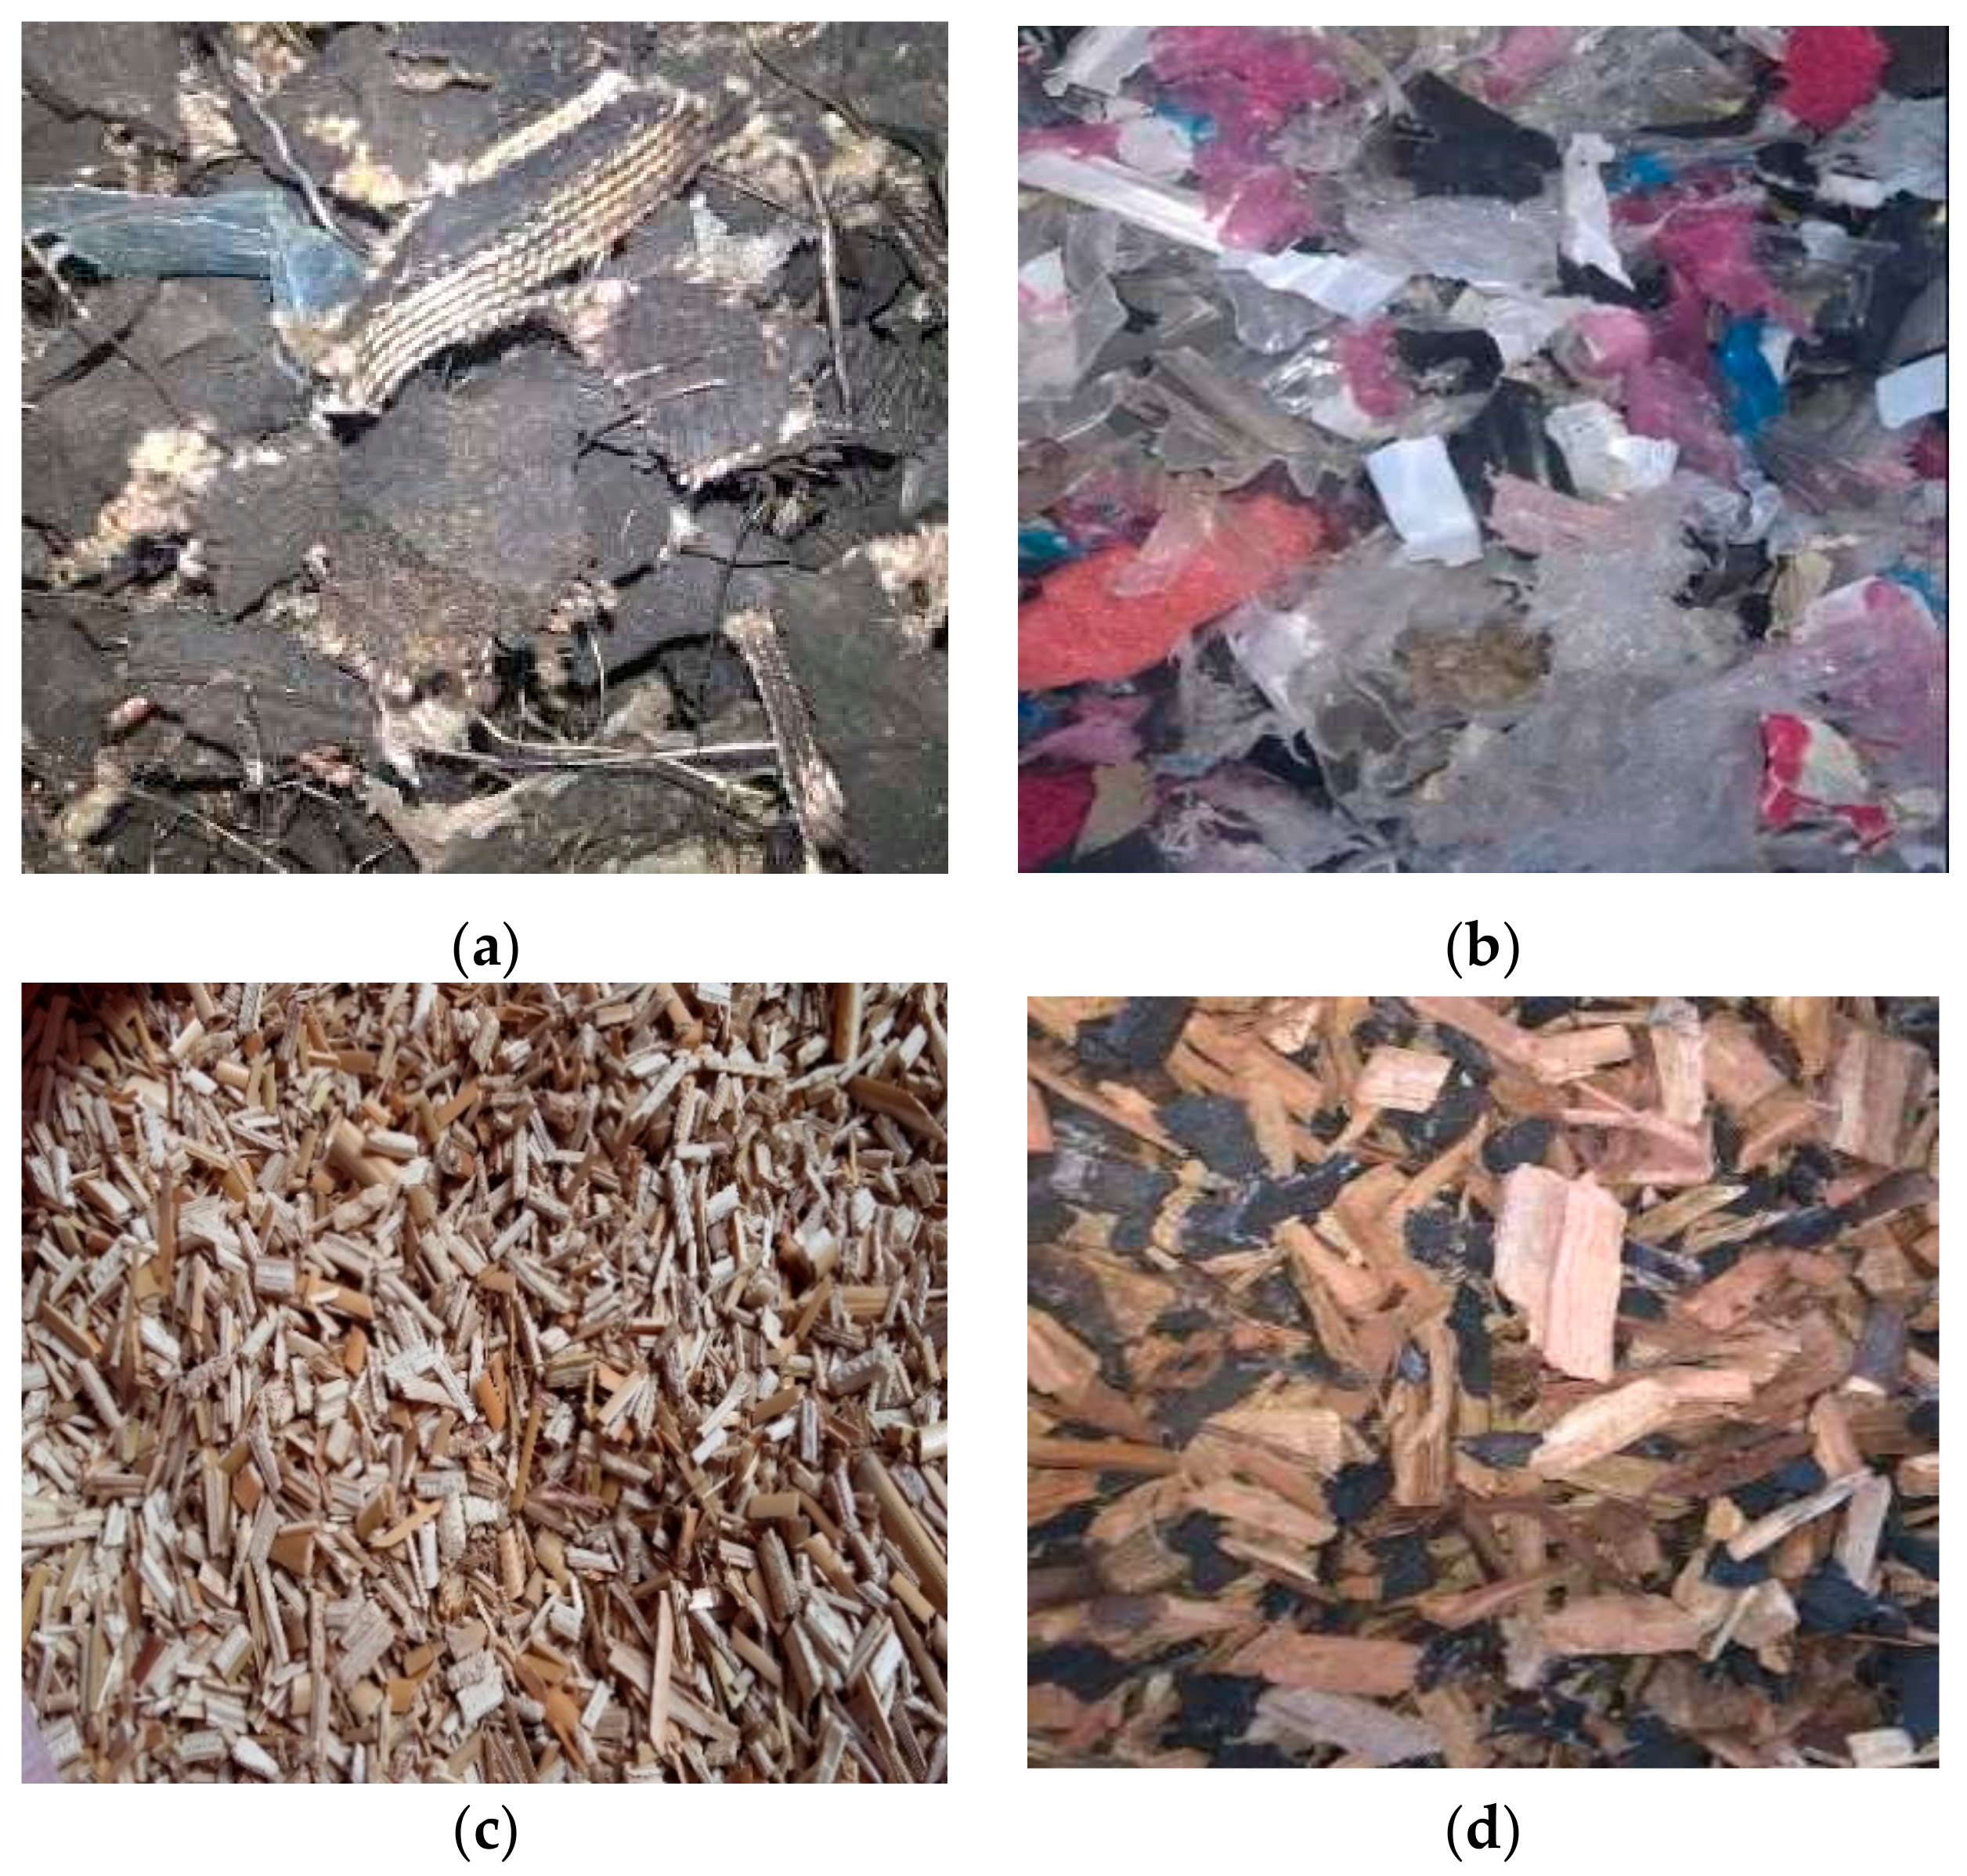
This work is aimed to study the energy recovery of tires and rubber-plastic mixed with biomass through combustion and gasification, and to determine the optimum conditions for both processes. Regarding the experiments, the tests were performed to observe the gaseous emissions at different thermal powers (66 kW and 157 kW) and temperatures (380 °C and 526 °C). Co-gasification was also tested to investigate the synthesis gas composition and its heating value at temperatures between 790 °C and 900 °C.

2. Materials and Methods

The gasification and combustion tests were performed with tires and a mixture of crushed plastic and rubbers waste from outdoor luminaires. Due to the difficulties of testing the experiments only with the waste, a mixture of this waste with forest biomass was carried out. (Figure 1).
The residues were analyzed in terms of higher heating value, ultimate analysis, and proximate analysis [37,38]. For the urban residues tested, mechanical screening was necessary for separating the fractions between 1–4 cm, obtaining the ideal size to be processed in both reactors. After sorting by size, manual sorting was carried out in order to remove metals that could damage the equipment.

2.1. Biomass Analysis

2.1.1. Ultimate Analysis

The ultimate analysis was carried out in order to determine the elemental composition of the biomass (C, H, N, S and O contents), using a ThermoFisher Scientific Flash 2000 CHNS-O Analyzer. (See Table 1) [39].

2.1.2. Thermogravimetric Analysis

The thermogravimetric analysis was used to determine the content of moisture, volatile matter and fixed carbon combined with ash [40]. The test was performed on a PerkinElmer STA 6000 (See Table 2) using a nitrogen flow of 20 mL/min for inert atmosphere and a temperature growth rate of 20 °C/min. The content of each type of matter was determined from the thermogravimetric profile (variation of sample mass versus temperature), taking into account the inflection points of the mass derivative as a function of time [41,42].

2.1.3. Higher Heating Value (HHV)

The calorific value was determined using a digital bomb calorimeter (model: IKA C 2000) [43] in which small samples were subjected to complete combustion in an adiabatic environment (Table 3).

2.2. Combustion Tests

The combustion tests were carried out in a multi-fuel pellet combustion boiler made of steel D’Alessandro Termomeccanica S.R.L. CS SMALL 45, with a pyro-tubular 3-pass system to conduct gases that posteriorly are used to produce hot water [44]. Built-in steel, with door for internal inspection and cleaning. Cast-iron burner with a mechanical feeding mechanism. Hopper for combustible material. Variable speed automatic feed screw and primary and secondary combustion air systems. Automatic fuel ignition control board (Figure 2). For each of the residues studied, co-combustion assays with miscanthus were performed. The process started with 100% pellets of miscanthus. Allowing the boiler to heat up to “steady-state conditions” (500 °C). During the tests, the boiler combustion temperature, air temperature and flow, inlet and outlet water temperature and water flow were constantly measured. Controlling only the set temperature to produce hot water at 60 °C in order to achieve near to “steady-state conditions” and then controlling the hot water flow in order to maintain these conditions until all the biomass in the hoper was consumed (the other variables are automatically controlled by the equipment). Then, mixtures with miscanthus and polymeric materials experimented. The percentage of the residue in the mixture was increased until it was technically possible to carry out the test. These were performed maintaining the water flux and its temperature.
The “power” produced by the boiler (Q) is given by:
Q = m Cp ΔT
Where Q is the amount of heat transmitted, m is the water flow, Cp is the specific heat of the water and ΔT is the temperature difference between the inlet and outlet water in the boiler.
Exhaust gas analysis was determined based on a flue gas analyzer connected to the boiler chimney.
The analyzer is equipped (Table 4), with 6 non-dispersive infrared (NDIR) sensors and 3 electrochemical sensors. A Madur Photon II gas analyzer was used to identify and quantify combustion exhaust gases O2, CO, CO2, NO2, SO2, H2S as well as pressure and temperature combustion parameters [45].

2.3. Gasification Tests

The gasification tests were performed on an AllPowerLabs PP20 Power Pallets [46] (Table 5)—a common downdraft reactor. The equipment consists of a storage silo, where the biomass is simultaneously dried by recirculating the hot gases produced in the reactor. Biomass is supplied from the top as the air moves downward, being preheated through contact with the walls of the reactor (Figure 3).
The tests started with 100% acacia chips at 800 °C until all the biomass in the hoper was consumed. Next, mixtures with acacia and 20% polymeric wastes were introduced and the test was performed continuously. The percentage of polymers was increased successively until the gasification process was no longer viable (no flare visible) or problems of feeding occurred. The syngas samples were collected from the biomass particle filter into suitable bags with the aid of a vacuum pump. One of the samples was collected when the gasification process was stabilized (zero or near zero temperature variation) and another one at the end of the test before the equipment was closed. Analysis of the synthesis gases was determined by gas chromatography. Each bag containing the synthesis gas was analyzed on a Varian 450-GC Gas Chromatograph with a TCD detector (used for identification and quantification of CO, CO2, H2, CH4 and light hydrocarbons) [47,48,49].
The ashes are collected in a separate deposit in the lower reactor, while the synthesis gas produced passes through a cyclone to remove the fine particles. The gas is conveyed to the biomass silo to dry it and subjected to further cleaning using a filter composed of coal of various particle sizes, which can then be collected for analysis or directly injected into the generator. The condensates are collected in a said filter. Figure 3 shows a diagram of the unit and pictures of it [46].
During the tests, the temperature and pressure values in the upper and lower reactor (oxidation and reduction zones, respectively), biomass particle filter pressure, inlet airflow and lastly the amount of biomass consumed during the tests were controlled. The thermocouples are located inside the reactor, one near the air inlet inside of the reactor (Toxi), and immediately thereafter, the thermocouple corresponding to the reduction temperature, near the end of the reactor (Tred). where the pressure probes are on the top of the reactor, at the reactor outlet and in the particle filter (Figure 3.). Gas samples were taken from the biomass particulate filter outlet into appropriate bags with the help of a vacuum pump. One of the samples was taken when the gasification process was stabilized (zero or almost zero temperature variation) and another at the end of the test, before closing the equipment. The coals were caught in containers at the bottom of the reactor and the cyclone filter downstream of the reactor. The condensates were collected at the bottom of the biomass particulate filter [45].

3. Results and Discussion

The average proximate, ultimate, and HHV of the inserted fuels are illustrated in Table 6. The results of biomass analysis were obtained based on the characterization of biomass, the heating values of biomass, proximate analysis and ultimate analysis [50].
It is possible to observe that HHV obtained in the case of tires (38.6 MJ/kg) and of plastics and rubbers (31.6 MJ/kg) was twice the value of acacia and miscanthus, being similar results to those reported by others studies [51,52]. This evidence is due to the presence of high carbon content in polymeric fuels relative to the lignocellulosic fuels. The results also show that waste understudy has a high potential for energy production. Wastes of tires and plastics+rubbers may pose a risk to equipment not prepared to support so high HHV’s. Biomass energy production equipment typically has a recommended limit of 18 MJ/kg for the calorific value of the fuel [45].
The elemental analysis also reveals the presence of high sulfur content in the tires. The main source of SO2 emissions into the atmosphere is the combustion of substances containing sulfur in their composition. Most of the time sulfur is present in the material as a contaminant and the elimination of this compound is economically unfeasible since it would involve very high costs that would increase the price of the final product. When thermal processes are carried out at a high temperature and with the presence of atmospheric air, the factors that favor the formation of SO2 are assembled [53].
Boiler temperature variation with the feed composition is mainly attributed to the excess of O2 in the combustion and failure to constantly feed biomass (mainly with a high percentage of mixtures). Ideally, in combustion processes in this type of equipment, the excess of air is between 5% to 8%, when passing the upper limit, the temperature tends to fall and when being below 5%, the temperature rises, although the combustion is not complete.

3.1. Combustion Tests

The results of the co-combustion of used tires with miscanthus in the blends are exposed in Table 5. The operating parameters and analysis of the exhaust gases are presented in Table 7 and Table 8.
The first aspect to be mentioned is that the fuel feeding was constant (9.6 kg/h) over the duration of the tests, with an increase in the power produced when the fraction of tires also increased. With the mixtures of 40% and 60%, it was difficult to achieve automatic boiler feeding and constant operator intervention was required. A significant amount of ashes was quantified (0.508 kg/h on average), as well as the formation of fused and aggregated ashes that, without human intervention, would clog inlet air and fuel systems.
The results allowed to verify the inverse proportionality between CO2 and O2 concentrations, having both a point of inversion in the blend with 20% of tires. In this case, the concentration of both gases achieved 11.7 and 7.9, respectively. The test with 100% miscanthus presents more CO2 than the tests carried out with the tire mixes, a possible explanation is that forestall biomasses are not burned automatically, it suffers thermal degradation and later enters the combustion phase, this occurs because, during the combustion process, oxygen is consumed on the surface of the semi-coal and diffused insignificantly inside it. Regarding the mixture with tires, CO2 seems to remain stable in the three tests, clearly demonstrating that remarkable reactions of polymers with oxygen are somewhere between 400 °C and 600 °C. Long hot-zone residence times and high activation energies are necessary for the formation of stable substances and products such as CO2. Short hot-zone residence times have a quenching effect; oxygen consumption is stopped, and thermodynamic metastable or unstable products are formed.
For the case of NO and NOx emissions, a slight rise is observed throughout the test with tires; they remained stable as a result of the high temperatures achieved. Particle sizes influence NOx emissions. NOx emissions in different particle sizes and feed intervals mean NOx emission increases with particle size. During the combustion of tires particles of different sizes, the creation of NOx and its reduction to N2 occurs simultaneously, how it can be observed in test 3 and test 4 [54]. The intermediate products of N-fuel cracking can easily be transformed into NOx by reacting with oxygen in the bed area [55]. In addition, smaller particles are more prone to devolatilization. Un-reacted char of smaller particles and CO are carried up to the freeboard zone and reduce NOx to N2. Therefore, the NOx emission is lower at smaller particle sizes, thus, NOx emissions are inferior.
The SO2 emissions rose continuously to 1305 mg/Nm3 with 60% of tires. These emissions are the result of sulfur being a major component in tire manufacturing. In fact, the elemental analysis of the tires indicated a strong presence of sulfur (5.6% by mass). The increase in SO2 emissions was a consequence of the increase in the percentage of tires [56]. The SO2 emissions steadily increase to around 1.3 g/Nm3 with the 60% polymer mixture, more than doubling the limit set out in Table 4, Annex A, of Ordinance N°.675/2009, of 23 June [57], making it necessary to mitigate SO2 emissions.
An aspect to be analyzed is the variation of the amount of biomass admitted to the reactor. There was a decrease in fuel feeding as the percentage of plastics and rubbers increased in the tests. This observation is related to the greater calorific value that plastics and rubber present towards miscanthus. However, for mixing percentages above 40% there is a clear difficulty in feeding the reactor without operator intervention. These percentages were also verified for the formation of fused and aggregated ashes which, without human intervention, would obstruct the air and fuel system.
A variation of the levels of carbon monoxide, carbon dioxide and unreacted oxygen as a function of the percentage of plastics and rubber in the mixture was observed. A simultaneous decrease of carbon dioxide and carbon monoxide was detected, with an increase in the unreacted oxygen as the percentage of polymers was increased. This trend is in line with the fixed carbon content of fuels, test 1 with 100% miscanthus demonstrated a fuel with more fixed carbon, as the plastics in the mixture increase, the amount of carbon in the fuel decreases, how it can be observed in the test of 60% and 40% of polymeric waste. In the fuel-rich region, the emissions of carbon are slightly higher than those of most other mixtures, indicating a more effective burning. The balance of carbon was converted to CO, to unburned (gas phase or condensed) hydrocarbons, or remained unoxidized in the solid residue [58,59].
As already mentioned, with higher percentages of polymers greater difficulties were encountered in carrying out the combustion process. Thus, these results show that, although more material is being admitted, it does not react completely, which is a limitation for this type of system. For the most hazardous compounds, the variation of the NOx, NO and SO2 emissions as a function of the tested mixtures, there was a decrease in gaseous emissions with an increase in the percentage of plastics and rubber. It was also verified that this decrease may be related to the loss of efficiency of the combustion process. Nitrogen content in plastics and rubbers is lower than miscanthus, so the effect of NOx formation is lesser (test of 60% and 40% polymeric waste). The formation of NOx is related to the time that the products remain in the gas phase inside the boiler, with the increase in the residence time of the gas in the boiler, there is an interaction with hydrocarbon radicals that are in the flame zone, increased in NOx production [60]. This tendency is in agreement with that of polymeric combustion by Baron [61] et al. who referred that NOx concentration depends on the nitrogen the content of the fuel and is not prejudiced by irregular feeding interval.
The elemental analysis of plastics and rubbers did not indicate the presence of sulfur, so it was assumed that SO2 emissions were due to the sulfur present in miscanthus pellets (0.8–1.9% by mass) [56].
Emissions from tests with plastics were lower than those from tires and do not exceed the limits allowed by Portuguese legislation (<500 mg/Nm3). The ash analysis in combustion tests was performed in terms of HHV, proximate and ultimate. In the following Table 9 the results obtained are presented:
For coals resulting from the co-combustion of tires and the co-combustion of plastics and rubbers understudy, the HHV value is 19.6 MJ/kg and 15.5 MJ/kg, respectively. These values fall within the range in which the fossil coals fit (14.6 MJ/kg to 26.7 MJ/kg) [62]. It would, therefore, be interesting to experiment with the water vaporization of these coals, for the production of synthesis gas to assess its calorific content, as proposed in other works using coals from sludge, rape, and miscanthus [63] on the elemental analysis obtained from the ashes resulting from combustion processes.
As expected, for proximate analysis the levels of fixed carbon and inorganic matter present in the ash showed the highest mass proportions, an average percentage of about 80.0%, the obtained values are in accordance with other researchers [64]. The low moisture content suggests the possibility of direct combustion of coal to obtain energy without the application of a drying treatment and the consequent additional energy consumption if the material is properly stored. An analysis of their surface area is suggested for the possible use of infiltration and electrolysis systems. There are two opposing effects to the process: the first implies that volatiles will react first with available oxygen, preventing the consumption of fixed carbon. The second effect is faster combustion, which will increase the temperature and this temperature increase tends to help the combustion of fixed carbon [65]. The high amount of carbon in the ash resulting from the co-combustion of plastics and rubbers is explained by the relatively low temperatures observed, indicating that only the volatile component would have been effectively oxidized, with much of the fixed carbon remaining in the ash. In the co-combustion of the tires, having a lower volatile component and a higher temperature during the tests, there was a decrease in the fixed carbon percentage compared to the other biomasses.

3.2. Gasification Tests

Table 10 and Table 11 present the co-gasification results for mixtures with acacia and used tires or plastics and rubbers, respectively. The operating parameters and analysis of the syngas are presented in the tables.
Regarding co-gasification with tires, the fuel gas produced in greater quantity in the syngas is carbon monoxide, with percentages ranging from 4.8% to 11.4%. The molecular hydrogen produced ranged from 2.3% to 6.2% and methane from 2.5% to 4.3%. The biomass intake was reduced from about 7 kg/h with 0% tires to about 1.8 kg/h with 40% tires. Above 60% it was not possible to carry out the process. As for the calorific value of the syngas, it has been verified that it assumes higher values in co-gasification with small amounts of tires in the blend.
Considering the high carbon content of used tires, this may lead to conditions to produce high amounts of chars in the gasification process. Several studies pointed to the need for increasing the co-gasification temperature as the percentage of tires in the mixture increases or decreases the size of the tire particles to reduce char production [66].
The equivalence ratio of ER value has a lot of influence on gasification temperature. The influence of the ER on the gasification temperature is illustrated in Table 10 and Table 11. As can be seen, the gasification temperature increases with the decrease in the ER value. This is because the biomass needs more air the thermochemical degradation to maintain the gasification temperature than the polymer. The polymer is more combustible than biomass and does not need as much oxygen to be converted into thermochemical processes. As you can see, the ER decreases as the number of polymers in the mixture increases.
The results obtained demonstrate that optimal conditions were at low tire percentages (below 40%). This can be one of the justifications that explain the decrease of calorific value of syngas with the rise of tires in the mixtures, and the high amount of unconverted material within the reactor at the end of the test [67].
Like the used tires, the gasification of plastics and rubbers produces a syngas relatively rich in carbon monoxide (with volumetric proportions between 3.4% and 8.3%), molecular hydrogen (between 2.2% and 5.9%), methane (between 3.7% and 4.3%) and traces of ethylene (less than 0.2%). The results for the calorific value were 2.6 MJ/Nm3 (100 % acacia), 3.09 MJ/Nm3 (20% plastics and rubbers) and 2.53 MJ/Nm3 (40% plastics and rubbers). It can be concluded that the highest energy potential found was in the test with 20% of wastes. The biomass intake was reduced from about 7 kg/h with 0% plastics and rubbers to 1.875 kg/h with 20% plastics and rubber. At 60% it was not possible to gasify or even feed the reactor, because the density of the fuel was very low. Under these conditions, there was still a high condensate production (0.36 L/h). The decrease in the equivalence ratio leads to higher oxidation of the carbon with the release of more CO (about 8.3% by volume). The amount of nitrogen was inversely proportional to the LHV. The reduction zone temperature had a beneficial influence in the LHV of the syngas, and this fact is reported by several authors [22], which shows that the increase in temperature for biomass with these characteristics results in an increase in the calorific value of the syngas [36].

4. Conclusions

Tire combustion tests have shown that SO2 emissions are constantly increasing to about 1.3 g/Nm3 with a 60% mixture of polymers, exceeding that defined in Table 4, Annex A, of the Ordinance No.675/2009 of June 23, making it necessary to mitigate SO2 emissions. NO, and NOx emissions slightly increase and remain relatively stable. Ashes resulting from co-combustion also have a high calorific value with 19.5 MJ/kg. In the co-gasification tests, the synthesis gas with the highest calorific value was for the mixture with 20% tires + 80% acacia (3.64 MJ/Nm3).
For the combustion tests with plastics and rubbers, NO, NOx and SO2 emissions were 291.7 mg/Nm3, 168.7 mg/Nm3, and 53.5 mg/Nm3, respectively, despite the slight decrease during the test with 40% of polymers, resulting in emissions below the VLE (500 mg/Nm3), defined in table 1 of Annex A of Administrative Rule no. 675/2009 of June 23. Ashes resulting from co-combustion have a high calorific value lower than 15.1 MJ/kg. In the co-gasification tests, the calorific value for the highest gas produced was found to be 3.1 MJ/Nm3, with 20% plastics and rubbers and 80% acacia.
This work demonstrated the feasibility of transforming this type of waste into thermal energy through the production of valuable hydrogen-rich gas and other products that are highly relevant in terms of calorific value and interest in the industry.

Author Contributions

Conceptualization, L.C.-C., R.M.-P., M.J.H.-O. and P.B.; methodology, L.C.-C., R.M.-P., M.J.H.-O. and P.B.; validation, M.J.H.-O. and P.B.; formal analysis, L.C.-C., R.M.-P., M.J.H.-O. and P.B.; investigation, L.C.-C., R.M.-P., M.J.H.-O. and P.B.; data curation, B.G.-G.; writing—original draft preparation, L.C.-C., R.M.-P. and M.J.H.-O.; writing—review and editing, P.B.; visualization, M.J.H.-O. and P.B.; supervision, P.B.; project administration, M.J.H.-O.; funding acquisition, P.B. All authors have read and agreed to the published version of the manuscript.

Funding

This work not received directly external funding. PhD Hermoso-Orzáez Manuel Jesús participated like Postdoctoral Researcher (Research Grant of the National Research Plan of the Government of Spain called ¨Jose Castillejo¨), as an external researcher at the Center Instituto Politécnico de Portalegre (Portugal). The international project named “ECOCIR" (Project of Cross-Border Cooperation for the Introduction of the Circular Economy through the recycling, the management and valorization of residues in the regions Centro, Extremadura and Alentejo—Interreg España-Portugal). This work was supervised by PhD Brito Paulo. We have used thermochemical methods for the energy Valorization of wastes, mainly plastics and rubbers obtained of the substitutions of obsolete luminaires by LED replacements in the Alentejo and Extremadura Regions.

Conflicts of Interest

The authors declare no conflict of interest.

References

  1. Veksha, A.; Giannis, A.; Yuan, G.; Tng, J.; Chan, W.P.; Chang, V.W.-C.; Lisak, G.; Lim, T.-T. Distribution and modeling of tar compounds produced during downdraft gasification of municipal solid waste. Renew. Energy 2019, 136, 1294–1303. [Google Scholar] [CrossRef]
  2. Harvey, M.; Pilgrim, S. The new competition for land: Food, energy, and climate change. Food Policy 2011, 36, S40–S51. [Google Scholar] [CrossRef]
  3. Hermoso-Orzáez, M.J.; Lozano-Miralles, J.A.; Lopez-Garcia, R.; Brito, P. Environmental Criteria for Assessing the Competitiveness of Public Tenders with the Replacement of Large-Scale LEDs in the Outdoor Lighting of Cities as a Key Element for Sustainable Development: Case Study Applied with PROMETHEE Methodology. Sustainability 2019, 11, 5982. [Google Scholar] [CrossRef] [Green Version]
  4. Makarichi, L.; Jutidamrongphan, W.; Techato, K. The evolution of waste-to-energy incineration: A review. Renew. Sustain. Energy Rev. 2018, 91, 812–821. [Google Scholar] [CrossRef]
  5. Erias, A.J.M.W.; Karaka, C.; Grajetzki, C.; Carton, J.; Paulos, M.; Jantunen, P.; Baral, P.; Bex, S. World Energy Resources; World Energy Council: London, UK, 2016; ISBN 9780946121625. [Google Scholar]
  6. Fogarasi, S.; Imre-Lucaci, F.; Fogarasi, M.; Imre-Lucaci, Á. Technical and environmental assessment of selective recovery of tin and lead from waste solder alloy using direct anodic oxidation. J. Clean. Prod. 2019, 213, 872–883. [Google Scholar] [CrossRef]
  7. Zhang, L.; Xu, C.; Champagne, P. Overview of recent advances in thermo-chemical conversion of biomass. Energy Convers. Manag. 2010, 51, 969–982. [Google Scholar] [CrossRef]
  8. Huda, A.; Mekhilef, S.; Ahsan, A. Biomass energy in Bangladesh: Current status and prospects. Renew. Sustain. Energy Rev. 2014, 30, 504–517. [Google Scholar] [CrossRef]
  9. Basu, P.; Acharya, B.; Dutra, A. Gasification in Fluidized Beds—Present Status & Design. In Proceedings of the 20th International Conference on Fluidized Bed Combustion, Xi’an, China, 18–21 May 2009; Springer: Berlin/Heidelberg, Germany, 2009. [Google Scholar]
  10. Pashchenko, D. Thermodynamic equilibrium analysis of combined dry and steam reforming of propane for thermochemical waste-heat recuperation. Int. J. Hydrogen Energy 2017, 42, 14926–14935. [Google Scholar] [CrossRef]
  11. Pashchenko, D. Thermochemical waste-heat recuperation by steam methane reforming with flue gas addition. Int. J. Energy Res. 2019, 43, 2216–2226. [Google Scholar] [CrossRef]
  12. ETRMA. European Tyre & Rubber Manufacturers; ETRMA: Brussels, Belgium, 2011. [Google Scholar]
  13. Danon, B.; Gorgens, J. Determining rubber composition of waste tyres using devolatilisation kinetics. Thermochim. Acta 2015, 621, 56–60. [Google Scholar] [CrossRef]
  14. Cunliffe, A.M.; Williams, P.T. Composition of oils derived from the batch pyrolysis of tyres. J. Anal. Appl. Pyrolysis 1998, 44, 131–152. [Google Scholar] [CrossRef]
  15. Resiman, J. Air Emissions From Scrap Tire Combustion; United States Environmental Protection Agency: Washington, DC, USA, 1997.
  16. Gökalp, I.; Kaya, O.; Keçecioglu, S.; Boden, D. A TECHNO-ECONOMIC FEASIBILITY ANALYSIS OF THE GASIFICATION OF USED TIRES FOR ENERGY GENERATION IN TURKEY. Detritus 2019, 7, 1. [Google Scholar] [CrossRef] [Green Version]
  17. Hasan, A.; Dincer, I. Comparative assessment of various gasification fuels with waste tires for hydrogen production. Int. J. Hydrogen Energy 2019, 44, 18818–18826. [Google Scholar] [CrossRef]
  18. Karatas, H.; Olgun, H.; Engin, B.; Akgün, F. Experimental results of gasification of waste tire with air in a bubbling fluidized bed gasifier. Fuel 2013, 105, 566–571. [Google Scholar] [CrossRef]
  19. Trninic, M.; Stojiljkovic, D.; Jovovic, A.; Jankes, G. Biomass gasification technology: The state of the art overview. In Proceedings of the 2016 4th International Symposium on Environmental Friendly Energies and Applications (EFEA), Belgrade, Serbia, 14–16 September 2016; Volume 25, pp. 1–8. [Google Scholar]
  20. Raman, K.P.; Walawender, W.; Fan, L. Gasification of waste tires in a fluid bed reactor. Conserv. Recycl. 1981, 4, 79–88. [Google Scholar] [CrossRef]
  21. Leung, D.Y.; Wang, C. Fluidized-bed gasification of waste tire powders. Fuel Process. Technol. 2003, 84, 175–196. [Google Scholar] [CrossRef]
  22. Xiao, G.; Ni, M.-J.; Chi, Y.; Cen, K.-F. Low-temperature gasification of waste tire in a fluidized bed. Energy Convers. Manag. 2008, 49, 2078–2082. [Google Scholar] [CrossRef]
  23. Atal, A.; Levendis, Y.A. Comparison of the combustion behaviour of pulverized waste tyres and coal. Fuel 1995, 74, 1570–1581. [Google Scholar] [CrossRef]
  24. Machin, E.B.; Pedroso, D.T.; De Carvalho, J.A. Energetic valorization of waste tires. Renew. Sustain. Energy Rev. 2017, 68, 306–315. [Google Scholar] [CrossRef] [Green Version]
  25. Levendis, Y.A.; Atal, A.; Carlson, J.; Dunayevskiy, Y.; Vouros, P. Comparative Study on the Combustion and Emissions of Waste Tire Crumb and Pulverized Coal. Environ. Sci. Technol. 1996, 30, 2742–2754. [Google Scholar] [CrossRef]
  26. Nimmo, W.; Singh, S.; Gibbs, B.; Williams, P. The evaluation of waste tyre pulverised fuel for NOx reduction by reburning. Fuel 2008, 87, 2893–2900. [Google Scholar] [CrossRef] [Green Version]
  27. Kandasamy, J.; Gǒkalp, I. Pyrolysis, combustion, and steam gasification of various types of scrap tires for energy recovery. Energy Fuels 2015, 29, 346–354. [Google Scholar] [CrossRef]
  28. Wang, Z.; Richter, H.; Howard, J.B.; Jordan, J.; Carlson, J.; Levendis, Y.A. Laboratory Investigation of the Products of the Incomplete Combustion of Waste Plastics and Techniques for Their Minimization. Ind. Eng. Chem. Res. 2004, 43, 2873–2886. [Google Scholar] [CrossRef]
  29. Zhang, S.; Zhu, S.; Zhang, H.; Liu, X.; Xiong, Y. High quality H2-rich syngas production from pyrolysis-gasification of biomass and plastic wastes by Ni–Fe@Nanofibers/Porous carbon catalyst. Int. J. Hydrogen Energy 2019, 44, 26193–26203. [Google Scholar] [CrossRef]
  30. Win, M.M.; Asari, M.; Hayakawa, R.; Hosoda, H.; Yano, J.; Sakai, S.-i. Characteristics of gas from the fluidized bed gasification of refuse paper and plastic fuel (RPF) and wood biomass. Waste Manag. 2019, 87, 173–182. [Google Scholar] [CrossRef]
  31. Ruoppolo, G.; Ammendola, P.; Chirone, R.; Miccio, F. H2-rich syngas production by fluidized bed gasification of biomass and plastic fuel. Waste Manag. 2012, 32, 724–732. [Google Scholar] [CrossRef]
  32. Pashchenko, D. Thermochemical recuperation by ethanol steam reforming: Thermodynamic analysis and heat balance. Int. J. Hydrogen Energy 2019, 44, 30865–30875. [Google Scholar] [CrossRef]
  33. Ahmed, I.; Gupta, A. Characteristic of hydrogen and syngas evolution from gasification and pyrolysis of rubber. Int. J. Hydrogen Energy 2011, 36, 4340–4347. [Google Scholar] [CrossRef]
  34. Kaewluan, S.; Pipatmanomai, S. Gasification of high moisture rubber woodchip with rubber waste in a bubbling fluidized bed. Fuel Process. Technol. 2011, 92, 671–677. [Google Scholar] [CrossRef]
  35. Neill, S.P.; Hashemi, M.R.; Lewis, M.J. Optimal phasing of the European tidal stream resource using the greedy algorithm with penalty function. Energy 2014, 73, 997–1006. [Google Scholar] [CrossRef] [Green Version]
  36. Lee, U.; Chung, J.N.; Ingley, H.A. High-Temperature Steam Gasification of Municipal Solid Waste, Rubber, Plastic and Wood. Energy Fuels 2014, 28, 4573–4587. [Google Scholar] [CrossRef]
  37. Wang, T.; Li, Y.; Zhang, J.; Zhao, J.; Liu, Y.; Sun, L.; Liu, B.; Mao, H.; Lin, Y.; Li, W.; et al. Evaluation of the potential of pelletized biomass from different municipal solid wastes for use as solid fuel. Waste Manag. 2018, 74, 260–266. [Google Scholar] [CrossRef]
  38. Nhuchhen, D.R.; Salam, P.A. Estimation of higher heating value of biomass from proximate analysis: A new approach. Fuel 2012, 99, 55–63. [Google Scholar] [CrossRef]
  39. Hai, I.U.; Sher, F.; Yaqoob, A.; Liu, H. Assessment of biomass energy potential for SRC willow woodchips in a pilot scale bubbling fluidized bed gasifier. Fuel 2019, 258, 116143. [Google Scholar] [CrossRef]
  40. Garcia, R.; Pizarro, C.; Lavín, A.G.; Bueno, J.L. Biomass proximate analysis using thermogravimetry. Bioresour. Technol. 2013, 139, 1–4. [Google Scholar] [CrossRef] [PubMed]
  41. Nyakuma, B.B.; Johari, A.; Ahmad, A.; Abdullah, T.A.T. Thermogravimetric Analysis of the Fuel Properties of Empty Fruit Bunch Briquettes. J. Teknol. 2014, 67, 79–82. [Google Scholar] [CrossRef] [Green Version]
  42. Mallick, D.; Poddar, M.K.; Mahanta, P.; Moholkar, V.S. Discernment of synergism in pyrolysis of biomass blends using thermogravimetric analysis. Bioresour. Technol. 2018, 261, 294–305. [Google Scholar] [CrossRef]
  43. IKA. IKA Calorimeter System, C 2000 EDVLF. C 2000 FRQWURO 2000, 3. [Google Scholar]
  44. D’Alessandro Serie CS SMALL Modelos de 20 a 100 kW. Available online: http://www.circalefaccion.com/adj/images/archivos/MANUAL%20USO%20Y%20MANTENIMIENTO%20CS%20SMALL%20ENC.%20AUTOM.pdf (accessed on 31 December 2019).
  45. Calado, L.; Garcia, B.; Brito, P.; Panizio, R.; Lourinho, G. Thermochemical Conversion of Waste Tires for Energy Recovery. In Proceedings of the Innovation, Engineering and Entrepreneurship; Machado, J., Soares, F., Veiga, G., Eds.; Springer International Publishing: Cham, Switzerland, 2019; pp. 697–704. [Google Scholar]
  46. AllPowerLabs Power Pallet Technician’s Handbook (PP20/v1.09). Available online: http://www.allpowerlabs.com/wp-content/uploads/2015/06/v1-09_Section_01_Introduction_to_the_Power_Pallet.pdf (accessed on 31 December 2019).
  47. Gillespie, G.D.; Everard, C.D.; Fagan, C.C.; McDonnell, K.P. Prediction of quality parameters of biomass pellets from proximate and ultimate analysis. Fuel 2013, 111, 771–777. [Google Scholar] [CrossRef]
  48. Zhang, Y.; Zhao, Y.; Gao, X.; Li, B.; Huang, J. Energy and exergy analyses of syngas produced from rice husk gasi fi cation in an entrained fl ow reactor. J. Clean. Prod. 2015, 95, 273–280. [Google Scholar] [CrossRef]
  49. Gas Chromatograph Model 450-GC Specification Sheet Gas Chromatograph model Varian 450-GC. Available online: http://photos.labwrench.com/equipmentManuals/25399-8198.pdf (accessed on 31 December 2019).
  50. Wang, Y.; Li, G.; Liu, Z.; Cui, P.; Zhu, Z.; Yang, S. Techno-economic analysis of biomass-to-hydrogen process in comparison with coal-to-hydrogen process. Energy 2019, 185, 1063–1075. [Google Scholar] [CrossRef]
  51. Harrison, G.; Ross, A.B. Use of tyre pyrolysis oil for solvent augmentation in two-stage coal liquefaction. Fuel 1996, 75, 1009–1013. [Google Scholar] [CrossRef]
  52. Rowhani, A.; Rainey, T.J. Scrap Tyre Management Pathways and Their Use as a Fuel—A Review. Energies 2016, 9, 888. [Google Scholar] [CrossRef]
  53. Scala, F. Fluidized bed technologies for near-zero emission combustion and gasification. In Fluidized Bed Technologies for Near-Zero Emission Combustion and Gasification; Woodhead Publishing: Cambridge, UK, 2013. [Google Scholar]
  54. Leckner, B.; Karlsso, M. Gaseous emissions from circulating fluidized bed combustionof wood. Biomass Bioenergy 1993, 4, 379–389. [Google Scholar] [CrossRef]
  55. Svoboda, K.; Hartman, M. Formation of NOx in fluidized bed combustion of model mixtures of liquid organic compounds containing nitrogen. Fuel 1991, 70, 865–871. [Google Scholar] [CrossRef]
  56. Brosse, N.; Dufuor, A.; Meng, X.; Sun, Q.; Ragauskas, A. Miscanthus: A fast- growing crop for biofuels and chemicals production. Biofuels, Bioprod. Biorefining 2012, 38, 1–19. [Google Scholar] [CrossRef]
  57. Ministérios da Economia, da Inovação e do Desenvolvimento, da Agricultura, do Desenvolvimento Rural e das Pescas. Annex A of Administrative Rule n°.675/2009 of June 23; Goverment of Portugal: Lisbon, Portugal, 2009; p. 4.
  58. Fang, M.; Shen, D.; Li, Y.; Yu, C.; Luo, Z.; Cen, K. Kinetic study on pyrolysis and combustion of wood under different oxygen concentrations by using TG-FTIR analysis. J. Anal. Appl. Pyrolysis 2006, 77, 22–27. [Google Scholar] [CrossRef]
  59. Browne, F.L. Theories of the Combustion of Wood and Its Control; Forest Products Laboratory, Forest Service, U.S. Department of Agriculture: Madison, WI, USA, 1958.
  60. Chen, Y.; Ma, X.; Liao, Y.; Hu, Z.; Lin, Y.; Yu, Q. Influence of the interaction on NOx emission during co-combustion of combustible solid waste components. J. Energy Inst. 2016, 89, 313–324. [Google Scholar] [CrossRef]
  61. Baron, J.; Bulewicz, E.; Kandefer, S.; Pilawska, M.; Żukowski, W.; Hayhurst, A. The combustion of polymer pellets in a bubbling fluidised bed. Fuel 2006, 85, 2494–2508. [Google Scholar] [CrossRef]
  62. Manara, P.; Zabaniotou, A. Towards sewage sludge based biofuels via thermochemical conversion – A review. Renew. Sustain. Energy Rev. 2012, 16, 2566–2582. [Google Scholar] [CrossRef]
  63. Sattar, A.; Leeke, G.A.; Hornung, A.; Wood, J. Steam gasification of rapeseed, wood, sewagesludge and miscanthus biochars for the productionof a hydrogen-rich syngas. Biomass Bioenergy 2014, 69, 276–286. [Google Scholar] [CrossRef]
  64. Yeboah, N.N.N.; Shearer, C.R.; Burns, S.E.; Kurtis, K.E. Characterization of biomass and high carbon content coal ashfor productive reuse application. Fuel 2014, 116, 438–447. [Google Scholar] [CrossRef]
  65. Wu, T.; Lester, E.; Cloke, M. A Burnout Prediction Model Based around Char Morphology. Energy Fuels 2006, 20, 1175–1183. [Google Scholar] [CrossRef]
  66. Lerner, A.S.; Bratsev, A.N.; Popov, V.E.; Kuznetsov, V.A.; Ufimtsev, A.A.; Shengel’, S.V.; Subbotin, D.I. Production of hydrogen-containing gas using the process of steam-plasma gasification of used tires. Glas. Phys. Chem. 2012, 38, 511–516. [Google Scholar] [CrossRef]
  67. Straka, P.; Bučko, Z. Co-gasification of a lignite/waste-tyre mixture in a moving bed. Fuel Process. Technol. 2009, 90, 1202–1206. [Google Scholar] [CrossRef]
Figure 1. Raw materials used for co-gasification in the reactor. (a) tires waste. (b) plastic-rubbers wastes. (c) miscanthus biomass. (d) Acacia biomass. (Source: self-made).
Sustainability 12 01036 g001
Figure 2. Multi-fuel pellet combustion boiler made of steel D’Alessandro Termomeccanica S.R.L. CS SMALL 45. (a) Operation detail of boiler in operation. (b) Madur Photon II gas analyzer and Probe to analyze combustion gases. (Source: self-made).
Sustainability 12 01036 g002
Figure 3. System operation scheme and reactor detail. a) Overview of tubing and gas paths. b) Details extraction site of gas samples from reactor outlet r. (Source: Power Pallet Technician’s Handbook (PP20/v1.09).
Sustainability 12 01036 g003
Table 1. Technical Features of ThermoFisher Scientific Flash 2000 CHNS-O Analyzer (Source: ThermoFisher https://www.thermofisher.com/pt/en/home.html).
DesignationTechnical Features Source
Thermo Scientific™ FLASH 2000 CHNS/O Analyzers Instrument configurations—Fourteen;
Detector Thermal—conductivity detector (TCD);
External interface—RS 232 serial line;
Instrument control—Eager Xperience for Windows™;
Power supply—230 Vac; 50/60 Hz; 1400 VA;
Table 2. Technical Features of PerkinElmer STA 6000—Thermogravimetric analyzer (Source: PerkinElmer https://www.perkinelmer.com/Content/RelatedMaterials/Brochures/BRO_STA-6000.pdf).
DesignationTechnical Features Source
PerkinElmer
STA 6000—thermogravimetric analyzer
Balance resolution 0.1 ug;
Balance measurement range Up to 1500 mg;
Temperature range 15 ˚C to 1000 ˚C Start experiments below room temperature to capture complete moisture and solvent evaporation
Heating rate Ambient to 1000 ˚C 0.1 to 100 ˚C/min, cooling rates from 1000 ˚C to 30 ˚C Under 10 minutes Forced air and chiller to achieve fastest cool down for higher productivity, temperature metal standards such as Indium and Silver calibration
Temperature accuracy < ±0.5 ˚C, temperature < ±0.5 ˚C reproducibility,
Calorimetric data Accuracy/precision ±2% based on metal standards, Thermocouples PT-PT/Rh (Type R)
Autosampler Optional, 45-position for unattended operation 24/7
Hyphenated techniques Combine with MS or IR analyzers MS or IR connectivity capabilities, allow the analysis of evolved gases
Table 3. Technical Features of IKA C 200—Calorimeter analyzer (Source: https://www.ika.com/pt/Produtos-Lab-Eq/Calorimetros-csp-330/C-200-Downloads-cpdl-8802500/).
DesignationTechnical Features Source
IKA C 200-System—calorimeterMax. Measuring range—40000 J;
Dynamic measurement mode 25 °C—yes;
Isoperibol 25 °C—yes;
Dynamic measurement time—approx. 8 min;
Measurement time isoperibol—approx. 17 mins;
Dynamic Reproducibility (1 g NBS39i benzoic acid)—0.1% RSD;
Reproducibility Isoperibol (1 g benzoic acid NBS39i)—0.1% RSD;
Max. Working temperature—25 °C;
Table 4. Technical Features of Madur Photon II portable gas analyzer—Gas analyzer (Source: http://www.madur.com/index.php?page=/products/port/photon).
DesignationTechnical Features Source
Madur Photon II4-20 mA, Display, Electrochemical, Ethernet, NDIR, Paramagnetic, PID, Pump, RS232, Thermal Conductivity
Freon R23, Hydrogen H2, Hydrogen Chloride HCl, Hydrogen Sulfide H2S, Carbon Monoxide CO, Chlorine Cl2, Nitrogen N2O, Methane CH4, Nitrogen Dioxide NO2, Nitrogen Monoxide NO, Oxygen O2, Sulfur Dioxide SO2, VOC Volatile Organic Compounds
Table 5. Technical Features of PP20 Power Pallet—(Source: AllPowerLabs PP20 Power Pallet. http://www.allpowerlabs.com/wpcontent/uploads/2014/05/APL_2014catalog_5_13_14_small.pd).
DesignationTechnical Features Source
AllPowerLabs PP20 Power PalletPower rating (W or kW)—15 kW at 50 Hz, 18 kW at 60 Hz;
Available energy type (mechanical, thermal, electrical) Electrical (18 kW), thermal (20 kW);
Description of biomass source(s)—Dense biomass such as nutshells and wood chips;
Biomass input requirements (kg per hour)—0.33 m3 every 3 hours;
Combustor type—Internal combustion engine;
Biomass conversion efficiency (%)—Upwards of 35%; 1.2 kg of feedstock to 1 kWh of electricity;
Lifecycle—More than six years, with routine maintenance;
Performance: Continuous power rating: 15 kW@50 Hz/18 kW@60 Hz,
Sound level @ 30 feet: 85 dB(A),
Fuel Feeding: 1.2 kg/kWh, 2.5 lbs/kWh,
Run time per hopper fill (at 250 kg/m3 fuel density): 10 hrs at 5 kW, 5 hrs at 10 kW, 3 hrs at 15 kW Max. continuous operation: >12 hours, Start up time: 10–20 min
Operating Conditions: Ambient temperature: 5–40 °C (40–100 °F), Humidity: 5–95% RH, Installed footprint (without ash vessel or grid tie): 1.36 × 1.36 m (53.5 × 53.5 inches)
Site requirements: Well-ventilated protected from rain and direct sun
Additional safety handles and warnings are included on the product; Complementary technical systems: Performance of this product is improved with another technology (eg., Cookstoves and Wind-blocking skirts); Combined heat and power (CHP) module.
Table 6. Biomass Analysis. (Source: own elaboration).
AnalysisParametersUnitsBiomass
AcaciaMiscanthusUsed TiresPlastics and Rubbers
ProximateMoisture%14.26.30.80.2
Volatile Matter%49.764.764.578.3
Fixed Carbon%32.126.029.620.9
Ashes%4.03.05.10.6
UltimateNitrogen%0.30.40.00.0
Carbon%44.144.575.569.2
Hydrogen%5.66.20.77.4
Sulphur%0.00.05.60.0
Oxygen%46.045.913.122.8
HHVMJ/kg17.018.138.631.6
Table 7. Tire co-combustion tests.
ParametersUnitsTests
0% Tires20% Tires40% Tires60% Tires
Miscanthus%100806040
Tires%0204060
Fuel Feedingkg/h9.6
Asheskg/h0.508
Air Inletm3/h72.772.9772.9772.97
Air Inlet Temp.°C19.819.819.819.8
Boiler temperature°C499523523481
PowerkW100103.81133.6156.91
O2%5.97.96.96.1
COppm708.7232.3243.31238.7
NOppm180.7629.8216.7224.3
NO2ppm10.519.8
CO2%14.711.712.312.5
SO2ppm11.3170.3309.3463.7
COmg/Nm3900.4288.5290.44862.9
NOXmg/Nm3373.5425.1449.6495.9
NOmg/Nm3241.2277.1258.8301.5
SO2mg/Nm333.3496.29901305
Table 8. Presents the results obtained in the combustion of mixtures of plastics and rubber with miscanthus.
ParametersUnitsTests
0% P & R20% P & R40% P & R60% P & R
Miscanthus%100806040
P & R%0204060
Fuel Feedingkg/h864.44.8
Asheskg/h0.225
Air Inletm3/h72.9772.9772.9772.97
Air Inlet Temp.°C19.019.419.518.9
Boiler Tem.°C383.3411.1379405.7
PowerkW10066.666.193.1
O2%7.61013.513.4
COppm50623443.9606.3630.4
NOppm20018899.1111.4
NO2ppm1212.45.34.6
CO2%12.79.96.76.7
SO2ppm52.64913.112.7
COmg/Nm36565.54285.3930.71241.4
NOXmg/Nm3464.3414.1291.7264.5
NOmg/Nm3272.3240.2168.7159.6
SO2mg/Nm3159.6138.153.545.8
Table 9. The caloric value of co-combustion tests ashes.
AnalysisParametersUnitsBiomass
TiresR & B
ProximateMoisture%5.076.89
Volatile Matter%15.7516.98
Fixed Carbon%38.5243.66
Ashes%40.6639.36
UltimateNitrogen%00.5
Carbon%31.544.7
Hydrogen%00
Sulphur%3.55.8
Oxygen%24.349.64
HHVMJ/kg19.615.5
Table 10. Tire co-gasification tests.
ParametersUnitsTests
0% Tires20% Tires40% Tires60% Tires
Acacia%100806040
Tires%0204060
T oxi°C793803790790
T red°C400571516507
Fuel Feedingkg/h7.14.971.82.82
Air Inletm3/h10.59.29.710.3
ER-0.410.310.300.28
TarL/h0.038
Coalkg/h0.231
CO2%7.69.711.89.4
C2H4%0.10.40.30.2
C2H6%0.1000
N2%60.355.758.161.1
CH4%4.33.82.53.2
CO%4.810.611.46.0
H2%2.36.06.23.7
LHVMJ/m32.53.643.142.4
Table 11. Plastics and rubbers gasification tests.
ParametersUnitsTests
0% P & R20% P & R40% P & R
Acacia%1008060
P & R%02040
T oxi ° 802814834
T red ° 454571502
Fuel Feedingkg/h7.11.882.63
Air Inletm3/h10.59.310.1
ER0.410.300.29
TarsL/h0.361
Coalkg/h0.04
CO2%7.211.17.9
C2H4%0.10.20.1
C2H6%000
N2%59.852.556.7
CH4%4.33.73.7
CO%3.48.35.6
H2%2.25.94.3
LHVMJ/m32.63.092.53

