Article

An Inverted-U Impact of Environmental Regulations on Carbon Emissions in China’s Iron and Steel Industry: Mechanisms of Synergy and Innovation Effects

1
School of Economics, Hefei University of Technology, Hefei 230601, China
2
Center for Industrial information and Economy, Hefei University of Technology, Hefei 230601, China
3
School of Shanghai Development & Institute of Free Trade Zone, Shanghai University of Finance & Economics, Shanghai 200433, China
*
Author to whom correspondence should be addressed.
Sustainability 2020, 12(3), 1038; https://0-doi-org.brum.beds.ac.uk/10.3390/su12031038
Submission received: 29 December 2019 / Revised: 26 January 2020 / Accepted: 28 January 2020 / Published: 1 February 2020
(This article belongs to the Special Issue Sustainable Energy Economics and Policy)

Abstract

:
Based on a panel data of China’s iron and steel (IS) industry from 2000 to 2014, this paper explores the impact of environmental regulations on CO2 emissions in the industry. The results show that there is a clear inverted-U relationship between environmental regulations and CO2 emissions in the IS industry. Additionally, there are regional heterogeneity and regulatory intensity on the impact of environmental regulations on CO2 emissions. The results in the eastern region are consistent with the whole sample results, while the upward trend in the central region and the downward trend in the western region together lay the basis for the inverted-U shape of the whole sample. High environmental regulations affect CO2 emissions in an inverted-U shape, while low environmental regulations present a U shape. The mechanisms of environmental regulations affecting CO2 emissions are synergy effect and technological innovation effect. Finally, this paper proposes some policy recommendations according to the above findings.

1. Introduction

Since the increase in greenhouse gas emissions, such as CO2, resulting in global warming, human survival is facing an unprecedented threat. As the largest developing country, China’s CO2 emissions exceeded the United States in 2005 for the first time, making it the largest emitter of CO2 in the world [1]. In order to alleviate the greenhouse effect and suppress CO2 emissions, China has promised that its CO2 emissions per unit of Gross Domestic Product (GDP) (carbon intensity) will fall by 40%–45% by 2020 compared with 2005 [2]. According to a report released by the Ministry of Ecology and Environment of the People’s Republic of China, carbon intensity decreased by about 46% in 2017 compared with 2005. The target of reducing CO2 emissions has been achieved in advance. Nevertheless, global CO2 emissions and the greenhouse effect are still serious. According to a recent report by the World Meteorological Organization, the progress and severity of climate change far exceeds the predictions and assessments of ten years ago and countries in the world must respond quickly. As a responsible developing country, China has promised to reduce its carbon intensity by 60%–65% in 2030 compared with 2005 [2], and will reduce emissions by more than 12 billion tons per year. In order to fulfill the promise, it is particularly important to understand the main sources and influencing factors of CO2 emissions in China.
China’s industry has developed rapidly since the 21st century, especially in heavy industry and energy-intensive industries [3,4]. Although the iron and steel (IS) industry does not list as an industrial sector, it is a pillar industry and has gained momentum in China [5]. According to the National Bureau of Statistics, the output of pig iron, crude steel and steel in China was 771.05 million tons, 928.26 million tons and 1105.52 million tons in 2018, increased by 3.0%, 6.6% and 8.5%, year on year respectively. The IS industry of China has characters of “high pollution and high emissions”, and the comprehensive energy consumption of enterprises is large, which contributes a lot to the greenhouse effect [6]. In 2017, the comprehensive energy consumption per ton of large and medium-sized IS enterprises in China reached 570.5 kilograms of coal equivalent (kgce/t). The IS industry is an important industry for CO2 emissions, and it is also one of the first eight key emitters (petrochemical industry, chemical industry, building materials industry, iron and steel industry, nonferrous industry, paper industry, power industry, aviation industry) to be included in the national carbon emissions trading market [7].
In order to achieve sustainable development of the IS industry [8], the Chinese government has formulated a number of environmental policies and regulations, and issued a series of documents from the steel production technology level to alleviate CO2 emissions. However, there is little research in literature whether these policies are conducive to CO2 emissions reduction or not. In view of this, this paper studies the impact of environmental regulations on CO2 emissions in the IS industry. We mainly explore the nonlinear effect of environmental regulations on CO2 emissions and its potential mechanisms, and compare the results of different regions and samples.
The rest of the paper is structured as follows. Section 2 is the literature review. Section 3 introduces the econometric model, variables and data. In Section 4 we present the main empirical results, robustness check results and heterogeneity results. Section 5 discusses the impact mechanism of environmental regulations on CO2 emissions. Conclusions and corresponding policies are in Section 6.

2. Literature Review

There are many studies on the impact of environmental regulations on carbon emissions. On one hand, this section describes the impact from two perspectives of “green paradox” and “reverse emission reduction”. On the other hand, it focuses on possible ways affecting CO2 emissions in the IS industry.

2.1. Impact of Environmental Regulations on Carbon Emissions

2.1.1. Definition of Environmental Regulations

There are various methods of measurement for environmental regulation, which can be divided into the following four categories. First, the assignment scoring method. This method is to construct a relevant evaluation system, quantify environmental indicators, and assign a value to the intensity of environmental regulations [9]. Second, the single indicator method. These are mainly indicators that directly measure the environment, such as pollution taxes, carbon taxes, and biofuels or fossil fuel subsidies [10,11,12], and indicators that measure the environment indirectly, such as per capita income [13]. Third, the multi-indicator method. These are many methods, such as pollutant emission density [14], total industrial output value divided by SO2 emissions [15], expenditure of industrial waste gas treatment facilities divided by SO2 emissions [16], the proportion of investment in pollution projects in the total industrial output value [17], the proportion of industrial pollution control and control expenditures in sales [16] and comprehensive index of environmental regulations constructed from industrial SO2 emissions, industrial smoke and dust emissions, and industrial wastewater discharge removal rates [18]. Fourth, the classification research method. It is mainly measured based on different environmental regulation methods and the subject angles of different environmental regulations. For example, Zhao et al. (2015) explored the impact of three different environmental regulations on command and control regulations, market-based regulations and government subsidies on the efficiency of reducing CO2 emissions [19]. Due to data constraints, this paper mainly measures environmental regulations by the proportion of investment in pollution projects in the total industrial output value.

2.1.2. Green Paradox

In 2008, Sinn’s research set off an uproar in the field of environmental science. He found that regulations of climate change led to increased fossil energy mining, accelerated energy depletion, and increased cumulative CO2 emissions, which runs counter to policy goals. It is the famous “green paradox” [20]. Fowlie (2009) attested to the conclusions of previous scholars that if regulated companies are “dirtier” than unregulated competitors, industry emissions under environmental regulations will exceed emissions from unregulated industries [10]. Edenhofer and Kalkuhl (2011) refined the conditions of the “green paradox” proposed by Sinn (2008) and got the similar conclusion [11]. Van der Werf and Di Maria (2012) agree that emissions from regulatory countries are indeed greater than those from unregulated countries [21]. Grafton et al. (2010) found that biofuel subsidies will increase fossil fuel extraction rates in the short and medium term and promote CO2 emissions [22]. Van der Ploeg and Withagen (2012) pointed out the condition of “green paradox” in Grafton et al. (2010), they did not internalize the externalities of global warming, and renewable energy has not yet begun to be used [22,23]. Then the continuous subsidy will lead to an increase in CO2 [23]. Grafton et al. (2012) validated the conclusions of Grafton et al. (2010) from the perspective of the indirect impact of renewable resource subsidies on fossil fuel prices [12,22].

2.1.3. Reverse Emission Reduction

However, do environmental regulations really fail to achieve the desired results but bring more CO2 emissions? Many scholars are against this issue. Such as, Zofío et al. (2001), who proposed that environmental regulations based on DEA efficiency scores, would help primary sectors reduce waste emissions and CO2 emissions [24]. Consistent with Zofío et al. (2001), Carlsson and Hammar (2002) held that the incentive-based tradable permit system would facilitate international civil aviation to reduce CO2 emissions [24,25]. Additionally, the results of Michielsen (2014) suggest that the expected climate policy may reduce current CO2 emissions, which is contrary to the “green paradox” [26]. Bauer et al. (2018) pointed out that the “distribution effect” outweighs the “green paradox” [27].
Ang (2009) indirectly proves the conclusions of previous scholars. He found that technology-based environmental regulations could reduce the CO2 emissions in China [28]. Like Ang (2009), Zhang and Wei (2014) also studied China’s CO2 emissions, and found that China’s current environmental regulations could effectively suppress CO2 emissions and achieve the expected effect of the policy, which is the so-called “reverse emission reduction” theory [29]. Yin et al. (2015) confirmed the conclusions of Zhang and Wei (2014) [30]. He and Zhang (2012) not only studied the CO2 emissions of China, but also specifically examined the industrial CO2 emissions, indicating that the government’s energy-saving and emission reduction policies can help reduce CO2 emissions in the industrial sector [31]. Zhao et al. (2015a) also conducted research at the industry level, and they found that market-based regulations and government subsidies have a significant positive impact on reducing CO2 emissions in the power industry in China [32].

2.2. Environmental Regulations, Haze Pollution and Carbon Emissions

Existing literature indicates that environmental regulations can nonlinearly affect haze pollution emissions [14,18,32]. Cole et al. (2005) and Zhou et al. (2019) found that both formal and informal regulations can finally successfully reduce the intensity of pollution [14,18]. Greenstone and Hanna (2014) explored the Indian region and found that air pollution regulations significantly improved air quality and effectively reduced air pollution [33]. Unlike previous scholars, Kheder and Zugravu (2012) found that stricter environmental regulations attracted investment and confirmed the existence of a strong pollution haven effect in France [34]. As for China, it does have a “pollution haven” hypothesis, and there is a nonlinear effect between environmental regulations and pollution [35,36].
Air refers to the mixing of gases in the atmosphere of the earth (contaminated gas SO2, particulate matter PM10, PM2.5, and nitrogen oxides, greenhouse gases, CO2, etc.). The composition of the atmosphere changes due to the emission of various gases from fossil fuel combustion and human production activities [37]. Therefore, reasonable air pollution environmental regulations can not only promote the reduction of pollution emissions, but also help to reduce CO2 emissions [38]. Wang and Hao (2012) found that implementing the reduction policies of CO2 emission can achieve the win-win situation in reducing air pollution and CO2 emissions [39]. Sheehan et al. (2014) verified the conclusions of the above scholars. They found that there is a large overlap in the emission sources between PM2.5 and CO2 through empirical data, and environmental policies that focus on the air pollution have a significant impact on CO2 emissions [40]. From an industry perspective, Li et al. (2017) not only confirmed the conclusions of previous scholars, but also found that environmental regulations targeted towards SO2 emissions in the manufacturing industry of China reduced overall CO2 emissions [41].

2.3. Environmental Regulation, Technological Innovation and Carbon Emissions

The government’s policies of environmental regulations will inevitably increase the environmental costs of enterprises, accelerate the exit of high-pollution and energy-intensive enterprises, and promote green enterprises to occupy more market share [42]. As early as the end of the 20th century, Porter and Van der Linde (1995) pointed out that reasonable environmental regulations can stimulate enterprises to optimize resource allocation efficiency and improve technology level, and stimulate the “innovation compensation” effect of enterprises [43]. Thus, on one hand, it compensates companies for “following costs” and, on the other hand, increases their productivity and international competitiveness. In other words, the impact of environmental regulations on technological innovation has a positive compensation effect, which indirectly affects CO2 emissions. Chan et al. (2016) and Zhao et al. (2015) confirm the above conclusions [44,45].
Environmental regulations can further bring about the upgrading of production technology and environmental technology of enterprises, thereby improving the utilization efficiency of enterprise resources, optimizing the consumption structure of resources and energy, and suppressing the growth of CO2 emissions [29]. Therefore, firstly, it is possible to change production methods for enterprises through innovation, promote production technology upgrades and environmental technology upgrades to increase productivity and reduce the environmental costs. Popp (2006) confirmed that environmental regulations promote innovation in pollution control, which, in turn, significantly inhibits CO2 emissions in the United States, Japan, and Germany [45]. Li et al. (2019) conducted a study on Industrial Green Development of China, which indirectly verified the results of previous scholars [46]. Secondly, enterprises could optimize resource allocation through improving energy efficiency, and then cost-effective and efficient technical response can achieve better emission reduction [47]. Zhang et al. (2017) proved the above viewpoints and found that energy efficiency has a significant impact on CO2 emission reduction in China [48]. Thirdly, the development of the renewable energy sectors and the improvement of energy structures play a strategic role in the commitment to combating climate change in China [49]. Zhang et al. (2017) demonstrated that resources and innovation (R&D intensity) can effectively contribute to CO2 reduction [50].

2.4. Contributions of This Paper

Compared with the existing literature, the contributions of our study lie in the following aspects. Firstly, most of the previous studies examine the impact of environmental regulations on CO2 emissions based on the whole industry in China. This does not automatically lead to a same conclusion in an industrial subsector or other industries. Considering the importance of IS industry, we focus our research on the crucial industry. Secondly, we find that environmental regulations have an inverted-U impact on the CO2 emissions of the IS industry. Thirdly, we provide two possible mechanisms of the impact of environmental regulations on CO2 emissions of the IS industry, namely synergy and innovation effects.

3. Model, Variables and Data Sources

3.1. Benchmark Model and Variable Description

Considering the possible nonlinear relationship between environmental regulations and CO2 emissions in Chinese IS industry, based on previous studies [35,51], we develop the econometric model as Equation (1) showing:
c o 2 i t = a + β 1 e r s i t + β 2 e r s s q i t + β 3 X + ξ t
where CO2it represents CO2 emissions per capita from the IS industry in 28 provinces of China. We estimate the CO2 emissions from fossil fuel combustion through the coefficient published by IPCC. ersit and erssqit represent linear and quadratic terms of environmental regulations, respectively. Following previous research, environmental regulation is measured by the proportion of industrial pollution control investment in total industrial output [29]. The subscript it in the variable indicates the i-th province in China in year t (2000–2014), ξt represents a random disturbance term, the control variable X is selected from two levels: industry and province. First, the control variables from the industry-level include: (1) The labor population (pop), expressed by the average number of employees in the IS industry; (2) The capital stock (cap), calculated from the fixed assets investment in the IS industry; (3) The energy structure (ens2) is expressed by the proportion of coal consumption of the IS industry in total energy consumption. Second, the control variables from the provincial-level include: (1) Economic growth (ecgcons), expressed by the regional GDP of each province divided by the number of employed people; (2) Urbanization (urb), is the proportion of urban population at the end of the year in the total population; (3) Industrialization (ind), is the ratio of the added value of the secondary industry to that of the primary industry; (4) The industrial structure (ins), expressed by the proportion of the added value of the secondary industry to that of the tertiary industry; (5) The trade openness (fdi), is calculated by dividing the total import and export by the regional GDP.

3.2. Data and Trend Analysis

3.2.1. Variable Selection and Data Source

(1) The dependent variable: per capita CO2 emissions of the IS industry in each province. According to the CO2 emission coefficient of different fossil fuels published by the IPCC (2006), we can calculate the CO2 emissions of the IS industry in each province [52].
(2) Core independent variables: environmental regulations (ersit) and the quadratic term of environmental regulations (erssqit).
(3) Control variables. The control variables of the industry-level: labor population (pop), capital stock (cap) and energy structure (ens2). The control variables of the provincial-level: economic growth (ecgcons), urbanization (urb), industrialization (ind), industrial structure (ins) and trade openness (fdi).
The data on industrial pollution control investment, coal consumption and total energy consumption are derived from the Provincial Statistical Yearbooks of 28 provinces in China. The average number of employees, fixed assets investment, and total industrial output value are derived from the China Industrial Statistical Yearbook. The urban population and the total population are derived from the China Statistical Yearbook. The regional GDP, the added value of the primary, secondary and tertiary industries, and the total import and export volume are derived from the China Regional Economic Database in the EPS data platform. Among them, the total industrial output value and regional GDP have been flattened.
Due to the data availability, 2000—2014 was the sample period, and Hainan Province, Sichuan Province and Tibet Autonomous Region were excluded. Table 1 is the descriptive statistics of each variable.

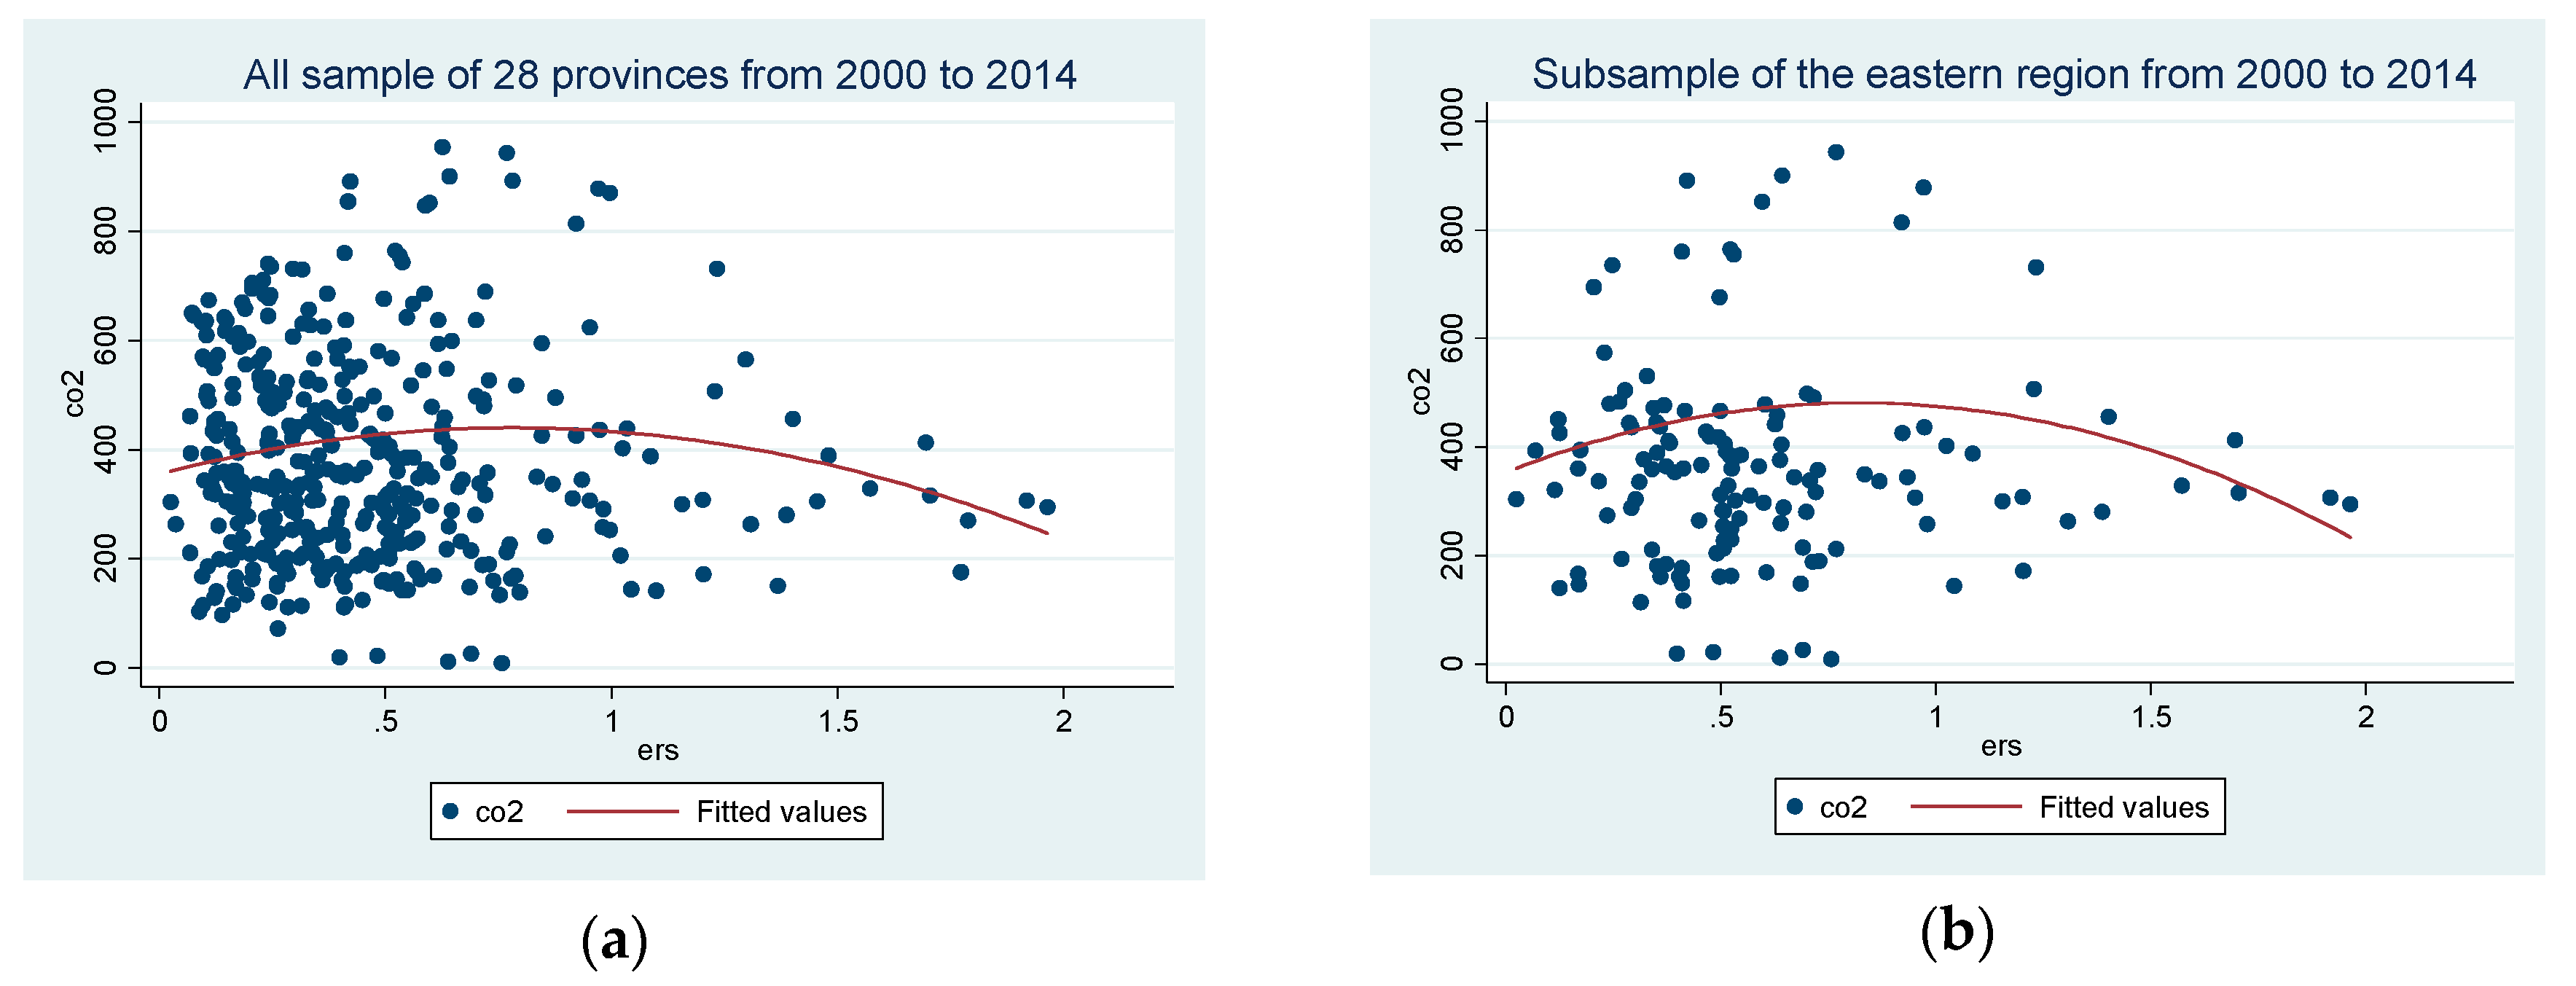
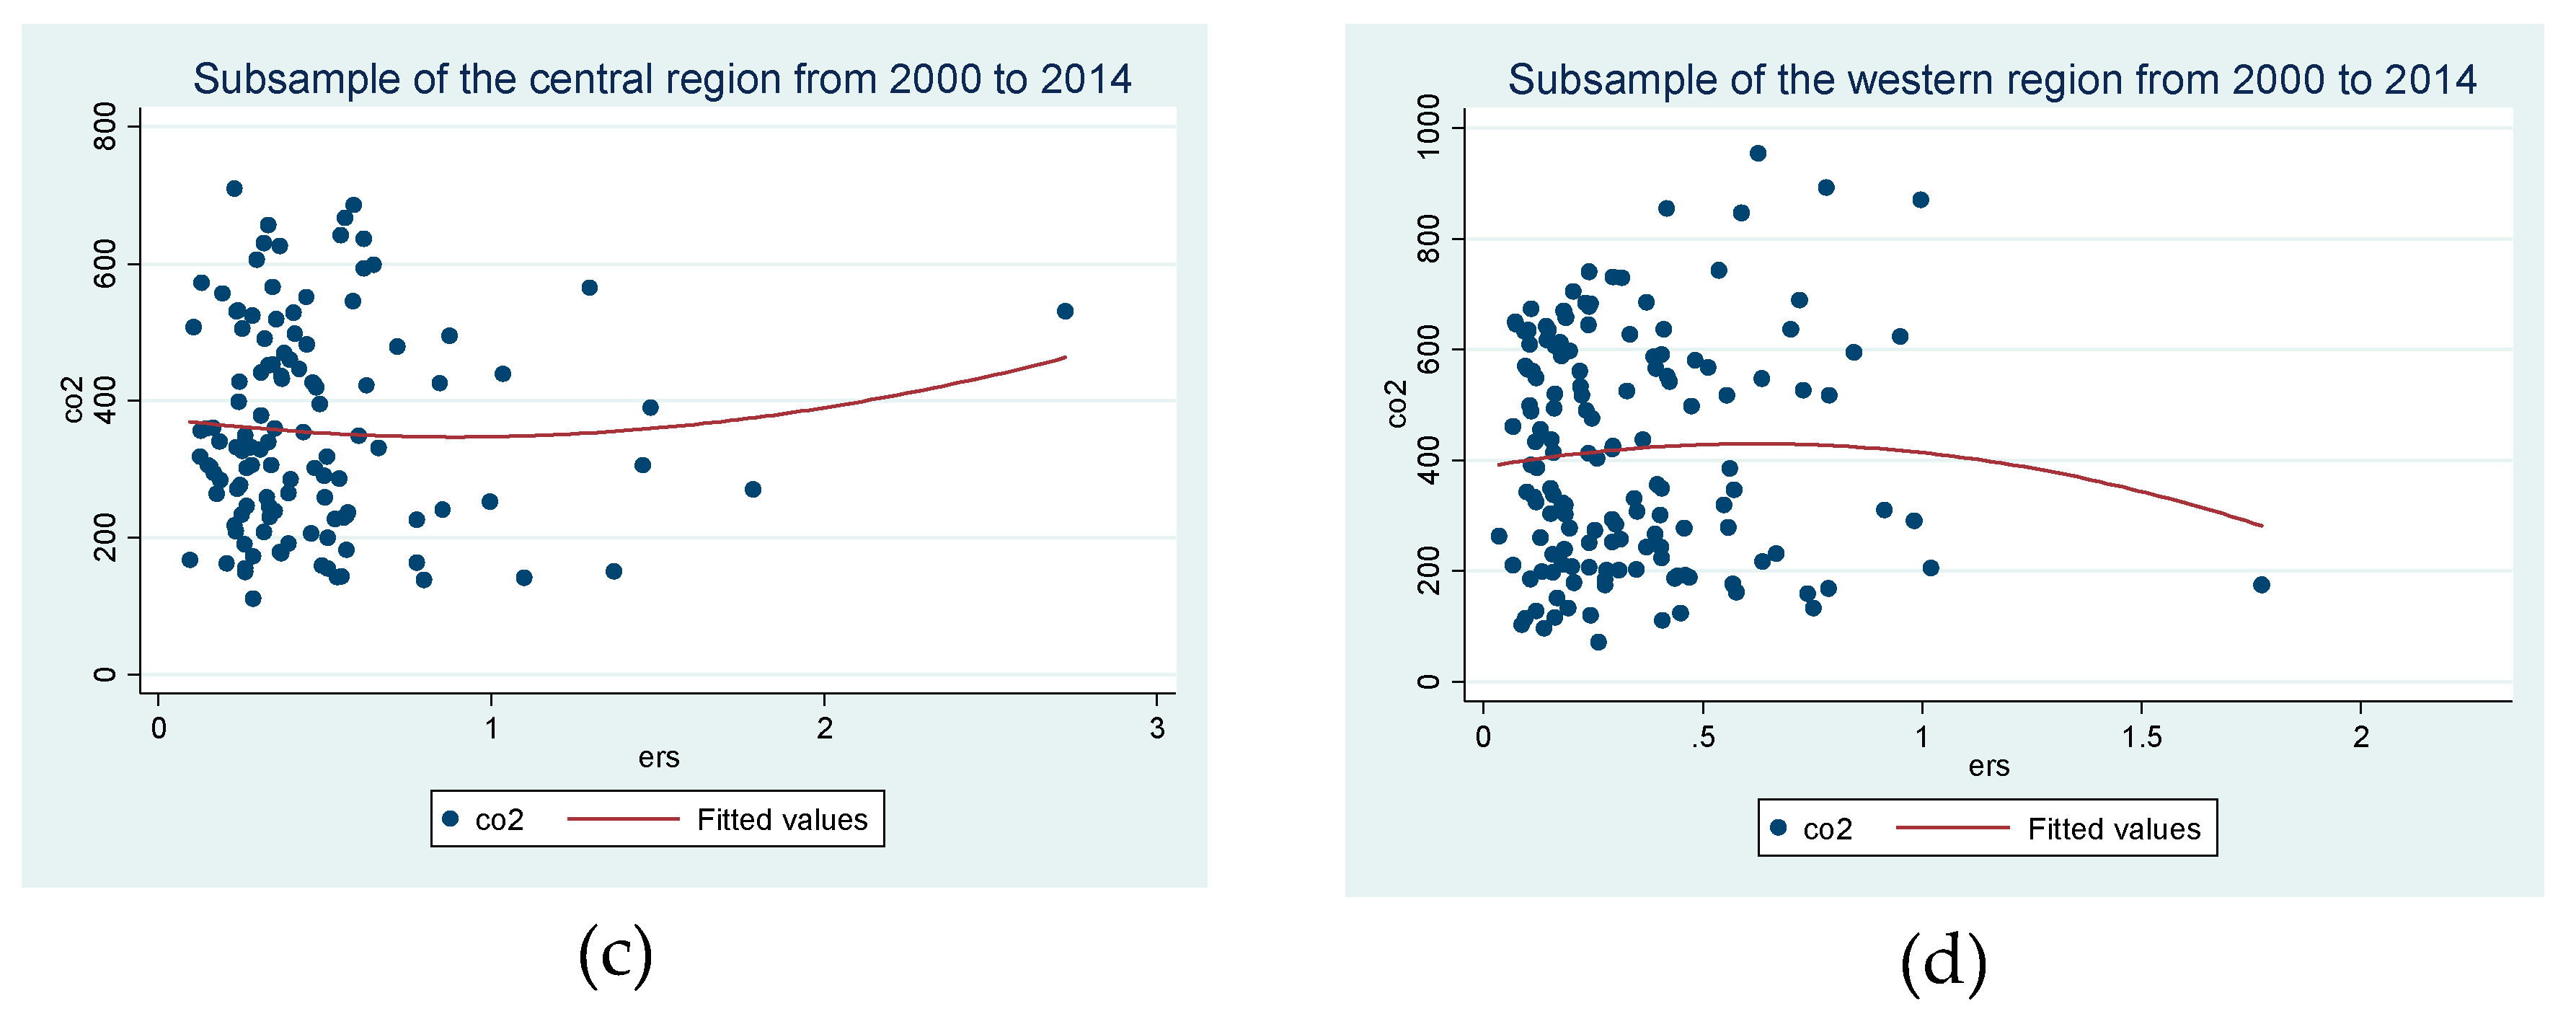
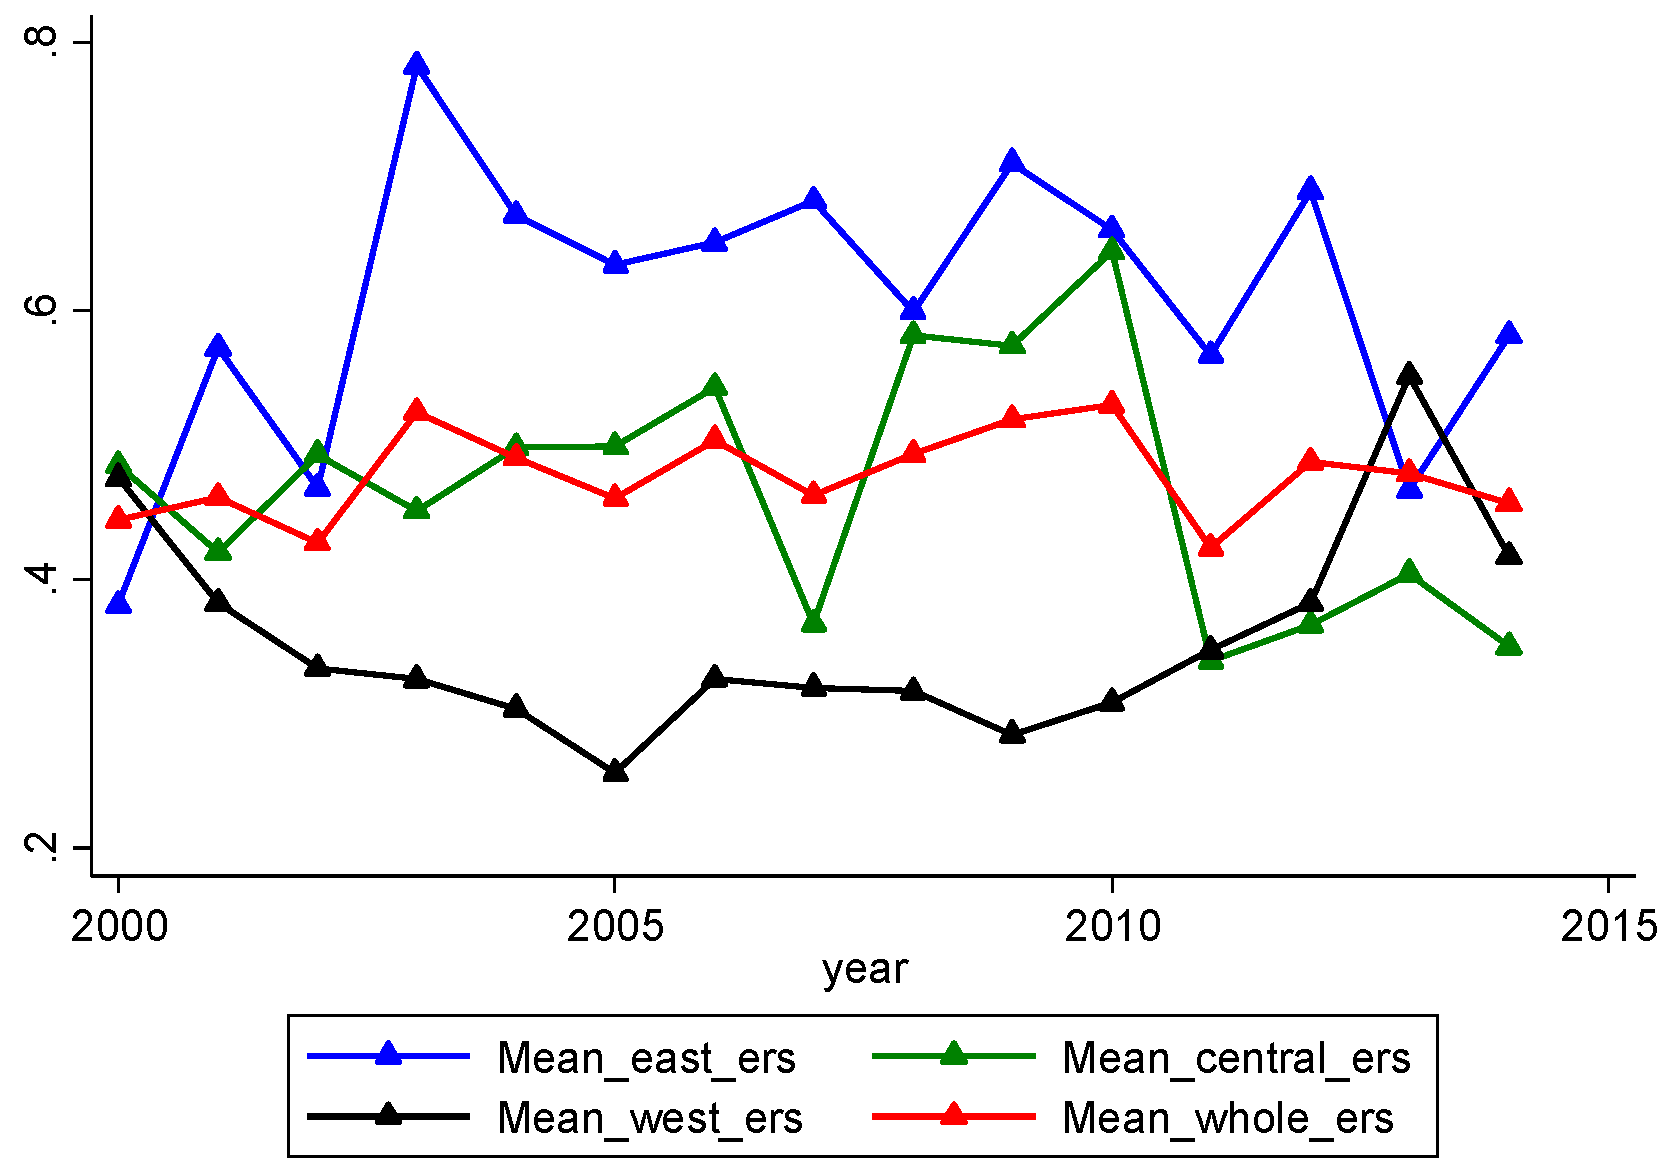
3.2.2. Trend Analysis of CO2 Emissions and Environmental Regulations

According to literature, this paper argues that there is a nonlinear relationship between CO2 emissions and environmental regulations in the IS industry. Figure 1 visually illustrates the nonlinear effects. Figure 1a–d represent the trends of environmental regulations and CO2 emissions of the whole sample, eastern, central and western regions (Eastern Region: Beijing, Tianjin, Hebei, Liaoning, Shanghai, Jiangsu, Zhejiang, Fujian, Shandong, Guangdong; Central Region: Shanxi, Jilin, Heilongjiang, Anhui, Jiangxi, Henan, Hubei, Hunan; Western Region: Inner Mongolia, Guangxi, Sichuan, Guizhou, Yunnan, Shaanxi, Gansu, Qinghai, Ningxia, Xinjiang. The classification comes from the National Bureau of Statistics) [53] of 28 provinces. First, there is a clear inverted-U relationship between CO2 emissions and the environmental regulations of the whole sample. The eastern region also exhibits a similar inverted-U relationship, while the upward trend in the central and the downward trend in the western region constitute the basis for the inverted U-shaped trend in the overall sample.

4. Empirical Results and Discussion

In this section, we first analyze the basic impact of environmental regulations on CO2 emissions, and then check the robustness of the empirical results. Finally, the heterogeneity analyses are carried out.

4.1. Analysis of Benchmark Results

This section analyzes the impact of environmental regulations on CO2 emissions in the IS industry. Table 2 illustrates the results of the benchmark model. Column (a) contains only the independent variable, columns (b) and (c) include two control variables (economic growth and urbanization), and columns (d) and (e) consider four control variables (economic growth, urbanization, industrialization, and industrial structure). The last two columns consider all control variables in model (1). It can be seen that the linear and the quadratic items of environmental regulations significantly affect the CO2 emissions in the seven columns in Table 2: ers has a positive impact on CO2 emissions, while for erssq, the impact is negative. That is, the impact of environmental regulations on CO2 emissions is an inverted-U shape.
The inverted-U shape in Table 2 is consistent with the scatter plot in Figure 1a. Before reaching the peak point, CO2 emissions increase with the environmental regulation intensity. The possible explanation is that the government has formulated some policy measures to improve the impact of climate change, but the implementation of these measures (such as setting carbon taxes and reducing the demand for fossil energy demand) led to accelerated mining of fossil energy, which accelerated the accumulation of CO2 emissions in the atmosphere, resulting in environmental degradation [20]. Therefore, in the short-term, enterprises will increase the demand for energy and consume a lot of energy from the demand side. From the supply side, energy owners will change their mining strategies, move the mining path forward, and accelerate energy depletion, leading to an increase in CO2 emissions. Although the “green paradox” is appalling, the impact of environmental regulations on CO2 emissions is not static. When CO2 emissions reach a peak, pollution-intensive IS companies will bear high environmental costs as the intensity of environmental regulation increases. Therefore, the survival threshold of high-energy consumption and high-pollution enterprises is improved, and CO2 emissions are reduced [16,29]. In addition, the impact of control variables on CO2 emissions in the IS industry is basically in line with expectations.

4.2. Robustness Checks

In this section, we perform robustness checks by replacing the core independent variable and dependent variables. First, we use GDP per capita (denoted as er1) [13], total industrial output value divided by SO2 emissions (denoted as er2) [15], and expenditure on industrial waste gas treatment facilities divided by SO2 emissions (named as er3) to calculate environmental regulations [16]. Second, the calculation of control variables (energy structure ens2, industrialized ind1, industrial structure ins1) is changed. ind1 is replaced by the ratio of the added value of the primary industry to the regional GDP, and ins1 is the ratio of the added value of the secondary industry to the regional GDP. We change the calculation of the above 1, 2 and 3 control variables separately, and check robustness of regression results.
Columns (a)-(c) in Table 3 show the robustness results of core explanatory variables. Columns (d)-(j) show the results of changing the calculation of 1, 2 and 3 control variables, respectively. The third row in Table 3 represents the replaced variable. From Table 3, it can be seen that: Firstly, the results under three different environmental regulation indicators are still significant. Environmental regulations still affect the CO2 emissions of the IS industry in an inverted-U shape. Secondly, no matter how many control variables are substituted, the results are still the same with those in Table 2.

4.3. Heterogeneity Analysis

This section conducts heterogeneity analysis from two perspectives. Firstly, from a regional perspective, we divided the whole sample into eastern, central, and western regions. Secondly, from a sub-sample perspective, the core dependent variable and the provincial GDP are divided into three sub-samples according to their values, respectively.

4.3.1. Heterogeneity Analysis: Sub-Region

In this section, we explore the heterogeneous results of the eastern, central, and western regions.
Columns (a)–(b) of Table 4, columns (c)–(d) and columns (e)–(f) report regression results for the eastern, central, and western regions under the fixed effect and DK methods, respectively. It shows that environmental regulations significantly affect the eastern region, while the results in the central and western regions are insignificant. Particularly, the impact of environmental regulations on CO2 emissions in the eastern region is consistent with the whole sample, which fit the scatter plot in Figure 1a,b. The upward trend in the central region (Figure 1c) and the downward trend in the western region (Figure 1d) form the basis of inverted-U shape for the whole sample.
As can be seen from Figure 2, the eastern region has the highest level of environmental regulations, and the western region has the lowest level of regulations. In fact, the trend graphs of Figure 1 in these two regions are closer to the graphs of the whole sample. In 2005, the IS Industry Development Policy [54] issued by the National Development and Reform Commission of China showed that “from the perspective of ore, energy, resources, water resources, transportation conditions and domestic and foreign markets, large steel enterprises should be mainly distributed in coastal areas. IS enterprises in inland areas should combine the local market and the status of ore resources to determine the production of mines, and do not seek to expand the scale of production, with sustainable production as the main consideration”. Therefore, most of the large IS enterprises are in the eastern coastal areas. The policy on the IS industry is generally aimed at large and medium-sized steel enterprises, or in the eastern and central provinces and municipalities such as Beijing, Guangdong, Zhejiang, Shandong, Liaoning [55]. Therefore, environmental regulations obviously affect the CO2 emissions in the eastern region [56]. The central and western regions are affected by geography, and there are many enterprises with small scale, low efficiency and heavy pollution. In the central region there are mostly small-scale enterprises, and environmental regulations cannot achieve the CO2 emissions goal, and the regression results are not significant. Although the intensity of environmental regulations in the western region is small, it is to seek more investment with relatively low environmental regulations. In other words, the western region is currently at the stage of sacrificing the environment to develop economy. Additionally, the IS industry is in the stage of extensive development, so the coefficient of environmental regulations is positive. With strict environmental regulations, the attractiveness of investment companies has declined and CO2 emissions have decreased in the western region.

4.3.2. Heterogeneity Analysis: Sub-Sample

In this section, we examine the heterogeneity results of environmental regulations and regional GDP under different sub-samples from the IS industry.
Firstly, we analyze the three sub-samples of environmental regulations. Columns (g)–(i) of Table 4 give the regression results for samples of high, middle and low environmental regulations, which are recorded as the first, second, and third sub-samples, respectively. The results indicate that environmental regulations significantly affect the first and third sub-samples. The influence of environmental regulations on CO2 emissions of the first sub-sample is consistent with the whole sample, while for the third sub-sample it is opposite to the trend of the whole sample. That is, as the intensity of environmental regulations increases, CO2 emissions of the first sub-sample increase first and then decrease. However, CO2 emissions of the third sub-sample decrease first and then increase. Although for the second sub-sample, environmental regulations have the same effect on CO2 emissions with the third sub-sample, the results are not significant.
These results imply the following facts. (1) CO2 emissions of environmental regulations for the first sub-sample show an inverted-U shape. This means when the intensity of environmental regulations is high, CO2 emissions increase at the initial stage as the intensity of environmental regulations increases, but decrease after reaching its peak. Strict environmental regulation policies have led the IS companies to increase the demand for high-carbon energy before policy implementation, and energy-owners on the supply side have accelerated energy extraction, resulting in increased CO2 emissions in the short term [57]. However, strict environmental regulations have made high-energy and high-pollution IS companies bear high production costs, suppress their development, encourage large enterprises to switch to cleaner production models, and promote the technology innovation of the IS industry to reduce CO2 emissions [58]. In addition, the coefficient of fdi is 0.898, indicating that inhibition of FDI is beneficial to reduce CO2 emissions. Strict environmental regulations will prevent the entry of high-energy and pollution-intensive IS industries in developed countries, and avoid China becoming a “pollution shelter”. (2) CO2 emissions of the third sub-sample is a U shape, indicating that CO2 emissions will decrease when environmental regulations are low, but will increase in the long run. The loose environmental regulation policy imposes less pressure on enterprises. Environmental costs of IS companies are within the acceptable range, and enterprises respond to policy requirements to reduce CO2 emissions during production and transportation. However, in the increase of environmental regulations, high-pollution and energy-intensive enterprises are increasingly affected. It is expected that the future regulations will be stronger, and enterprises will increase energy demand and accelerate energy consumption [59]. Finally, although the results of the second sub-sample are consistent with the third sub-sample, they are not significant. It indicates that when the country imposes moderate-intensity environmental regulations on the IS industry, the policy effect is not obvious. Therefore, the government generally formulates loose or strict regulations according to local conditions to ensure achievements of policy objectives.

5. Mechanism Analysis

As the above analysis shows, environmental regulations have a nonlinear impact on the emission of haze pollution. Environmental regulations or policies could be strictly and efficiently implemented to guide enterprises to adjust their industrial structure, and gradually shift to clean and low-carbon production. It not only reduces pollutant emissions, but also reduces CO2 emissions. On the other hand, environmental regulations further promote the upgrading of production and environmental protection technologies through the promotion of innovation, and effectively suppress CO2 emissions. For example, the policy subsidies of government for the IS industry are conducive to the IS industry improving production technology so as to reduce CO2 emissions. Therefore, this paper analyzes the impact of environmental regulations on CO2 emissions from the perspective of synergy effect and innovation effect. Synergy effect means that environmental regulations have a synergetic impact on pollution emissions and CO2 emissions. Additionally, it is impossible to affect one without affecting the other. The innovation effect means that environmental regulations significantly improves the technical level of the IS industry, thereby reducing CO2 emissions in the industry through innovative intermediate effects. The following two sub-sections will specifically analyze the results of the two mechanisms.

5.1. Synergistic Effect

According to the definition of synergy effect in this paper, the corresponding models are:
p m 2.5 i t = a + β 1 e r s i t + β 2 e r s s q i t + β 3 p o p i t + β 4 c a p i t + β 5 e c g c o n s i t + β 6 e n s i t + β 7 i n d i t + β 8 u r b i t + β 9 i n s i t + β 10 f d i i t + ξ t
and
c o 2 i t = a + β 1 p m 2.5 i t + β 2 p o p i t + β 3 c a p i t + β 4 e c g c o n s i t + β 5 e n s i t + β 6 i n d i t + β 7 u r b i t + β 8 i n s i t + β 9 f d i i t + ξ t
Among them, pm2.5it indicates pollutant emissions, expressed as PM2.5 emissions in air pollution particle, and the data comes from the China Environmental Statistics Yearbook. Other indicators are the same as model (1).
The results of synergy effect mechanism are given in columns (a) and (b) of Table 5, which correspond to model (2) and model (3), respectively. The results show that environmental regulations do affect CO2 emissions by influencing pollution emissions. This is consistent with the finding of Zhou et al. (2019) that environmental regulations nonlinearly affect haze pollution (PM2.5), and the scatter trend graph of pollution emissions is an inverted-U shape [18]. As the government has formulated a sound environmental policy implemented in all levels of enterprises, the IS industry is gradually transformed from a high energy consumption and high pollution production mode to a clean and low carbon production mode. As a result, pollution emissions are reduced, accompanied by a reduction in CO2 emissions.
It can be seen from Table 5 that for every 1 unit increase in environmental regulation intensity, the pollution emission PM2.5 increases by 5.076 units. PM2.5 increases by 1 unit, resulting in an increase of CO2 emissions by 0.378 units. These show that PM2.5 positively affects CO2 emissions. Controlling pollution emissions through environmental regulations can achieve the goal of reducing CO2 emissions. Zhao et al. (2015) confirmed the above results and found that market regulations and government subsidies positively affected CO2 emissions [19].

5.2. Innovation Effect

Similarly, models of the innovation effect mechanism are:
e n i i t = a + β 1 e r s i t + β 2 e r s s q i t + β 3 p o p i t + β 4 c a p i t + β 5 e c g c o n s i t + β 6 e n s i t + β 7 i n d i t + β 8 u r b i t + β 9 i n s i t + β 10 f d i i t + ξ t
and
c o 2 i t = a + β 1 e n i i t + β 2 p o p i t + β 3 c a p i t + β 4 e c g c o n s i t + β 5 e n s i t + β 6 i n d i t + β 7 u r b i t + β 8 i n s i t + β 9 f d i i t + ξ t
Where eniit is the energy intensity of the IS industry, indicating the degree of technological innovation, calculated by dividing the total energy consumption of the IS industry by the total industrial output value of the industry. All other indicators are the same as model (1).
Columns (c) and (d) of Table 5 illustrate the results of the innovation mechanism. It shows that environmental regulations promote technological innovation in the IS industry, thereby reducing CO2 emissions. Feng and Chen (2018) prove that environmental regulations encourage green process innovation and promote the industrial sector to improve its technology [60]. Thus, it positively influences the green development. Specifically, for every 1 unit increase in environmental regulation intensity, the energy intensity eni increases by 9.869. Moreover, the energy intensity eni increases by 1 unit, resulting in an increase in CO2 emissions of 1.398. Energy intensity refers to the amount of energy consumed by the unit of economic output (or physical quantity, service volume). Energy efficiency is the ratio of the effective output of an economy to the input of energy [61]. It usually refers to the problem of the economic benefits of per unit energy, i.e., energy efficiency. Therefore, the higher the energy economy efficiency, the lower the energy intensity is. Technological innovations effectively increase energy efficiency [62], reduce energy intensity and thus reduce CO2 emissions.

6. Conclusions and Policy Implications

6.1. Conclusions

Based on the panel data of 28 provinces in China from 2000 to 2014, this paper studies the impact of environmental regulations on CO2 emissions in the IS industry. The empirical results above show that environmental regulations significantly affect the CO2 emissions, and there is a typical inverted-U relationship between environmental regulations and CO2 emissions of the IS industry in China. Additionally, the finding is robust when we use different independent variable and dependent variables. We also found environmental regulations primarily reduce CO2 emissions through synergy effect and technological innovation effect. On the one hand, environmental regulations aimed at reducing haze pollution emissions not only reduce pollutant emissions, but also reduce CO2 emissions. On the other hand, environmental regulations further promote the upgrading of technologies in the IS industry through the promotion of innovation, and effectively suppress CO2 emissions in the IS industry. In addition, environmental regulations have varying effects on CO2 emissions due to regional heterogeneity and regulation intensity differences. From the perspective of heterogeneity, we have two findings based on results of three regions (eastern, central and western region) and three samples (first to third sub-sample). Firstly, environmental regulations have regional heterogeneity, which has a significant impact on the eastern region, while insignificant in other regions. Secondly, the impact of environmental regulations on CO2 emissions depends on regulatory intensities and economic development levels. High-intensity environmental regulations affect the CO2 emissions in an inverted-U shape, while the impact of low-intensity environmental regulations is a U shape. These findings are of great significance for accurately assessing the environmental regulation effect and promoting CO2 emission reduction in the IS industry.

6.2. Policy Implications

With respect to the above conclusions, this paper proposes the following policy recommendations for the IS industry:
(1) The government could formulate policies for pollution emissions from the IS industry and indirectly suppress CO2 emissions by controlling its pollution emissions. For example, in order to reduce the large amount of pollution emissions caused by steel production, the IS companies could respond to the structural reforms of the supply-side highlighted in China and control the output of the IS industry from the supply side of steel production. This requires the IS companies to implement the “de-capacity, de-stocking, deleveraging, cost reduction and improving underdeveloped areas” policy, and eliminate the excess capacity of the IS industry from the supply side to decrease pollution emissions. According to the data of Institute of Science of National Institute of Statistics, the steel production capacity of China reached 133.759 million tons by the end of 2012, while steel capacity utilization rate was only 72%, significantly lower than normal. Continued growth in production in the IS industry will lead to further increases in energy consumption, pollution emissions and CO2 emissions. In addition, various air pollutants such as SO2, NOx, CO and other particulate pollutants and particulate matter such as PM10 or PM2.5 are emitted during the steel production process, causing serious air pollution [63]. The “de-capacity” policy proposed by the country can effectively alleviate the overcapacity in the industry. According to the National Bureau of Statistics of China, the traditional industries are actually executing de-capacity policy. Moreover, the growth rate of the IS industry has declined. In the first three quarters of 2015, crude steel production fell by 2.1%. As a result, the reduction in steel production has led to a reduction in pollutants emitted into the air. Hence, it is conducive to the reduction of CO2 emissions.
(2) The IS industry could improve its energy efficiency and transform its energy structure. Firstly, the Chinese government could increase the relative price of energy to a certain extent so as to reduce energy intensity [64], that is, improving energy efficiency. For example, it is possible to continue to tighten the differential electricity price policy in the IS industry, increase the tariff increase standard for the eliminated and restricted IS enterprises, further promote the transformation of energy-saving and consumption-reducing technologies for IS enterprises, and improve the overall technical level and competitiveness of IS enterprises. Enterprises could introduce advanced technologies to improve production efficiency and energy efficiency. As we know, technological advancement could improve the energy efficiency and production efficiency of enterprises, and help enterprises gradually achieve the goal of CO2 emissions reduction [65]. Secondly, in the production process in the industry, it is possible to consider replacing fossil energy with clean energy, and converting coal into gas for production. The Chinese “Thirteenth Five-Year Plan” identifies the clean and efficient use of coal as a major project, reflecting the importance of energy structure adjustment. It shows that more than 80% of CO2 emissions come from the burning of fossil fuels such as coal and natural gas [66]. In 2015, the total energy consumption of China was about 3.4 billion tons of standard coal, of which oil production was equivalent to more than 200 million tons of standard coal, and natural gas production was equivalent to more than 100 million tons of standard coal. This means Chinese total oil and natural gas production is equivalent to more than 300 million tons of standard coal. As a result, other energy sources are still difficult to replace coal in the short run. However, the industry could further adjust its energy structure such as building coal-fired power plants as less as possible and replacing coal-fired boilers with natural gas boilers or other energy-saving boilers. At the same time, the industry would still need to vigorously develop new energy sources and promote the efficient use of clean energy.
(3) The IS industry could set a reasonable carbon tax, maintain reasonable environmental regulation intensity, effectively implement various environmental policies, and control the CO2 emissions of the industry. Promoting green innovation through carbon pricing and further reducing CO2 emissions are basic drivers of climate change policy [38]. However, if the carbon tax is unreasonable, in the long run, the cost of enterprises is greater than the cost of short-term excessive energy consumption, resulting in an increase in CO2 emissions caused by environmental regulation policies. As well, a reasonable mandatory carbon tax will help reduce CO2 emissions [67]. In addition, if there is a significant time lag between policy announcement and implementation, enterprises may consume a lot of energy and emit more CO2 [45]. Therefore, the government could formulate a reasonable and realistic carbon tax policy, and force the IS industry to upgrade its technical level and reduce CO2 emissions from a cost perspective. In addition, as can be seen from the results of this paper, low-intensity environmental regulations can be applied to the IS industry in the initial stage, but high-intensity environmental regulations must be applied in the long run. Moreover, according to the economic development level of each region, the appropriate environmental regulation intensity shall be selected according to local conditions.
(4) The IS industry should focus on the development of the eastern, western and central regions of the industry. From a macro perspective, the central government shall further regulate the IS industry, and guide it from a diversified distribution to a collective and integrated approach to reduce CO2 emissions. Although the IS industry in the eastern region has shifted to the west, the market share in the central region has also rebounded. Overall, the eastern region is still the main source of IS production. The government could continue to promote the reduction and consolidation of the IS industry in the eastern region, comprehensively improve the quality of environmental protection and steel products, thereby reducing CO2 emissions [68]. For the western region, the government could take into account various conditions such as market demand, transportation, environmental capacity and resource and energy support. Meanwhile, it could promote capacity transfer in other regions in accordance with capacity replacement requirements, and develop the IS industry with high quality and cleanliness. In addition, the government could rationally allocate foreign direct investment according to local conditions, not only supporting the eastern and central regions, but also supporting remote areas in the western region to attract foreign investments and effectively use foreign investments. Since the impact of environmental regulations on CO2 emissions in the central region is insignificant, the government could limit the regional market capacity and resource energy support, and gradually withdraw from the uncompetitive enterprises through regulation and control, and guide the IS industry to concentrate on the market and resources. Thereby, through macro-control to strengthen independent innovation in the IS industry, the overall level of innovation in this industry in the central region can be improved and low-carbon economic development can be achieved [69].

Author Contributions

Conceptualization, Y.C. and Q.Z.; data curation, X.F.; formal analysis, X.F. and Q.Z.; funding acquisition, Y.C. and Q.Z.; methodology, X.F. and Q.Z.; software, X.F.; supervision, Q.Z. and Y.C.; writing—original draft, X.F.; writing—review and editing, Q.Z. and Y.C. All authors have read and agreed to the published version of the manuscript.

Funding

This research was supported by National Natural Science Foundation of China under Grants NSFC71601064, NSFC71471053, NSFC71974125, NSFC71573166 and NSFC71661137004, Major Program of National Fund of Philosophy and Social Science of China (18ZDA064), and the Fundamental Research Funds for the Central Universities (JZ2017HGTB0184).

Conflicts of Interest

The authors declare no conflict of interest.

References

  1. WorldBank. World Development Indicator Database. Available online: https://data.worldbank.org/indicator/EN.ATM.CO2E.KT?locations=CN-US SP.RUR.TOTL.ZS?view=chart (accessed on 10 January 2018).
  2. Climate action tracker. Pledges and Targets. Available online: https://climateactiontracker.org/countries/china/pledges-and-targets/ (accessed on 14 January 2019).
  3. Lin, B.; Xu, M. Regional differences on CO2 emission efficiency in metallurgical industry of China. Energy Policy 2018, 120, 302–311. [Google Scholar] [CrossRef]
  4. Lin, B.; Tan, R. Ecological total-factor energy efficiency of China’s energy intensive industries. Ecol. Indic. 2016, 70, 480–497. [Google Scholar] [CrossRef]
  5. Xu, B.; Lin, B. Assessing CO2 emissions in China’s iron and steel industry: A dynamic vector autoregression model. Appl. Energy 2016, 161, 375–386. [Google Scholar] [CrossRef]
  6. Kim, Y.; Worrell, E. International comparison of CO2 emission trends in the iron and steel industry. Energy Policy 2002, 30, 827–838. [Google Scholar] [CrossRef]
  7. National Development and Reform Commission of PRC. Notice of the General Office of the National Development and Reform Commission on Doing a Good Job in Starting the National Carbon Emissions Trading Market. Available online: https://www.ndrc.gov.cn/xxgk/zcfb/tz/201601/t20160122_963576.html (accessed on 22 January 2020).
  8. Riva, L.; Nielsen, H.K.; Skreiberg, Ø.; Wang, L.; Bartocci, P.; Barbanera, M.; Bidini, M.; Fantozzi, F. Analysis of optimal temperature, pressure and binder quantity for the production of biocarbon pellet to be used as a substitute for coke. Appl. Energy 2019, 256, 113933. [Google Scholar] [CrossRef]
  9. Van Beers, C.; Van Den Bergh, J.C. An empirical multi-country analysis of the impact of environmental regulations on foreign trade flows. Kyklos 1997, 50, 29–46. [Google Scholar] [CrossRef]
  10. Fowlie, M.L. Incomplete environmental regulation, imperfect competition, and emissions leakage. AEJ Appl. Econ. 2009, 1, 72–112. [Google Scholar] [CrossRef] [Green Version]
  11. Edenhofer, O.; Kalkuhl, M. When do increasing carbon taxes accelerate global warming? A note on the green paradox. Energy Policy 2011, 39, 2208–2212. [Google Scholar] [CrossRef]
  12. Grafton, R.Q.; Kompas, T.; Van Long, N. Substitution between biofuels and fossil fuels: Is there a green paradox? J. Environ. Econ. Manag. 2012, 64, 328–341. [Google Scholar] [CrossRef] [Green Version]
  13. Antweiler, W.; Copeland, B.R.; Taylor, M.S. Is free trade good for the environment? Am. Econ. Rev. 2001, 91, 877–908. [Google Scholar] [CrossRef] [Green Version]
  14. Cole, M.A.; Elliott, R.J.R.; Shimamoto, K. Industrial characteristics, environmental regulations and air pollution: An analysis of the UK manufacturing sector. J. Environ. Econ. Manag. 2005, 50, 121–143. [Google Scholar] [CrossRef]
  15. Ma, S.; Dai, J.; Wen, H. The influence of trade openness on the level of human capital in China: On the basis of environmental regulation. J. Clean. Prod. 2019, 225, 340–349. [Google Scholar] [CrossRef]
  16. Zhao, X.; Liu, C.; Yang, M. The effects of environmental regulation on China’s total factor productivity: An empirical study of carbon-intensive industries. J. Clean. Prod. 2018, 179, 325–334. [Google Scholar] [CrossRef]
  17. Kuai, P.; Yang, S.; Tao, A.; Zhang, S.A.; Khan, Z.D. Environmental effects of Chinese-style fiscal decentralization and the sustainability implications. J. Clean. Prod. 2019, 239, 118089. [Google Scholar] [CrossRef]
  18. Zhou, Q.; Zhang, X.; Shao, Q.; Wang, X. The non-linear effect of environmental regulation on haze pollution: Empirical evidence for 277 Chinese cities during 2002–2010. J. Environ. Manag. 2019, 248, 109274. [Google Scholar] [CrossRef] [PubMed]
  19. Zhao, X.; Yin, H.; Zhao, Y. Impact of environmental regulations on the efficiency and CO2 emissions of power plants in China. Appl. Energy 2015, 149, 238–247. [Google Scholar] [CrossRef]
  20. Sinn, H.W. Public policies against global warming: A supply side approach. Int. Tax Public Finance 2008, 15, 360–394. [Google Scholar] [CrossRef]
  21. van der Werf, E.; Di Maria, C. Imperfect environmental policy and polluting emissions: the green paradox and beyond. Int. Rev. Environ. Resour. Econ. 2012, 6, 153–194. [Google Scholar] [CrossRef] [Green Version]
  22. Grafton, R.Q.; Kompas, T.; Long, N.V. Biofuels Subsidies and the Green Paradox. CESifo Working Paper Series No. 2960. Available online: https://papers.ssrn.com/sol3/papers.cfm?abstract_id=1559747 (accessed on 29 January 2020).
  23. Van der Ploeg, F.; Withagen, C. Is there really a green paradox? J. Environ. Econ. Manag. 2012, 64, 342–363. [Google Scholar] [CrossRef] [Green Version]
  24. Zofío, J.L.; Prieto, A.M. Environmental efficiency and regulatory standards: the case of CO2 emissions from OECD industries. Resour. Energy Econ. 2001, 23, 63–83. [Google Scholar] [CrossRef]
  25. Carlsson, F.; Hammar, H. Incentive-based regulation of CO2 emissions from international aviation. J. Air Transp. Manag. 2002, 8, 365–372. [Google Scholar] [CrossRef]
  26. Michielsen, T.O. Brown backstops versus the green paradox. J. Environ. Econ. Manag. 2014, 68, 87–110. [Google Scholar] [CrossRef]
  27. Bauer, N.; McGlade, C.; Hilaire, J.; Ekins, P. Divestment prevails over the green paradox when anticipating strong future climate policies. Nat. Clim. Chang. 2018, 8, 130–134. [Google Scholar] [CrossRef]
  28. Ang, J.B. CO2 emissions, research and technology transfer in China. Ecol. Econom. 2009, 68, 2658–2665. [Google Scholar] [CrossRef] [Green Version]
  29. Zhang, H.; Wei, X.P. Green Public Opinion or Forced Reduction: The Dual Effect of Environmental Regulation on Carbon Emissions (In Chinese). China Popul. Resour. Environ. 2014, 24, 21–29. [Google Scholar]
  30. Yin, J.; Zheng, M.; Chen, J. The effects of environmental regulation and technical progress on CO2 Kuznets curve: An evidence from China. Energy Policy 2015, 77, 97–108. [Google Scholar] [CrossRef]
  31. He, X.G.; Zhang, Y.H. Influence factors and environmental Kuznets curve relink effect of Chinese industry’s carbon dioxide emission—Empirical research based on STIRPAT model with industrial dynamic panel data (In Chinese). China Ind. Econ. 2012, 1, 26–35. [Google Scholar]
  32. Wang, H.; Liu, H. Foreign direct investment, environmental regulation, and environmental pollution: An empirical study based on threshold effects for different Chinese regions. Environ. Sci. Pollut. Res. 2019, 26, 5394–5409. [Google Scholar] [CrossRef]
  33. Greenstone, M.; Hanna, R. Environmental regulations, air and water pollution, and infant mortality in India. Am. Econ. Rev. 2014, 104, 3038–3072. [Google Scholar] [CrossRef] [Green Version]
  34. Kheder, S.B.; Zugravu, N. Environmental regulation and French firms location abroad: An economic geography model in an international comparative study. Ecol. Econ. 2012, 77, 48–61. [Google Scholar] [CrossRef]
  35. Shen, J.; Wei, Y.D.; Yang, Z. The impact of environmental regulations on the location of pollution-intensive industries in China. J. Clean. Prod. 2017, 148, 785–794. [Google Scholar] [CrossRef]
  36. Li, L.; Liu, X.; Ge, J.; Chu, X.; Wang, J. Regional differences in spatial spillover and hysteresis effects: A theoretical and empirical study of environmental regulations on haze pollution in China. J. Clean. Prod. 2019, 230, 1096–1110. [Google Scholar] [CrossRef]
  37. Kampa, M.; Castanas, E. Human health effects of air pollution. Environ. Pollut. 2008, 151, 362–367. [Google Scholar] [CrossRef] [PubMed]
  38. Hashmi, R.; Alam, K. Dynamic relationship among environmental regulation, innovation, CO2 emissions, population, and economic growth in OECD countries: A panel investigation. J. Clean. Prod. 2019, 231, 1100–1109. [Google Scholar] [CrossRef]
  39. Wang, S.; Hao, J. Air quality management in China: Issues, challenges, and options. J. Environ. Sci. 2012, 24, 2–13. [Google Scholar] [CrossRef]
  40. Sheehan, P.; Cheng, E.; English, A.; Sun, F. China’s response to the air pollution shock. Nat. Clim. Chang. 2014, 4, 306–309. [Google Scholar] [CrossRef]
  41. Li, X.; Qiao, Y.; Shi, L. The aggregate effect of air pollution regulation on CO2 mitigation in China’s manufacturing industry: An econometric analysis. J. Clean. Prod. 2017, 142, 976–984. [Google Scholar] [CrossRef]
  42. Ramos, A.R.; Ferreira, J.C.E.; Kumar, V.; Garza-Reyes, J.A.; Cherrafi, A. A lean and cleaner production benchmarking method for sustainability assessment: A study of manufacturing companies in Brazil. J. Clean. Prod. 2018, 177, 218–231. [Google Scholar] [CrossRef]
  43. Porter, M.E.; Van der Linde, C. Toward a new conception of the environment-competitiveness relationship. J. Econ. Perspect. 1995, 9, 97–118. [Google Scholar] [CrossRef]
  44. Chan, H.K.; Yee, R.W.; Dai, J.; Lim, M.K. The moderating effect of environmental dynamism on green product innovation and performance. Int. J. Prod. Econ. 2016, 181, 384–391. [Google Scholar] [CrossRef]
  45. Zhao, X.; Zhao, Y.; Zeng, S.; Zhang, S. Corporate behavior and competitiveness: impact of environmental regulation on Chinese firms. J. Clean. Prod. 2015, 86, 311–322. [Google Scholar] [CrossRef]
  46. Popp, D. International innovation and diffusion of air pollution control technologies: the effects of NOX and SO2 regulation in the US, Japan, and Germany. J. Environ. Econ. Manag. 2006, 51, 46–71. [Google Scholar] [CrossRef] [Green Version]
  47. Li, W.; Wang, J.; Chen, R.; Xi, Y.; Liu, S.Q.; Wu, F.; Wu, X. Innovation-driven industrial green development: The moderating role of regional factors. J. Clean. Prod. 2019, 222, 344–354. [Google Scholar] [CrossRef]
  48. Oda, J.; Akimoto, K.; Sano, F.; Tomoda, T. Diffusion of energy efficient technologies and CO2 emission reductions in iron and steel sector. Energy Econ. 2007, 29, 868–888. [Google Scholar] [CrossRef]
  49. Zhang, Y.J.; Peng, Y.L.; Ma, C.Q.; Shen, B. Can environmental innovation facilitate carbon emissions reduction? Evidence from China. Energy Policy 2017, 100, 18–28. [Google Scholar] [CrossRef]
  50. Ji, Q.; Zhang, D. How much does financial development contribute to renewable energy growth and upgrading of energy structure in China? Energy Policy 2019, 128, 114–124. [Google Scholar] [CrossRef]
  51. Lee, M. Environmental regulation and production structure for the Korean iron and steel industry. Resour. Energy Econ. 2008, 30, 1–11. [Google Scholar] [CrossRef]
  52. Chang, Y.T.; Zhang, N.; Danao, D.; Zhang, N. Environmental efficiency analysis of transportation system in China: A non-radial DEA approach. Energy Policy 2013, 58, 277–283. [Google Scholar] [CrossRef]
  53. National Bureau of Statistics. National Real Estate Development Investment and Sales in 2016. Available online: http://www.stats.gov.cn/tjsj/zxfb/201701/t20170120_1455967.html (accessed on 21 January 2020).
  54. National Development and Reform Commission of PRC. Iron and Steel Industry Development Policy. Available online: https://www.ndrc.gov.cn/fggz/cyfz/zcyfz/200507/t20050719_1148472.html (accessed on 22 January 2020).
  55. Central People’s Government of PRC. Iron and Steel Industry Adjustment and Revitalization Plan. Available online: http://www.gov.cn/zhengce/content/2009-03/20/content_8122.htm (accessed on 22 January 2020).
  56. Liu, Y.; Li, Z.; Yin, X. The effects of three types of environmental regulation on energy consumption—Evidence from China. Environ. Sci. Pollut. Res. 2018, 25, 27334–27351. [Google Scholar] [CrossRef]
  57. Zhou, X.; Feng, C. The impact of environmental regulation on fossil energy consumption in China: Direct and indirect effects. J. Clean. Prod. 2017, 142, 3174–3183. [Google Scholar] [CrossRef]
  58. Wang, B.; Sun, Y.; Wang, Z. Agglomeration effect of CO2 emissions and emissions reduction effect of technology: A spatial econometric perspective based on China’s province-level data. J. Clean. Prod. 2018, 204, 96–106. [Google Scholar] [CrossRef]
  59. Hao, Y.; Deng, Y.; Lu, Z.N.; Chen, H. Is environmental regulation effective in China? Evidence from city-level panel data. J. Clean. Prod. 2018, 188, 966–976. [Google Scholar] [CrossRef]
  60. Feng, Z.; Chen, W. Environmental regulation, green innovation, and industrial green development: An empirical analysis based on the Spatial Durbin model. Sustainability 2018, 10, 223. [Google Scholar] [CrossRef] [Green Version]
  61. Liu, Y. Will International Trade Deteriorate Total Factor Energy Efficiency? Based on Empirical Analysis of 33 Industrial Sectors in China (In Chinese). China Popul. Resour. Environ. 2018, 28, 20–29. [Google Scholar]
  62. Pardo, N.; Moya, J.A. Prospective scenarios on energy efficiency and CO2 emissions in the European Iron & Steel industry. Energy 2013, 54, 113–128. [Google Scholar]
  63. Wang, K.; Tian, H.; Hua, S.; Zhu, C.; Gao, J.; Xue, Y.; Zhou, J. A comprehensive emission inventory of multiple air pollutants from iron and steel industry in China: Temporal trends and spatial variation characteristics. Sci. Total Environ. 2016, 559, 7–14. [Google Scholar] [CrossRef]
  64. Birol, F.; Keppler, J.H. Prices, technology development and the rebound effect. Energy Policy 2000, 28, 457–469. [Google Scholar] [CrossRef]
  65. Saygin, D.; Patel, M.K.; Worrell, E.; Tam, C.; Gielen, D.J. Potential of best practice technology to improve energy efficiency in the global chemical and petrochemical sector. Energy 2011, 36, 5779–5790. [Google Scholar] [CrossRef]
  66. Fang, C.; Wang, S.; Li, G. Changing urban forms and carbon dioxide emissions in China: A case study of 30 provincial capital cities. Appl. Energy 2015, 158, 519–531. [Google Scholar] [CrossRef]
  67. Zhu, X.; Zeng, A.; Zhong, M.; Huang, J.; Qu, H. Multiple impacts of environmental regulation on the steel industry in China: A recursive dynamic steel industry chain CGE analysis. J. Clean. Prod. 2019, 210, 490–504. [Google Scholar] [CrossRef]
  68. Du, W.; Li, M. Can environmental regulation promote the governance of excess capacity in China’s energy sector? The market exit of zombie enterprises. J. Clean. Prod. 2019, 207, 306–316. [Google Scholar] [CrossRef]
  69. Atkinson, R.D. Why the current education reform strategy won’t work: to improve innovation and boost the economy, the nation needs a fundamentally new approach to education in science, technology, engineering, and mathematics. Issues Sci. Technol. 2012, 6, 84–98. [Google Scholar]
Figure 1. Trends of CO2 Emissions and Environmental Regulations in the IS industry in 28 Provinces of China from 2000 to 2014.
Sustainability 12 01038 g001aSustainability 12 01038 g001b
Figure 2. Trends in environmental regulation intensity for the whole sample, eastern, central and western regions from 2000 to 2014.
Sustainability 12 01038 g002
Table 1. Descriptive statistics of data from 28 provinces in China from 2000 to 2014.
VariableDefinitionUnitMeanStd. dev.MinMax
CO2Per capita CO2 emissionsTce/person421.628300.2898.7733050.612
ersThe primary item of environmental regulation10047.77137.5002.5280.4
erssqThe quadratic term of environmental regulation10036.8500.7940.1786.2
pm2d5Smog emissions (PM2.5)m339.69315.4729.17384.5
eniEnergy intensityTce/104 CNY9.9335.5770.4542.092
popLabor population104 persons11.03210.5820.7461.95
capCapital stock108 CNY302.516338.7938.1201782.106
ecgconsEconomic growth104CNY/person10.9614.8613.47236.321
ens2Energy structure%31.89513.3111.38765.03
indIndustrialization%728.8891045.816138.8556573.081
urbUrbanization%47.35915.40913.88589.607
insIndustrial structure%124.66329.28427.334200.16
fdiTrade openness%34.12643.3153.573179.988
Notes: (1) The values of variables are all deflated based on the year 2000; (2) The sample size is 420.
Table 2. The results of the benchmark model.
(a) (b)(c) (d) (e) (f) (g)
DKnFE_rb1DK1FE_rb2DK2FEDK
ers1.110 **1.147 **1.147 ***1.022 *1.022 ***0.784 *0.784 ***
(2.35)(2.15)(3.74)(1.82)(3.81)(1.71)(3.72)
erssq−0.325 **−0.379 **−0.379 ***−0.337 *−0.337 ***−0.277 *−0.277 **
(−2.28)(−2.10)(−3.64)(−1.72)(−3.72)(−1.82)(−2.54)
pop −10.20−10.20 ***
(−1.68)(−7.03)
cap 0.266 *0.266 ***
(1.86)(6.67)
ecgcons 16.30 *16.30 **13.25*13.2517.11 **17.11 ***
(1.79)(2.34)(1.72)(1.65)(2.20)(3.12)
ens2 2.5142.514
(1.19)(1.57)
ind 0.07800.0780 **0.05500.0550
(0.60)(2.29)(0.54)(1.56)
urb 7.679 **7.679 **6.2916.291 **4.6204.620
(2.22)(2.50)(1.57)(2.25)(1.34)(1.75)
ins −0.0861−0.0861−0.893−0.893 ***
(−0.10)(−0.22)(−0.91)(−3.91)
fdi 3.214 *3.214 *
(1.83)(1.77)
_cons380.6 ***−161.5−161.5−104.1−104.1−98.57−98.57
(5.09)(−1.19)(−1.67)(−0.72)(−0.85)(−0.46)(−0.62)
N420420420420420420420
r20.00850.3560.3560.3650.3650.4160.416
Note: The t statistics are in parentheses, with *, **, and *** denoting significance at the 10%, 5%, and 1% levels respectively.
Table 3. The results of robustness checks.
Replace Environmental RegulationsReplace Control Variables
(a)(b)(c)(d)(e)(f)(g)(h)(i)(j)
er1er2er3ens2ind1ins1ens2_
ind1
ind1_
ins1
ens2_
ins1
ens1_
ind1_
ins1
ers 0.789***0.993***0.768***0.997***0.994***0.772***0.998***
(3.75)(5.03)(3.67)(5.07)(4.97)(3.70)(5.02)
erssq −0.278**−0.343***−0.265**−0.344***−0.331***−0.266**−0.333***
(−2.58)(−3.17)(−2.39)(−3.20)(−3.02)(−2.43)(−3.04)
pop−10.55***−14.32***−12.53***−10.23***−12.81***−9.243***−12.85***−11.66***−9.277***−11.70***
(−6.34)(−3.65)(−8.43)(−6.93)(−5.46)(−6.93)(−5.42)(−5.03)(−6.84)(−4.99)
cap0.243 ***0.224***0.213***0.267***0.235***0.253***0.235***0.226***0.253***0.227***
(5.30)(4.86)(5.05)(6.74)(6.22)(6.22)(6.29)(6.15)(6.28)(6.22)
ecgcons10.60**14.65**11.26 **17.18***11.00***15.45***11.03***10.18***15.52***10.22***
(2.78)(2.81)(2.16)(3.17)(4.64)(3.02)(4.68)(4.25)(3.07)(4.27)
urb3.3374.3493.5404.6275.594 *4.824 *5.594 *5.519*4.831 *5.519 *
(1.55)(1.57)(1.58)(1.76)(2.09)(1.79)(2.09)(2.04)(1.79)(2.05)
fdi2.3212.954 *3.962 **3.209 *2.7702.8622.7622.8332.8562.825
(1.70)(1.78)(2.40)(1.77)(1.55)(1.68)(1.54)(1.64)(1.68)(1.64)
er16.822 ***
(3.24)
er1sq−0.0793***
(−3.13)
er2 4.574***
(4.91)
er2sq −0.203***
(−3.72)
er3 1.737***
(3.57)
er3sq −0.030*
(−1.94)
ind0.146 **0.0642 **0.04730.0546 0.0636 * 0.0633 *
(2.20)(2.72)(1.17)(1.55) (1.92) (1.92)
ins−1.235***−0.971***−0.535**−0.892***−1.781*** −1.782***
(−6.20)(−3.73)(−2.35)(−3.91)(−5.48) (−5.51)
ens21.8632.448 *2.569 2.727 *2.471 2.743 *
(1.44)(1.84)(1.67) (1.89)(1.63) (1.86)
ens1 1.718 1.882* 1.6911.892 *
(1.57) (1.90) (1.62)(1.86)
ind1 −19.35*** −19.43***−23.97*** −24.05***
(−3.42) (−3.45)(−3.77) (−3.81)
ins1 −0.516 −9.264***−0.504−9.269***
(−0.28) (−5.02)(−0.28)(−5.06)
_cons16.60−62.24−42.38−102.2351.5−175.9348.6628.2 *−180.0625.5 *
(0.12)(−0.35)(−0.28)(−0.63)(1.49)(−0.87)(1.46)(2.06)(−0.88)(2.05)
N420420420420420420420420420420
F464.5878.5117.0161.4179.8349.5174.0167.7352.4161.4
r20.4270.4260.4320.41670.44130.41130.44210.44020.41180.4410
Note: The t statistics are in parentheses, with *, **, and *** denoting significance at the 10%, 5%, and 1% levels respectively.
Table 4. Heterogeneity analysis.
1. Sub-region2. Sub-sample
(a)(b)(c)(d)(e)(f)(g)(h)(i)
east_feeast_dkcentral_fecentral_dkwest_fewest_dkers_formerers_middleers_behind
ers1.182*1.182*−0.403−0.4031.185*1.185*1.082***−0.542−3.516***
(1.80)(1.99)(−1.40)(−1.72)(1.88)(1.98)(3.85)(−0.48)(−3.31)
erssq−0.492*−0.492**0.1530.153−0.124−0.124−0.333***0.4104.669***
(−2.13)(−2.30)(1.16)(1.47)(−0.43)(−0.40)(−3.08)(0.56)(3.38)
pop−9.926*−9.926**−23.78***−23.78***−29.44**−29.44**1.702−26.25***−11.56**
(−1.80)(−2.22)(−6.20)(−6.49)(−2.52)(−2.66)(0.69)(−4.96)(−2.85)
cap0.373***0.373***−0.323***−0.323***0.389***0.389***0.04790.3650.209**
(3.30)(4.38)(−3.30)(−4.19)(4.99)(6.84)(0.76)(1.58)(2.32)
ecgcons−1.392−1.39238.83***38.83***14.7814.78−0.83149.16***24.25**
(−0.22)(−0.43)(8.49)(11.99)(1.45)(1.40)(−0.16)(7.45)(2.47)
ens28.899**8.899**−0.257−0.2570.4250.4252.4433.965−0.450
(2.59)(2.86)(−0.36)(−0.44)(0.48)(0.52)(1.03)(1.50)(−0.66)
ind0.0983**0.0983*0.1000.1000.943**0.943*−0.0537*0.2370.807
(2.20)(2.10)(0.90)(0.94)(2.18)(2.00)(−1.84)(1.73)(1.67)
urb6.0596.0599.421***9.421***−0.591−0.59111.89***−3.035−2.915**
(1.41)(1.43)(5.20)(5.15)(−0.34)(−0.39)(3.30)(−0.70)(−2.82)
ins−3.966***−3.966***−0.763*−0.763*−2.129***−2.129***1.513***−2.962***−2.759***
(−3.14)(−5.52)(−1.92)(−1.87)(−3.86)(−3.80)(3.30)(−4.87)(−3.50)
fdi2.167*2.167*7.431***7.431***16.16***16.16***0.8981.2263.400
(1.78)(1.82)(4.77)(4.99)(3.39)(3.15)(1.26)(0.67)(0.79)
_cons−75.89−75.89−80.19−80.19*172.3172.3−611.9***184.8475.8***
(−0.26)(−0.24)(−1.36)(−1.81)(1.72)(1.73)(−3.79)(0.73)(6.27)
N150150120120150150150135135
F42.7058.451593.02798.4926.91055.91434.8196.92695.9
r20.49960.49960.77900.77900.57670.57670.49820.62150.7197
Note: The t statistics are in parentheses, with *, **, and *** denoting significance at the 10%, 5%, and 1% levels respectively.
Table 5. Results of synergistic effect and innovation effect.
Mechanism 1Mechanism 1Mechanism 2Mechanism 2
(a)(b)(c)(d)
pm2d5_ersCO2_pm2d5eni_ersCO2_eni
ers5.076 *** 9.869 ***
(2.81) (5.11)
erssq−1.924 * −2.968 ***
(−1.90) (−3.22)
pm2d5 0.378 **
(2.19)
eni 1.398 ***
(3.40)
pop−0.381 ***−19.40 ***0.112−17.87 ***
(−4.10)(−9.34)(1.13)(−7.83)
cap0.0334 ***0.194 ***−0.00864 ***0.221 ***
(16.40)(3.13)(−3.67)(3.77)
ecgcons0.864 ***1.469−0.367 **4.541
(6.80)(0.38)(−2.20)(1.47)
ens−0.05603.327 ***0.01613.451 ***
(−1.08)(8.47)(0.51)(11.32)
ind−0.003600.06220.00188 *0.0369
(−0.63)(1.42)(1.70)(1.38)
urb−0.183 **−0.8880.0638−1.278 **
(−2.12)(−1.12)(1.55)(−2.14)
ins−0.0695 ***−0.4040.0195−0.693 **
(−3.44)(−1.24)(1.45)(−2.22)
fdi−0.05251.336−0.0539 *0.206
(−1.11)(1.50)(−1.66)(0.34)
year−0.965 ***25.14 ***0.304 ***30.26 ***
(−5.41)(6.86)(2.67)(9.73)
_cons0−50532.0 ***−605.9 ***−60945.6 ***
(.)(−6.91)(−2.68)(−9.77)
N420420420420
Wald225681.06 ***440.30 ***79532.21 ***859.48 ***
Note: The t statistics are in parentheses, with *, **, and *** denoting significance at the 10%, 5%, and 1% levels respectively.

